Sample Category Title
WTI Oil Outlook: Oil Prices Slump on Renewed Demand Worries
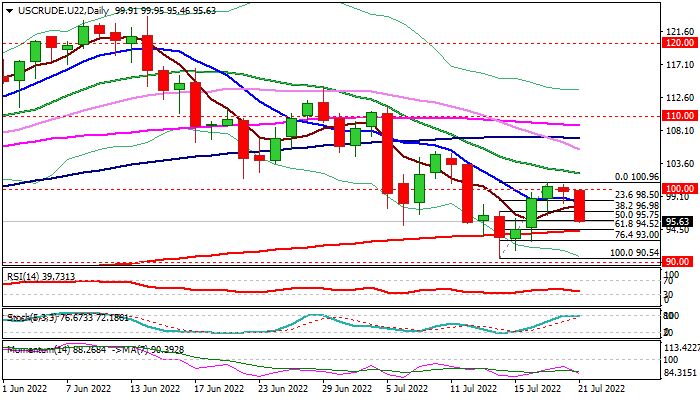
WTI oil price accelerates lower in European trading on Thursday (down 3.3% since Asian opening last night), after three-day recovery failed to sustain break above psychological $100 barrier.
Oil prices came under pressure from renewed demand worries on rising US gasoline stocks, gas flow through Nord Stream 1 pipeline resumed after a maintenance and Libya resumed production from several oilfields.
Traders are also concerned about the ECB joining other major central banks in raising interest rates to fight soaring inflation, as higher borrowing cost is likely to significantly hurt economic growth and consequently affect demand.
Fresh weakness already retraced 50% of $90.54/$100.96 recovery leg and signal that corrective phase is likely over.
Bears need extension through key supports at $94.52/$94.31 (Fibo 61.8% / 200DMA) confirm reversal and open way for another probe through key supports at $92.92/$92.64 (Mar/Apr higher base) after last week’s break lower failed to register close below these levels and generate fresh bearish signal.
Bearish daily studies add to weak fundamentals and support near-term action.
Res: 96.50; 96.98; 97.83; 98.50.
Sup: 95.00; 94.52; 94.31; 93.00.
XAU/USD Outlook: Gold Cracks Key Support, Pressured by Signals of More Aggressive Major Central Banks
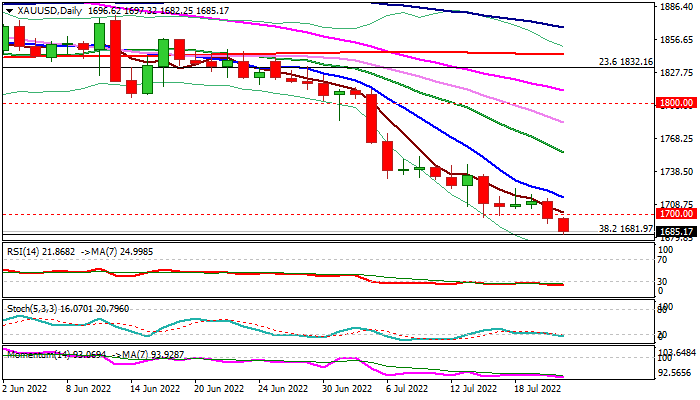
Spot gold extends weakness into second day as larger downtrend resumed after three-day consolidation and hit the lowest in one year on Thursday.
The metal came under increased pressure on signals that major central banks are likely to start more aggressive approach to tightening their monetary policies that would further hurt demand for the yellow metal.
Fresh bears crack important supports at $1690 zone (Fibo 38.2% of larger $1046/$2074 ascend / Mar-Aug 2021 higher base), break of which is expected to generate strong bearish signal on confirmation of a double-top ($2074/$2070).
Rising negative momentum and MA’s in full bearish setup on daily chart, strongly support the action, with little impact seen so far from oversold conditions, but bears may face headwinds at this zone.
Broken psychological $1700 support reverted to resistance, followed by falling 10DMA ($1715) which should ideally limit upticks and offer better selling opportunities.
Final break of $1680 zone pivot would risk acceleration towards $1655 (200WMA), $1600/$1594 (round-figure / 55MMA) and $1560 (50% retracement of $1046/$2074) in extension.
Res: 1700; 1715; 1723; 1736.
Sup: 1676; 1655; 1608; 1594.
USD/JPY Outlook: Dollar Bulls Retake Control for Final Attack at 140 Target
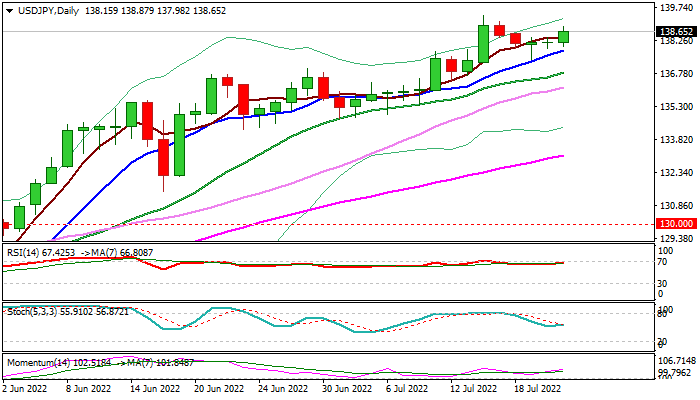
The USDJPY rises on Thursday, confirming reversal signaled by a hammer candle on Tuesday, after Wednesday’s Doji questioned fresh bulls.
Bounce from correction low at 137.38 so far retraced over 61.8% of a shallow 139.39/137.38 pullback, signaling that bulls regained control and will look for a continuation of larger uptrend.
The action remains tracked by a rising 10DMA (137.83), adding to bullish daily studies (rising bullish momentum / MA’s in positive setup), preparing ground for stronger acceleration and test of targets at 139.92/140.00 (Sep 1998 high/psychological) violation of which would open way for further advance.
Res: 138.91; 139.39; 139.92; 140.00.
Sup: 138.38; 137.83; 137.38; 136.79.
Musk Has Clipped the Wings of Bitcoin
How long does forever last? Just over a year, if you’re Elon Musk. Tesla has indicated in its quarterly report that it has sold three-quarters of its Bitcoins, citing uncertainty. The past selling does not change the market disposition, as all transactions have already been made. However, investor sentiment is perhaps the main driver in this market, where a mathematical algorithm governs issuance.
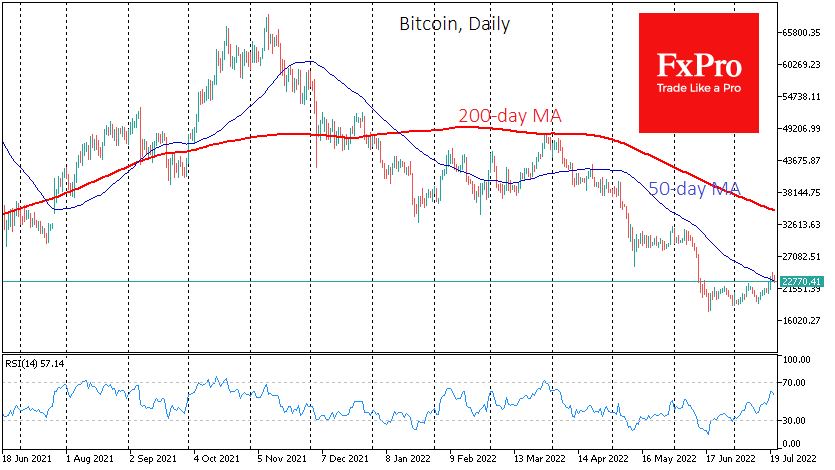
And this sentiment has been hit at a rather crucial moment. As a result of short-term investors’ frustration, BTCUSD failed to break away from its 50-day moving average. The price stabilised at 23000 at the time of writing, hovering around this trendline. Failure to cross this line in a sharp move is a bearish signal. The closest development would be Bitcoin’s return to the local support area at 19000.
Ethereum has lost 5.7% in the past 24 hours, to $1480. Leading altcoins have fallen even further, from -4% (Dogecoin) to 11% (Solana). Total crypto market capitalisation fell 3.6% to $1.03 trillion, according to CoinMarketCap.
According to CoinShares, capital inflows into crypto funds last week were $12.2m, with $14.8m coming into the funds on bitcoin shorts. Regular bitcoin products saw a net outflow of $2.6m.
The fall of the crypto market was caused by “greed, ignorance and misguided risk management”, Galaxy Digital CEO Mike Novogratz said. He noted the collapse of the Terra ecosystem, which was the trigger for the subsequent problems of Celsius Network, Voyager Digital and Three Arrows Capital.
A bipartisan bill to regulate the crypto industry in the US could pass as a full-fledged document in 2023, Wyoming Senator Cynthia Lummis said. She said that some lawmakers would need more time to handle the topic.
SEC chief Gary Gensler said the crisis in the crypto market would require a reworking of investor protection laws.
GBP/JPY Daily Outlook
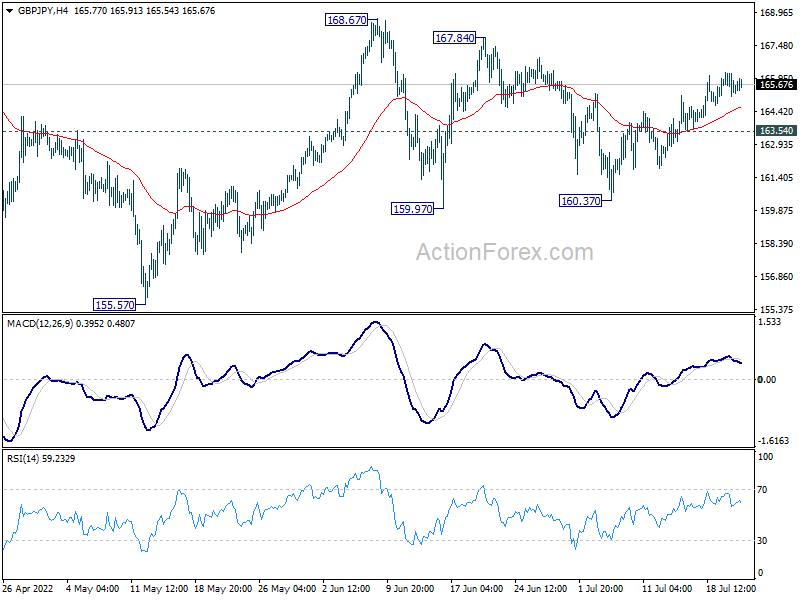
Daily Pivots: (S1) 165.10; (P) 165.68; (R1) 166.21; More...
Further rise is mildly in favor in GBP/JPY with 163.54 minor support intact. Consolidation from 168.67 should have completed with three waves to 160.37. Further rally should be seen to retest 168.67 high. Firm break there will resume larger up trend. On the downside, below 163.54 minor support will dampen this bullish view and turn bias back to the downside for 160.37 support instead.
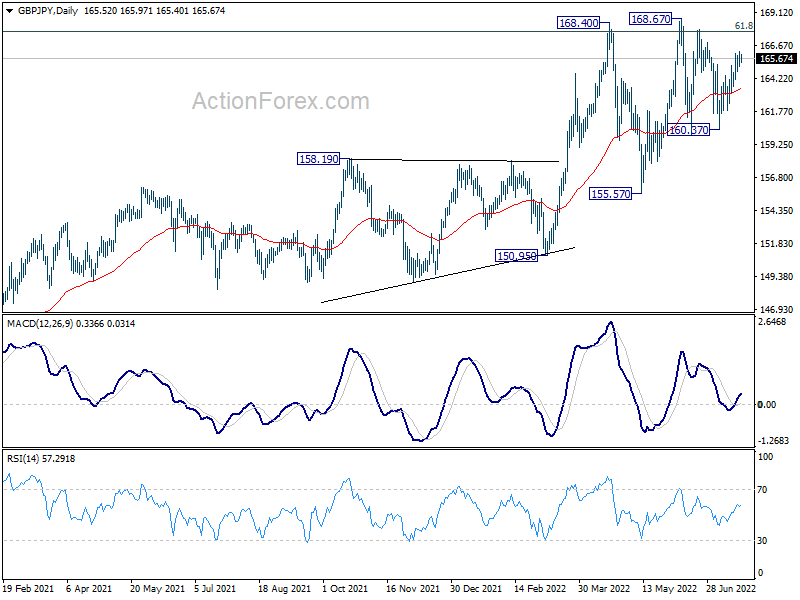
In the bigger picture, up trend from 123.94 (2020 low) is still in progress. Sustained break of 61.8% retracement of 195.86 (2015 high) to 122.75 (2016 low) at 167.93 will be a long term bullish signal, and could pave the way back to 195.86 high. This will now remain the favored case as long as 155.57 support holds, even in case of deep pull back.
EUR/JPY Daily Outlook
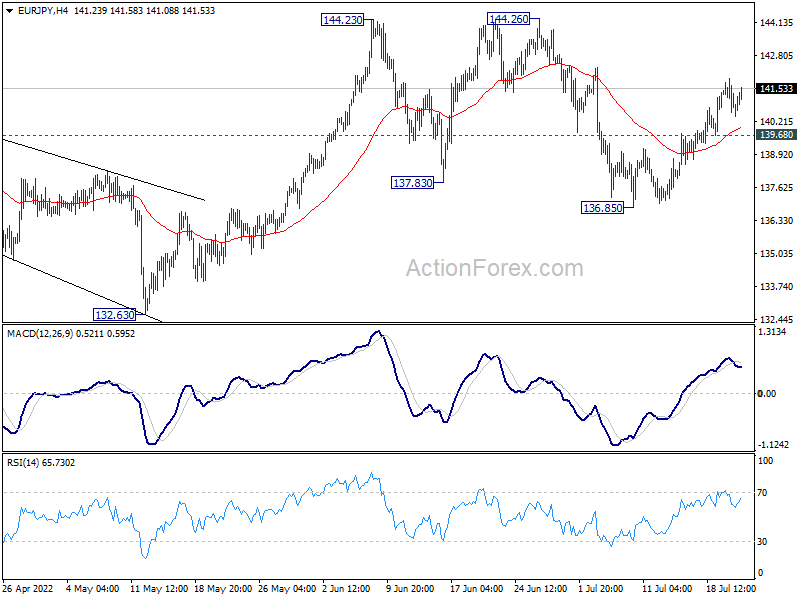
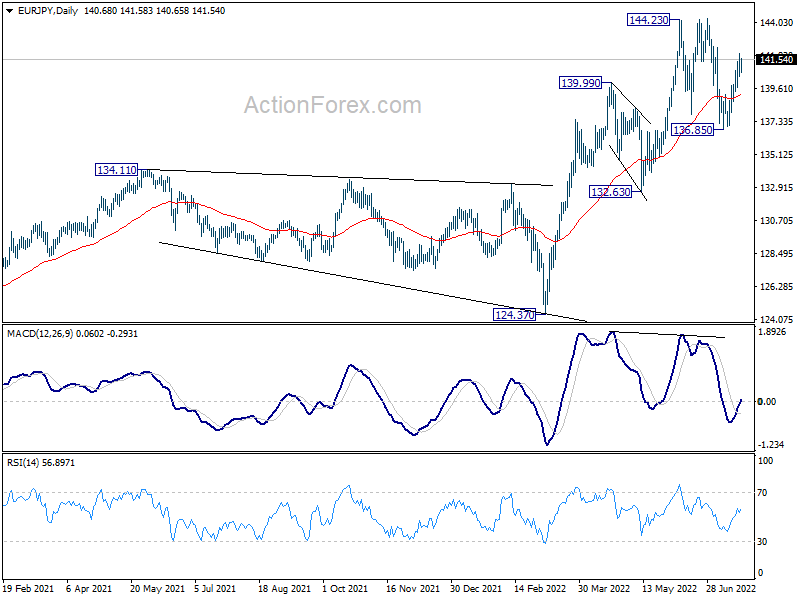
Daily Pivots: (S1) 140.15; (P) 141.04; (R1) 141.65; More....
Further rise is still in favor in EUR/JPY with 139.68 minor support intact. Consolidation pattern from 144.23 should have completed with three waves to 136.85. Further rally should be seen to retest 144.26 resistance first. Firm break there will resume larger up trend. On the downside, below 139.68 minor support will dampen this bullish view and bring retest of 136.85 instead.
In the bigger picture, up trend from 114.42 (2020 low) is seen as the third leg of the pattern from 109.30 (2016 low). Further rally is in favor as long as 134.11 resistance turned support holds, even in case of deep pull back. Firm break of 139.78 will target 149.76 (2015 high. However, sustained break of 134.11 will be a sign of medium term bearish reversal and turn focus to 124.37 support for confirmation.
EUR/GBP Daily Outlook
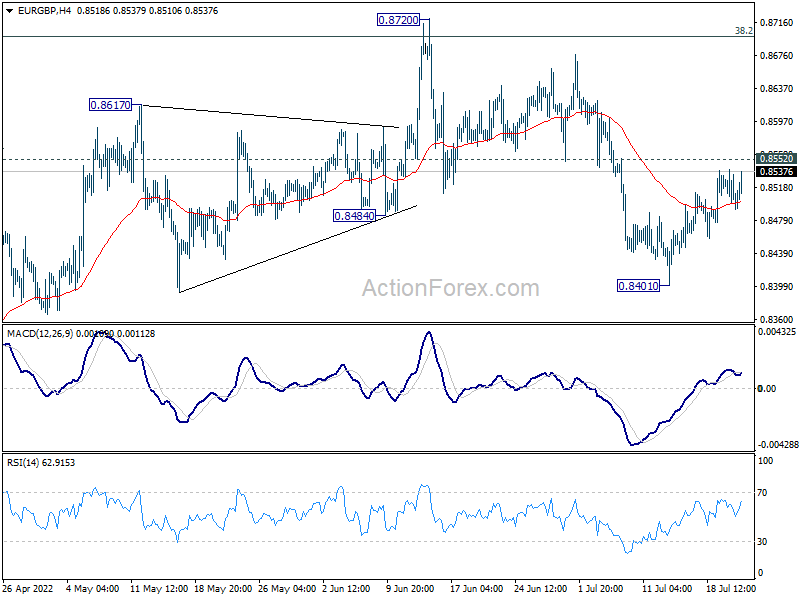
Daily Pivots: (S1) 0.8481; (P) 0.8510; (R1) 0.8528; More...
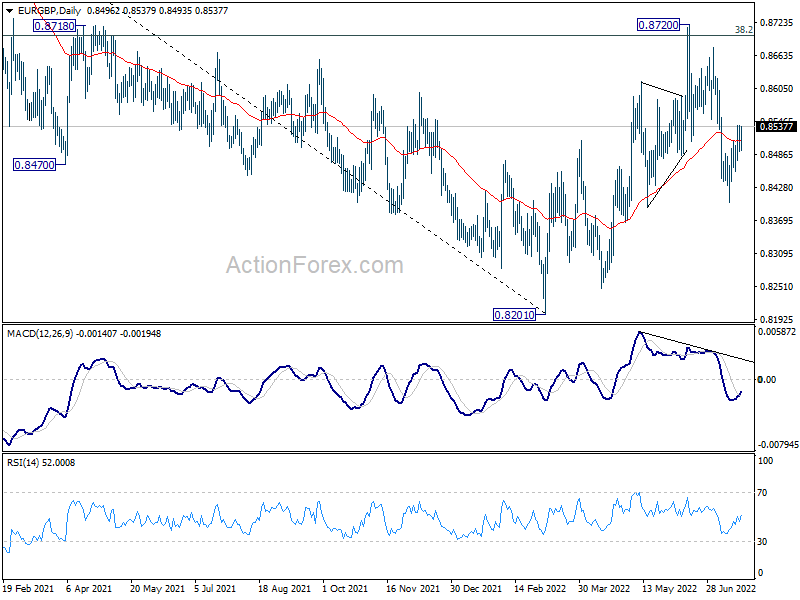
Intraday bias in EUR/GBP remains neutral first. On the upside break of 0.8552 resistance will suggest that pull back from 0.8720 has completed. That will also also revive near term bullishness. Further rise should be seen to retest 0.8720 high. On the downside, break of 0.8401 will reaffirm rejection by 0.8697 medium term fibonacci level and target 0.8201/48 support zone next.
In the bigger picture, rejection by 38.2% retracement of 0.9499 to 0.8201 at 0.8697 argues that rebound from 0.8201 is merely a corrective move. That is, down trend from 0.9499 (2020 high) is now over. Sustained break of 0.8201 will resume such decline and target 61.8% retracement of 0.6935 to 0.9499 at 0.7917. This will now remain the favored case as long as 0.8720 resistance holds.
EUR/AUD Daily Outlook
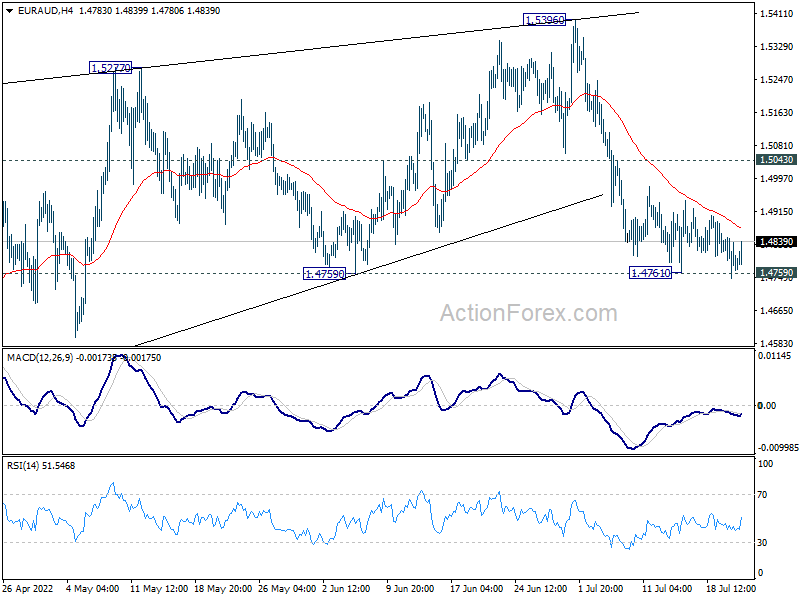
Daily Pivots: (S1) 1.4737; (P) 1.4794; (R1) 1.4836; More...
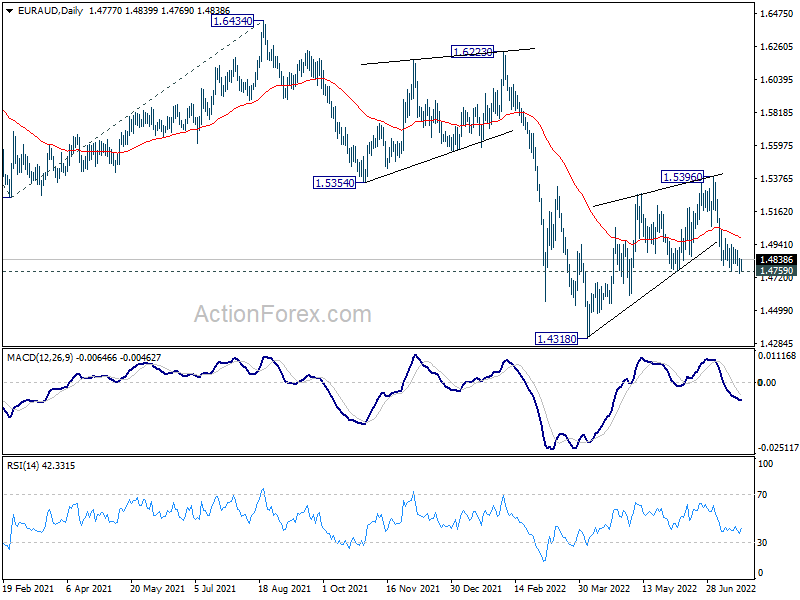
Intraday bias in EUR/AUD stays neutral at this point. On the downside, decisive break of 1.4759 support should confirm that corrective rise from 1.4318 has completed at 1.5396 after rejection by 1.5354 support turned resistance. Deeper fall should then be seen back to retest 1.4318 low. On the upside, however, break of 1.5043 will bring stronger rebound back towards 1.5396.
In the bigger picture, rejection by 1.5354 support turned resistance, as well as 55 week EMA (now at 1.5378), maintain medium term bearishness. That is, larger down trend from 1.9799 is not completed yet. Break of 1.4318 low will target 61.8% projection of 1.9799 to 1.5250 from 1.6434 at 1.3623, which is close to 1.3624 long term support (2017 low). This will remain the favored case now as long as 1.5396 resistance holds.
EUR/CHF Daily Outlook
Daily Pivots: (S1) 0.9863; (P) 0.9904; (R1) 0.9931; More....
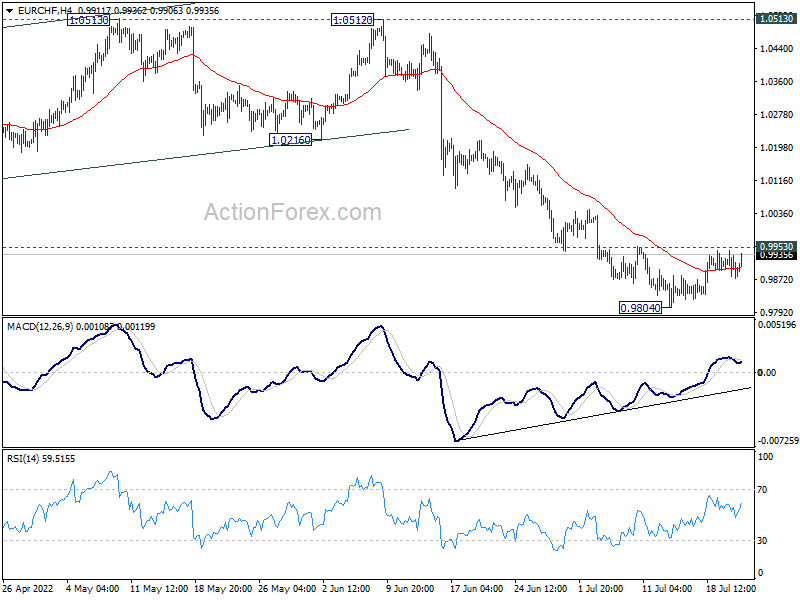
EUR/CHF is still staying in range below 0.9953 minor resistance. Intraday bias remains neutral first. On the upside, break of 0.9953 minor resistance will suggest short term bottoming at 0.9804, on bullish convergence condition in 4 hour MACD. Intraday bias will be back on the upside for 55 day EMA (now at 1.0110). On the downside, break of 0.9804 will resume larger down trend to 0.9650 long term projection level.
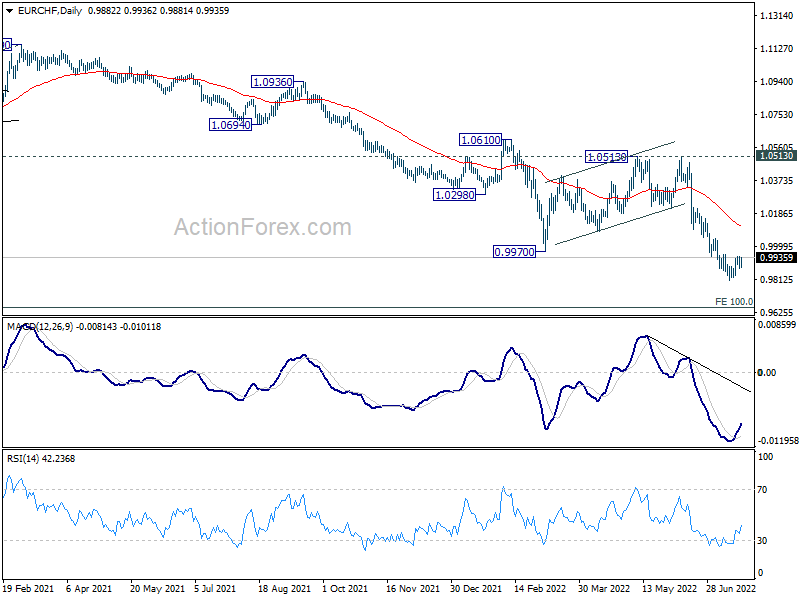
In the bigger picture,long term down trend from 1.2004 (2018 high) is expected to target 100% projection of 1.2004 to 1.0505 to 1.1149 at 0.9650. On the upside, break of 1.0513 resistance is needed to indicate medium term bottoming. Otherwise, outlook will stay bearish in case of strong rebound.
EURCHF Flags Bullish Trend Reversal ahead of ECB
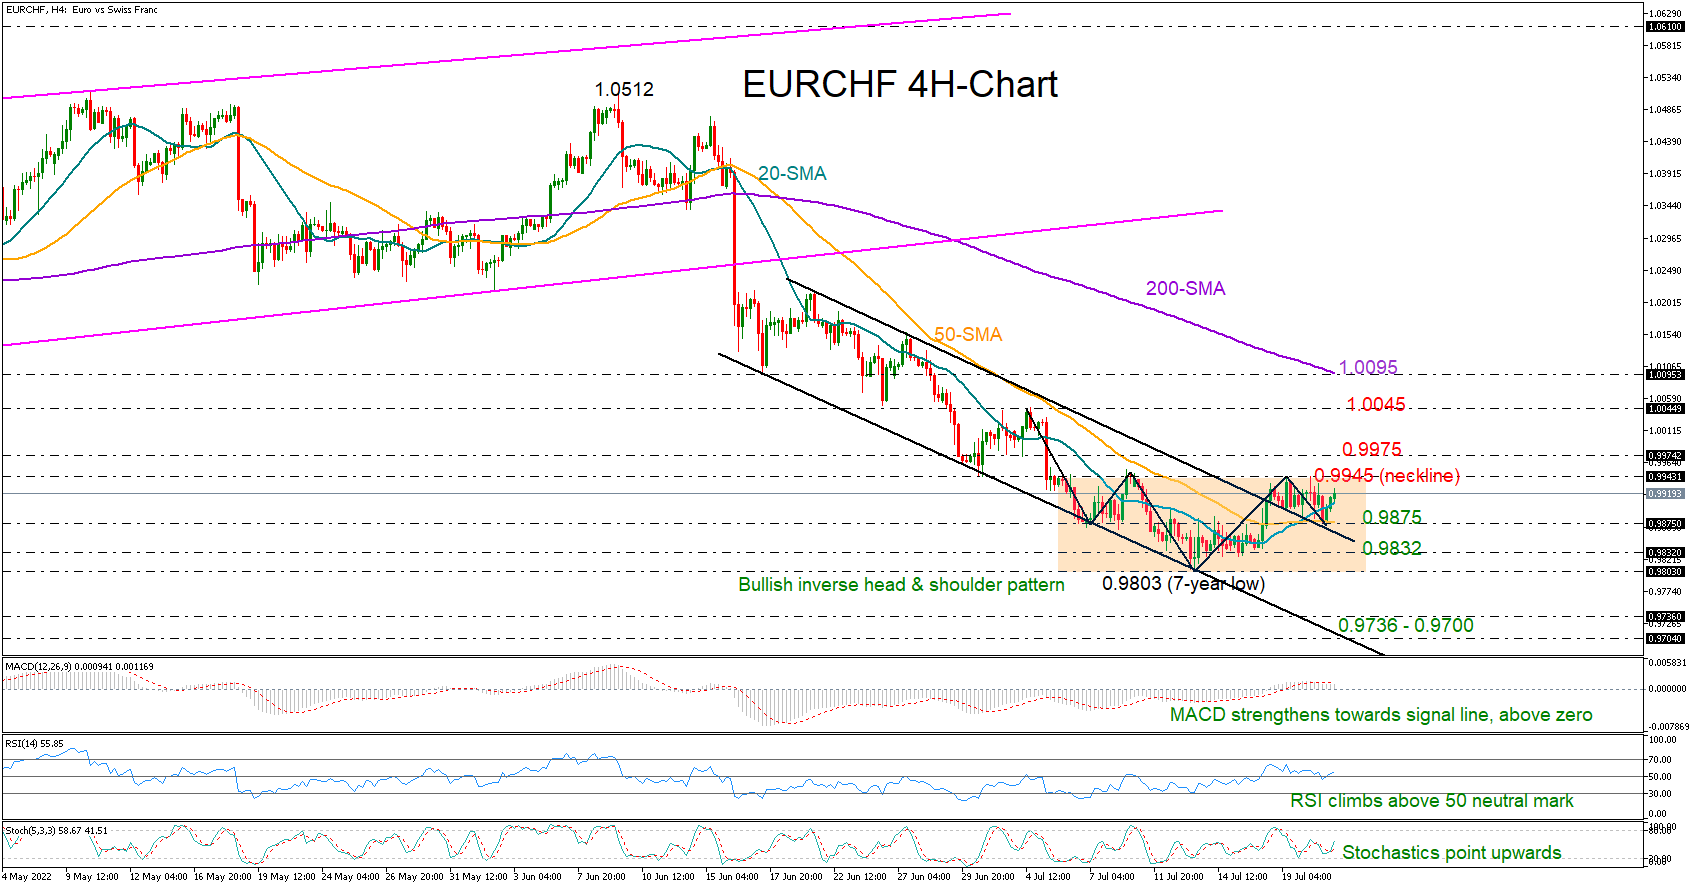
EURCHF pivoted northwards to re-enter the 0.9900 territory after its latest pullback in the four-hour chart ceased near the 50-period simple moving average (SMA) at 0.9870.
There are a couple of bullish signs, which feed optimism that the current recovery mood could persist in the coming sessions. The RSI has bounced back above its 50 neutral mark, the stochastics have resumed their upward slope, while the MACD, although beneath its red signal line, seems to be gaining positive momentum.
Trend signals are also rosy. Besides the bullish cross between the 20- and 50-period simple moving averages (SMAs) and the rebound on the penetrated bearish channel, investors will closely monitor the formation of a bullish inverse head and shoulder pattern set around the seven-year low of 0.9803. To confirm the bullish pattern, the pair will need to successfully violate the neckline at 0.9945. If that turns out to be the case, the price could initially test the limits around 0.9975 before speeding up to July’s high of 1.0045. Beyond that, the next target will be the 200-period SMA at 1.0093.
Should the bears retake control, they will first attempt to breach the 50-period SMA at 0.9875 with scope to access the 0.9832 – 0.9803 support zone. A durable move below the latter would open the door for the key 0.9736 – 0.9700 area, where the channel's lower boundary and the 2015 base are placed. Lower, all attention will turn to the 2015 bottom of 0.9649.
In brief, EURCHF is surrounded by positive vibes in the short-term picture. A sustainable rally above the threshold of 0.9945 is expected to attract new buying interest in the market.