Sample Category Title
ECB’s TPI isn’t ‘That’ Straightforward, and Snap Earnings Could Reverse Appetite in US Big Tech
The European Central Bank (ECB) rose its three policy rates by 50bp at yesterday’s monetary policy meeting, versus 25bp expected by analysts. But the ECB decision wasn’t a big surprise given that many investors were expecting to see the ECB to come up with a bigger rate hike after the EURUSD fell below parity last week.
Euro below parity against the US dollar makes things even more complicated for the ECB’s fight against inflation, and shifts the ECB’s rhetoric from Mario Draghi’s ‘whatever it takes’ to something like ‘whatever… we can’. Even Mario Draghi’s resignation, the dissolution of the Italian government and the spike in the Italian yields didn’t change the ECB’s decision. We saw a determined ECB to tame inflation down to the 2% policy target.
One of the major highlights of yesterday’s ECB decision was the anti-fragmentation tool, TPI, transmission protection instrument. The name is fancy but what it could do to help the ECB is unsure for now, as the eligibility to the TPI sounds complicated - so complicated in fact that during her press conference yesterday, Christine Lagarde repeated ‘no, no it’s not that complicated’ several times when she answered questions.
In… simple, there is a set of fiscal and macro conditions that will determine whether a euro zone country is eligible to the TPI program. However, the neediest economies may not be eligible due to fiscal and macroeconomic restrictions.
The complicated TPI tool is perhaps why the euro and the European stocks gave back the early gains yesterday. The EURUSD flirted with 1.0280 mark but is back below the 1.02 this morning. Investors will likely give the ECB the benefit of doubt, but the euro will remain under a meaningful negative pressure until we see the higher ECB rates translate into lower inflation.
With the ECB shifting to rate-tightening phase, we have no more than Switzerland and Japan left in the negative rate territory. The Swiss National Bank (SNB) already surprised the market with a 50bp hike in its last meeting and pledged to do more, but the Bank of Japan (BoJ) maintained its policy unchanged yesterday, and said it has ‘absolutely no plan’ to raise the interest rates. Happily, the US dollar was softer yesterday, so that the USDJPY remained capped around the 138 level. Yet, the divergence between a more hawkish shift worldwide, and the insistently dovish BoJ should continue playing against the yen in the medium run.
Summer vacation for the US stocks?
The US dollar was softer yesterday, and the barrel of American crude slipped again below the $100 mark. The idea that lower energy prices will ease the inflationary pressures gave an additional boost to the US stocks, even though the US jobless claims climbed to the highest levels since last November. If the jobless claims data is volatile, it’s also an early sign that a labour market shift could happen. Especially, when the data is combined to the latest news of jobs cuts.
After Apple earlier this week, Microsoft announced it will slow hiring in its security software unit and Azure cloud business in the foreseeable future. 7-Eleven also said it will cut around 880 jobs, and Snap announced it will slow its rate of hiring ‘substantially’, as well. Therefore, the next jobs figures may not be as enchanting as the latest ones. But for now, the US stocks extend recovery. The S&P500 gained 1% for the third straight day, as Nasdaq jumped 1.36%. The stronger-than-expected earnings from Netflix and Tesla helped improving the market mood this week. Tesla, for example, jumped near 10% posterior to earnings announcement.
Snap, however, hasn’t been that lucky, as its share price dived more than 26% in the afterhours trading after the company missed estimates on a major slowdown in the ad industry due to economic jitters. The Snap results came as a warning for other Big Tech names that rely on ad revenue. Therefore, FAANG stocks, which recovered to an almost 2-month high yesterday, may not extend gains to the weekly close as the latest Snap results could reverse appetite for at least a couple of them, including Google and Meta before the closing bell.
The End of a Messy Week
Volatility was the winner overnight, with a multitude of data points and events leaving market price action messier than a teenager's bedroom. The European Central Bank surprised markets by lifting policy rates by 0.50%, ending over a decade of negative interest rates. The Euro has already been rallying, but its gains were tempered by the collapse of the Italian government, and post the ECB meeting, German/Italian bond spreads started widening noticeably. The ECB’s Lagarde said policy decisions would be made on a meeting-by-meeting basis going forward, tossing their forward guidance out.
Perhaps more importantly, Russian gas started flowing back down the Nord Stream 1 gas pipeline yesterday, albeit at flows resembling the 40% of capacity before it closed for maintenance. Still, when it comes to Europe and energy, any news is good news as fears had risen that Russia would leave it turned off. EUR/USD had already started rallying on this news, which was likely the major reason that oil prices fell overnight in another 5.0% intra-day range session. European equities were far more mixed, with some stark winners and losers. For that, we can thank the Italian political situation, widening North/South bond spreads, and the ECB’s 0.50% rate hike.
In the US, a multi-month high for US Initial Jobless Claims and a soft Philly Fed Business Conditions Index spooked bond markets and saw US yields move quite a bit lower overnight. The US curve now looks bowl-shaped after US 10-years fell by over 15 basis points. That saw the US Dollar weaken as well, as US recession fears also ramped up. I must say, Initial Jobless Claims rising by 7,000 to 251,000 does seem like clasping at straws.
Wall Street liked what they saw, rallying powerfully once again overnight. Lower bond yields and some solid earnings results keep sentiment perky during the main session. That has changed a bit after hours after weak Snap. Inc results saw their stock price plummet by 25%. That dragged down the other social media-esque giants. As Meta found out earlier in the year, markets will severely punish richly valued tech stocks at the first sign of trouble, and there is now some risk to the broader equity markets from the FAANGS yet to report.
This morning, we have seen Australian and Japanese Manufacturing and Service PMIs come in on the soft side, along with Japanese Inflation, which edged lower in June YoY to 2.40%. We have a bunch of S&P Global PMIs still to come for the European heavyweights, the Eurozone, and the US today. It looks like they will all have downside risks for obvious reasons, but I am not sure it will be enough to deter the FOMO gnomes of Wall Street.
I will be covering my last FOMC meeting next week, and it seems likely that this will be the defining moment for markets in what has been a tumultuous month. 0.75% or 1.0% I know not, although my gut says 0.75%. The statement will be crucial and, depending on how it plays out, could stop what I consider a bear market rally, in its tracks. Inflation remains and will remain stubbornly high, geopolitical risk abounds, growth is slowing around the world, and recession risks are rising. I can’t see how that is a productive environment for equities, and that’s before the rest of big-tech reports quarterly earnings.
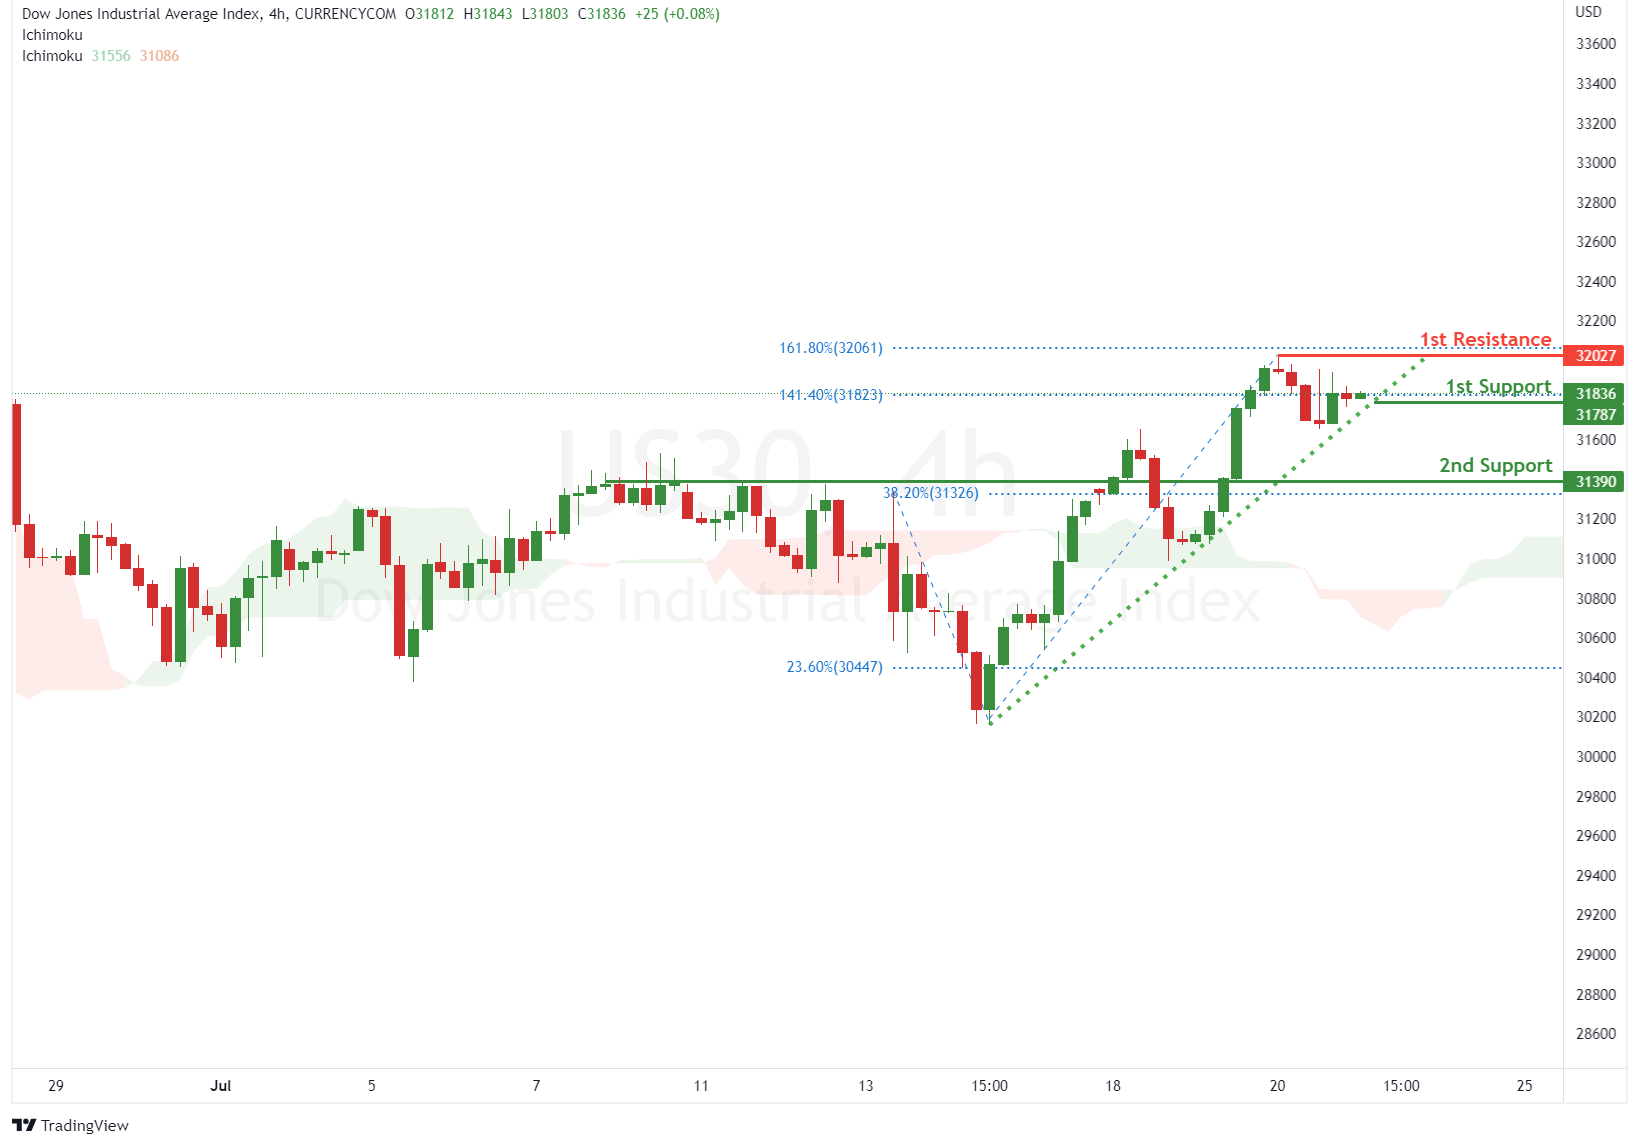
That said, the technical pictures across the equity and currency space suggest we have more room for a further retracement. AUD/USD and NZD/USD have broken up out of falling wedges, with GBP/USD about to do so. The S&P 500 is approaching resistance at 4,020.00, as is the Dow right here at 32,030.00, although the Nasdaq’s lies far away still at 13,500.00. Failure of 106.40 by the dollar index will signal a much deeper correction lower, and the slump in US yields overnight is setting up USD/JPY for a serious culling of long positions.
Two warning signs remain for me. One is that the US Dollar moves lower has all but passed the Asia FX space buy. Most USD/Asia pairs remain at or near recent highs, which in some cases, are record highs. We likely need to see a much bigger fall in US yields and/or oil prices to change that. I can’t see the Fed being so happy to see the US yield curve slump at this stage in the process, though. The second is gold. Gold’s price performance has been appalling in July, remaining at multi-month lows no matter whether the US Dollar or US yields have rallied or fallen. The US Dollar usually rallies during a recession, part of the “dollar smile” complex. Gold seems to be telling us that we call “peak dollar” at our peril.
One news event that may lift sentiment in Asia today is an announcement by Turkish officials overnight, saying that an agreement to resume Black Sea grain exports from Ukrainian ports will be signed at some stage today. Fingers crossed on that one.
Happy Friday, everybody.
Asian markets are content to follow Wall Street higher.
Asian markets are mostly higher today, content to follow Wall Street’s overnight rally. The Snap after-market results are tempering US futures, taking the sheen of Asia’s rallies today. The fall of oil prices overnight is also supportive of Asian markets, although weekend event risk may also be staying investors' hands.
On Wall Street, the S&P 500 finished 0.99% higher, the Nasdaq jumped by 1.36%, with the Dow Jones rose by 0.51%. In Asia, the Snap results have seen tech companies come under some pressure, pushing US futures lower. S&P 500 futures have fallen by 0.40% lower, Nasdaq futures are off 0.65%, with Dow futures down 0.20%.
In Asia, Japan’s Nikkei 225 is 0.20% higher, but South Korea’s Kospi has fallen by 0.40%. In China, the Shanghai Composite has gained 0.35%, while the CSI 300 has climbed by 0.55%, and Hong Kong has risen by 0.60%.
Singapore is 0.70% higher in regional markets, with Taipei edging 0.15% higher. Jakarta has added 0.10%, Kuala Lumpur by 0.37%, Bangkok by 0.30%, and Manila is unchanged. Australian markets are also relatively subdued, the All Ordinaries have risen by just 0.10%, and the ASX 200 is unchanged.
European markets had a very mixed day, with a resumption of gas flows from Russia offset by the surprise 0.50% rate hike by the ECB and Italian political chaos, although given that has been the natural state of affairs since 1945, we should be used to it. The widening of German/Italian bond spreads was more troublesome, and the ECB may need to roll out that fragmentation tool sooner than later. With weekend event risk ahead, and the reality of gas flows resuming at reduced rates, Italian politics, and the decade of ECB negative interest rates being over, it is hard to see European equities finishing the day on a high note.
US Dollar falls overnight.
The US Dollar resumed its correction lower overnight as the Euro rose on renewed Russian gas flows, US yields fell, and investor sentiment rose in the equity space. The dollar index fell by 0.40% to 106.60 overnight, although heightened nerves in the equity space today have seen it rise by 0.23% to 108.84. The 106.40 area was tested for the 4th time overnight and now looms as a critical inflexion point. Failure signals more losses towards 1.0500 and 1.0350. Resistance is at 107.30 and 108.00.
EUR/USD traded in a wide range overnight, bounced around by Russian gas, Italy, and the ECB. In the end, it had onto much of its gaseous gains, finishing 0.50% higher at 1.0230. The first sign of trouble in US stock futures has prompted a US Dollar rally in Asia, which doesn’t bode well for the single currency. EUR/USD has fallen 0.32% to 1.0197 as a result. It has resistance at 1.0275, but only a sustained break above 1.0360 would suggest a longer-term low is in place. EUR/USD has support at 1.0150 and 1.0100.
GBP/USD closed almost unchanged overnight at 1.2000, having spiked to a low of 1.1900 intraday. In Asia, the dollar rebound sees GBP/USD easing 0.25% to 1.1975. Sterling has support at 1.1900 and 1.1800, with resistance at 1.2060 and 1.2200. A rise above the 1.2060 wedge formation signals a larger rally to the 1.2400 regions, but it would take a sustained break above 1.2400 to call for a longer-term low by sterling. Its fate is probably tied to EUR/USD’s direction today.
Lower US yields across the curve saw the Japanese Yen emerge a winner overnight as the US/Japan rate differential narrowed, with the street still long to the eyeballs of USD/JPY. USD/JPY finished 0.65% lower at 137.35 overnight, rising slightly to 137.55 in Asia. A loss of 137.00 could set off a deeper correction to 135.50 initially. Initial resistance is distantt at 139.00, followed by 139.40. The US/Japan rate differential continues to hold USD/JPY in its thrall.
AUD/USD and NZD/USD rose overnight, falling 0.20% and 0.35% to 0.6920 and 0.6230 on US Dollar strength in an inconclusive Asian session this morning. They continue consolidating their respective topside wedge breakouts. Only a move back below either 0.6800 or 0.6150 changes the short-term bullish technical outlook.
Bank Indonesia surprised markets by holding rates unchanged yesterday, and unsurprisingly, USD/IDR is above 15,000.00 at 15,015.00 this morning. Asian currencies were a mixed bag overnight, without any strong directional moves. The US Dollar correction continues to pass the Asia FX space by, with regional currencies remaining at, or near, recent lows versus the greenback. We may need to wait for the FOMC outcome next week to see another directional move.
Oil prices fall overnight.
Brent crude and WTI had another session of 5.0% intraday ranges overnight, closing quite a bit lower than their opening levels. Global recession fears and the resumption of Russian gas flows to Europe seem to have been the catalyst, although I am sure that trading volatility recently is reducing liquidity as well, exacerbating movers. The futures markets remain deeply in backwardation, suggesting that prompt supplies are as tight as ever in the real world.
The leaders of Saudi Arabia and Russia had a phone call today, with Saudi Arabia affirming Russia’s importance to the OPEC+ group and further emphasising which side OPEC’s bread is buttered regarding US relations. Along with Saudi Arabia making noises about rapidly approaching production capabilities, that has sent oil prices higher in Asia today ahead of the weekend.
Brent crude closed 2.45% lower at $103.85 overnight, climbing 1.30% to $105.20 a barrel in Asia today. WTI closed 3.55% lower at $96.40 overnight, gaining 1.0% to $97.55 a barrel in Asia. Brent crude has well-denoted resistance at $108.00 a barrel on the charts and then 111.00. It has support at $104.00 and $101.00 a barrel. WTI traced a double bottom at $94.30, its overnight low and 200-day moving average. (DMA). That makes this level quite pivotal now, a sustained failure signalling a retest of $90.00. Resistance is at $100.00, followed by 104.00 a barrel.
Gold remains on the long-term injured list.
Gold traded in a wide $40.00 range overnight between $1680.00 and $1720.00, with the price action suggesting that some sell-at-worst long-liquidation occurred as $1700.00 failed. The longer-term support is around $1675.00 an ounce, barely holding but also emphasising its importance. In the end, a weaker US Dollar and falling US yields allowed gold to record a decent gain for the day, although on the scale of recent moves in other asset classes, gold remains entrenched in the danger zone.
Gold finished 1,32% higher at $1719.00 overnight, easing 0.26% lower to $1715.00 an ounce in Asia today as US Dollar strength resumed. It has support now at $1680.00, and then the longer-term support around $1675.00 an ounce zone. A sustained failure of $1675.00 will signal a much deeper move, targeting the $1450.00 to $1500.00 an ounce regions. Gold has resistance nearby at $1720.00, then $1745.00, and now a triple top.
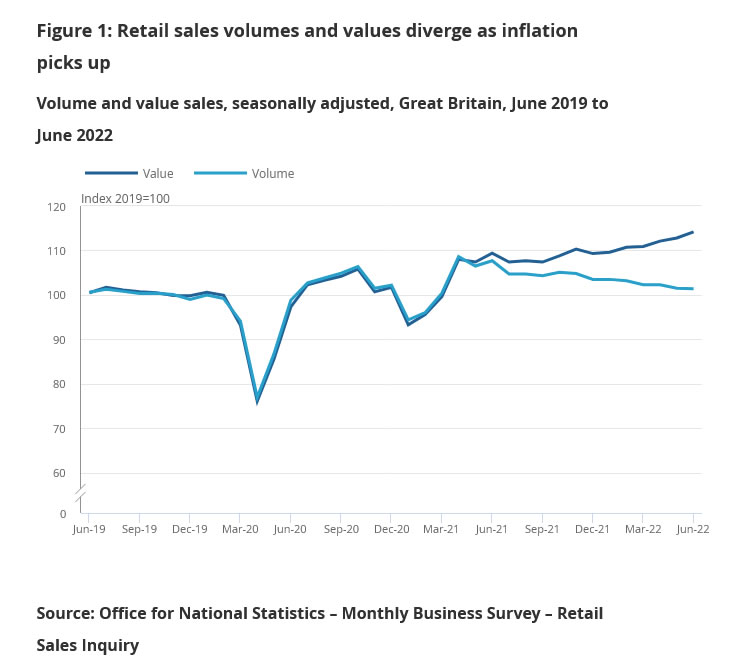
UK retail sales down -0.1% mom, -5.8% yoy in volume; up 1.3% mom, 14.4 yoy in value
In volume term, UK retail sales dropped -0.1% mom in June, better than expectation of -0.3% mom. Ex-fuel sales rose 0.4% mom, above expectation of -0.3% mom.
Compared with the same period a year earlier, sales volume dropped -5.8% yoy, versus expectation of -5.3% yoy. Ex-fuel sales dropped -5.9% yoy, versus expectation of -6.2% yoy.
In value term, retail sales rose 1.3% mom, 14.4% yoy. Ex-fuel sales rose 1.3% mom, 12.9% yoy.
EUR/USD Daily Outlook
Daily Pivots: (S1) 1.0135; (P) 1.0204; (R1) 1.0252; More...
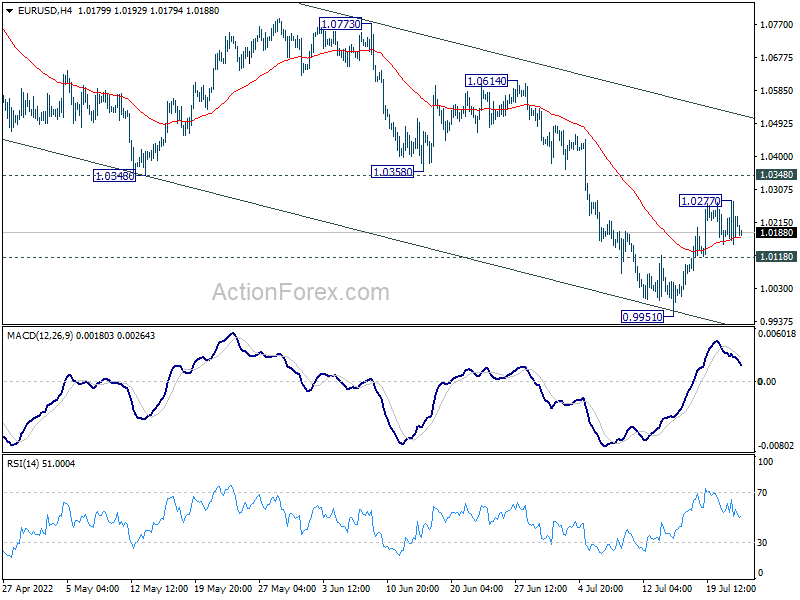
EUR/USD quickly retreated after edging 1.0277 and intraday bias is turned neutral again. On the upside, above 1.0277 will resume the rebound from 0.9951 to 1.0348 support turned resistance, and then channel resistance at 1.0514. Nevertheless, break of 1.0118 minor support will argue that larger down trend is ready to resume, and should bring retest of 0.9951 low first.
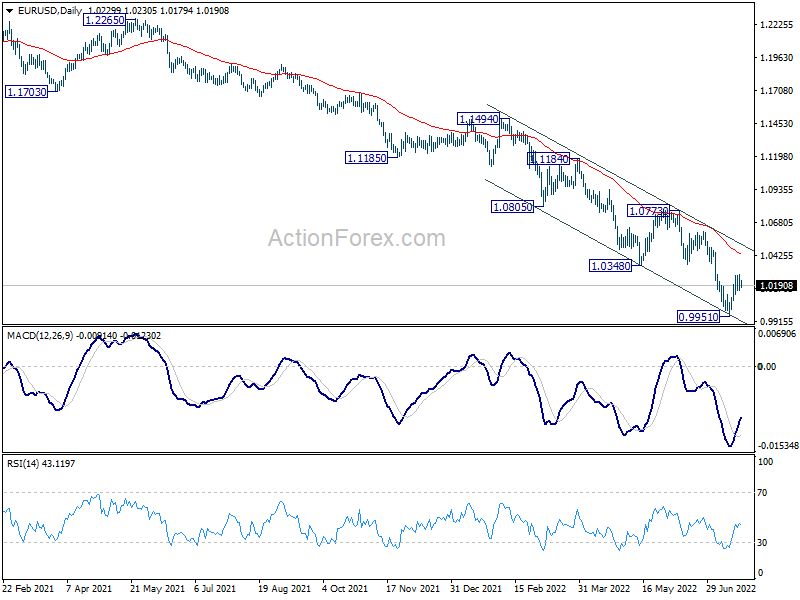
In the bigger picture, down trend from 1.6039 (2008 high) is still in progress. Next target is 100% projection of 1.3993 to 1.0339 from 1.2348 at 0.8694. In any case, outlook will stay bearish as long as 1.0773 resistance holds, in case of rebound.
Euro Rally Fades Quickly, Dollar Staying Weak Too
The lift from ECB rate hike to Euro was rather brief yesterday. The common currency remains range bound again most currencies and turns slightly softer today. Dollar, on the other hand, is regaining some ground with Canadian and Swiss Franc. Overall, the greenback is still the weakest one for the week, followed by Yen. Aussie is the strongest, followed by Canadian. There is prospect of reinforcing the positions if global stock markets can surge before weekly close, after all major even risks are past.
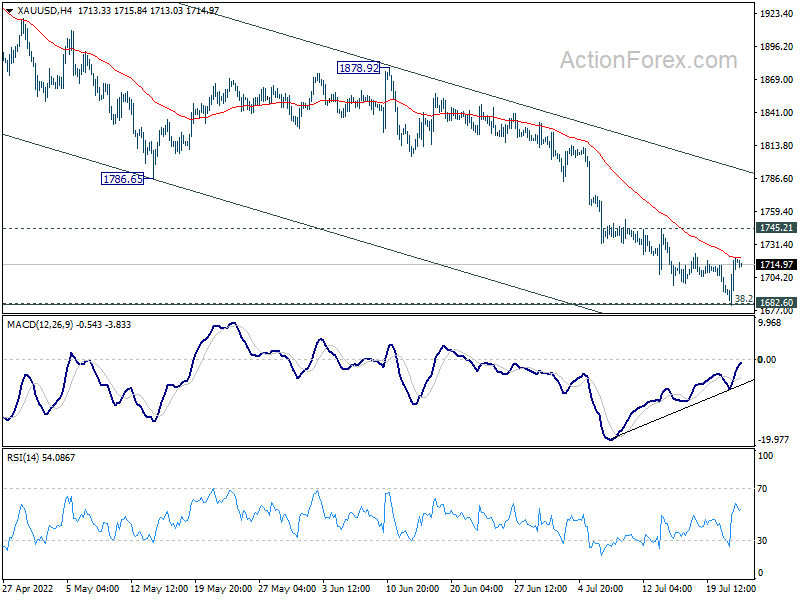
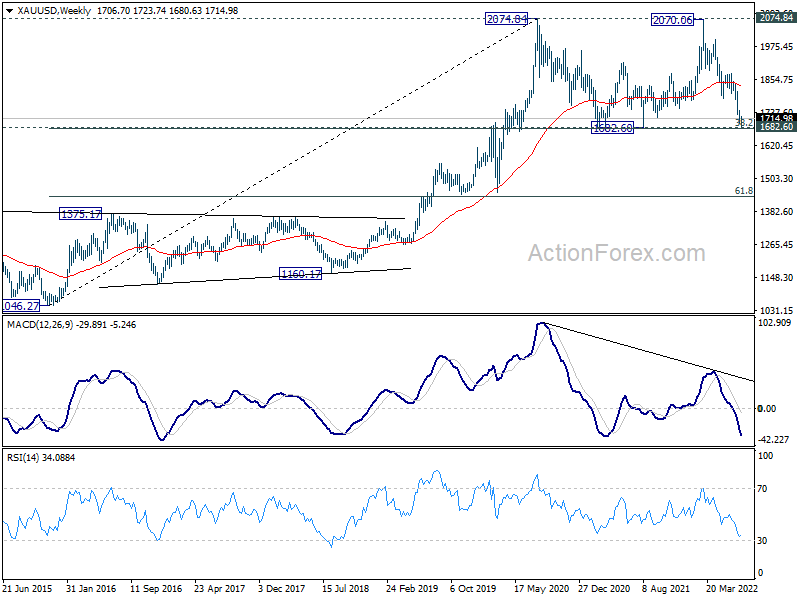
Technically, one focus is on Gold, which dipped to as low as 1680.63 yesterday, but rebounded quickly from there. It's now back above 1700 handle. We'd maintain the view that 1682.60 long term level should provide strong support to complete the fall from 2070.06. Break of 1745.21 resistance will be the first sign of bullish reversal. Let's see if that will happen within the next few days.
In Asia, at the time of writing, Nikkei is up 0.50%. Hong Kong HSI is down -0.22%. China Shanghai SSE is down -0.54%. Singapore Strait Times is up 0.82%. Japan 10-year JGB yield is down -0.0170 at 0.224. Overnight, DOW rose 0.51%. S&P 500 rose 0.99%. NASDAQ rose 1.36%. 10-year yield dropped -0.126 to 2.910.
Japan CPI core ticked up to 2.2% yoy, core-core up to 1.0% yoy
Japan all-item CPI dropped from 2.5% yoy to 2.4% yoy in June. CPI core (all-items ex-fresh food), rose from 2.1% yoy to 2.2% yoy, matched expectations. CPI core-core (all-items ex-fresh food, energy) rose from 0.8% yoy to 1.0% yoy.
The CPI core reading has now stayed above BoJ's 2% target for a third consecutive month. The core-core reading was also the strongest since February 2016.
BoJ left monetary policy unchanged yesterday. According to the new economic forecasts, core CPI will hit 2.3% this year, but then slowed back to 1.4% in fiscal 2023, and then 1.3% in fiscal 2024.
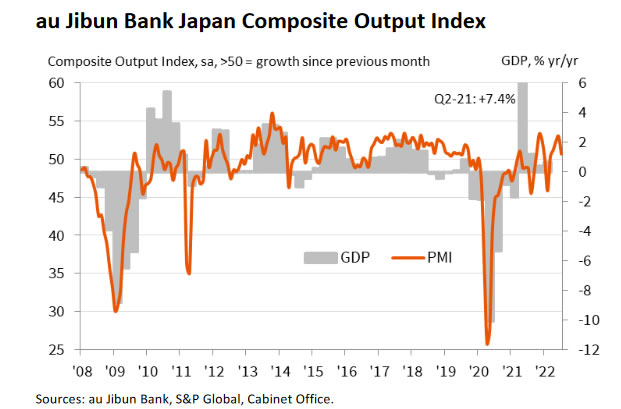
Japan PMI manufacturing dropped to 52.2 in July, services down to 51.2
Japan PMI Manufacturing dropped from 52.7 to 52.2 in July, below expectation of 53.1. PMI Services dropped from 54.0 to 51.2. PMI Composite output dropped from 53.0 to 50.6.
Usamah Bhatti, Economist at S&P Global Market Intelligence, said: "Flash PMI data indicated that activity at Japanese private sector businesses rose at a softer rate during July. The expansion in output was the softest recorded since March and only marginal as companies noted that shortages of raw materials and rising energy and wage costs had increasingly dampened output and new order inflows. This was notably evident at manufacturers, who recorded a reduction in production levels for the first time in five months. Service providers meanwhile reported the slowest rise in activity since April".
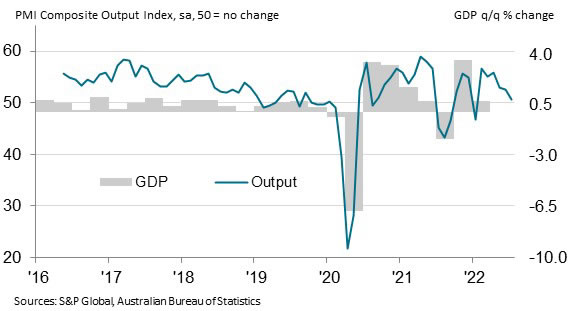
Australia PMI composite dropped to 6-mnth low, further deceleration in growth
Australia PMI Manufacturing dropped from 56.2 to 55.7 in July. PMI Services dropped from 52.6 to 50.4, a 6-month low. PMI Composite dropped from 52.6 to 50.6, also a 6-month low.
Laura Denman, Economist at S&P Global Market Intelligence said: "Latest survey data has pointed to a further deceleration in the rate of private sector growth. Panellists suggested that interest rate increases, alongside persistent inflationary pressures, have been a pivotal factor contributing to the weakened private sector improvement this month. Further interest rate increases by Australia's central bank present a downside risk to the private sector, with sentiment slipping to a 27-month low."
Looking ahead
PMI data from Eurozone and UK will be the main focus in European session. UK retail sales will also be released. Later in the data, Canada retail sales and US PMIs will be published.
EUR/USD Daily Outlook
Daily Pivots: (S1) 1.0135; (P) 1.0204; (R1) 1.0252; More...
EUR/USD quickly retreated after edging 1.0277 and intraday bias is turned neutral again. On the upside, above 1.0277 will resume the rebound from 0.9951 to 1.0348 support turned resistance, and then channel resistance at 1.0514. Nevertheless, break of 1.0118 minor support will argue that larger down trend is ready to resume, and should bring retest of 0.9951 low first.
In the bigger picture, down trend from 1.6039 (2008 high) is still in progress. Next target is 100% projection of 1.3993 to 1.0339 from 1.2348 at 0.8694. In any case, outlook will stay bearish as long as 1.0773 resistance holds, in case of rebound.
Economic Indicators Update
| GMT | Ccy | Events | Actual | Forecast | Previous | Revised |
|---|---|---|---|---|---|---|
| 23:00 | AUD | Manufacturing PMI Jul P | 55.7 | 56.2 | ||
| 23:00 | AUD | Services PMI Jul P | 50.4 | 52.6 | ||
| 23:01 | GBP | GfK Consumer Confidence Jul | -41 | -42 | -41 | |
| 23:30 | JPY | National CPI Core Y/Y Jun | 2.20% | 2.20% | 2.10% | |
| 00:30 | JPY | Manufacturing PMI Jul P | 52.2 | 53.1 | 52.7 | |
| 06:00 | GBP | Retail Sales M/M Jun | -0.30% | -0.50% | ||
| 06:00 | GBP | Retail Sales Y/Y Jun | -5.30% | -4.70% | ||
| 06:00 | GBP | Retail Sales ex-Fuel M/M Jun | -0.30% | -0.70% | ||
| 06:00 | GBP | Retail Sales ex-Fuel Y/Y Jun | -6.20% | -5.70% | ||
| 07:15 | EUR | France Manufacturing PMI Jul P | 50.6 | 51.4 | ||
| 07:15 | EUR | France Services PMI Jul P | 52.7 | 53.9 | ||
| 07:30 | EUR | Germany Manufacturing PMI Jul P | 50.6 | 52 | ||
| 07:30 | EUR | Germany Services PMI Jul P | 51.3 | 52.4 | ||
| 08:00 | EUR | Eurozone Manufacturing PMI Jul P | 51 | 52.1 | ||
| 08:00 | EUR | Eurozone Services PMI Jul P | 52 | 53 | ||
| 08:30 | GBP | Manufacturing PMI Jul P | 52 | 52.8 | ||
| 08:30 | GBP | Services PMI Jul P | 53.2 | 54.3 | ||
| 12:30 | CAD | Retail Sales M/M May | 1.60% | 0.90% | ||
| 12:30 | CAD | Retail Sales ex Autos M/M May | 1.80% | 1.30% | ||
| 13:45 | USD | Manufacturing PMI Jul P | 52.5 | 52.7 | ||
| 13:45 | USD | Services PMI Jul P | 52.1 | 52.7 |
Japan CPI core ticked up to 2.2% yoy, core-core up to 1.0% yoy
Japan all-item CPI dropped from 2.5% yoy to 2.4% yoy in June. CPI core (all-items ex-fresh food), rose from 2.1% yoy to 2.2% yoy, matched expectations. CPI core-core (all-items ex-fresh food, energy) rose from 0.8% yoy to 1.0% yoy.
The CPI core reading has now stayed above BoJ's 2% target for a third consecutive month. The core-core reading was also the strongest since February 2016.
BoJ left monetary policy unchanged yesterday. According to the new economic forecasts, core CPI will hit 2.3% this year, but then slowed back to 1.4% in fiscal 2023, and then 1.3% in fiscal 2024.
Japan PMI manufacturing dropped to 52.2 in July, services down to 51.2
Japan PMI Manufacturing dropped from 52.7 to 52.2 in July, below expectation of 53.1. PMI Services dropped from 54.0 to 51.2. PMI Composite output dropped from 53.0 to 50.6.
Usamah Bhatti, Economist at S&P Global Market Intelligence, said: "Flash PMI data indicated that activity at Japanese private sector businesses rose at a softer rate during July. The expansion in output was the softest recorded since March and only marginal as companies noted that shortages of raw materials and rising energy and wage costs had increasingly dampened output and new order inflows. This was notably evident at manufacturers, who recorded a reduction in production levels for the first time in five months. Service providers meanwhile reported the slowest rise in activity since April".
Australia PMI composite dropped to 6-mnth low, further deceleration in growth
Australia PMI Manufacturing dropped from 56.2 to 55.7 in July. PMI Services dropped from 52.6 to 50.4, a 6-month low. PMI Composite dropped from 52.6 to 50.6, also a 6-month low.
Laura Denman, Economist at S&P Global Market Intelligence said: "Latest survey data has pointed to a further deceleration in the rate of private sector growth. Panellists suggested that interest rate increases, alongside persistent inflationary pressures, have been a pivotal factor contributing to the weakened private sector improvement this month. Further interest rate increases by Australia's central bank present a downside risk to the private sector, with sentiment slipping to a 27-month low."
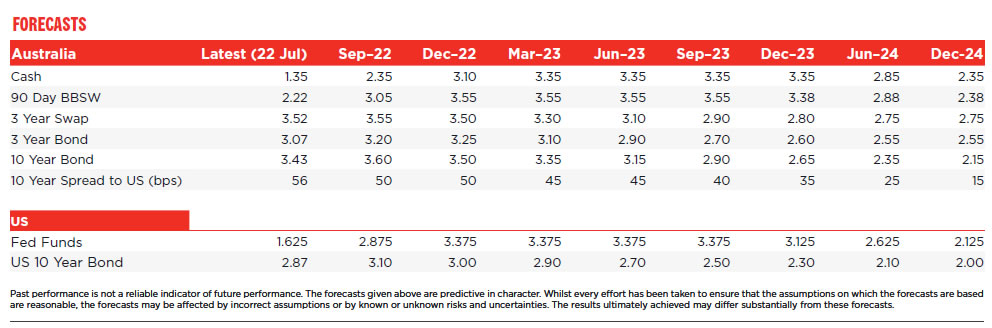
RBA to Lift the Cash Rate to 3.35% by February 2023
We have revised our profile for the RBA cash rate cycle to include 50bp moves in both August and September; followed by a step down in the pace to 25bp increases at every meeting from October to February 2023. The terminal cash rate forecast has been revised up from 2.6% to 3.35%. Under this policy stance economic growth is expected to slow to 1% in 2023 and the unemployment rate to lift from 3% to 4.4% in 2023. We expect the Bank to cut the cash rate by 100bps in 2024.
This week we have received three very important communications from the Reserve Bank. These were: the Minutes of the July Board meeting; and the speeches by both Governor Lowe and Deputy Governor Bullock.
Three consistent themes run through these pieces:
- The Bank is committed to the concept of assessing the stance of monetary policy through the lens of the neutral rate. The Bank's estimate of neutral is higher than our own.
- The most significant challenge to returning inflation to the target range is containing inflation expectations and inflation psychology. Such is the emphasis on this issue that it is likely the Bank will err on the side of containing these expectations, even at the risk of weighing more heavily on economic activity than might have been their preference under other circumstances.
- A key area of interest will be how households respond to higher interest rates. There are reasons to expect a degree of resilience given a tight labour market supporting strong nominal income growth; a high savings rate; and large financial buffers in household balance sheets.
Westpac's forecast for the peak in the terminal cash rate in this cycle has been 2.6%.
That was partly based on our assessment that the neutral cash rate is in the 1.5–2.0% range.
The Minutes, the Governor's speech, and the Deputy Governor's responses in the Q&A session all point to the RBA assessing the neutral rate as being at least 2.5%.
The Governor and the Minutes both note that there are a number of different approaches to the measurement of neutral, but the Governor concludes that "most approaches suggest that the neutral real rate for Australia is at least positive."
Converting this neutral real rate into a nominal rate is trickier when inflation is volatile. Rather than current inflation, the adjustment should use medium to longer term inflation expectations. He currently assesses these as being at the target rate of 2.5% but points out that if inflation expectations were to lift then the neutral rate estimate would also increase.
The cash rate is currently 1.35% and we have been expecting the Board to lift the rate to 1.85% at its August meeting.
That will still be 65bp below the Bank's assessed neutral rate.
We had assumed that having reached 1.85% – within our estimated 'neutral zone' – the Board could step back to smaller increments at a slower pace. Our profile was for: a 25bp lift in September; followed by a pause in October; a 25bp move in November, in response to another sharp lift in annual underlying inflation in the September Quarter inflation report; a pause in December and a final lift of 25bp at the February Board meeting in response to the peak in annual inflation in the December Quarter inflation report. That would see a terminal cash rate of 2.6%.
Given the guidance from the Bank this week, that neutral is 2.5%, it seems unlikely that the Board would take until next February to reach its assessment of neutral.
Such an approach seems particularly unlikely given the nervousness around inflation expectations and the current accurate assessment of a very tight labour market and a resilient household sector. On the latter we also note that momentum in spending is likely to be remain solid through the June and September quarters despite the recent collapse in Consumer Sentiment.
Accordingly, we have revised our profile for the RBA's tightening cycle to reflect these factors.
Firstly, there will need to be a further 50bp increase in the cash rate in September, to 2.35%, moving it more decisively into the RBA's 'neutral zone'.
With the cash rate around neutral and following a cumulative increase of 225bps in only five meetings, it would then be appropriate for the RBA to step the increases down to a 25bp pace in October, taking the cash rate slightly above neutral to 2.6%.
With the policy position now perceived as contractionary the Board would remain on the slower 25bp path, guided by developments around inflation; inflation expectations; the labour market and the economy, while continuing to send the signal that it remains committed to containing inflation by moving policy further into the contractionary zone.
Inflation outcomes and inflation expectation concerns will be the dominant motivating forces for policy.
The September quarter inflation report will signal further increases in underlying inflation to 5% annual growth, prompting a further 25bp move at the November meeting. The cash rate will be 2.85% before the December meeting.
Household spending will be losing momentum and the housing market will have been slowing for nearly six months.
But inflation; inflation expectations and the labour market will still be running too hot and with the cash rate only 35bp above the minimum assessed neutral another 25bp adjustment will come in December.
As in our previous profile we expect that the final increase will be in February following the peak print in both headline and underlying inflation.
As we have assessed previously, we expect the March quarter inflation report, which will inform the May Board meeting, to show a clear fall in both annual and quarterly inflation – a turning point that will allow the Bank to remain on hold.
The difference between this revised profile and our previous profile is that the peak terminal rate will be 3.35% rather than 2.60%. That will be 85bp above the Board's assessed neutral rate and 135bp above our estimate of neutral.
We think this higher terminal rate will reflect the Board's risk averse approach which will lead it to err on the side of ensuring inflationary expectations are contained so that inflation can return to the target range over the course of 2023.
Just as the Board over-stimulated the economy in the face of the COVID threat, so it will be prepared to tighten to address what it perceives as the greater risk – losing control of inflation expectations at this time of rising inflation and very tight labour markets rather than fine tuning the economic downturn.
Central banks refer to this approach as taking the course of least regret.
Forecast changes
This higher terminal rate does mean significant changes to our key forecasts.
GDP growth is revised down from 2% to 1% in 2023; and from 2.5% to 2% in 2024.
Consumer spending growth is downgraded from 2.5% to 1.5% in 2023 and from 2.8% to 2.0% in 2024.
The unemployment rate lifts from 3% by end 2022 to 4.2% in 2023 and 5% in 2024 (compared to 3.2% ,3.5% and 3.9% respectively).
Higher interest rates will also add pressure to the housing market where a price correction is already underway. Prices are now expected to decline 4% over calendar 2022 and 10% in calendar 2023, with a 'peak to trough' fall of over 15%. Rate cuts, which did not figure in our previous profile, will provide some recovery in prices in 2024.
Underlying inflation slows to 3.0% in 2023 and 2.7% in 2024 (compared to 3.2% and 3.0% respectively).
Containing inflation would, justifiably, be seen by the authorities to be a successful outcome, although our previous forecasts also anticipated a sharp slowing in inflation in 2023 mainly in response to supply side adjustments in fuel, food, building materials and energy.
A 1% growth rate and zero per capita growth in consumer spending in 2023 would be seen, in hindsight, as an acceptable cost to not losing control of inflation and inflationary expectations.
A 2ppt increase in the unemployment rate over two years will be painful (in contrast with 1% in our earlier scenario) but certainly enhances the prospects of containing wages growth to around 4% – meaning positive real wages growth through 2023 and 2024 but not a more problematic rise that would add to inflation pressures.
Despite the insipid growth rate of 1% in 2023 the Board will maintain the contractionary policy stance throughout 2023. Underlying inflation is forecast to hold above the top of the target band through most of the year. That will keep the Board cautious about easing back on policy too early and risking a resurgence in inflationary expectations.
Wages growth will also provide some degree of caution in 2023 as annual growth lifts to 4.5% from the June quarter. Without the higher terminal rate that peak would have been 5%.
By early 2024 with inflation slowing back into the band; the economy operating below capacity; wages growth slowing and the unemployment rate rising it will be time to move the policy setting back to neutral.
Over the course of 2024 we expect the cash rate to be reduced by 100bps from 3.35% to 2.35%.
Growth details of our revised RBA profile (Andrew Hanlan; Matthew Hassan; Justin Smirk)
A strong starting point
The Australian economy has considerable momentum in mid- 2022. This reflects earlier and substantial policy stimulus and a reopening recovery from the delta lockdowns over the second half of 2021 – centred in NSW and Victoria.
Household balance sheets are generally in good shape. Households have accumulated around $260bn in 'excess' savings over 2020, 2021 and into early 2022. The saving rate remains elevated and as it normalises towards the "equilibrium" 6% level unlocks substantial dollars to fund additional spending in the near term.
The economy is operating at or beyond full capacity – a situation which we last experienced in the mid-1970s. The number of job vacancies are very high – with 1 vacancy for each person that is unemployed. Output in a number of sectors – particularly home building – is constrained by labour and material shortages – such that a sizeable pipeline of work outstanding has emerged. This large pipeline of work will support the level of activity going forward.
Some of these forces and dynamics which are driving the strong economic momentum in mid-2022 will cushion the looming economic downturn in 2023 as monetary conditions shift to a contractionary stance.
Components of the GDP slowdown
We have updated our Australian activity forecasts informed by the revised RBA rate profile.
We have marked down our output profile for 2023 and 2024. Output growth is now forecast to slow to 1% in 2023, downgraded from 2% previously, then recover to 2% in 2024, rounded down from 2.5%.
Note, that we have also rounded up the 2022 growth forecast, to 4.4%, from 4%, to reflect a likely stronger outcome for the June quarter – with Q2 growth now a forecast 2%, with upside risks.
We assess that trend growth for the Australian economy is in the order of 2.5%, associated with population growth at around 1.5% – the pre-covid population pace and a rate that we expect to resume during the forecast period associated with the reopening of the national border.
In that context, output growth slowing to a forecast 1% in 2023 is substantially below trend and represents a very subdued pace. Some may describe this as nearing "stalling speed". Such an outcome compares favourably with earlier periods of severe economic shock, such as: the GFC (output contracted by -0.5% in Q4 2008 and domestic demand contracted by 1% over the two quarters to Q1 2009); the early 1990s recession (output contracted by 1.5% over the first half of 1991); and the 2020 covid recession (output contracted by around 7% over the first half of the year).
Our 2023 activity profile envisages that the level of private demand crests in 2023, with annual growth slowing abruptly from around 6% in 2022 to a forecast 0.2%, before improving to 1.4% in 2024 as inflation eases and interest rates are reduced from early 2024.
Output growth of 1% in 2023 will be centred on public demand, up 2% and adding 0.5ppts to activity. Net exports add a forecast 0.8ppts to activity in the year as export growth outpaces that of imports, which are dented by weak domestic demand. Inventories are a drag, subtracting in the order of -0.4ppts, as firms adjust to sluggish turnover.
Weakness concentrated in the consumer and housing
Consumer spending and the housing sector will drive the loss of economic momentum in 2023, reflecting the combined impact of higher inflation and rising interest rates. Consumer spending is forecast to expand by 1.2% in 2023, which is broadly flat in per capita terms. This experience is on a par with that of 2019 (consumption grew by 0.8% that year) – when the economy was soggy at a time of housing sector weakness (including declining prices) and weakness in real wages. Such an outcome for 2023 would compare favourably with periods of economic recession – when consumer spending typically contracts – supported by some of the key dynamics and forces propelling the economy forward in 2022 (a labour market operating at full capacity and a sizeable household saving buffer).
Home building activity contracts by a forecast 5% in 2023. This represents a material but not a sharp downturn. The sizeable work pipeline helps to hold up the level of activity into 2023, cushioning the impact of higher interest rates.
The higher profile for interest rates will also weigh more heavily on the wider housing market. Most capital city markets are already into a price correction phase. The further 'front-loading' of rate hikes will see more impact near term with prices now expected to decline 4% in calendar 2022( 6% in the second half of 2022) and a further 10% in calendar 2023 (compared to previous forecasts of –2% and –8% respectively). The 'peak to trough' decline within this is around 16%, closer to 18% in the case of Sydney and Melbourne.
Note that the main dynamic here is still the reduction in buyers' borrowing capacity from higher rates. 'Selling pressures' are expected to remain limited, reflecting a relatively supportive labour market backdrop, ample buffers in household balance sheets and tight lending standards applied in recent years which should limit the extent of financial distress and associated 'urgent' sales.
Business investment boosted by infrastructure
Businesses will trim investment spending in this environment, but the extent of any 2023 downturn will be tempered by the fact that consumer spending is still expanding – albeit is flat in per capita terms. Total business investment is forecast to edge 0.5% lower in the year. This includes a 4.5% decline in equipment spending and a 4% contraction in building work, largely offset by additional infrastructure work (mining, road projects, renewables) and the uptrend in software spending.
Moving through 2024, momentum in the economy strengthens as inflation pressures recede – taking pressure of real incomes – and official interest rates become less contractionary. Another key positive in 2024 is that the Stage 3 tax cuts commence from 1 July.
The pace of output growth lifts to around a trend 2.5% rate over the second half of 2024, led by the consumer and an emerging turning point in the housing market. Businesses will be encouraged by the upturn, lifting investment spending modestly over the second half of the year.
The 2% output growth forecast for 2024 includes: consumer spending growth of 2%; home building a decline of –5.5% (with weakness in the first half of the year); business investment +1% and public demand +2%, such that overall domestic demand growth lifts to 1.6%, up from the sluggish 0.7% pace in 2023.
Net exports are still a positive, but much less so as imports respond to rising domestic demand, at a forecast +0.2ppts. An inventory rebuild rounds out the growth picture, adding in the order of 0.3ppts, in response to stronger turnover.
The labour market
Historically, domestic final demand leads employment by two quarters. The slowdown in employment unfolds through the first half of 2023 lifting the unemployment rate to 3.4% by the June quarter (from 3% at the end of 2022).
With employment contracting in Q3 (–0.11%) and Q4(–0.18%), the unemployment rate lifts from 3.1% in Q1 to 4.2% by Q4 and peaks at 5.0% in 2024 Q4. At the same time, we only see a modest increase in the working age population of around 1%yr through 2023, as the return to 'normal' immigration still lags the pre-COVID pace, but finally lifting to 1.5%yr through 2024.
Footnote: Economics is certainly an art rather than a science. Arguably, the three most important tools and concepts in economic policy making are: the neutral rate; inflationary expectations; and the NAIRU and economists really have no precise measures of any of them!
Technical Outlook and Review
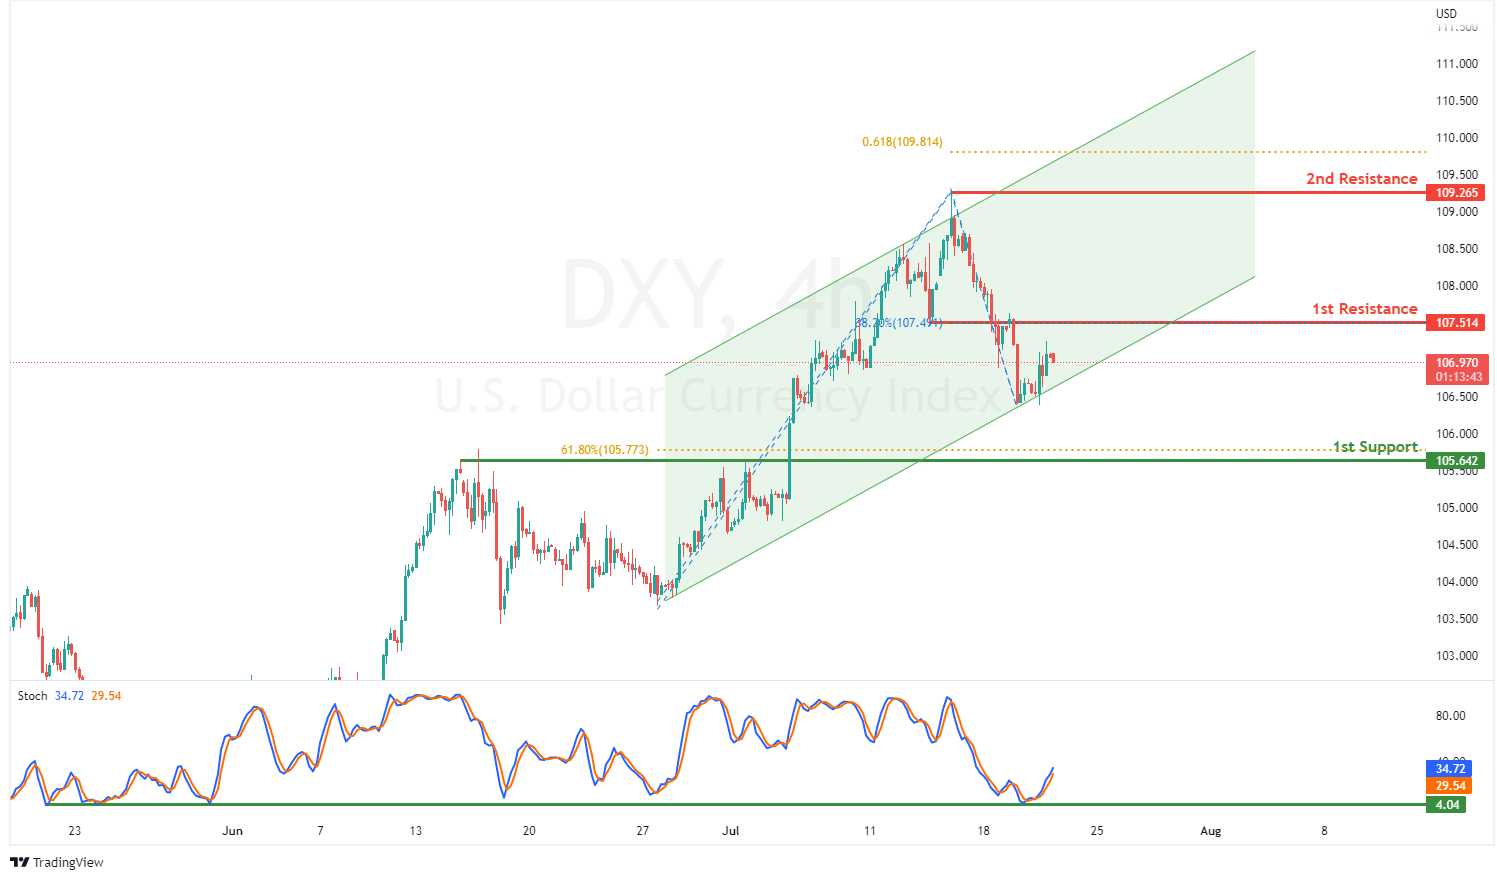
DXY:
On the H4, with prices moving within the ascending channel and bouncing off the stochastic support, we have a bullish bias that prices will rise to the 1st resistance at 107.514 where the 38.2% fibonacci retracement and pullback resistance are. Once there is upside confirmation of price breaking the 1st resistance structure, we would expect bullish momentum to carry price to 2nd resistance at 109.265 where the swing high resistance and 61.8% fibonacci projection are. Alternatively, prices could drop to 1st support at 105.642 in line with overlap support and 61.8% fibonacci retracement.
Areas of consideration:
- H4 time frame, 1st resistance at 107.514
- H4 time frame, 1st support at 105.642
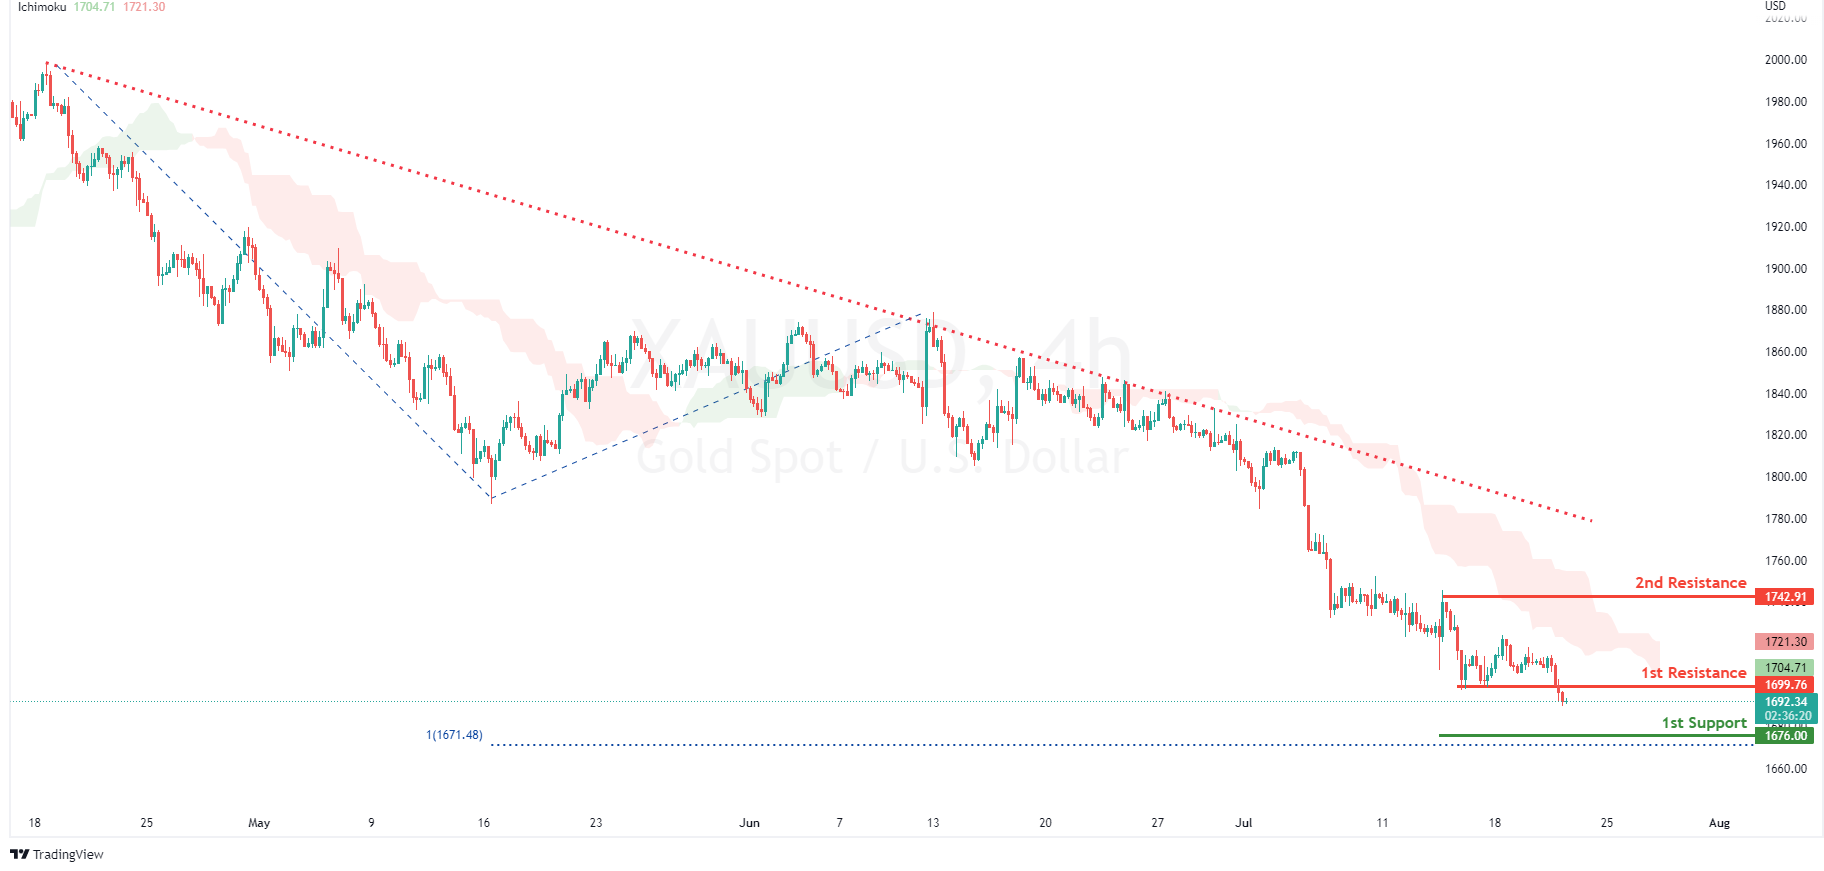
XAU/USD (GOLD):
On the H4, with price moving below the ichimoku cloud and in a descending trendline, we have a bearish bias that price will rise and drop from the 1st resistance at 1699.76 where the pullback support is to the 1st support at 1676.00 in line with the 100% fibonacci projection and swing low support on the daily timeframe. Alternatively, price could break 1st resistance structure on the upside and we would expect bullish momentum to carry prices to 2nd resistance at 1742.91 where the swing high resistance is.
Areas of consideration:
- H4 time frame, 1st Resistance at 1699.76
- H4 time frame, 1st Support at 1676.00
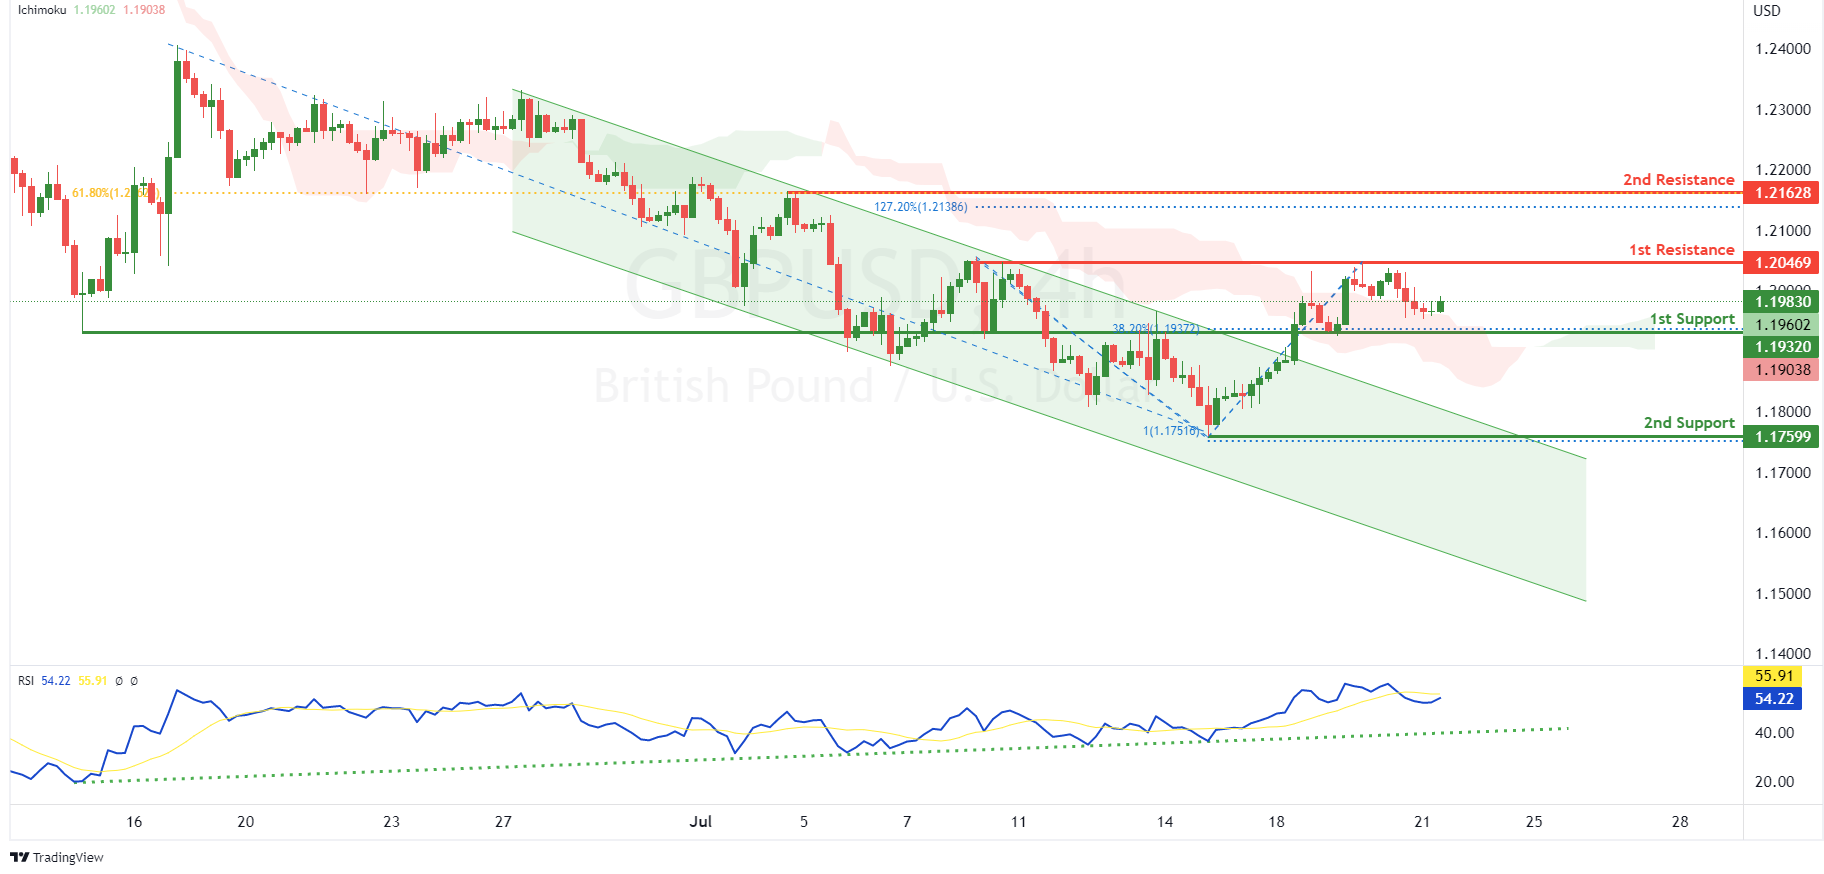
GBP/USD:
On the H4, with prices bouncing off the ichimoku indicator, RSI moving in an ascending trendline and price has broken out of the descending channel, we have a bullish bias that price will rise to the 1st resistance at 1.20469 where the swing high resistance is. Once there is upside confirmation that price has broken the 1st resistance, we would expect bullish momentum to carry prices to 2nd resistance at 1.21628 where the swing high resistance, 61.8% fibonacci retracement and 127.2% fibonacci extension are. Alternatively, price could drop to the 1st support at 1.19320 where the pullback support and 38.2% fibonacci retracement are. Should price break 1st support, we would have a bearish bias that price will drop to 2nd support at 1.17599 in line with swing low support and 100% fibonacci projection.
Areas of consideration:
- H4 1st resistance at 1.20469
- H4 1st support at 1.19320
USD/CHF:
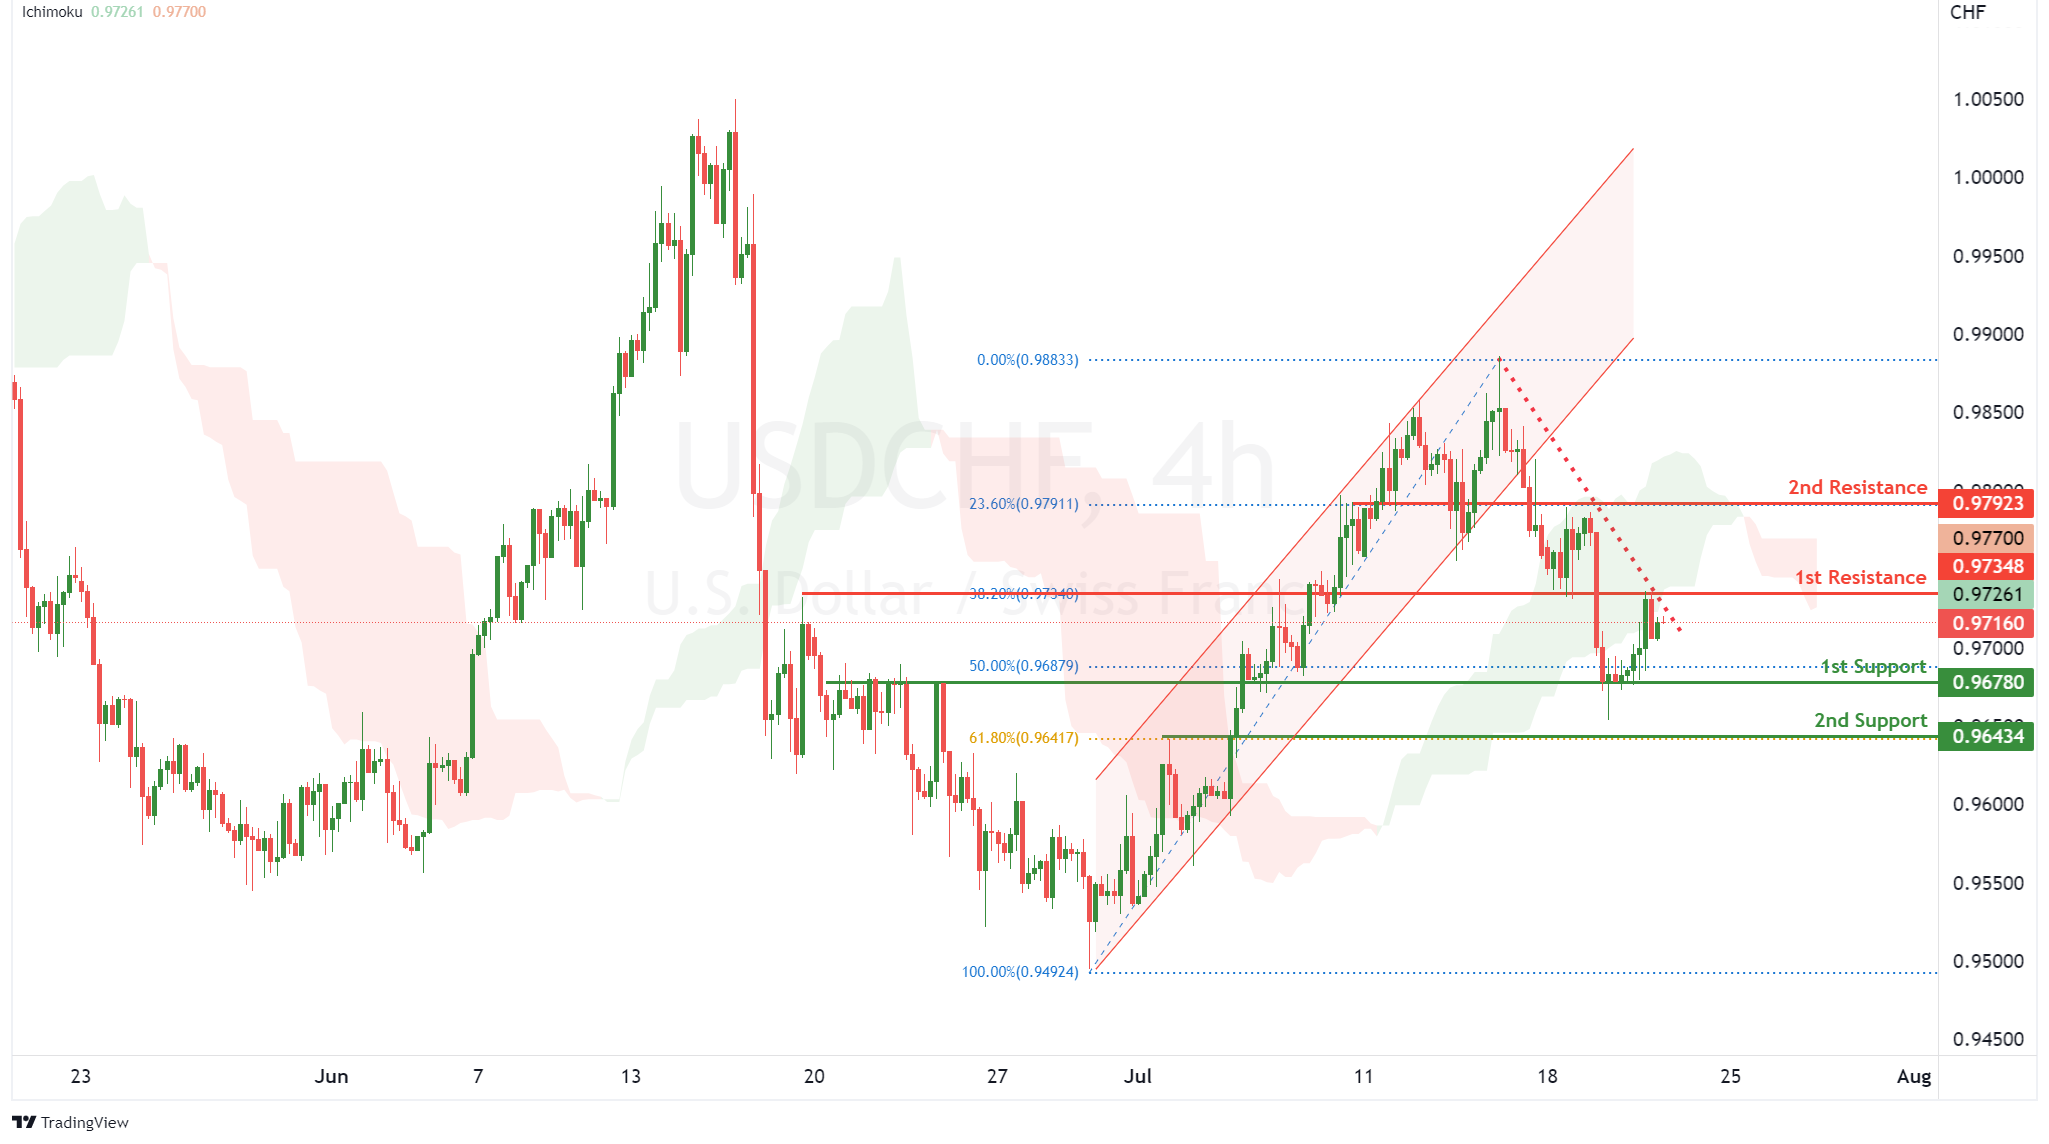
On the H4, with price breaking the bullish channel, moving along the descending channel and crossing over the the ichimoku indicator, we have a bearish bias that price might drop from our 1st resistance at 0.97348 where the pullback resistance is to our 1st support at 0.96780, which is in line with the 50% fibonacci retracement. If the price continues going down, the price may drop to our 2nd support at 0.96434, which is in line with 61.8% fibonacci retracement. Alternatively, price may break 1st resistance and head for 2nd resistance at 0.97923 where the 23.6% fibonacci retracement is.
Areas of consideration
- 1st resistance level at 0.97348
- 1st support level at 0.96780
EUR/USD :
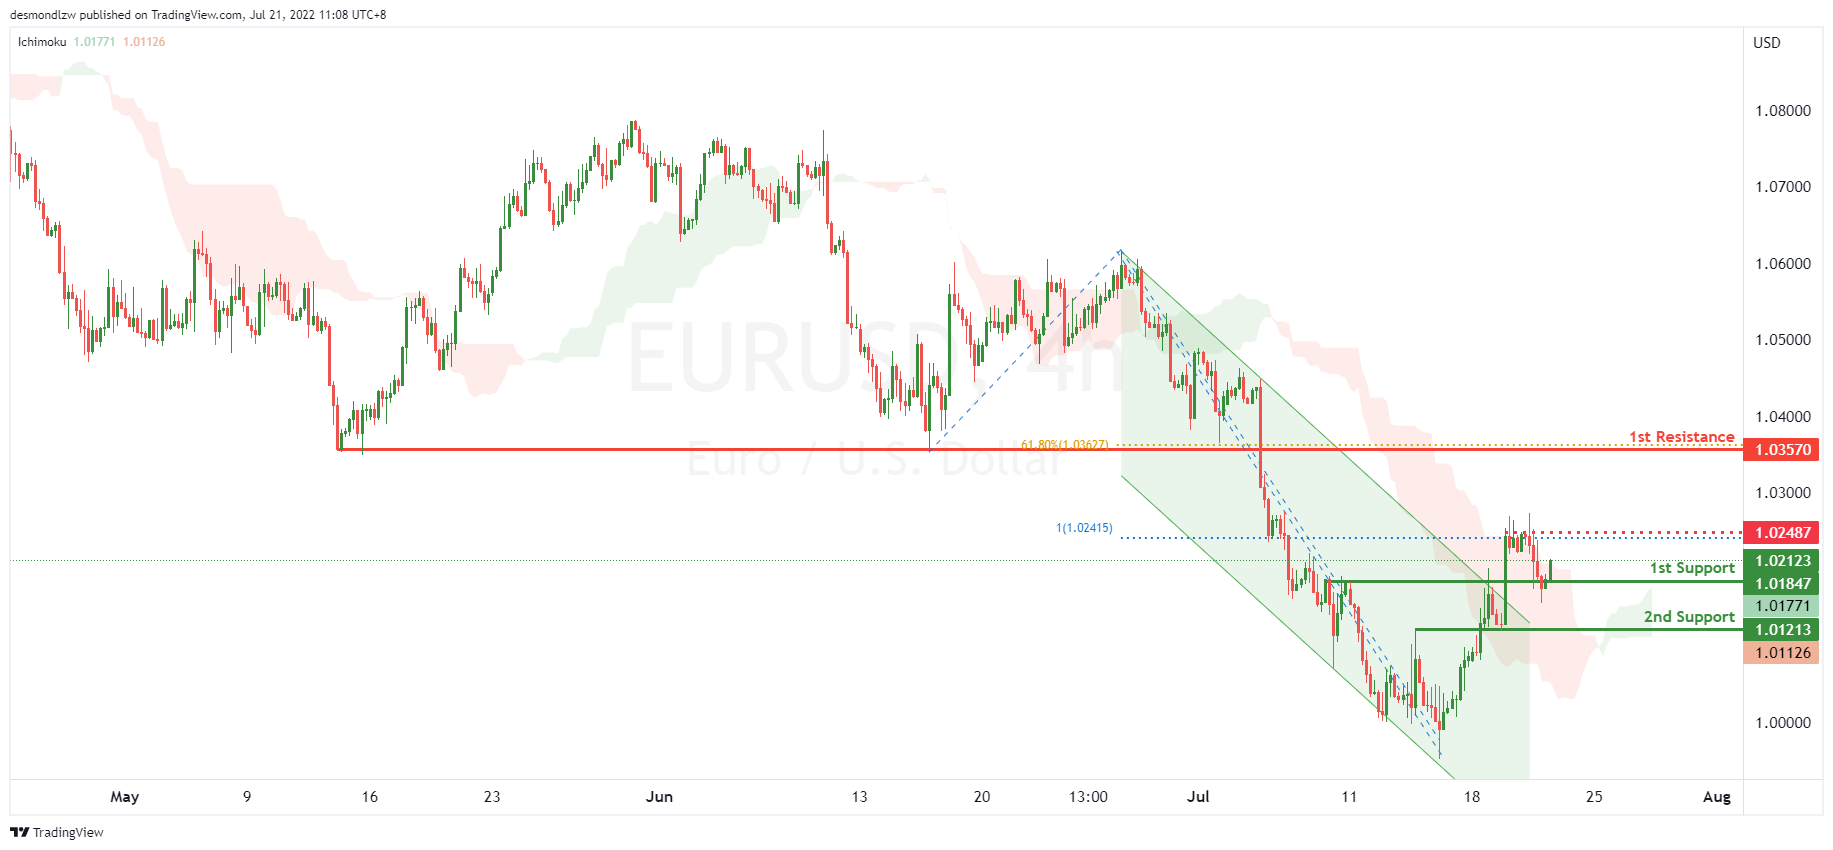
On the H4, with price moving above the ichimoku cloud and breaking out of the descending trend channel, we have a bullish bias that price will continue to rise from the 1st support at 1.01847 at the overlap support. If price breaks above the intermediary resistance at 1.02487 in line with the 100% fibonacci projection, we have upside confirmation that price will continue to rise to the 1st resistance at 1.03570 at the pullback resistance in line with the 61.8% fibonacci retracement. Alternatively, price may reverse off the 1st support and drop to the 2nd support at 1.01213 at the overlap support.
Areas of consideration :
- H4 1st resistance at 1.03570
- H4 1st support at 1.01920
USD/JPY:
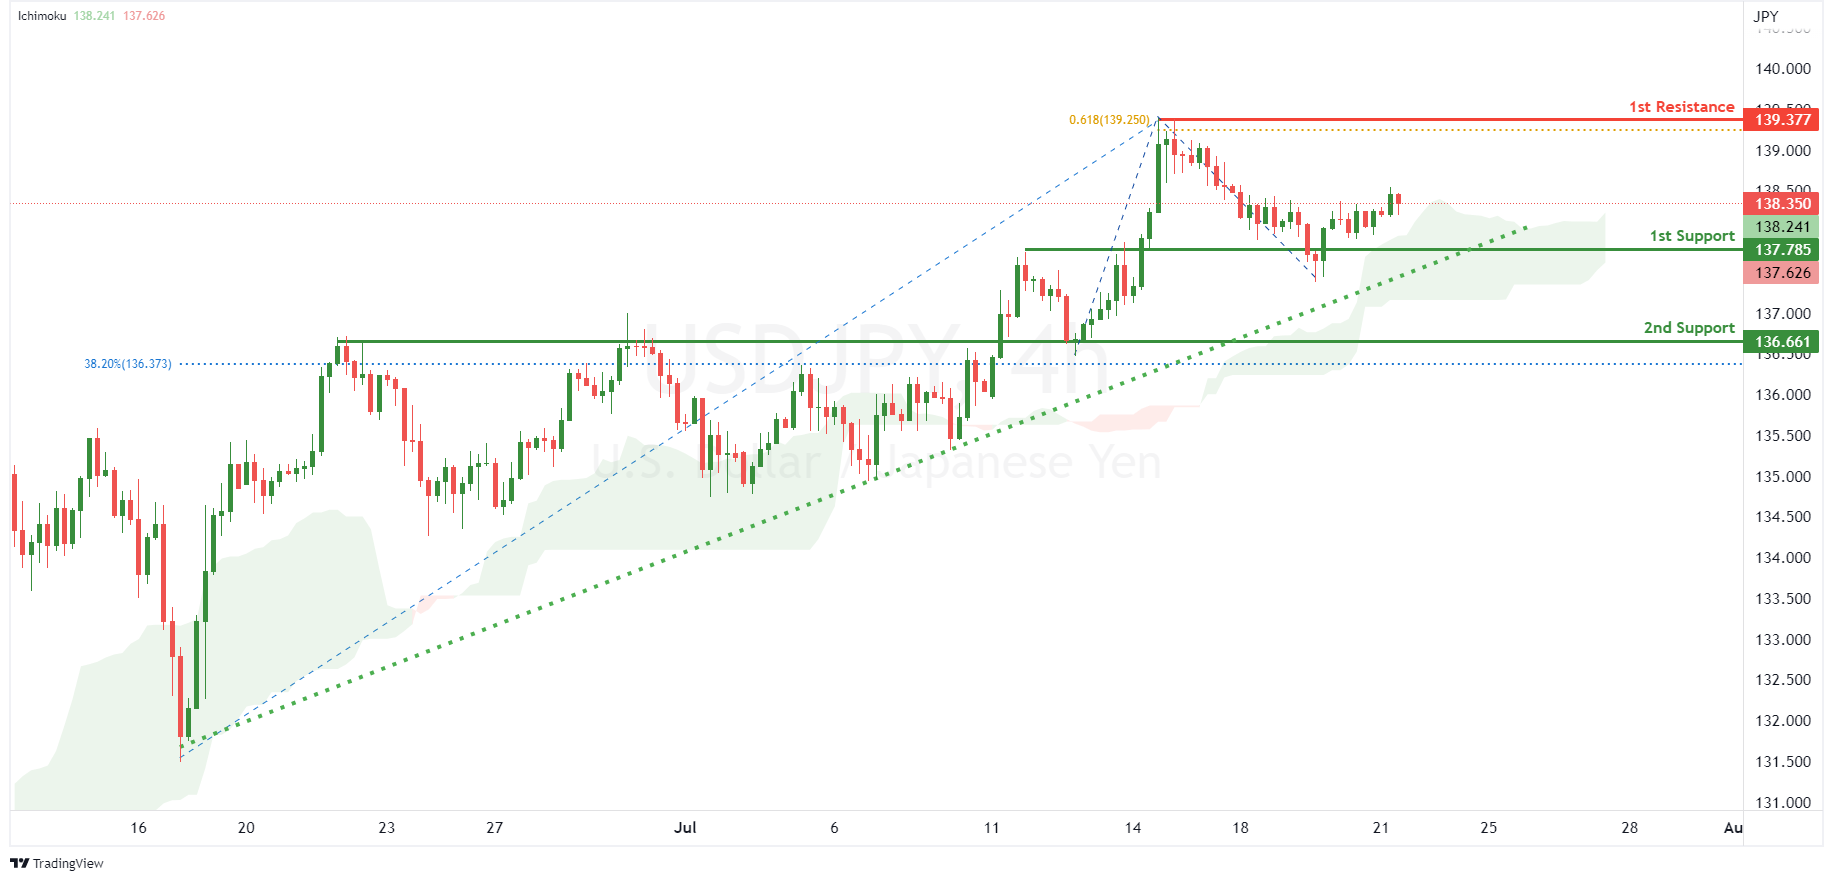
On the H4, with price moving above the ichimoku indicator and along the ascending trendline, we have a bullish bias that price will rise to our 1st resistance at 139.377 where the 61.8% fibonacci projection and swing high resistance are from our 1st support at 137.785 in line with pullback support. Alternatively, prices could break 1st support structure and drop to 2nd support at 136.661 where the overlap support and 38.2% fibonacci retracement are.
Areas of consideration:
- H4 time frame, 1st resistance at 139.377
- H4 time frame, 1st support at 137.785
AUD/USD:
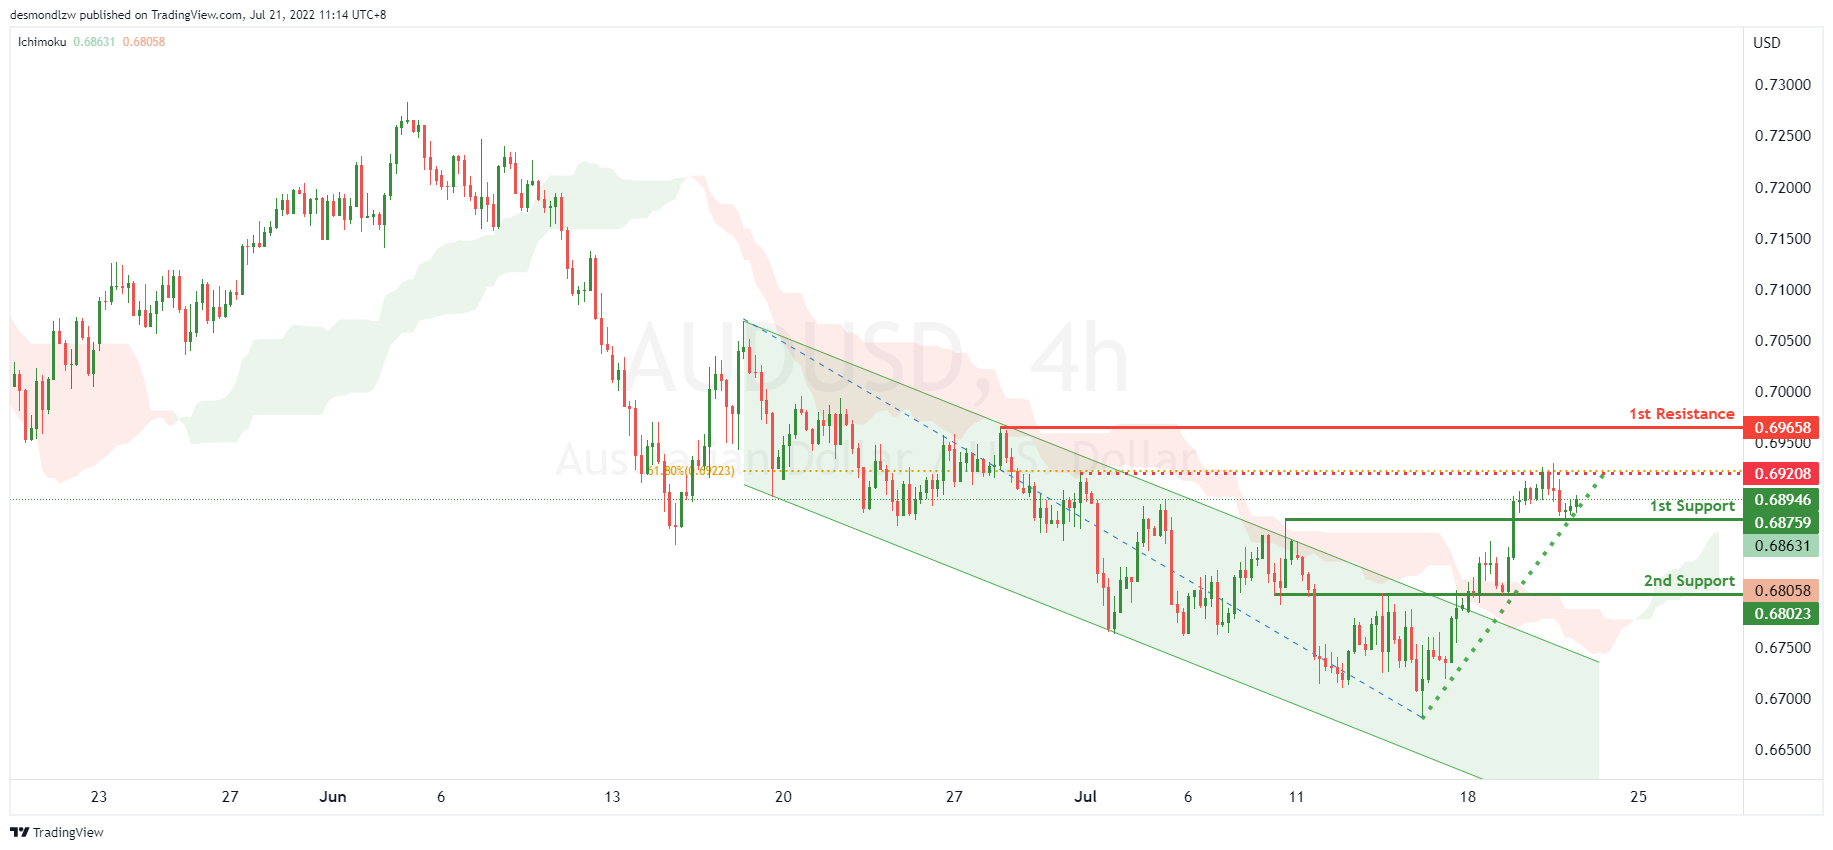
On the H4, with price moving above the ichimoku cloud, moving in an ascending support and breaking out of the descending trend channel, we have a bullish bias that price will rise from the 1st resistance at 0.68759 at the overlap resistance. If price rises and breaks the intermediary resistance at 0.69213 in line with the 61.8% fibonacci retracement, we will have upside confirmation that price will continue to rise to the 2nd resistance at 0.69658 at the swing high. Alternatively, price may reverse off the 1st resistance and drop to the 1st support at 0.68023 at the overlap support.
Areas of consideration
- H4 1st resistance at 0.68759
- H4 1st support at 0.68023
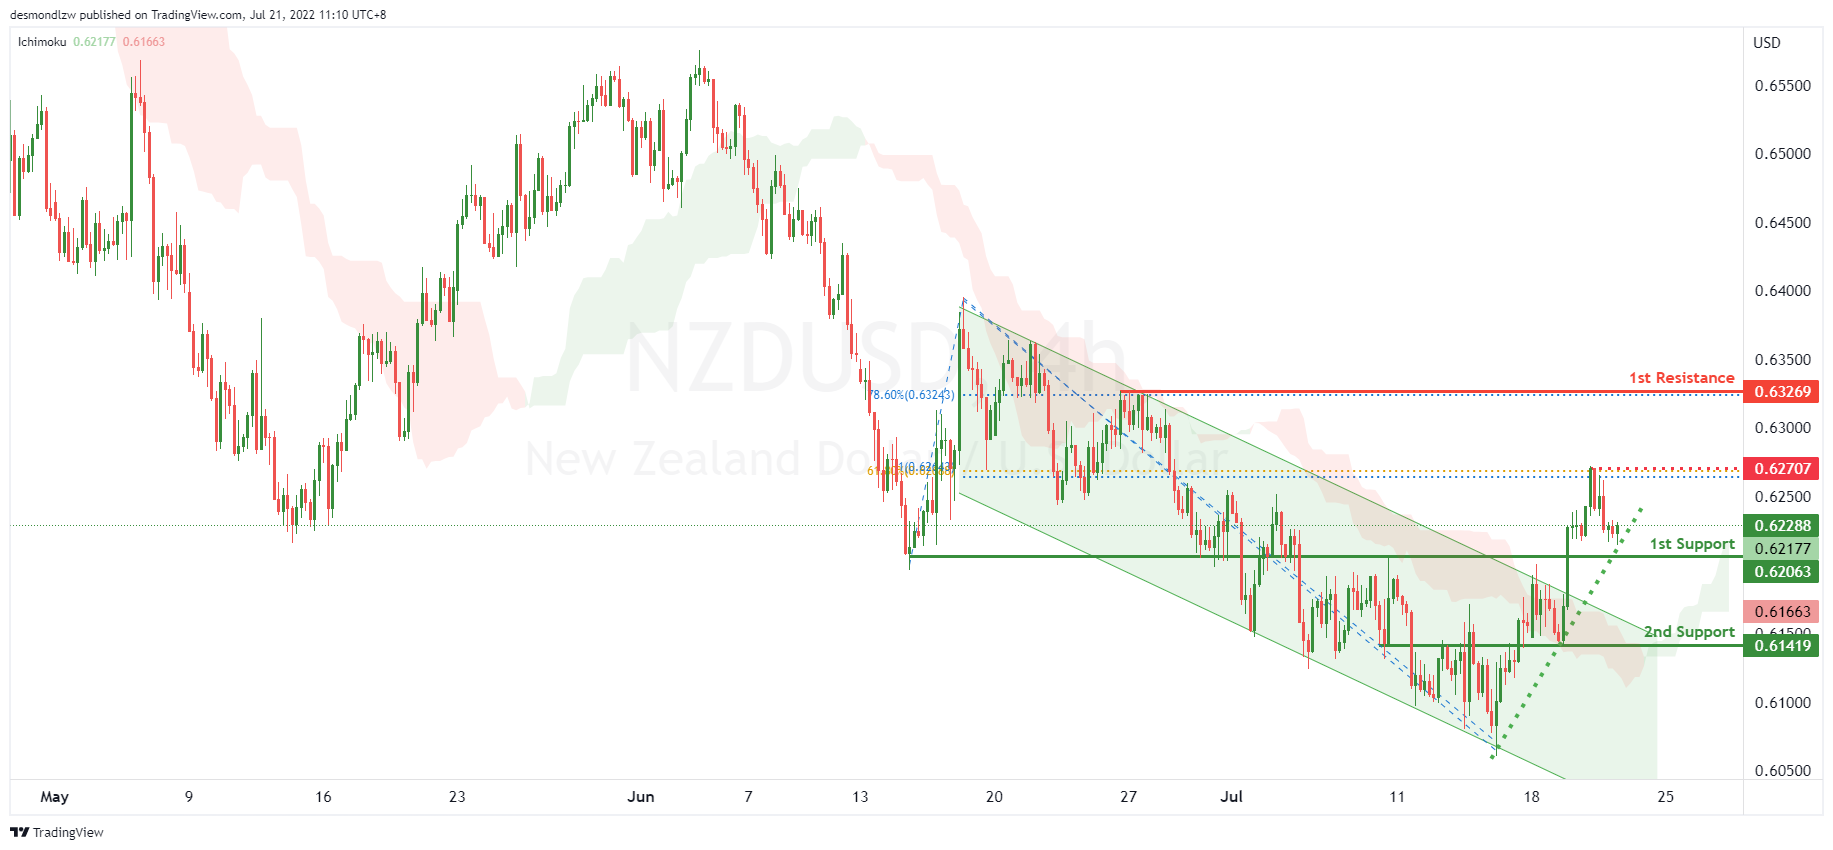
NZD/USD:
On the H4, with price recently breaking the descending trend channel, short term ascending support and moving above the ichimoku cloud, we have a bullish bias that price will rise from the 1st support at 0.62177 at the overlap support. If price breaks the intermediary resistance at 0.62707 at the swing high in line with the 61.8% fibonacci retracement and 100% fiboancci projection, we will have upside confirmation that price will rise to the 1st resistance at 0.63269 at the swing high in line with the 78.6% fibonacci retracement. Alternatively, price may break the support structure at the 1st support and drop to the 2nd support at 0.61419 at the pullback support.
Areas of consideration:
- H4 time frame, 1st support at 0.62177
- H4 time frame, 1st resistance at 0.63269
USD/CAD:
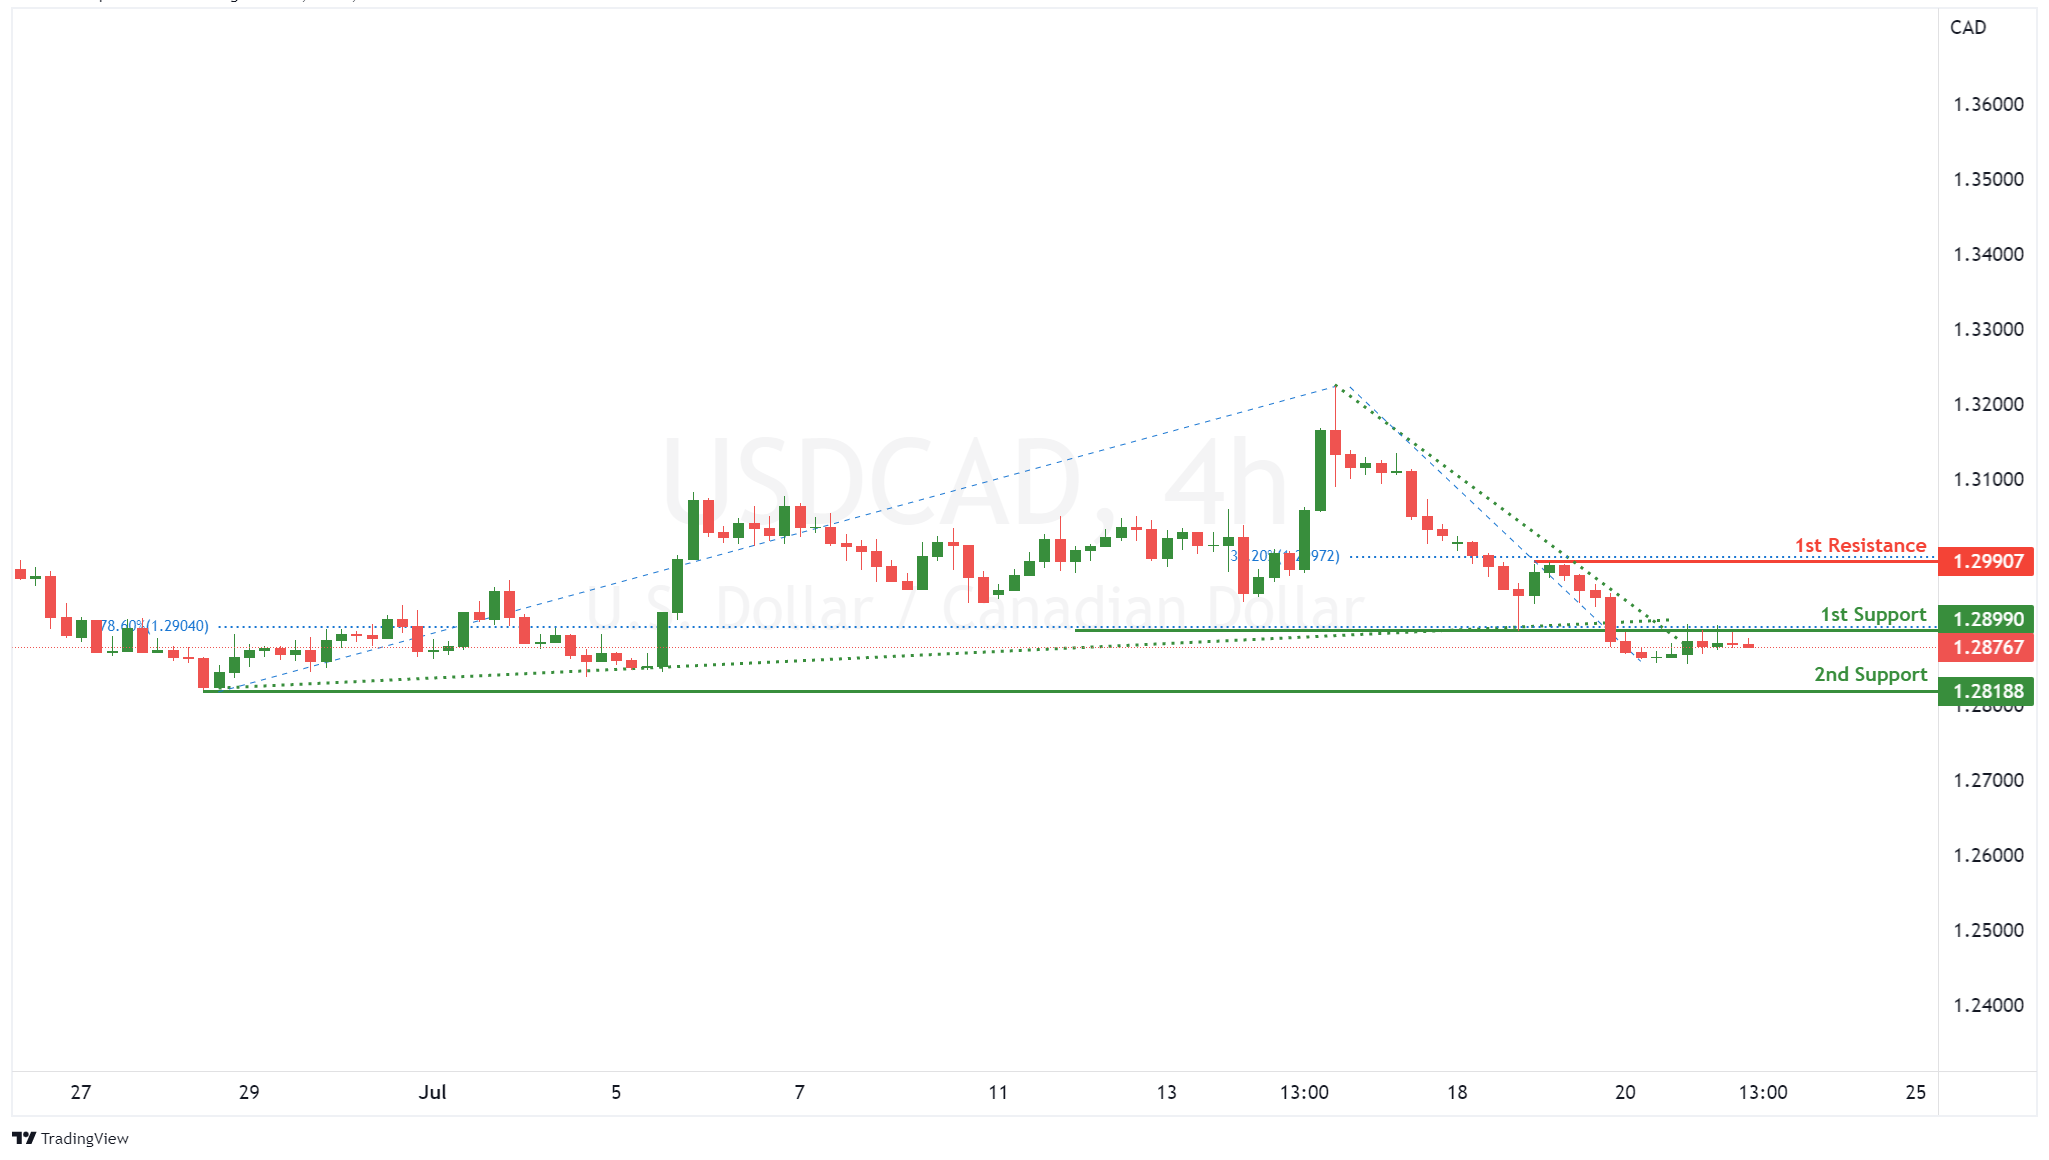
On the H4, prices seem to be range bound although it broke the key resistance level at 1.307. It came back down forming a descending trend with a bearish bias currently testing at the 50% fibonacci retracement level. If prices break 1.285 level, it may pullback further to test at the 61.8% fibonacci retracement level. Alternatively if price bounces off this support level, it may look to test at the next key level at 61.8% fibonacci retracement
Areas of consideration:
- H4 time frame, 2nd support at 1.2780
- H4 time frame, 1st support at 1.2873
OIL:
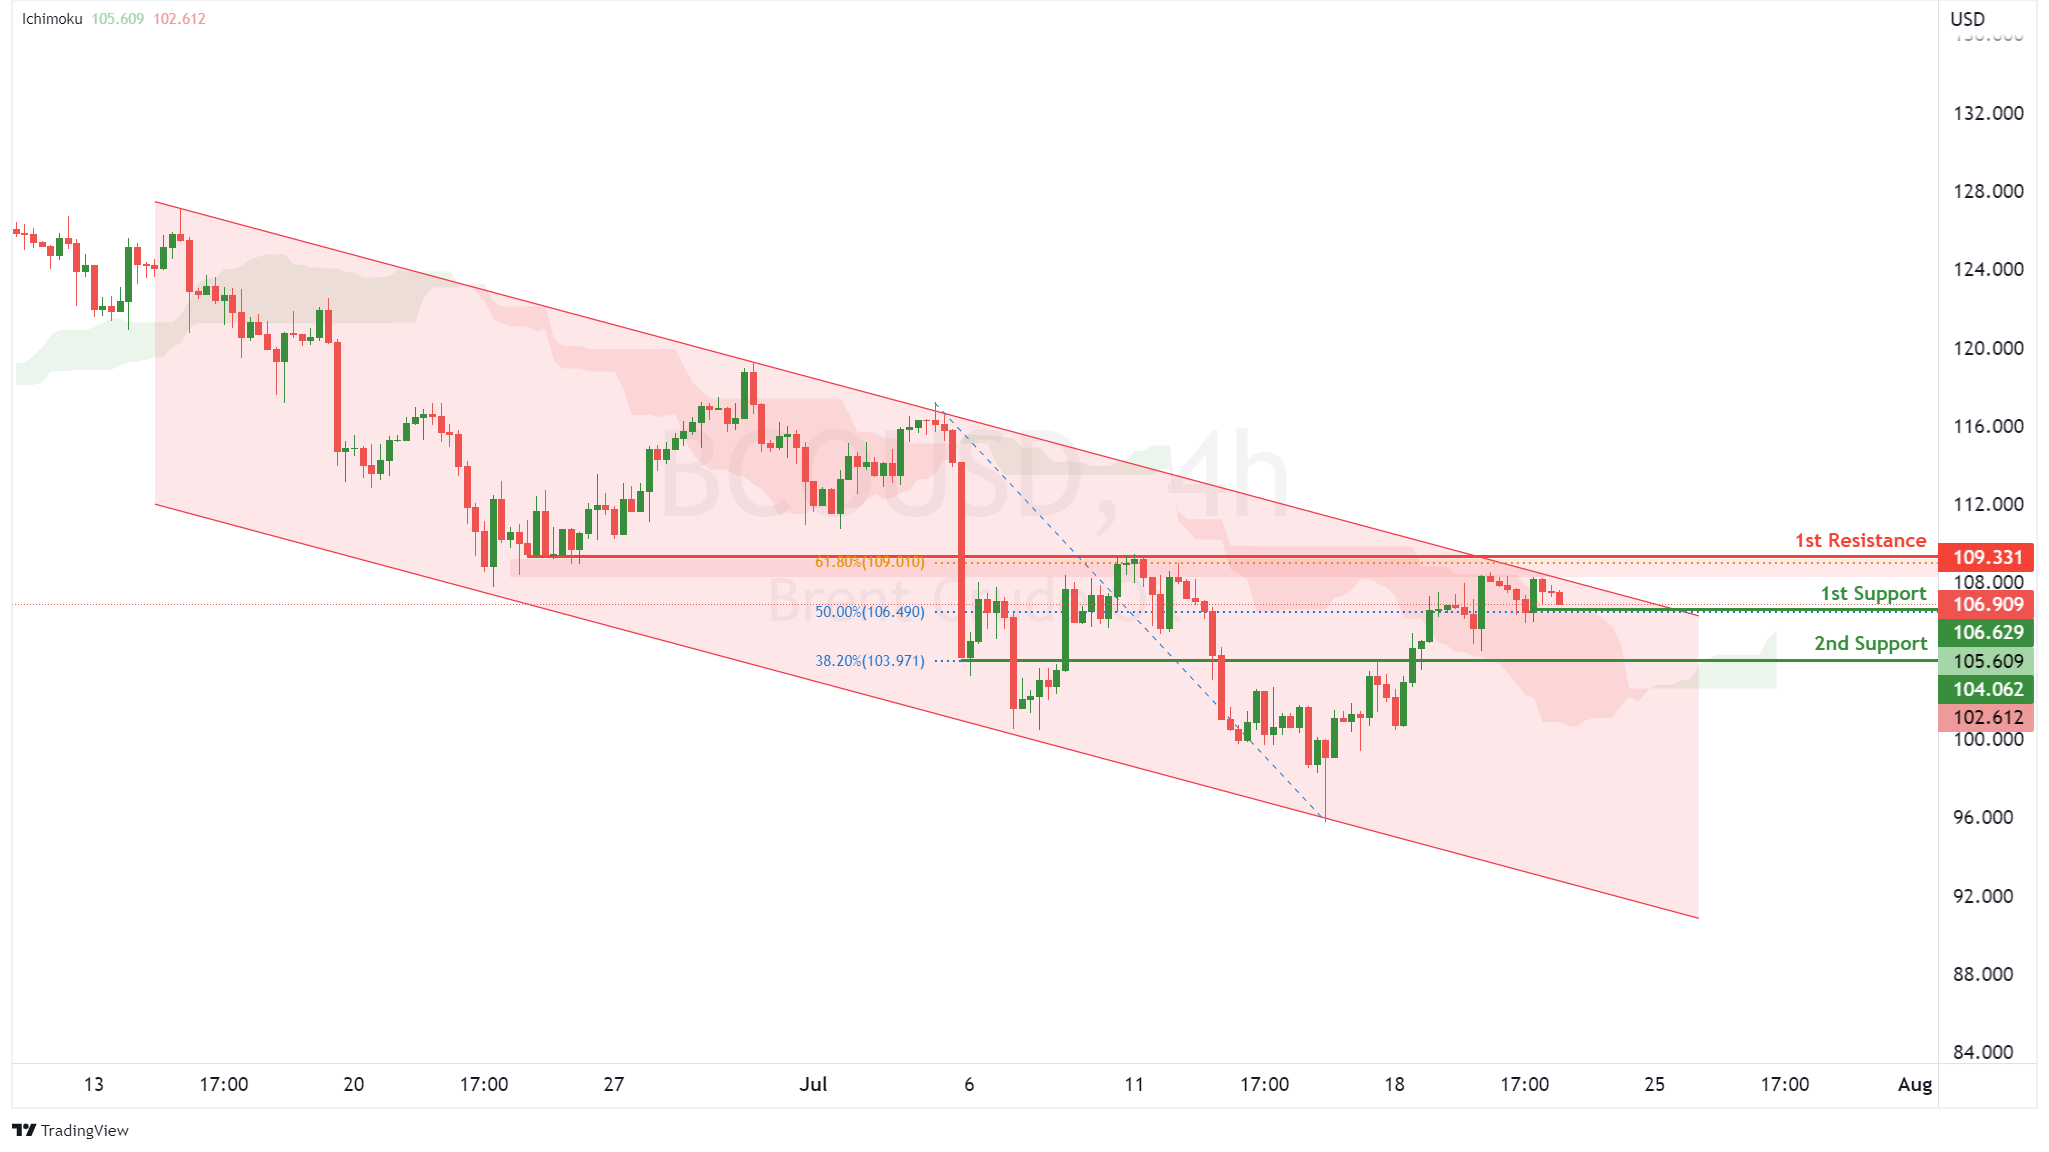
On the H4, with price moving along the descending channel and testing the overlap resistance, we have a bearish bias that price might drop from our 1st support at 106.629, which is in line with 50% retracement to 2nd support at 104.062, where the 38.2% fibonacci retracement is. Alternatively, price may rise to 1st resistance at 109.331 in line with 61.8% fibonacci retracement and overlap resistance.
Areas of consideration:
- H4 time frame, 1st support of 106.629
- H4 time frame, 2nd support of 104.062
Dow Jones Industrial Average:
On the H4, with price moving in a ascending trendline and moving above ichimoku cloud, we have a bullish bias that price might rise from our 1st support at 31787, which is in line with 141.4% fibonacci retracement to our 1st resistance at 32034, which is in line with 161.8% fibonacci retracement. Alternatively, price may reverse off the 1st support and drop to the 2nd support at 31390, which is in line with the 38.2% fibonacci retracement.
Areas of consideration:
- H4 time frame, 1st support of 31787
- H4 time frame, 1st resistance at 32034