Sample Category Title
All About Euro as ECB Rate Hike Awaited, BoJ Stands Pat
The forex markets are generally steady in Asian session today, with all major pairs and crosses stuck inside yesterday's range. BoJ's decision to stand pat on policy triggered little reaction. Instead, focus will turn to ECB, with main question on whether a 25bps hike will be delivered as pre-committed, or a bolder 50bps hike. As for the week, Aussie and Euro are currently the strongest ones while Dollar and Yen are the weakest, together with Swiss Franc. That's a reflection on relatively positive market sentiment.
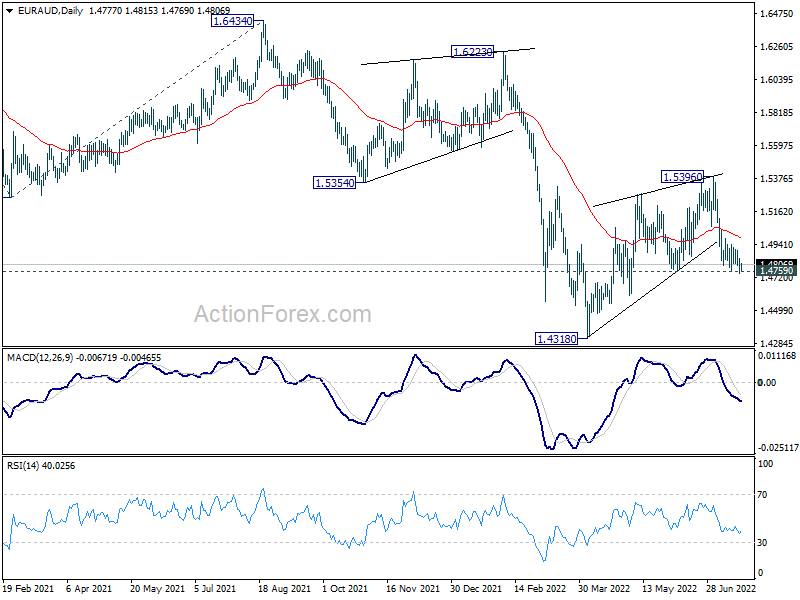
Technically, while both Euro and Aussie are firmer this week, Aussie is having a slight upper hand. Yet, it's staying above 1.4759 minor support so far. It will be an interesting pair to watch today. Strong break of 1.4759 support will retain near term bearishness in EUR/AUD, and should send it through 1.4318 support to resume larger down trend. That could be a sign of come back of Euro bears, in particular against commodity currencies.
In Asia, Nikkei closed up 0.44%. Hong Kong HSI is down -0.71%. China Shanghai SSE is down -0.40%. Singapore Strait Times is down -0.49%. Japan 10-year JGB yield is down -0.0049 at 0.239. Overnight, DOW rose 0.15%. S&P 500 rose 0.59%. NASDAQ rose 1.58%. 10-year yield rose 0.017 to 3.036.
BoJ stands part, downgrades 2022 growth forecasts, upgrades inflation
BoJ left monetary policy unchanged today as widely expected. Under the yield curve control frame work, short-term policy rate is held at -0.10%. BoJ will also will continue to purchase JGBs, without setting upper limit, to keep 10-year yield at around 0%. It will continue to offer to purchase 10-year JGBs at 0.25% yield every business day through fixed rate operations. Goushi Kataoka dissented again, pushing for further strengthening monetary easing.
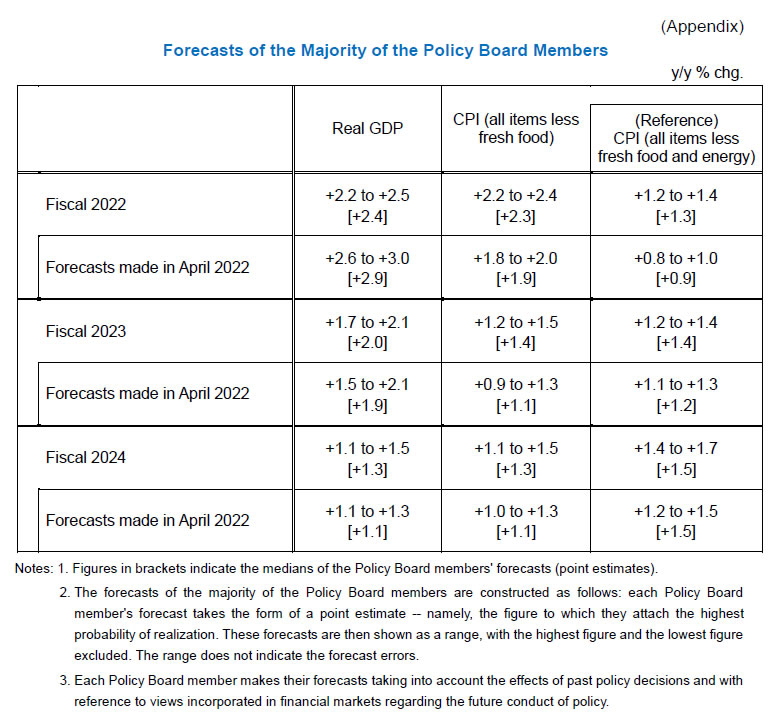
In the new economic projections, BoJ downgraded fiscal 2022 GDP forecasts, but upgraded both fiscal 2023 and 2024. CPI forecasts was upgraded across the horizon. Here are the new projections.
- Fiscal 2022 GDP growth at 2.4% (downgraded from April's 2.9%).
- Fiscal 2023 GDP growth at 2.0% (up from 1.9%).
- Fiscal 2024 GDP growth at 1.3% (up from 1.1%).
- Fiscal 2022 CPI at 2.3% (up from 1.9%).
- Fiscal 2023 CPI at 1.4% (up from 1.1%).
- Fiscal 2024 CPI at 1.3% (up from 1.1%).
- Fiscal 2022 CPI core-core (ex-fresh food and energy) at 1.3% (up from 0.9%).
- Fiscal 2023 CPI core-core at 1.4% (up from 1.2%).
- Fiscal 2024 CPI core core at 1.5% (unchanged).
New Zealand good imports jumped 25% yoy on petroleum, imports rose 7.7% yoy
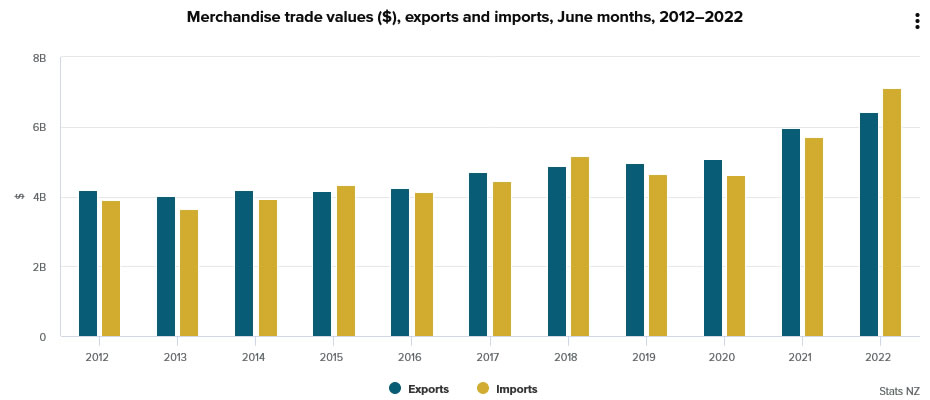
New Zealand goods exports rose 7.7% yoy to NZD 6.4B in June. Goods imports rose 25.0% yoy to NZD 7.1B. Trade balance came in at NZD -701m deficit, versus expectation of NZD 204m surplus.
"Petroleum and products imports rose $795 million to reach a new high of $1.2 billion," Stats NZ. "This rise lead the sharp increase in total imports for the month compared with June 2021."
US leads monthly export rise, up 22%. Exports to EU were up 28% and Japan up 24%. Exports to China were down -6% and to Australia down -12%.
Import form all top partners rose, with China up 12%, EU up 11%, Australia up 6%, US up 30%, and Japan up 4.1%.
Australia NAB business condition rose to 20 in Q2, but confidence dropped to 5
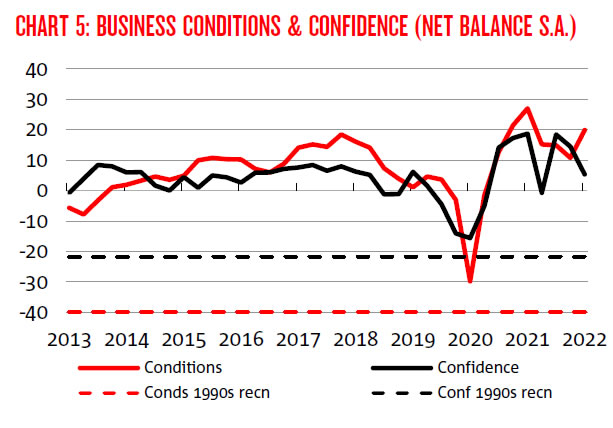
Australia NAB quarterly business confidence dropped from 15 to 5 in Q2. Current business conditions rose from 11 to 20. Next 3 months business conditions was unchanged at 26. next 12 months business conditions dropped from 34 to 29. Capex plan for next 12 months dropped from 33 to 31.
Alan Oster, NAB Group Chief Economist, "Conditions strengthened in Q2 as the disruptions related to the virus receded. Trading, profitability, and employment were all higher with conditions approaching the high levels seen in early 2021."
"Confidence eased in Q2, down to around long-run average levels," said Oster. "That likely reflects the waning of some of the pandemic-recovery optimism, as well as the mounting challenges of rising inflation and also rising interest rates that businesses are confronting."
ECB to hike by 25bps or 50bps? EUR/CHF to head back to parity?
ECB will finally raise interest rates for the first time in 11 years today. Opinions are divided on whether ECB would hike by 25bps as pre-committed, or opt for a larger 50bps hike this time. In addition to this question, markets will be eager to get any guidance for the size of hike in September, and any indication for October.
Here are some previews on ECB:
- ECB to Hike Rates Amid Energy Worries, Anti-Fragmentation Tool Eyed as Euro Bounces Back
- ECB Preview: Markets Bet on 50 bp Hike
- ECB Preview – We Have Lift Off
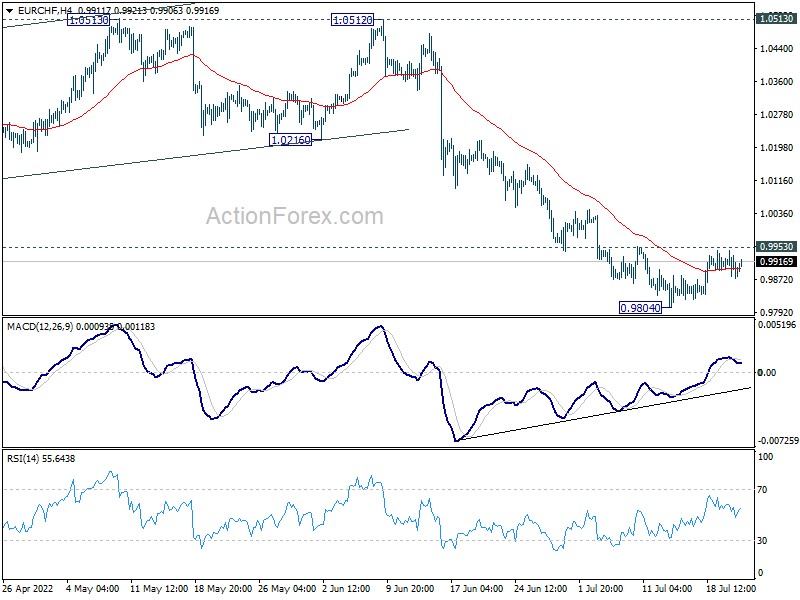
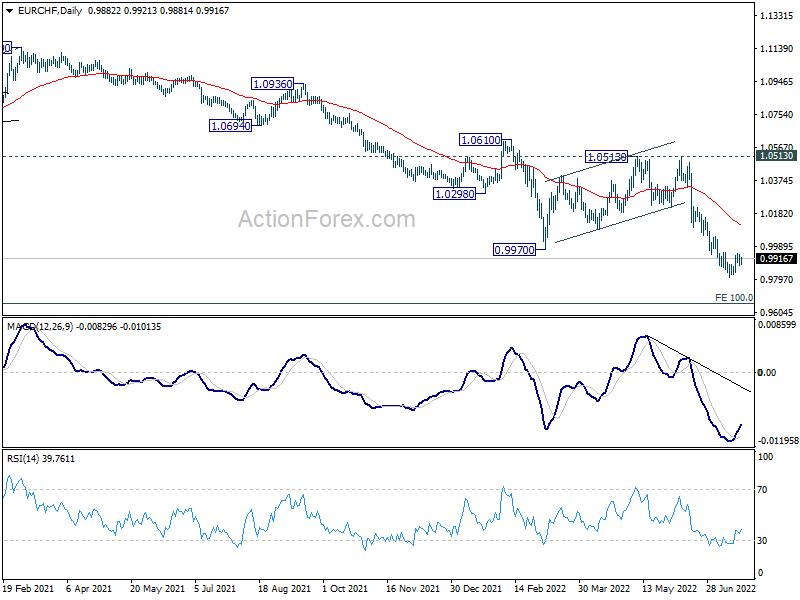
EUR/CHF is holding steady in range above 0.9804 temporary low. For now, outlook stays bearish with 0.9953 minor resistance intact. Downside breakout remains in favor. However, downside momentum has been clearly diminishing as seen in 4 hour MACD. Firm break of 0.9953 will bring stronger rebound back to 55 day EMA (now at 1.0109), that is, back above parity.
Elsewhere
Canada new housing price index will be released in US session. US will publish jobless claims and Philly Fed survey.
EUR/USD Daily Outlook
Daily Pivots: (S1) 1.0135; (P) 1.0204; (R1) 1.0252; More...
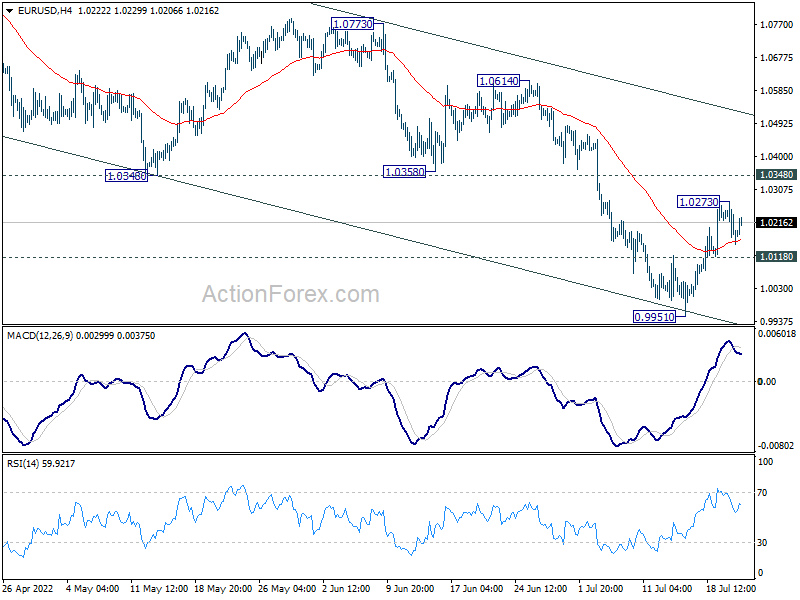
EUR/USD lost some upside momentum after hitting 1.0273 and intraday bias is turned neutral first. On the upside, above 1.0273 will resume the rebound form 0.9951 to 1.0348 support turned resistance, and then channel resistance at 1.0514. Nevertheless, break of 1.0118 minor support will argue that larger down trend is ready to resume, and should bring retest of 0.9951 low first.
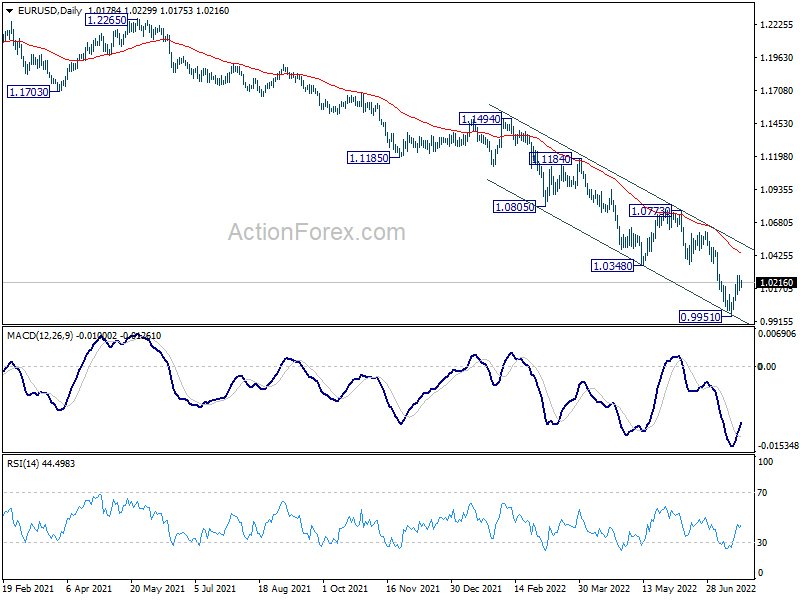
In the bigger picture, down trend from 1.6039 (2008 high) is still in progress. Next target is 100% projection of 1.3993 to 1.0339 from 1.2348 at 0.8694. In any case, outlook will stay bearish as long as 1.0773 resistance holds, in case of rebound.
Economic Indicators Update
| GMT | Ccy | Events | Actual | Forecast | Previous | Revised |
|---|---|---|---|---|---|---|
| 22:45 | NZD | Trade Balance (NZD) Jun | -701M | 240M | 263M | 195M |
| 23:50 | JPY | Trade Balance (JPY) Jun | -1.93T | -2.01T | -1.93T | -1.89T |
| 01:30 | AUD | NAB Business Confidence Q2 | 5 | 14 | 15 | |
| 03:00 | JPY | BoJ Interest Rate Decision | -0.10% | -0.10% | -0.10% | |
| 06:00 | GBP | Public Sector Net Borrowing (GBP) Jun | 22.1B | 21.3B | 13.2B | 11.8B |
| 12:15 | EUR | ECB Interest Rate Decision | 0.25% | 0.00% | ||
| 12:30 | CAD | New Housing Price Index M/M Jun | 0.40% | 0.50% | ||
| 12:30 | USD | Initial Jobless Claims (Jul 15) | 240K | 244K | ||
| 12:30 | USD | Philadelphia Fed Manufacturing Survey Jul | -0.5 | -3.3 | ||
| 12:45 | EUR | ECB Press Conference | ||||
| 14:30 | USD | Natural Gas Storage | 45B | 58B |
ECB to hike by 25bps or 50bps? EUR/CHF to head back to parity?
ECB will finally raise interest rates for the first time in 11 years today. Opinions are divided on whether ECB would hike by 25bps as pre-committed, or opt for a larger 50bps hike this time. In addition to this question, markets will be eager to get any guidance for the size of hike in September, and any indication for October.
Here are some previews on ECB:
- ECB to Hike Rates Amid Energy Worries, Anti-Fragmentation Tool Eyed as Euro Bounces Back
- ECB Preview: Markets Bet on 50 bp Hike
- ECB Preview – We Have Lift Off
EUR/CHF is holding steady in range above 0.9804 temporary low. For now, outlook stays bearish with 0.9953 minor resistance intact. Downside breakout remains in favor. However, downside momentum has been clearly diminishing as seen in 4 hour MACD. Firm break of 0.9953 will bring stronger rebound back to 55 day EMA (now at 1.0109), that is, back above parity.
BoJ stands part, downgrades 2022 growth forecasts, upgrades inflation
BoJ left monetary policy unchanged today as widely expected. Under the yield curve control frame work, short-term policy rate is held at -0.10%. BoJ will also will continue to purchase JGBs, without setting upper limit, to keep 10-year yield at around 0%. It will continue to offer to purchase 10-year JGBs at 0.25% yield every business day through fixed rate operations. Goushi Kataoka dissented again, pushing for further strengthening monetary easing.
In the new economic projections, BoJ downgraded fiscal 2022 GDP forecasts, but upgraded both fiscal 2023 and 2024. CPI forecasts was upgraded across the horizon. Here are the new projections.
- Fiscal 2022 GDP growth at 2.4% (downgraded from April's 2.9%).
- Fiscal 2023 GDP growth at 2.0% (up from 1.9%).
- Fiscal 2024 GDP growth at 1.3% (up from 1.1%).
- Fiscal 2022 CPI at 2.3% (up from 1.9%).
- Fiscal 2023 CPI at 1.4% (up from 1.1%).
- Fiscal 2024 CPI at 1.3% (up from 1.1%).
- Fiscal 2022 CPI core-core (ex-fresh food and energy) at 1.3% (up from 0.9%).
- Fiscal 2023 CPI core-core at 1.4% (up from 1.2%).
- Fiscal 2024 CPI core core at 1.5% (unchanged).
Australia NAB business condition rose to 20 in Q2, but confidence dropped to 5
Australia NAB quarterly business confidence dropped from 15 to 5 in Q2. Current business conditions rose from 11 to 20. Next 3 months business conditions was unchanged at 26. next 12 months business conditions dropped from 34 to 29. Capex plan for next 12 months dropped from 33 to 31.
Alan Oster, NAB Group Chief Economist, "Conditions strengthened in Q2 as the disruptions related to the virus receded. Trading, profitability, and employment were all higher with conditions approaching the high levels seen in early 2021."
"Confidence eased in Q2, down to around long-run average levels," said Oster. "That likely reflects the waning of some of the pandemic-recovery optimism, as well as the mounting challenges of rising inflation and also rising interest rates that businesses are confronting."
New Zealand good imports jumped 25% yoy on petroleum, imports rose 7.7% yoy
New Zealand goods exports rose 7.7% yoy to NZD 6.4B in June. Goods imports rose 25.0% yoy to NZD 7.1B. Trade balance came in at NZD -701m deficit, versus expectation of NZD 204m surplus.
"Petroleum and products imports rose $795 million to reach a new high of $1.2 billion," Stats NZ. "This rise lead the sharp increase in total imports for the month compared with June 2021."
US leads monthly export rise, up 22%. Exports to EU were up 28% and Japan up 24%. Exports to China were down -6% and to Australia down -12%.
Import form all top partners rose, with China up 12%, EU up 11%, Australia up 6%, US up 30%, and Japan up 4.1%.
Technical Outlook and Review
DXY:
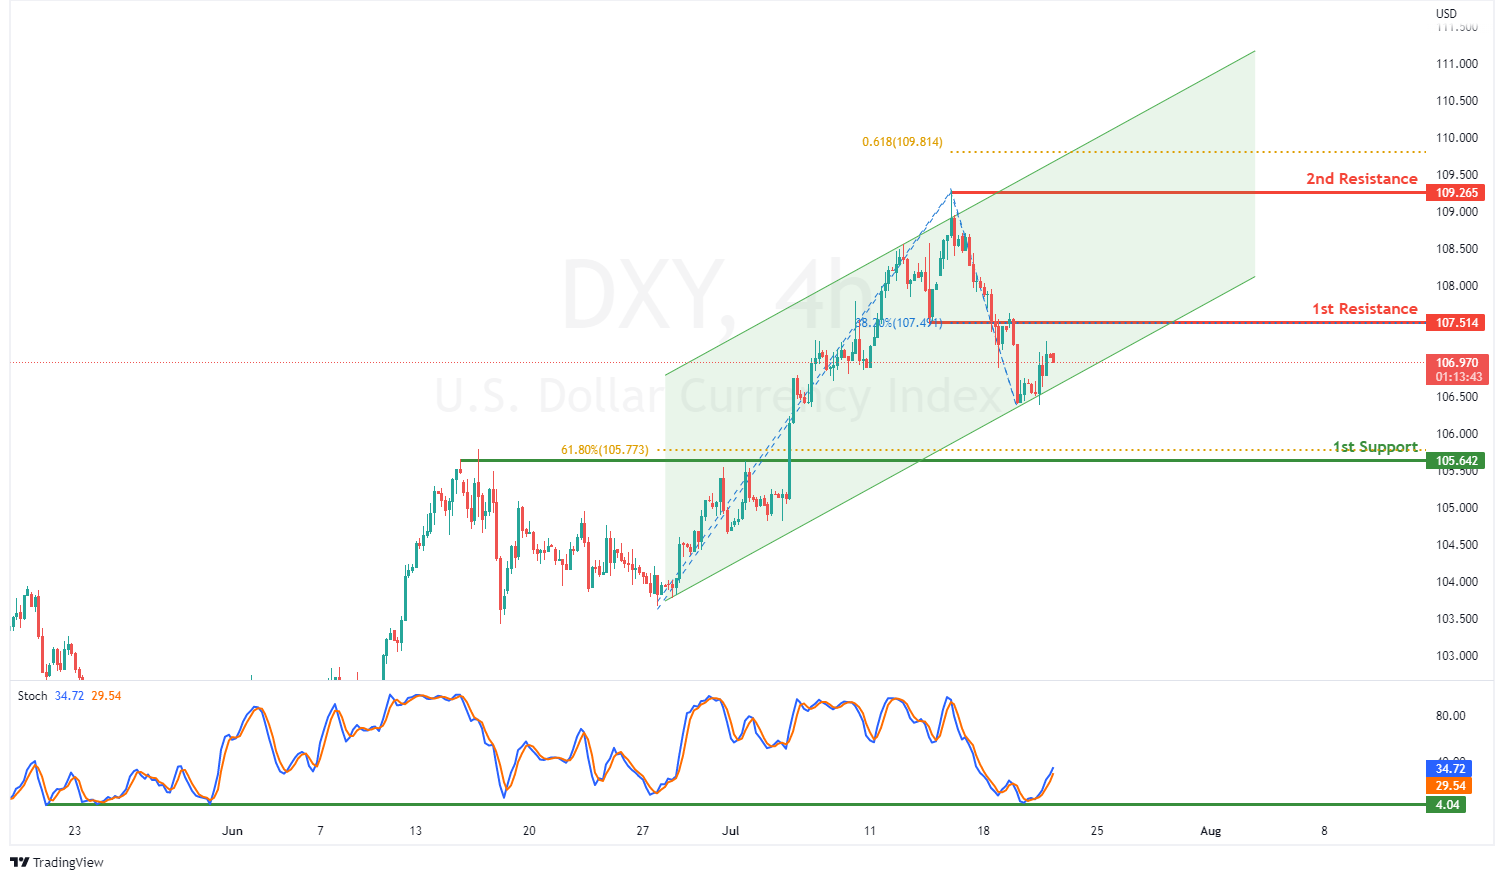
On the H4, with prices moving within the ascending channel and bouncing off the stochastic support, we have a bullish bias that prices will rise to the 1st resistance at 107.514 where the 38.2% fibonacci retracement and pullback resistance are. Once there is upside confirmation of price breaking the 1st resistance structure, we would expect bullish momentum to carry price to 2nd resistance at 109.265 where the swing high resistance and 61.8% fibonacci projection are. Alternatively, prices could drop to 1st support at 105.642 in line with overlap support and 61.8% fibonacci retracement.
Areas of consideration:
- H4 time frame, 1st resistance at 107.514
- H4 time frame, 1st support at 105.642
XAU/USD (GOLD):
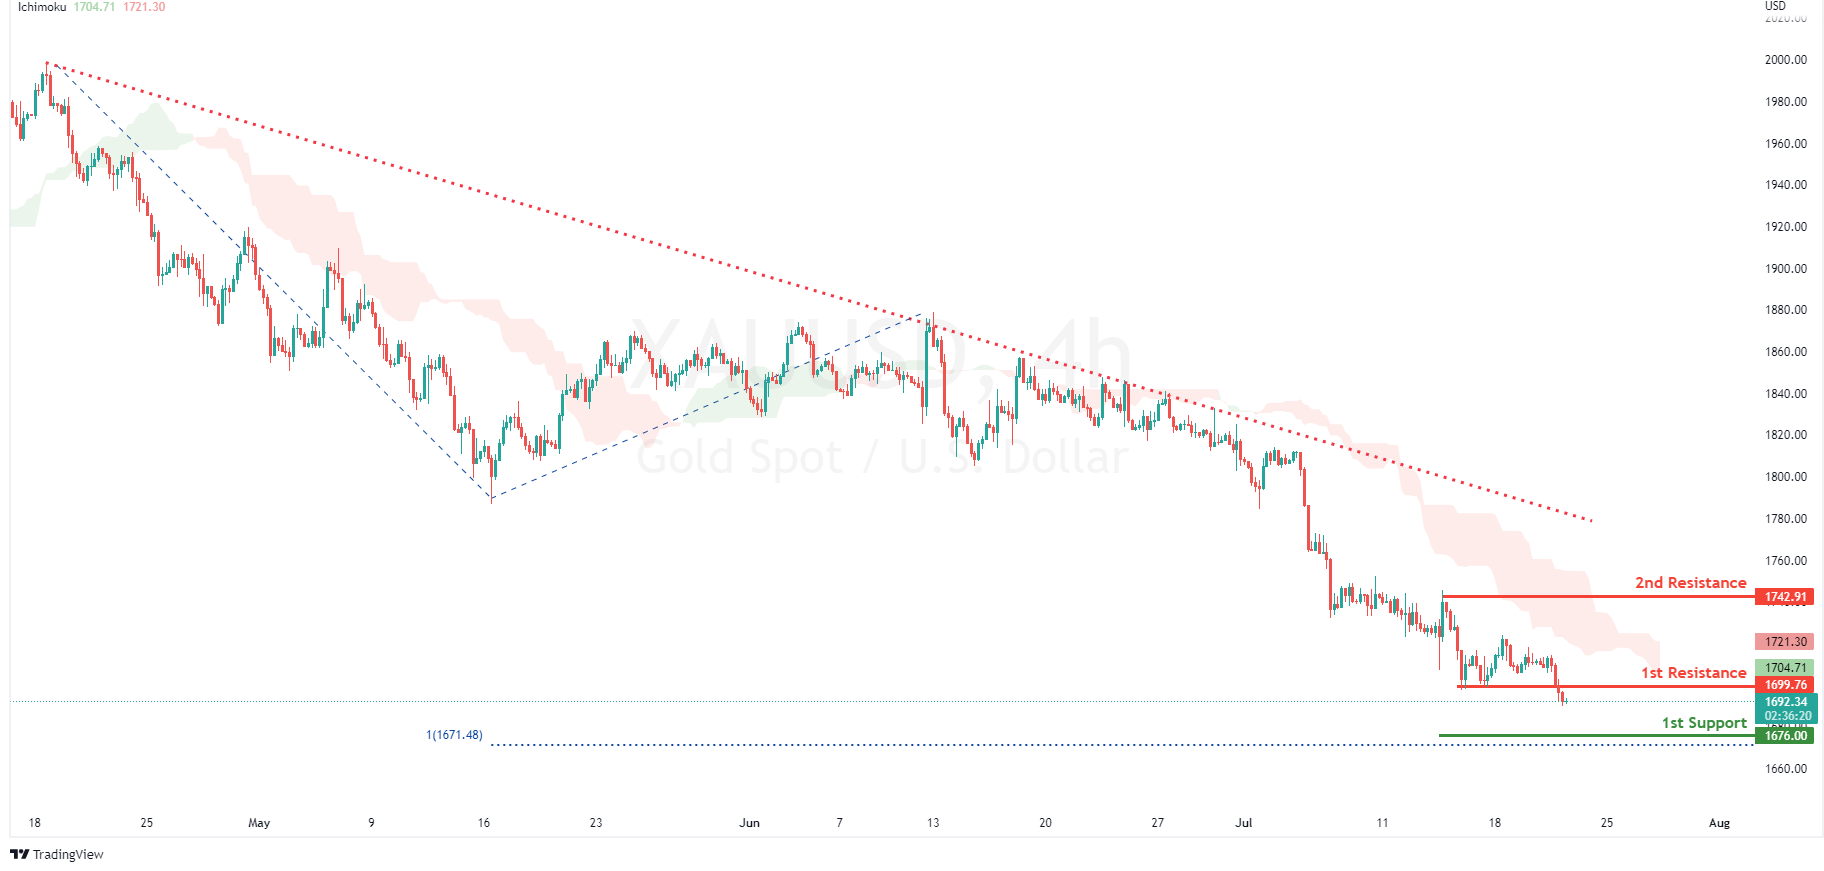
On the H4, with price moving below the ichimoku cloud and in a descending trendline, we have a bearish bias that price will rise and drop from the 1st resistance at 1699.76 where the pullback support is to the 1st support at 1676.00 in line with the 100% fibonacci projection and swing low support on the daily timeframe. Alternatively, price could break 1st resistance structure on the upside and we would expect bullish momentum to carry prices to 2nd resistance at 1742.91 where the swing high resistance is.
Areas of consideration:
- H4 time frame, 1st Resistance at 1699.76
- H4 time frame, 1st Support at 1676.00
GBP/USD:
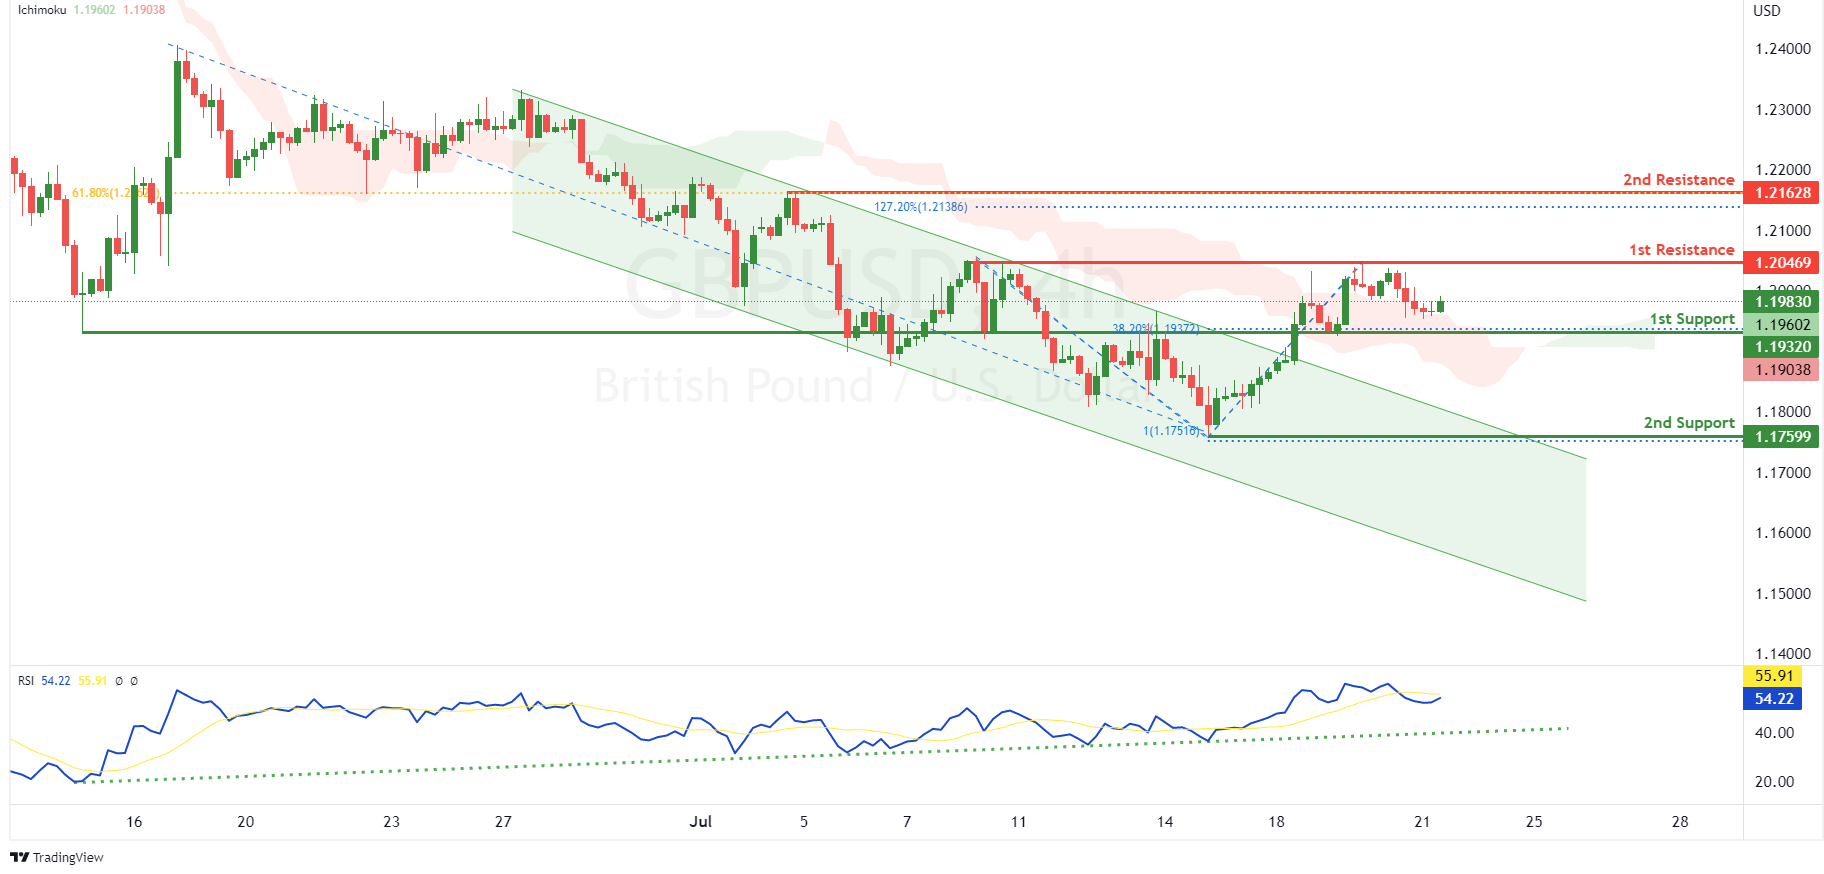
On the H4, with prices bouncing off the ichimoku indicator, RSI moving in an ascending trendline and price has broken out of the descending channel, we have a bullish bias that price will rise to the 1st resistance at 1.20469 where the swing high resistance is. Once there is upside confirmation that price has broken the 1st resistance, we would expect bullish momentum to carry prices to 2nd resistance at 1.21628 where the swing high resistance, 61.8% fibonacci retracement and 127.2% fibonacci extension are. Alternatively, price could drop to the 1st support at 1.19320 where the pullback support and 38.2% fibonacci retracement are. Should price break 1st support, we would have a bearish bias that price will drop to 2nd support at 1.17599 in line with swing low support and 100% fibonacci projection.
Areas of consideration:
- H4 1st resistance at 1.20469
- H4 1st support at 1.19320
USD/CHF:
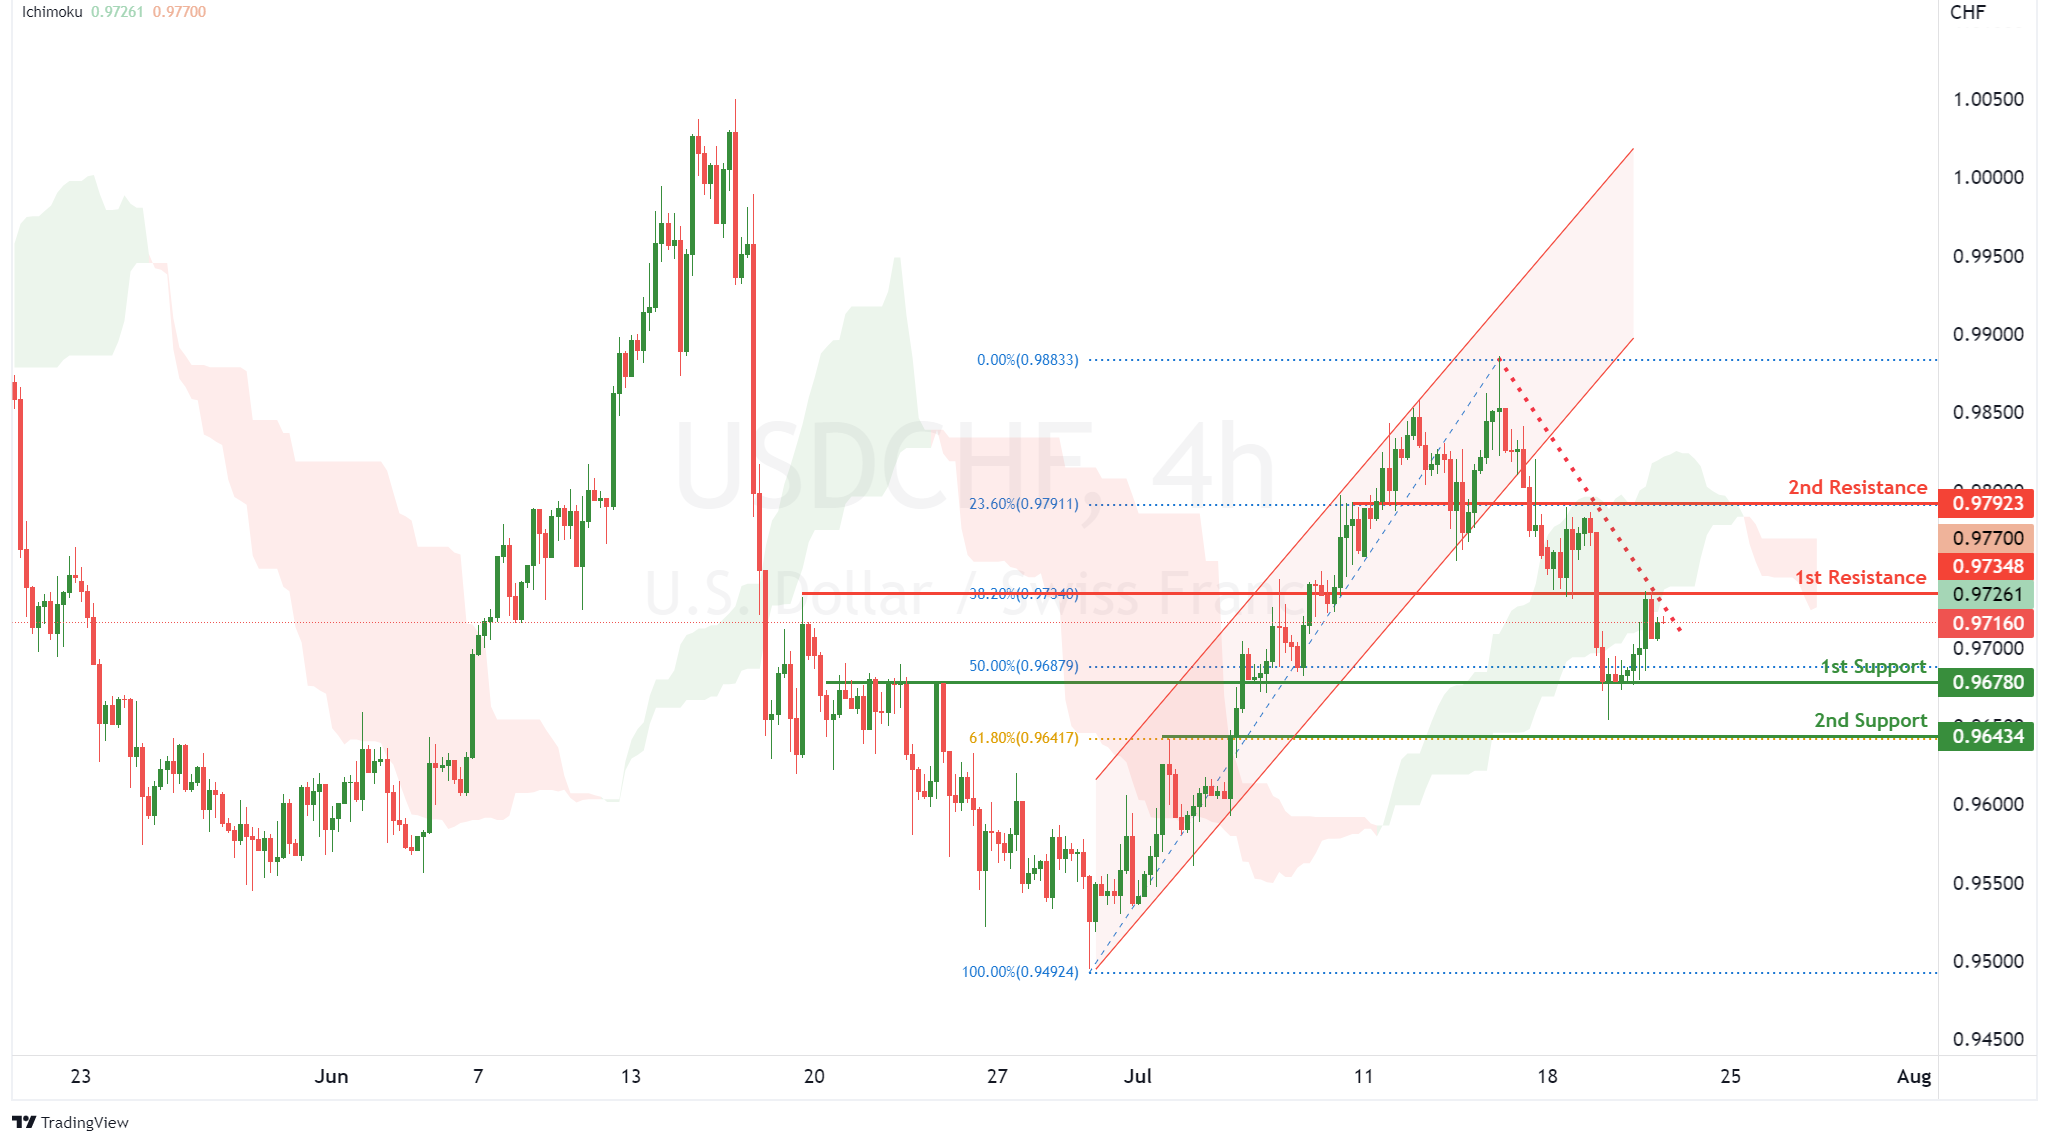
On the H4, with price breaking the bullish channel, moving along the descending channel and crossing over the the ichimoku indicator, we have a bearish bias that price might drop from our 1st resistance at 0.97348 where the pullback resistance is to our 1st support at 0.96780, which is in line with the 50% fibonacci retracement. If the price continues going down, the price may drop to our 2nd support at 0.96434, which is in line with 61.8% fibonacci retracement. Alternatively, price may break 1st resistance and head for 2nd resistance at 0.97923 where the 23.6% fibonacci retracement is.
Areas of consideration
- 1st resistance level at 0.97348
- 1st support level at 0.96780
EUR/USD :
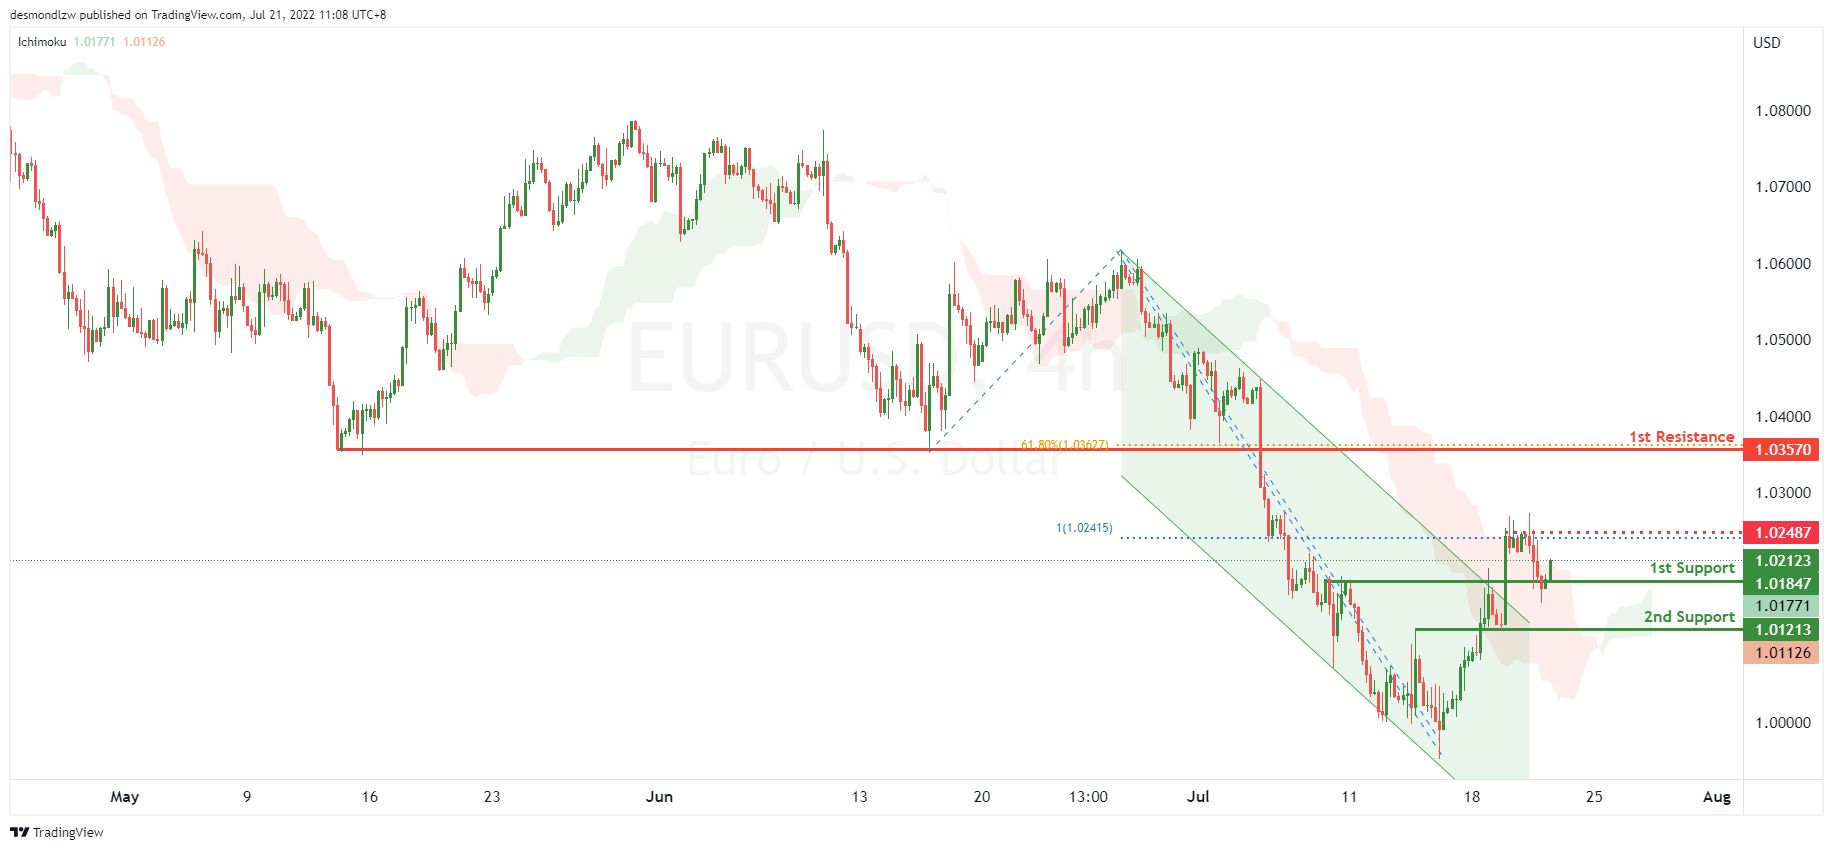
On the H4, with price moving above the ichimoku cloud and breaking out of the descending trend channel, we have a bullish bias that price will continue to rise from the 1st support at 1.01847 at the overlap support. If price breaks above the intermediary resistance at 1.02487 in line with the 100% fibonacci projection, we have upside confirmation that price will continue to rise to the 1st resistance at 1.03570 at the pullback resistance in line with the 61.8% fibonacci retracement. Alternatively, price may reverse off the 1st support and drop to the 2nd support at 1.01213 at the overlap support.
Areas of consideration :
- H4 1st resistance at 1.03570
- H4 1st support at 1.01920
USD/JPY:
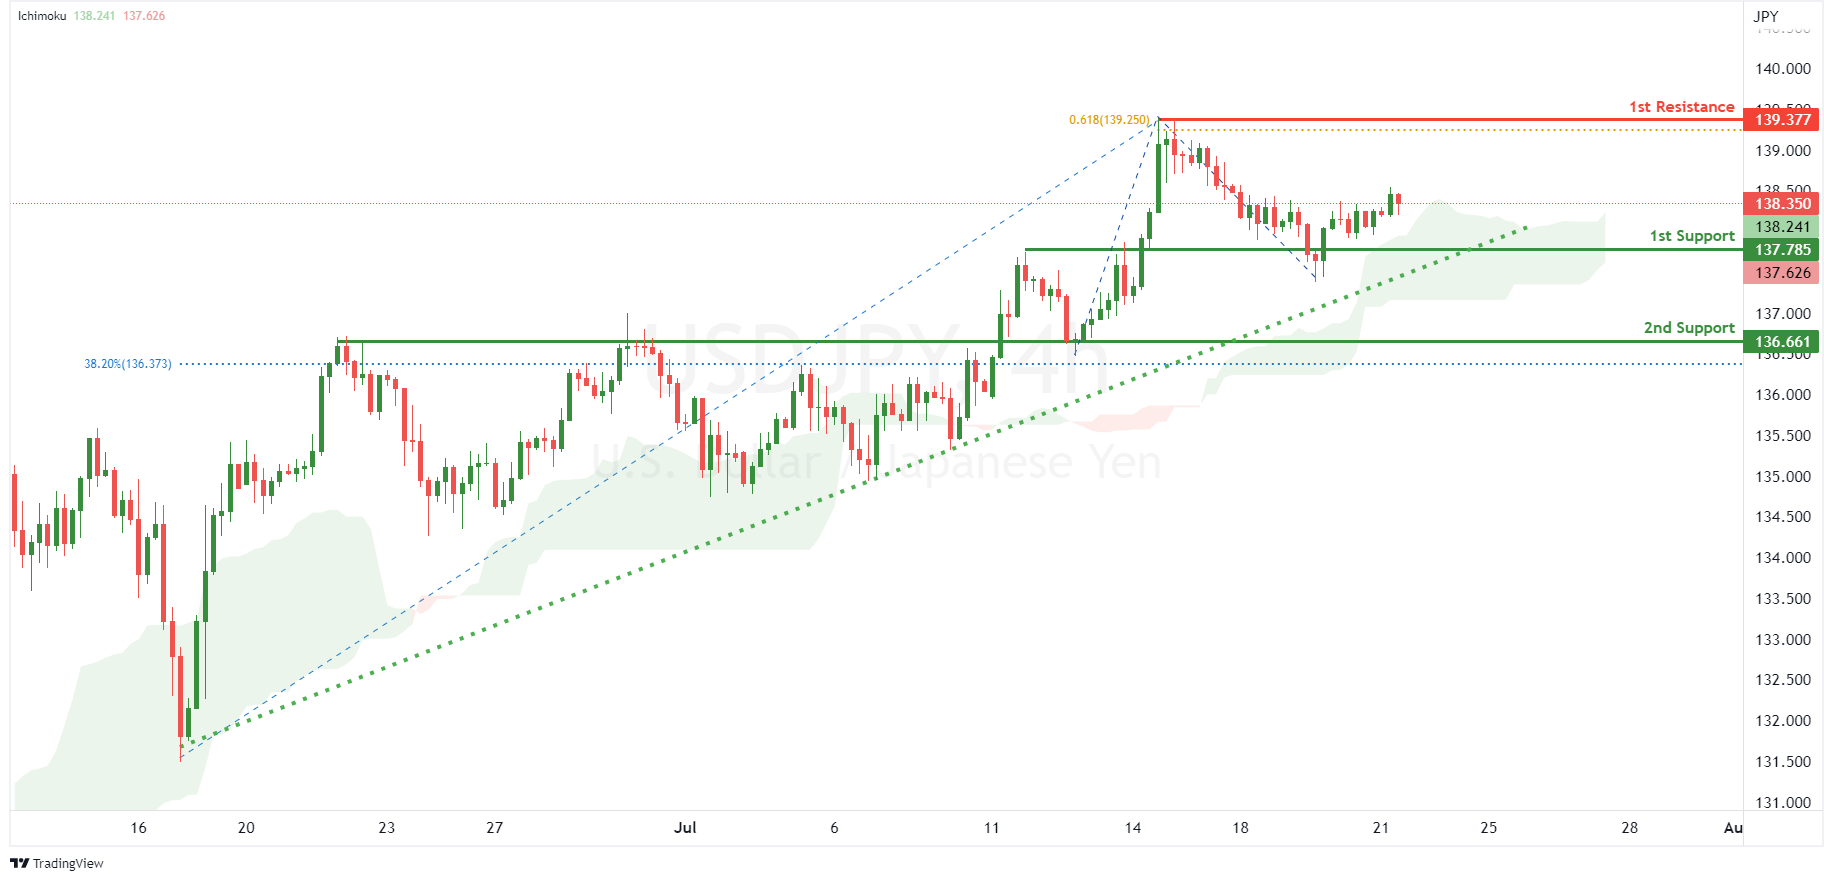
On the H4, with price moving above the ichimoku indicator and along the ascending trendline, we have a bullish bias that price will rise to our 1st resistance at 139.377 where the 61.8% fibonacci projection and swing high resistance are from our 1st support at 137.785 in line with pullback support. Alternatively, prices could break 1st support structure and drop to 2nd support at 136.661 where the overlap support and 38.2% fibonacci retracement are.
Areas of consideration:
- H4 time frame, 1st resistance at 139.377
- H4 time frame, 1st support at 137.785
AUD/USD:
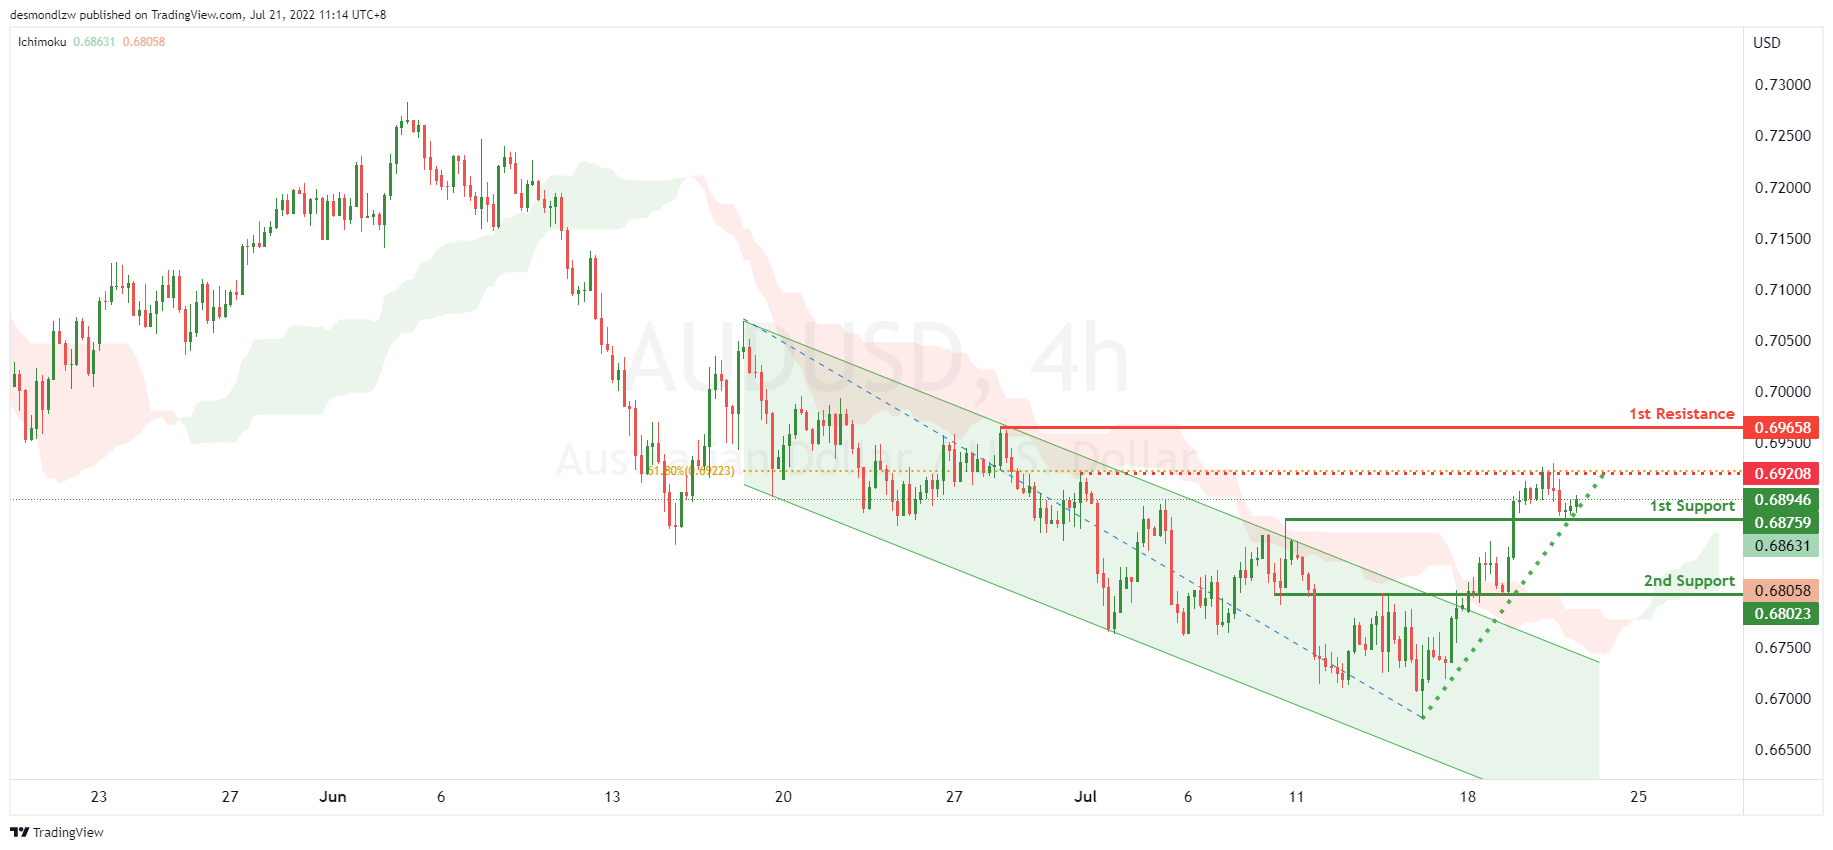
On the H4, with price moving above the ichimoku cloud, moving in an ascending support and breaking out of the descending trend channel, we have a bullish bias that price will rise from the 1st resistance at 0.68759 at the overlap resistance. If price rises and breaks the intermediary resistance at 0.69213 in line with the 61.8% fibonacci retracement, we will have upside confirmation that price will continue to rise to the 2nd resistance at 0.69658 at the swing high. Alternatively, price may reverse off the 1st resistance and drop to the 1st support at 0.68023 at the overlap support.
Areas of consideration
- H4 1st resistance at 0.68759
- H4 1st support at 0.68023
NZD/USD:
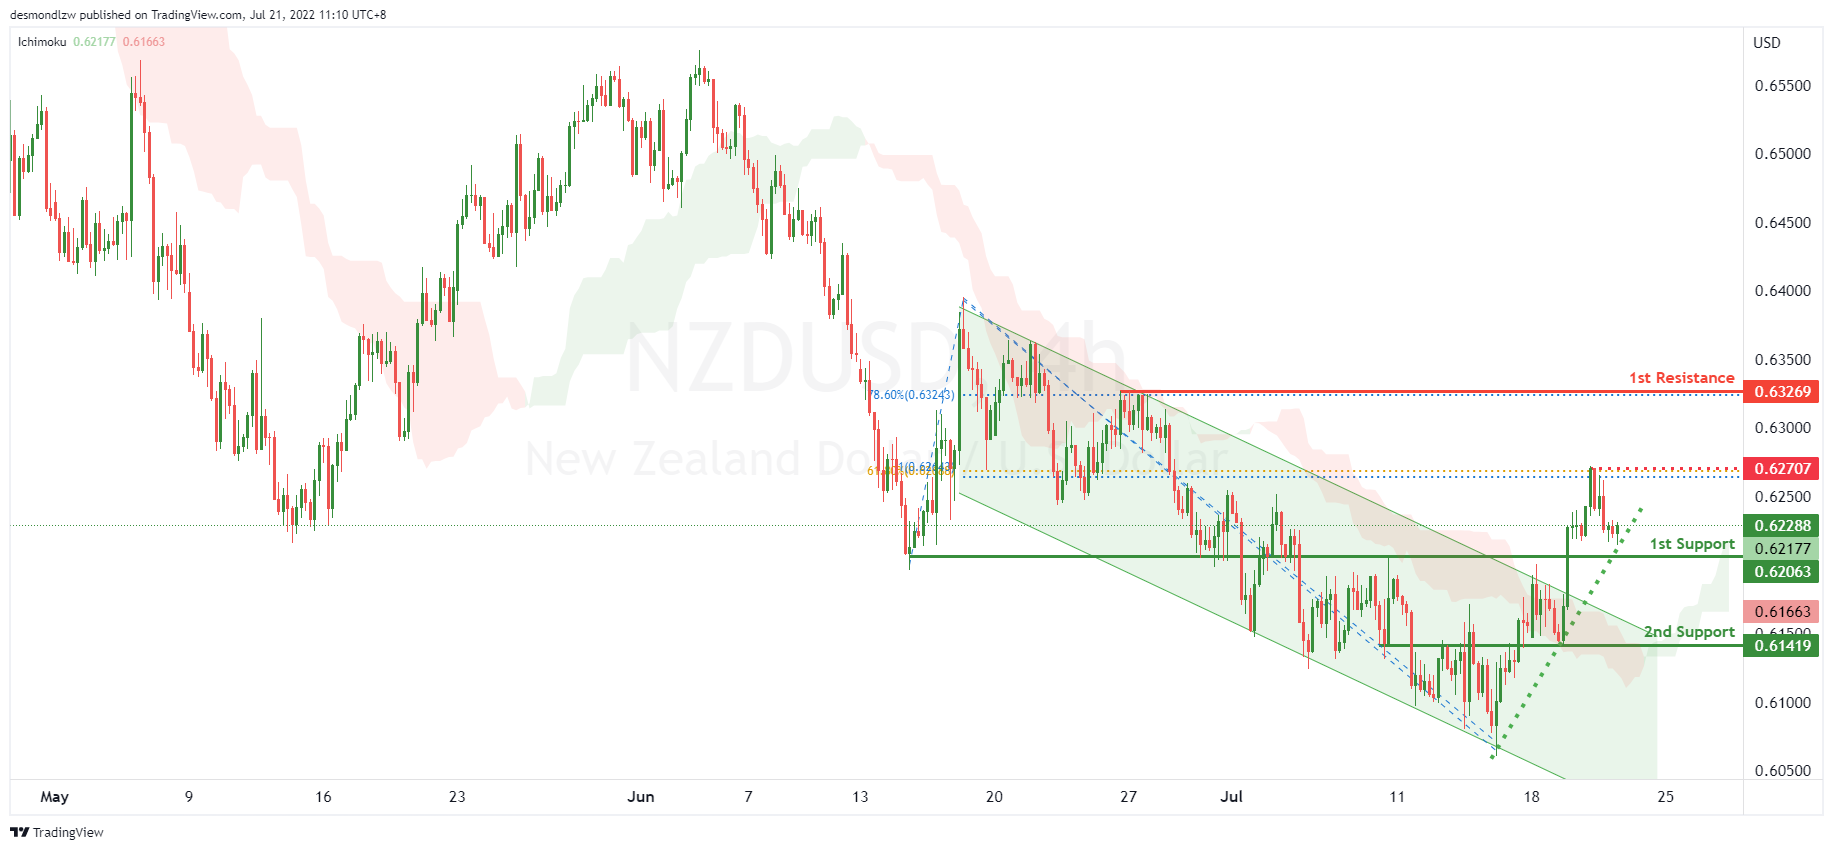
On the H4, with price recently breaking the descending trend channel, short term ascending support and moving above the ichimoku cloud, we have a bullish bias that price will rise from the 1st support at 0.62177 at the overlap support. If price breaks the intermediary resistance at 0.62707 at the swing high in line with the 61.8% fibonacci retracement and 100% fiboancci projection, we will have upside confirmation that price will rise to the 1st resistance at 0.63269 at the swing high in line with the 78.6% fibonacci retracement. Alternatively, price may break the support structure at the 1st support and drop to the 2nd support at 0.61419 at the pullback support.
Areas of consideration:
- H4 time frame, 1st support at 0.62177
- H4 time frame, 1st resistance at 0.63269
USD/CAD:
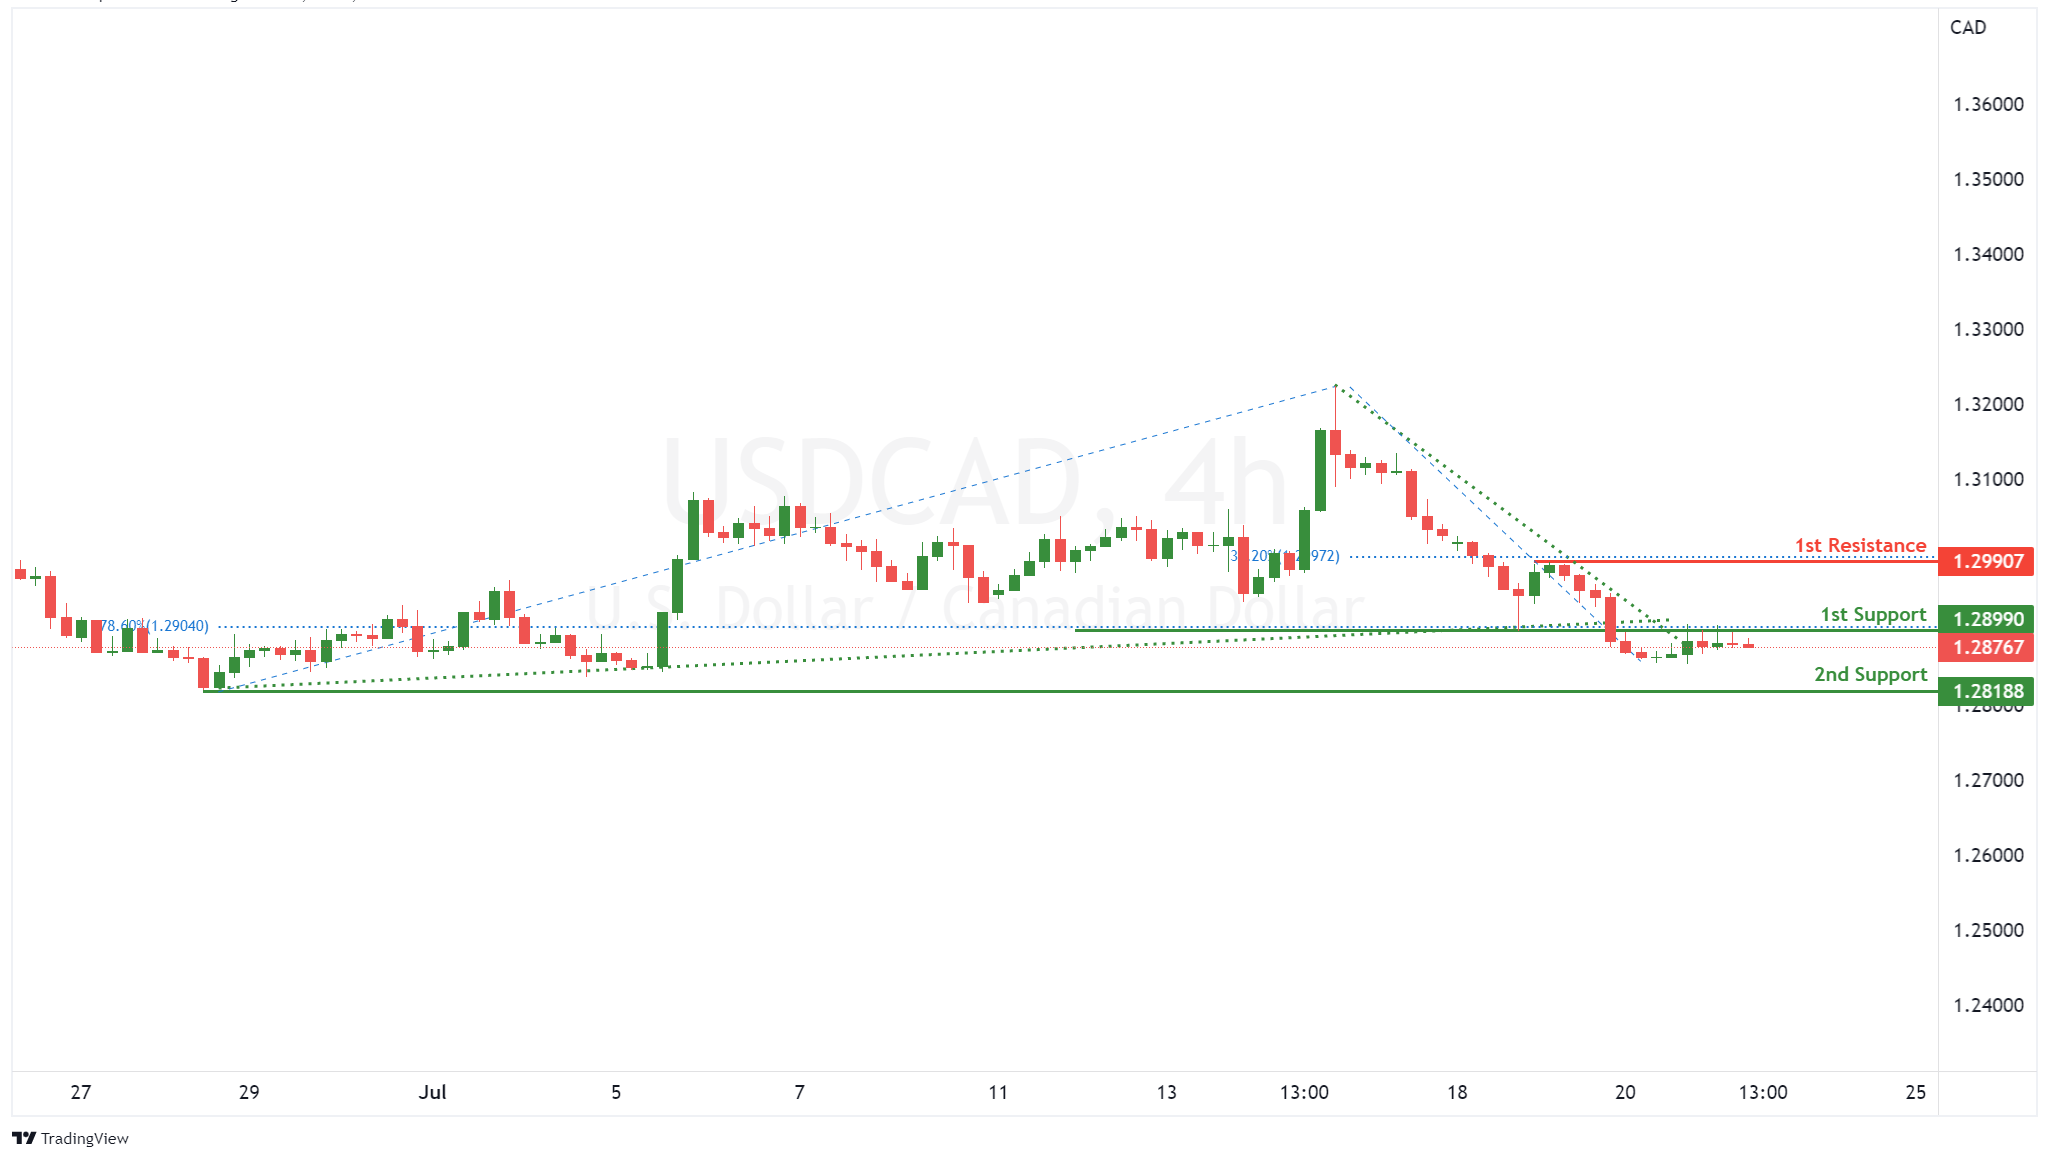
On the H4, prices seem to be range bound although it broke the key resistance level at 1.307. It came back down forming a descending trend with a bearish bias currently testing at the 50% fibonacci retracement level. If prices break 1.285 level, it may pullback further to test at the 61.8% fibonacci retracement level. Alternatively if price bounces off this support level, it may look to test at the next key level at 61.8% fibonacci retracement
Areas of consideration:
- H4 time frame, 2nd support at 1.2780
- H4 time frame, 1st support at 1.2873
OIL:
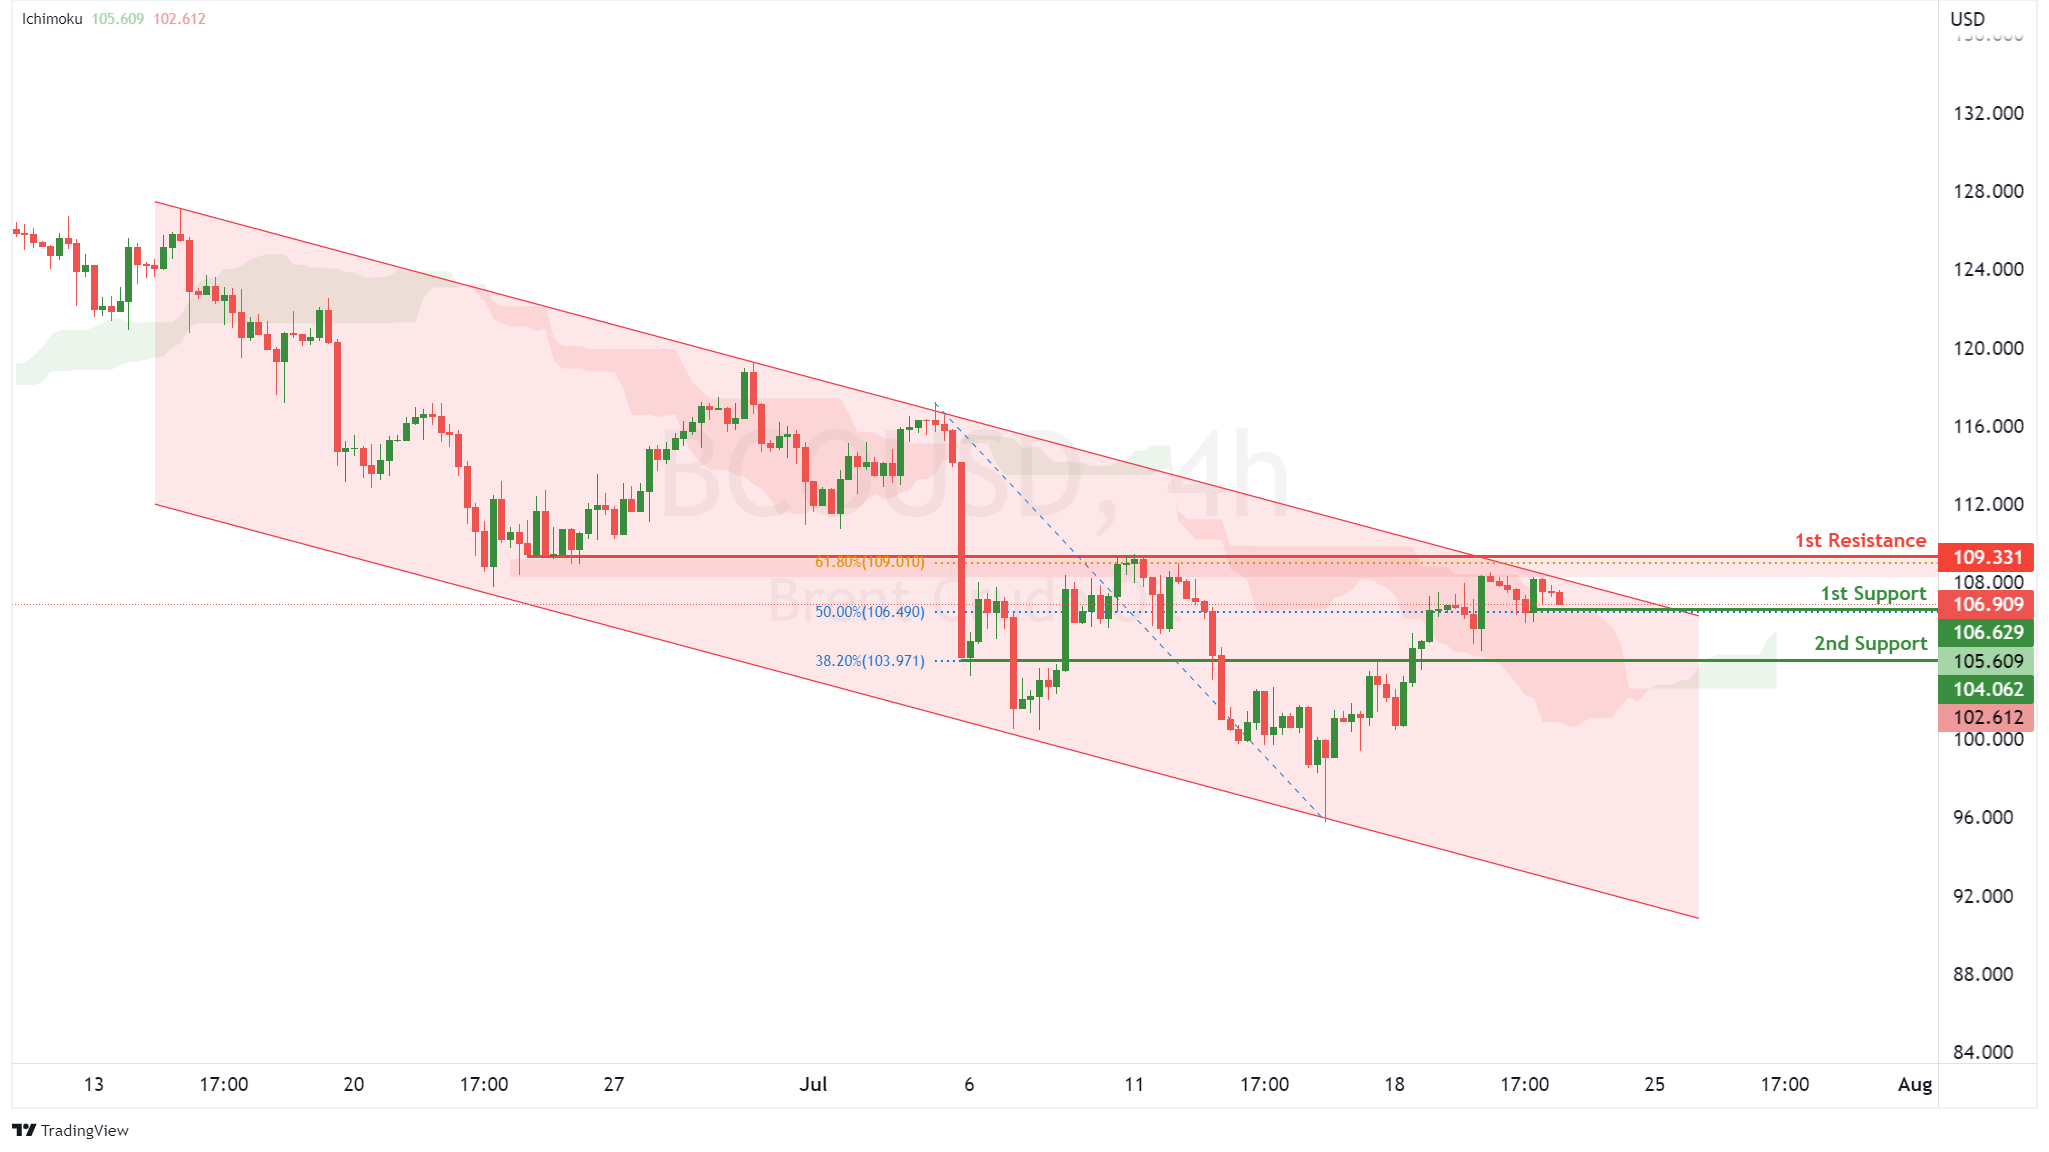
On the H4, with price moving along the descending channel and testing the overlap resistance, we have a bearish bias that price might drop from our 1st support at 106.629, which is in line with 50% retracement to 2nd support at 104.062, where the 38.2% fibonacci retracement is. Alternatively, price may rise to 1st resistance at 109.331 in line with 61.8% fibonacci retracement and overlap resistance.
Areas of consideration:
- H4 time frame, 1st support of 106.629
- H4 time frame, 2nd support of 104.062
Dow Jones Industrial Average:
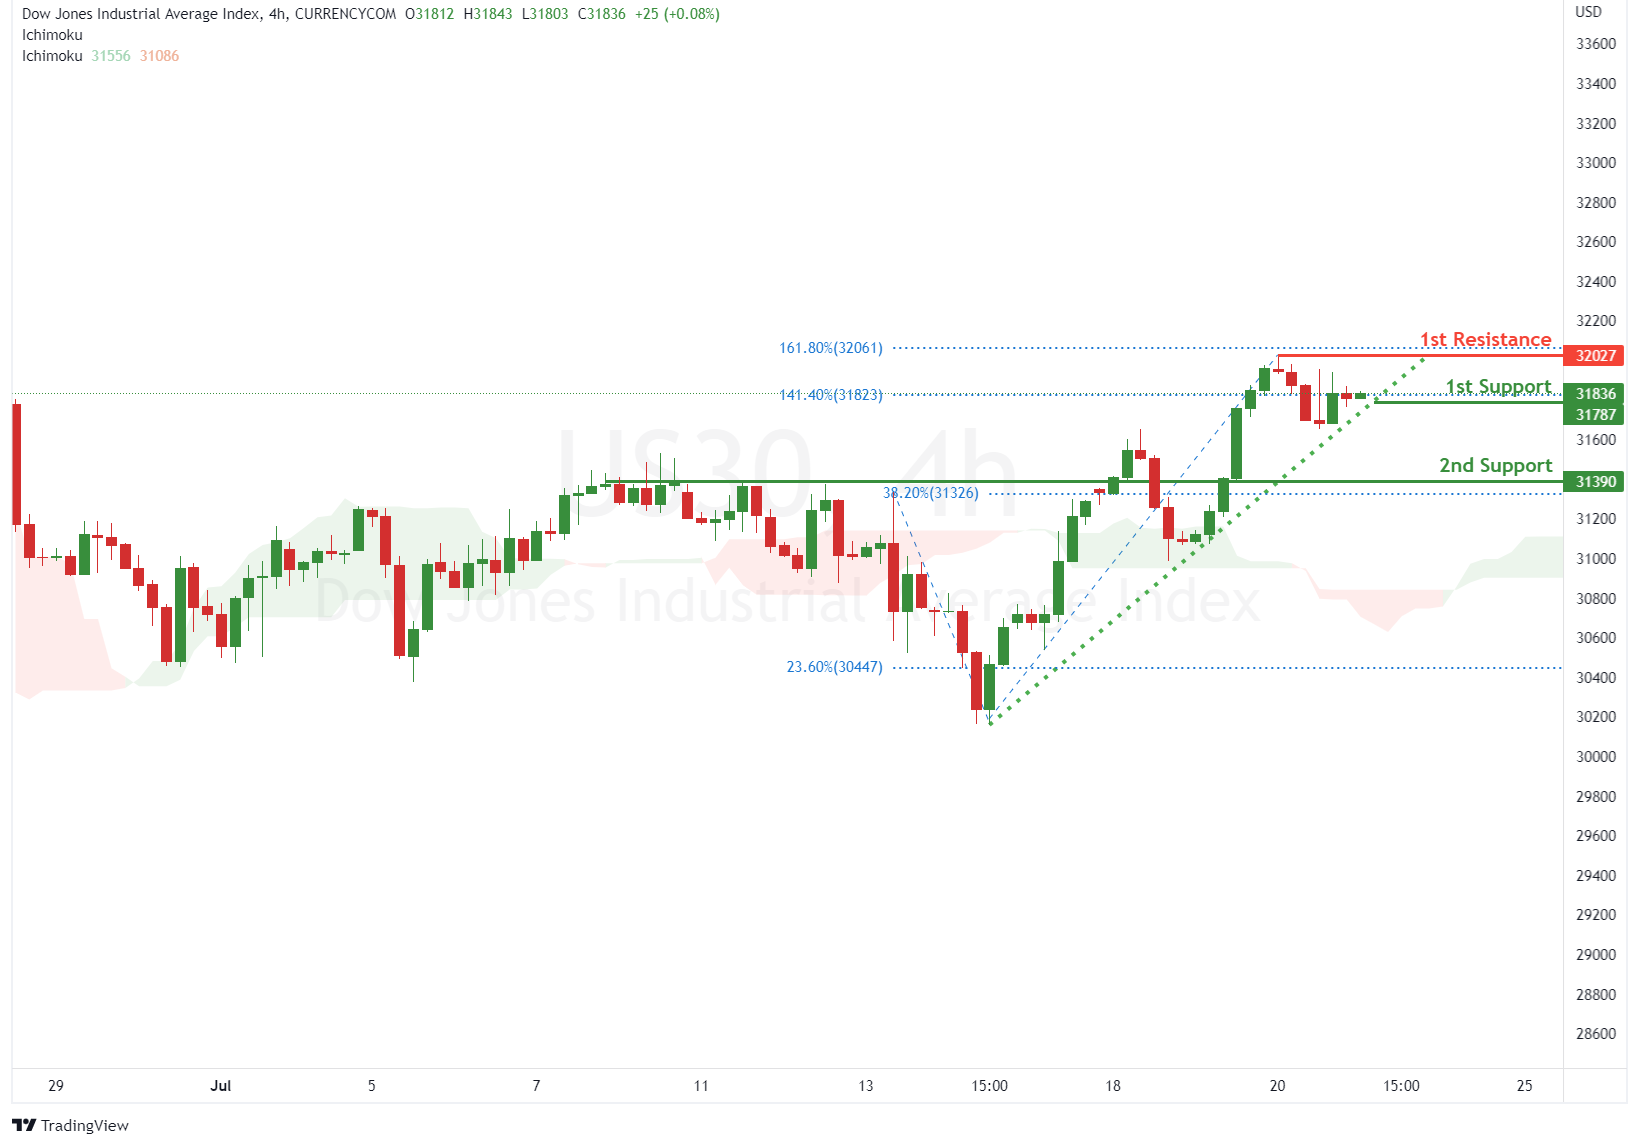
On the H4, with price moving in a ascending trendline and moving above ichimoku cloud, we have a bullish bias that price might rise from our 1st support at 31787, which is in line with 141.4% fibonacci retracement to our 1st resistance at 32034, which is in line with 161.8% fibonacci retracement. Alternatively, price may reverse off the 1st support and drop to the 2nd support at 31390, which is in line with the 38.2% fibonacci retracement.
Areas of consideration:
- H4 time frame, 1st support of 31787
- H4 time frame, 1st resistance at 32034
Elliott Wave View: DAX Rally is Corrective
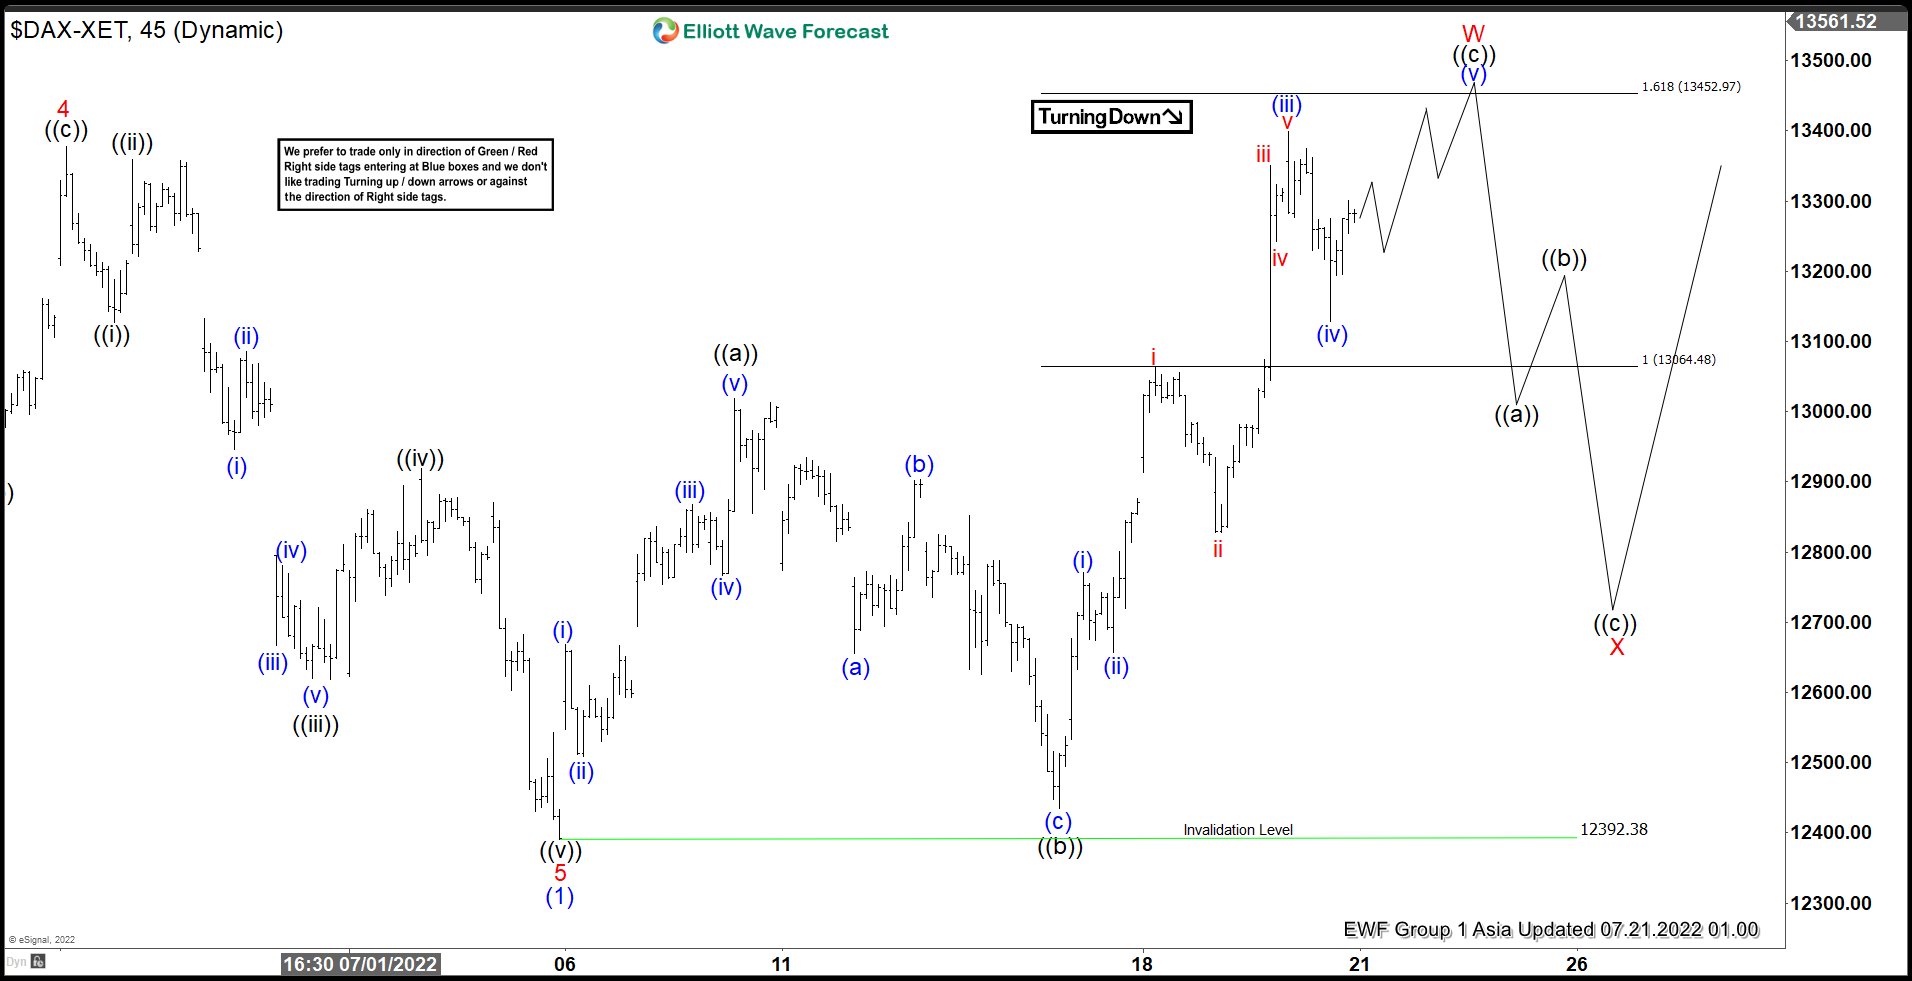
DAX shows a lower low sequence from November 2021 peak and thus the 4 hour cycle is still calling for further downside. Near term though, the Index ended cycle from 3/29/2022 peak in wave (1) at 12390.95. Internal subdivision of wave (1) unfolded as a 5 waves impulse Elliott Wave structure. Down from 3/29/2022 peak, wave 1 ended at 13380.67 and rally in wave 2 ended at 14709.38. Index extended lower in wave 3 towards 13007.91, and rally in wave 4 ended at 13443.77. Final leg lower wave 5 ended at 12390.95 and this completed wave (1) in higher degree.
Wave (2) rally is in progress with subdivision as a double three Elliott Wave structure. Up from wave (1), wave ((a)) ended at 13019.13, and pullback in wave ((b)) ended at 12434.29. Expect the Index to complete wave ((c)) soon at 13064.48 – 13452.97 area and this should complete wave W. Index should then pullback in wave X to correct cycle from 7/5/2022 low in 3, 7, or 11 swing before turning higher in wave Y of (2). Near term, as far as pivot at 12392.38 low stays intact, Index has scope to extend wave (2) rally to correct cycle from 3/29/2022 peak as 7 swing structure before the decline resumes.
DAX 45 Minutes Elliott Wave Chart
EUR/USD: Retracement Mode at the Moment
- EUR/USD stayed at or below parity only briefly
- The 1.036 region and 1.050 region are possible resistance levels
A Brief Moment Below Parity
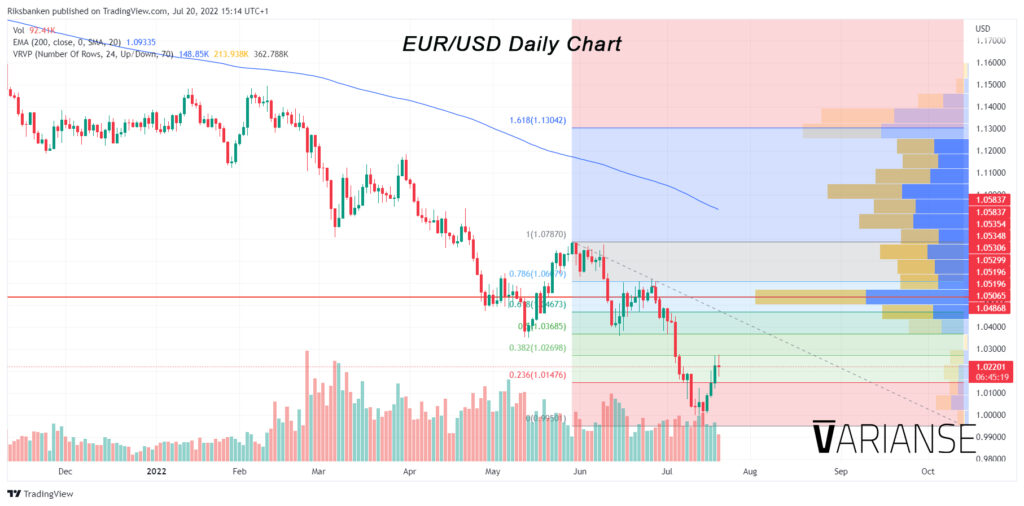
Life for EUR/USD at or below parity thus far has been short and sweet. Rather than punch, the pair gently lapped past parity between 12 and 14 July, before receding back above that level in recent days. Still, the 14 July swing low of 0.9952 stands out in the wake of the recent retracement higher in price. Meanwhile, the simplest of technical indicators, such as the 200 daily and weekly exponential moving average are tilted downwards; the current price of EUR/USD is well below the moving average line. This, alongside the absence of that big capitulation moment in EUR/USD, where sellers completely exhaust themselves on massive volume, in my opinion, risks a further move beyond the newly established precipice of 0.9952.
Retracement Opportunities
As a result, I’m keeping my eyes peeled for attractive levels to re-sell EUR/USD, on the possibility of further retracement. Until price makes a sustained break above the 30 May swing high of 1.07870, which would mark a structural shift from downtrend to uptrend, I’m more apt to look at opportunities to sell EUR/USD rather than buy. I’ve got my eye on the key Fibonacci retracement levels between the swing high of 1.07870 and 0.9952 swing low as possible levels for the current corrective move to reverse. These include the 50% Fibonacci retracement level of 1.03685, and also the 1.05 region where there is a great deal of past congestion and volume, amongst others.
Keeping a Tight Lid on Risk
Against those key Fibonacci levels, I’m looking for strong signs of possible reversal, whether they be candlestick patterns, traditional chart patterns, or other similar signals. In addition, I will judge my position sizing against the degree of relative volume that validates that potential. I always can size up my position by scaling in at a later date. But based on previous volume, I wouldn’t be looking to do that until price has successfully broken below parity again and downside momentum looks set to continue.
GBPNZD Wave Analysis
- GBPNZD reversed from support level 1.9135
- Likely to rise to resistance level 1.9400
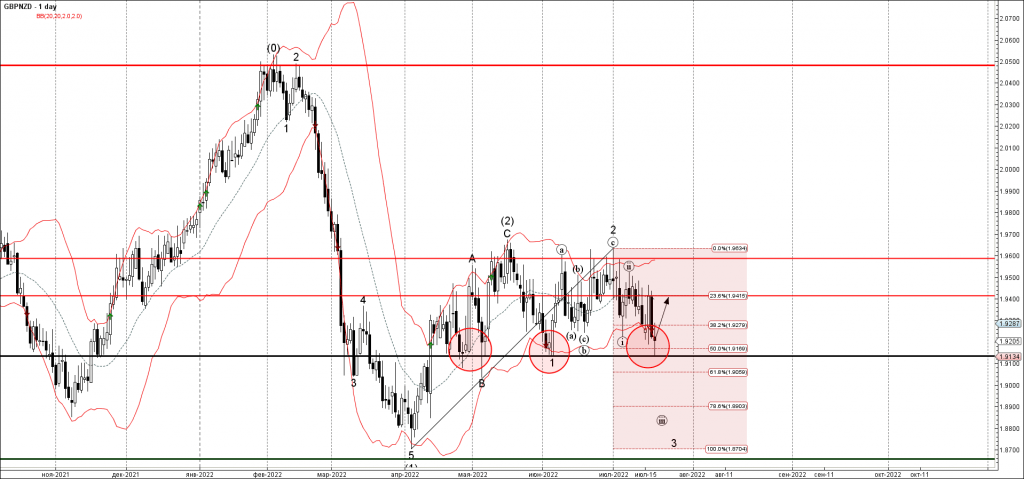
GBPNZD recently reversed up from the pivotal support level 1.9135 (which has been reversing the pair from the middle of April), strengthened by the lower daily Bollinger Band and the 50% Fibonacci correction of the upward move from April.
The upward reversal from the support level 1.9135 stopped the earlier short-term impulse wave 3.
Given the strength of the support level 1.9135, GBPNZD can be expected to rise further toward the next resistance level 1.9400.
Nasdaq 100 Wave Analysis
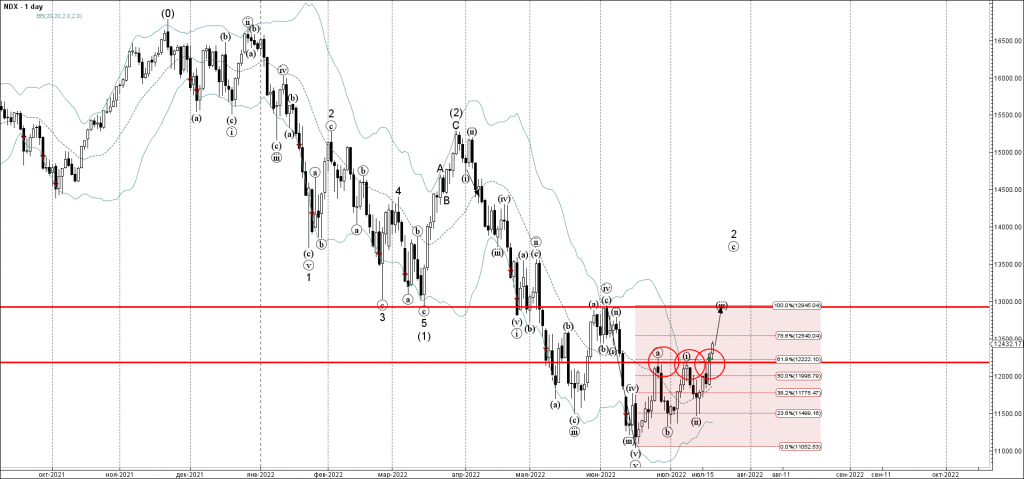
- Nasdaq 100 broke resistance level 12180.00
- Likely to rise to resistance level 12920.00
Nasdaq 100 index recently broke the resistance area located at the intersection of the resistance level 12180.00 (which stopped the previous waves (a) and (i), as can be seen below) and the 61.8% Fibonacci correction of the downward impulse from the start of June.
The breakout of this resistance area should accelerate the active short-term impulse wave (iii) of wave 2 from last month.
Nasdaq 100 can be expected to rise further toward the next key resistance level 12920.00 (former monthly low from March and also the monthly high from June).