

Sample Category Title
BoJ stands pat, maintains dovish bias
BoJ left monetary policy unchanged as widely expected, by 8-1 vote, with dove Goushi Kataoka dissented again. Under the yield curve control framework, short-term policy interest rate is held at -0.10%. 10-year JGB yield target is kept at around 0%, without upper limit on JGB purchases. BoJ also clarified that it will offer to purchase 10-year JGBs at 0.25% every business day through fixed-rate purchase operations.
The central bank also reiterated that it will "expanding the monetary base until the year-on-year rate of increase in the observed consumer price index (CPI, all items less fresh food) exceeds 2 percent and stays above the target in a stable manner."
It also pledged that it "will not hesitate to take additional easing measures if necessary; it also expects short- and long-term policy interest rates to remain at their present or lower levels."
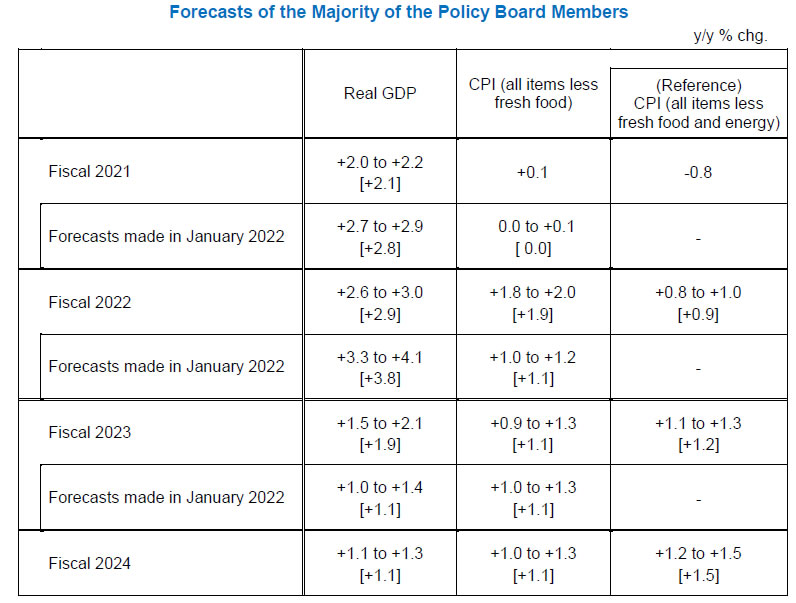
In the new economic projections, GDP is forecast to grow:
- 2.9% in fiscal 2022 (revised down from 3.8%)
- 1.9% in fiscal 2023 (revised up from 1.1%)
- 1.1% in fiscal 2024 (new).
CPI (all items less fresh food) is expected to be at:
- 1.9% in fiscal 2022 (revised up from 1.1%).
- 1.1% in fiscal 2023 (unchanged).
- 1.1% in fiscal 2024 (new).
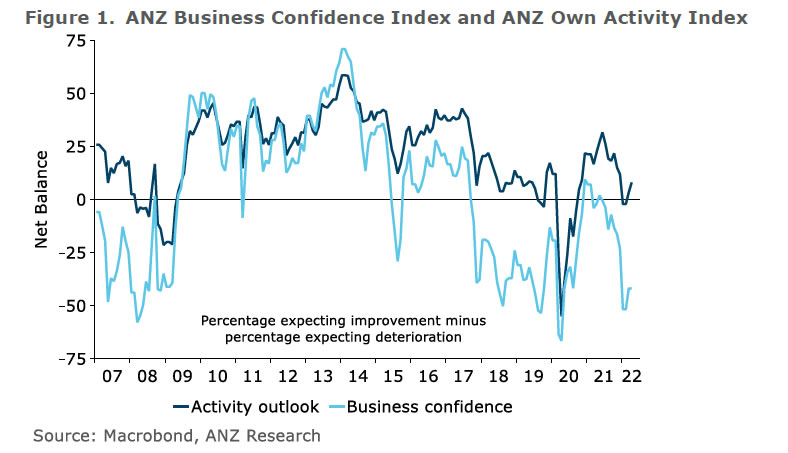
New Zealand ANZ business confidence ticked down to -42 in Apr
New Zealand ANZ business confidence dropped slightly from -41.9 to -42.0 in April. Own activity outlook rose from 3.3 to 8.0. Export intentions rose from 7.9 to 9.5. Investment intentions dropped from 5.2 to 3.1. Employment intentions dropped from 12.3 to 9.4. Cost expectations dropped from 95.9 to 95.5. Inflation expectations rose further from 5.51 to 5.92.
ANZ said: "With plenty of wage and other cost inflation in the pipeline, it'll be some time before the RBNZ can conclude that they're getting ahead of the inflation game. We continue to expect another 50bp hike in May, and steady 25bp increases thereafter taking the OCR to a peak of 3.5%."
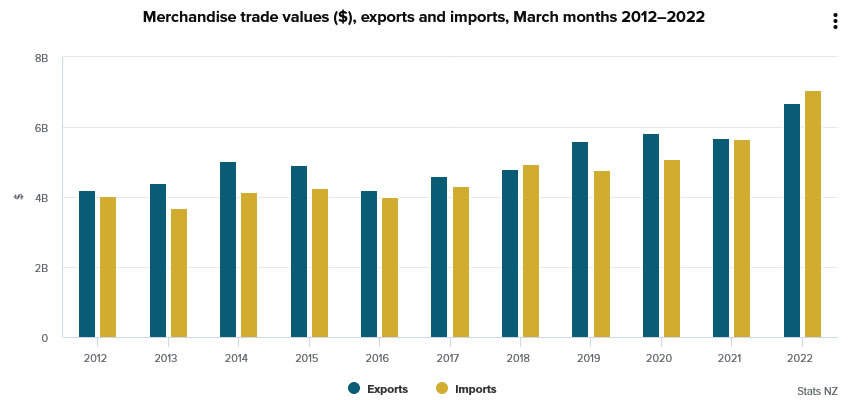
NZ goods exports rose 17% yoy in Mar, imports rose 25% yoy
New Zealand goods exports rose 17% yoy to NZD 6.7B in March. Goods imports rose 25% yoy to NZD 7.1B. Trade balance was a deficit of NZD -392m, versus expectation of NZD -648m.
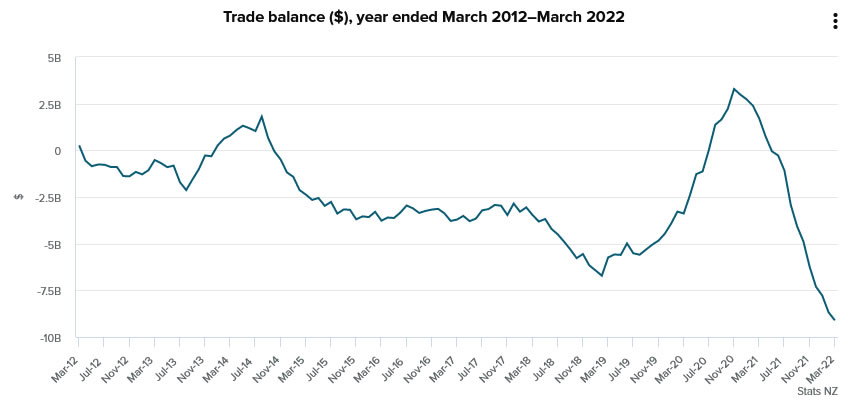
As a result of the monthly deficit in March 2022, the annual goods trade deficit has further widened to reach NZD -9.1B for the March 2022 year.
Technical Outlook and Review
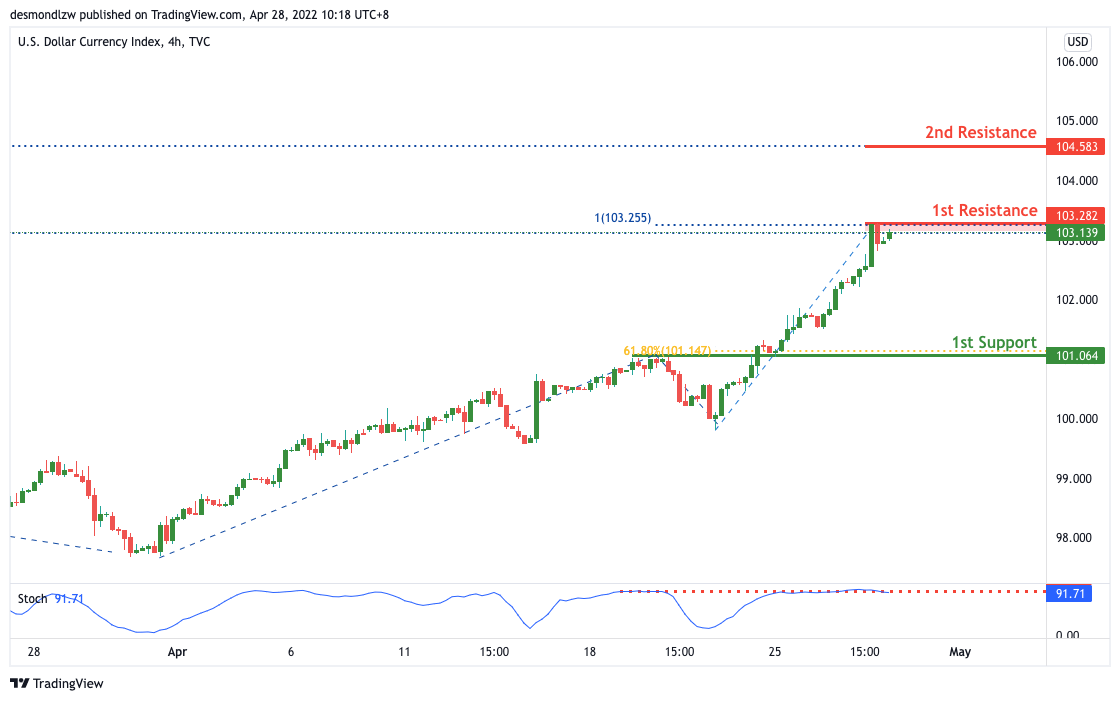
DXY:
On the H4, with price expected to reverse off the stochastics indicator, we have a bearish bias that price will drop from our 1st resistance at 103.282 where the 78.6% Fibonacci retracement is to our 1st support at 101.064 in line with the horizontal pullback support, 161.8% Fibonacci extension, 61.8% Fibonacci projection and -61.8% Fibonacci expansion. Alternatively, price may break 1st resistance structure and head for 2nd resistance where the 100% Fibonacci projection.
Areas of consideration:
- H4 time frame, 1st resistance at 102.441
- H4 time frame, 1st support at 101.790
XAU/USD (GOLD):
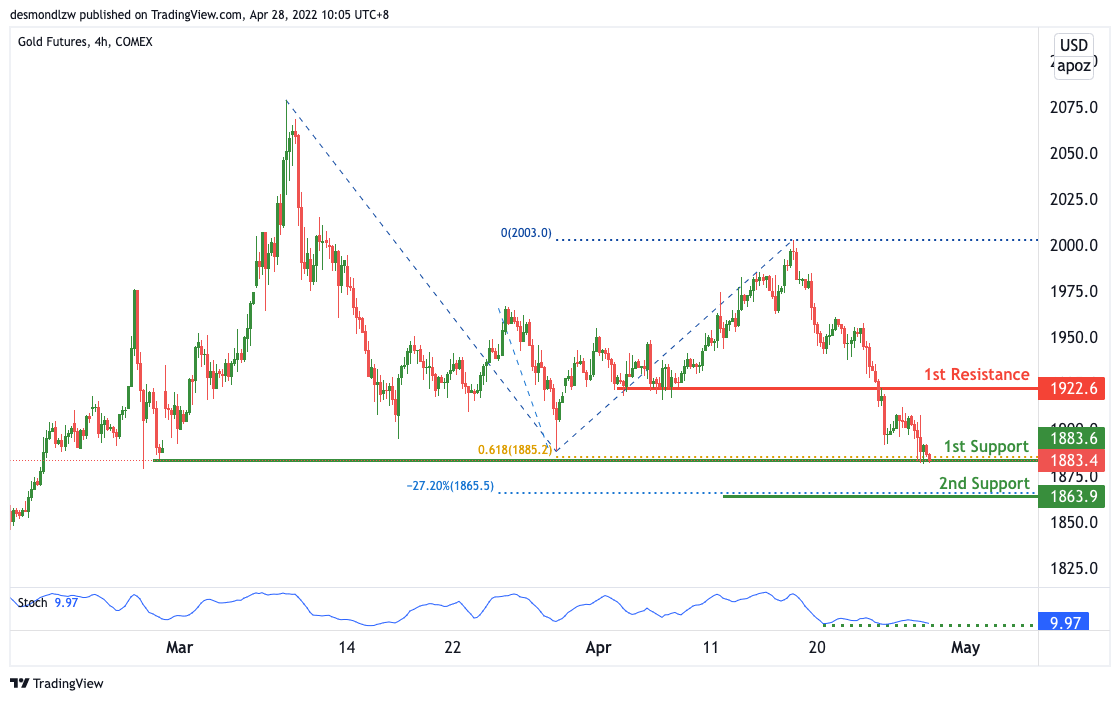
On the H4, with price expected to bounce off the stochastics indicator, we have a bullish bias that price will rise to our 1st resistance at 1922 where the pullback resistance is from our 1st support at 1883 in line with the horizontal swing low support and 61.8% Fibonacci projection and 127.2% Fibonacci extension. Alternatively, price may break 1st support structure and head for 2nd support where the 161.8% Fibonacci extension and -27.2% Fibonacci expansion is at 1863.
Areas of consideration:
- H4 time frame, 1st Resistance at 1922
- H4 time frame, 1st Support at 1895
GBP/USD:
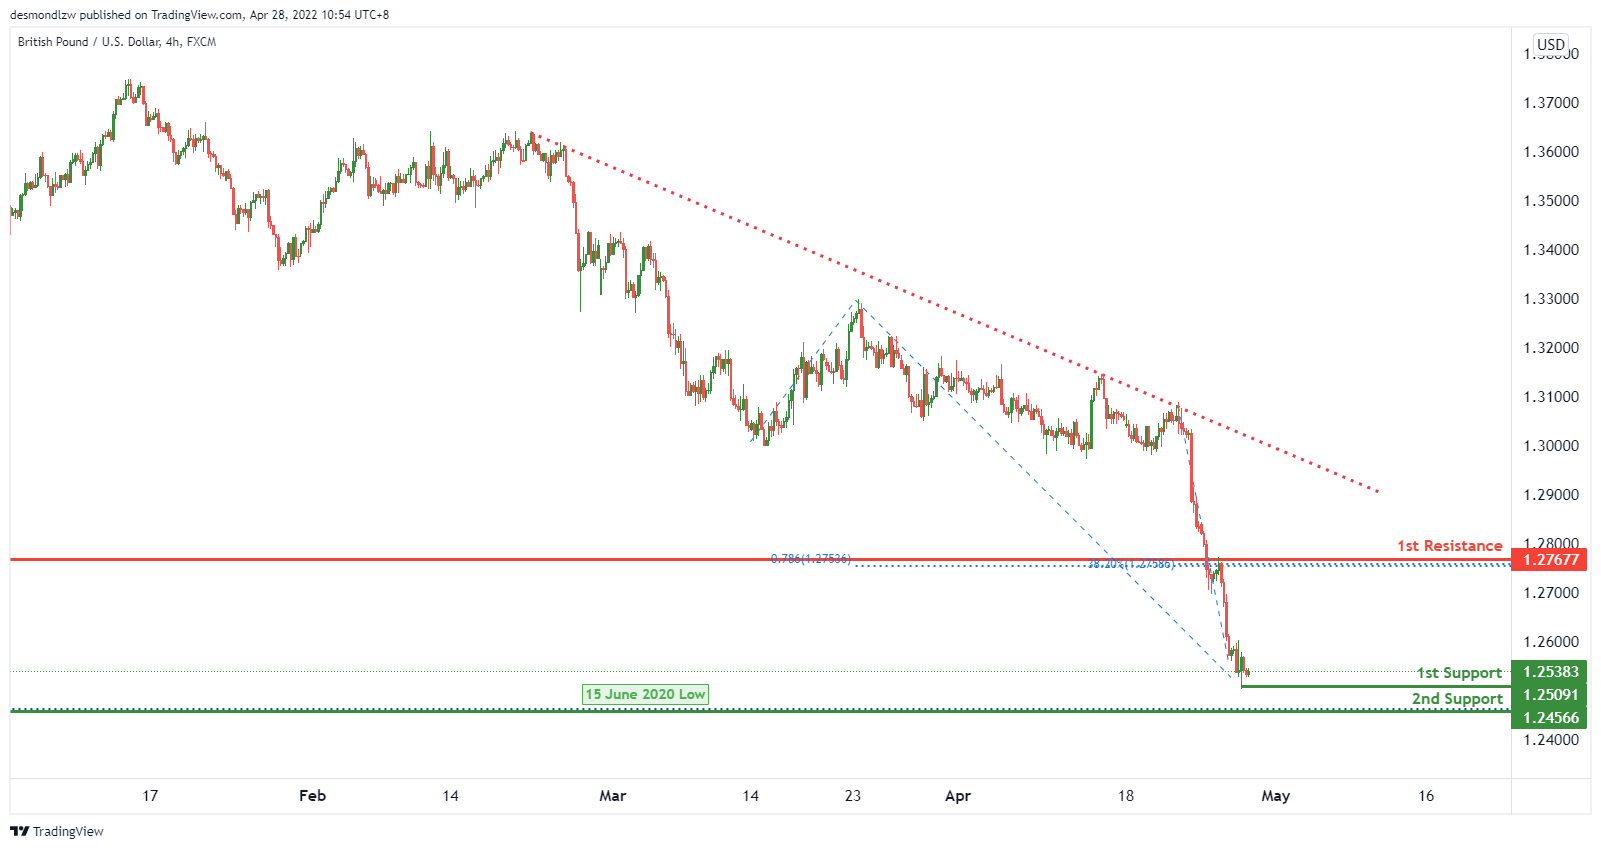
On the H4, we have a bullish bias that price will bounce from 1st support level of 1.25091 which lines up with graphical swing low support towards the 1st resistance level of 1.27677 which lines up with 78.6% fibonacci projection and 38.2% fibonacci retracement.
Areas of consideration:
- H4 1st resistance at 1.27677
- H4 1st support at 1.25091
- H4 2nd support at 1.24566
USD/CHF:
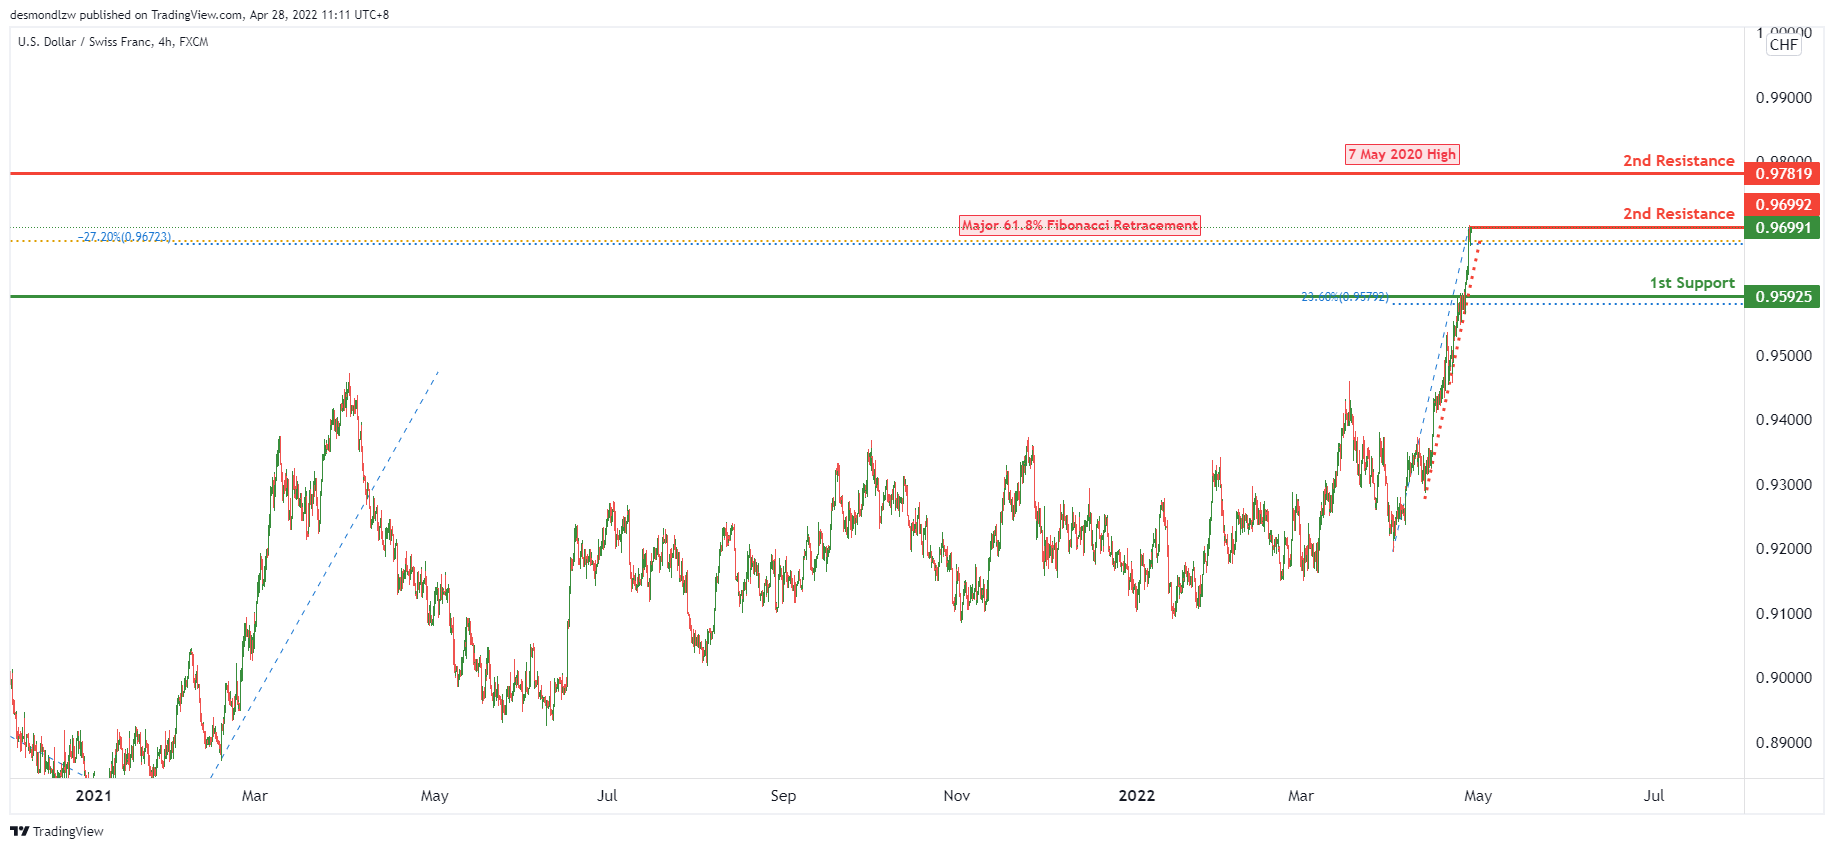
On the H4, price is near to the key resistance level. We expect that price will potentially reverse from 1st resistance level of 0.97034 in line with -27.2% fibonacci expansion and a major 61.8% fibonacci retracement towards the 1st support level of 0.95925 in line with 23.6% fibonacci retracement.
Areas of consideration
- 1st support level at 0.95925
- 1st resistance level at 0.97034
- 2nd resistance level at 0.97819
EUR/USD :
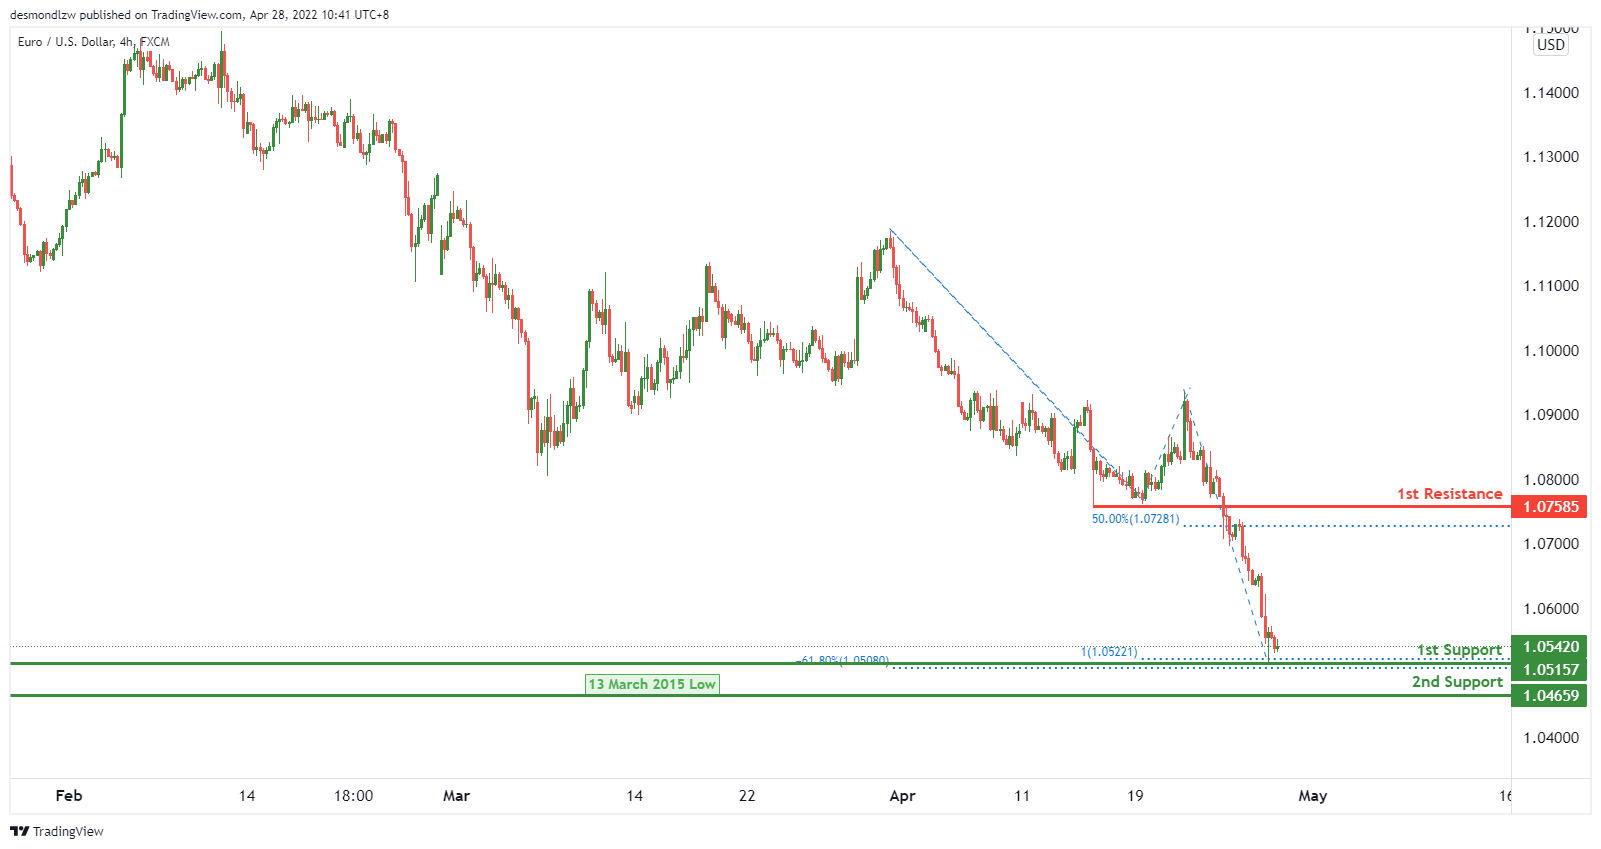
On the H4, price is near the pivot level. We expect price to potentially bounce from 1st support level of 1.05157 in line with 100% fibonacci retracement and -61.8% fibonacci expansion towards the 1st resistance level of 1.07585 in line with 50% fibonacci retracement.
Areas of consideration :
- H4 1st resistance at 1.07585
- H4 1st support at 1.05157
- H4 2nd support at 1.04659
USD/JPY:
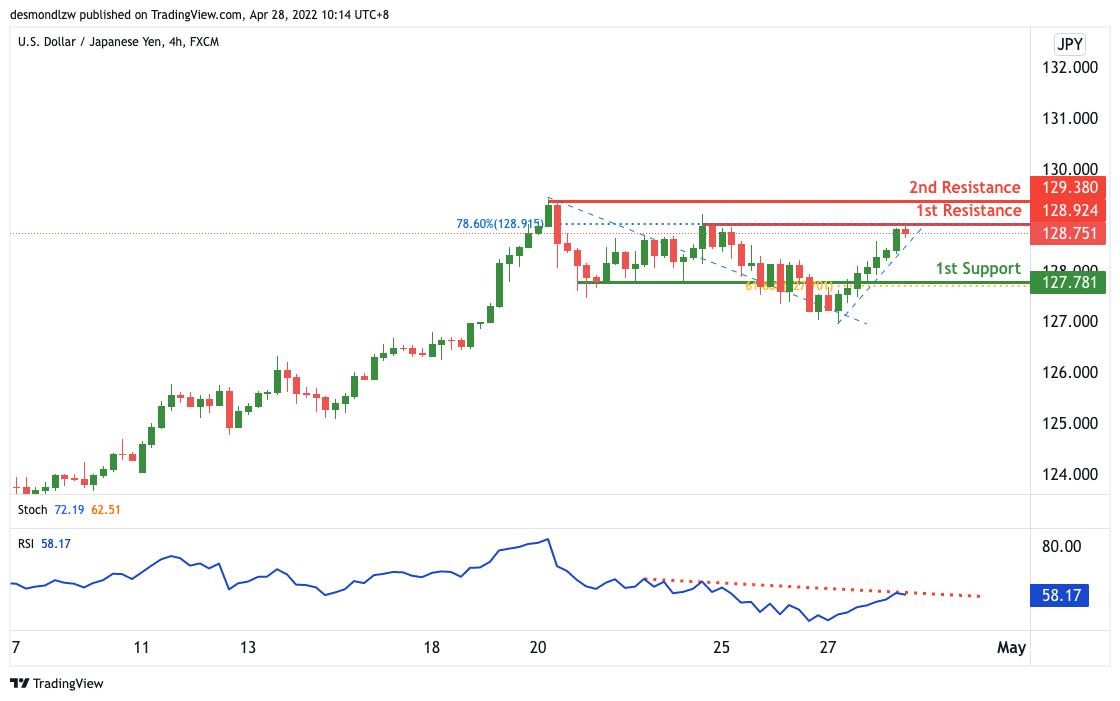
On the H4, with price moving below the ichimoku cloud indicator, we have a bearish bias that price will drop from our 1st resistance at 128.924 where the 38.2% Fibonacci retracement is to our 1st support at 127.781 in line with the horizontal pullback support and 61.8% Fibonacci retracement. Alternatively, price may break 1st resistance structure and head for 2nd resistance where the horizontal swing high resistance is at 129.380.
Areas of consideration:
- H4 time frame, 1st resistance at 128.331
- H4 time frame, 1st support at 127.667
AUD/USD:
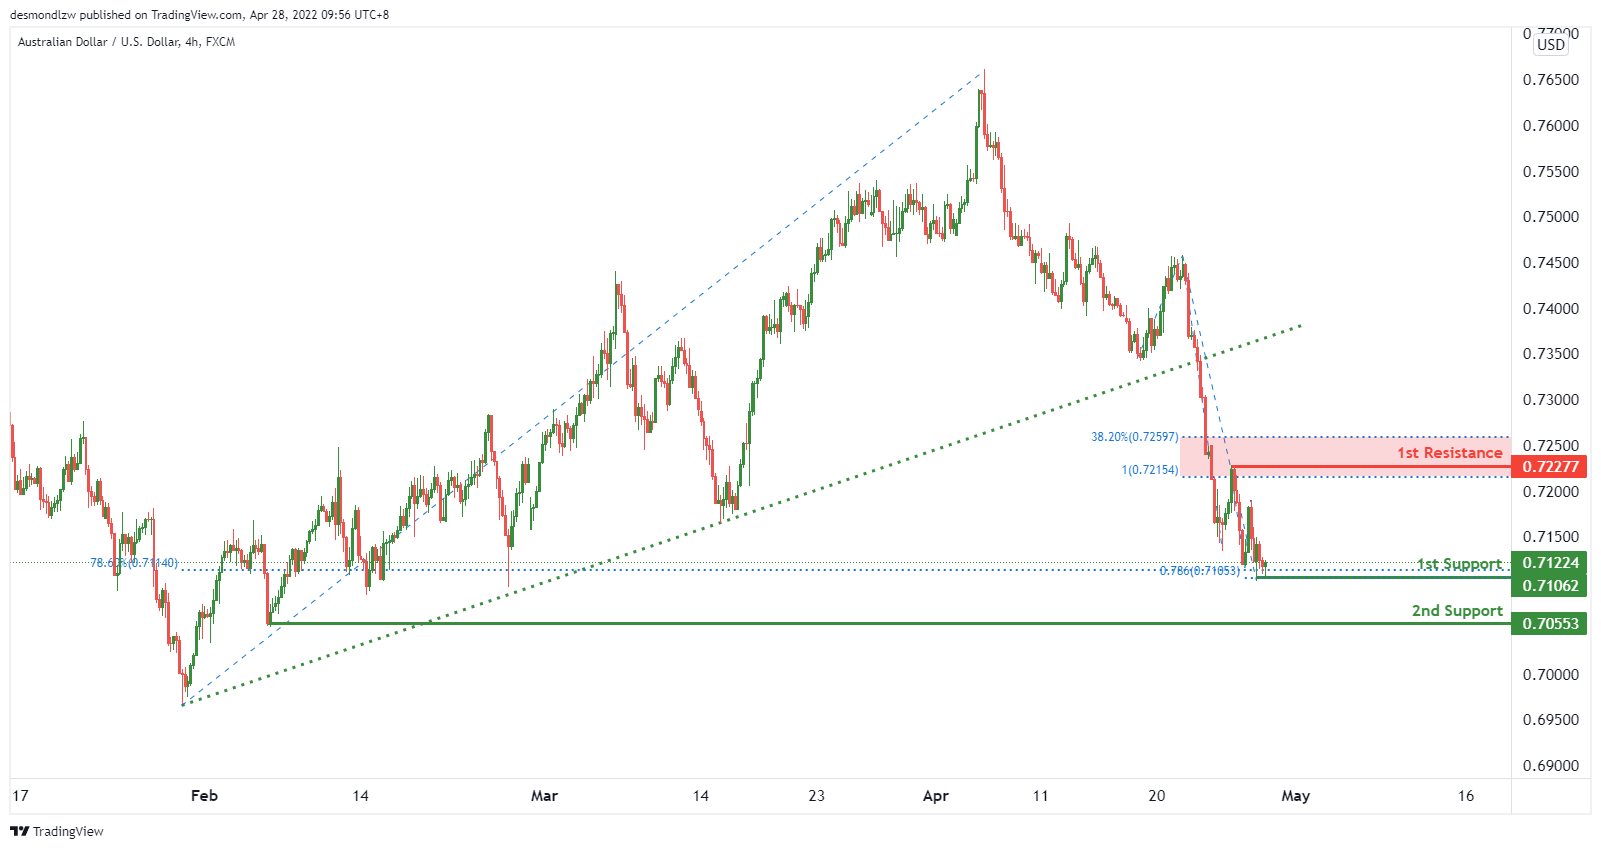
On the H4 timeframe, price is near the key support level, We see the potential of a bullish bounce from 1st support level of 0.71062 in line with 78.6% fibonacci retracement and 78.6% fibonacci projection towards the 1st resistance level of 0.72277 in line with 38.2% fibonacci retracement and 100% fibonacci projection. Otherwise, price might break the key support level to trigger a dip towards the 2nd support of 0.70553 which is in line a previous horizontal swing low support.
Areas of consideration
- H4 1st resistance at 0.72277
- H4 1st support at 0.71062
- H4 2nd support at 0.70553
NZD/USD:
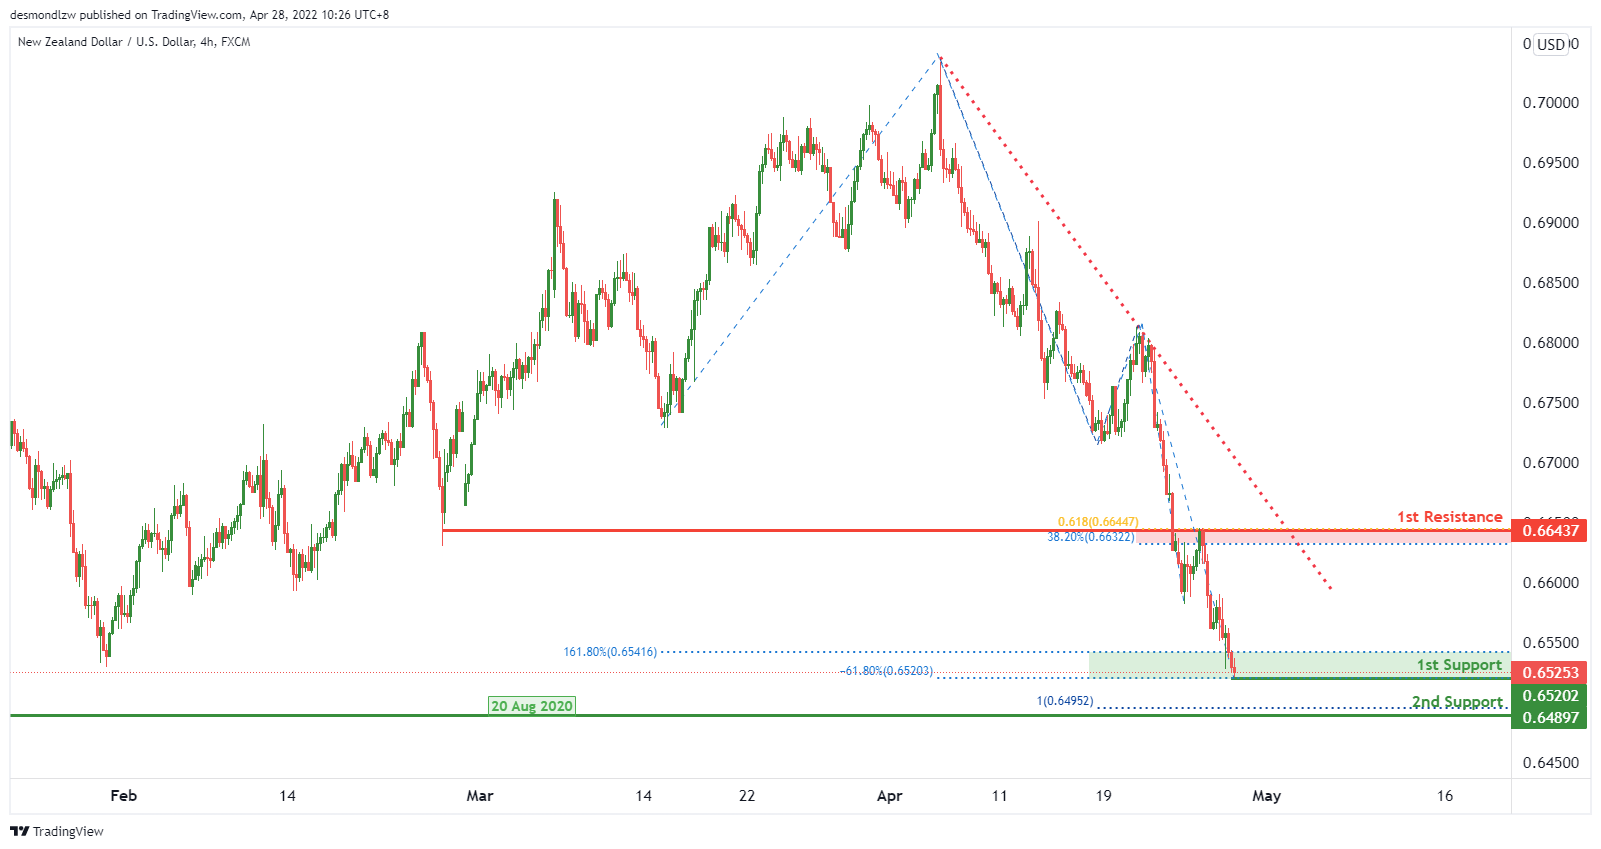
On the H4, we see the potential of bullish bounce from 1st support level of 0.65202 in line up with 161.8% fibonacci extension and -61.8% fibonacci expansion towards the 1st resistance level of 0.66437 in line with 38.2% fibonacci retracement and 61.8% fibonacci projection.
Areas of consideration:
- H4 time frame, 1st support at 0.65202
- H4 time frame, 1st resistance at 0.66437
- H4 time frame, 2nd support at 0.64897
USD/CAD:
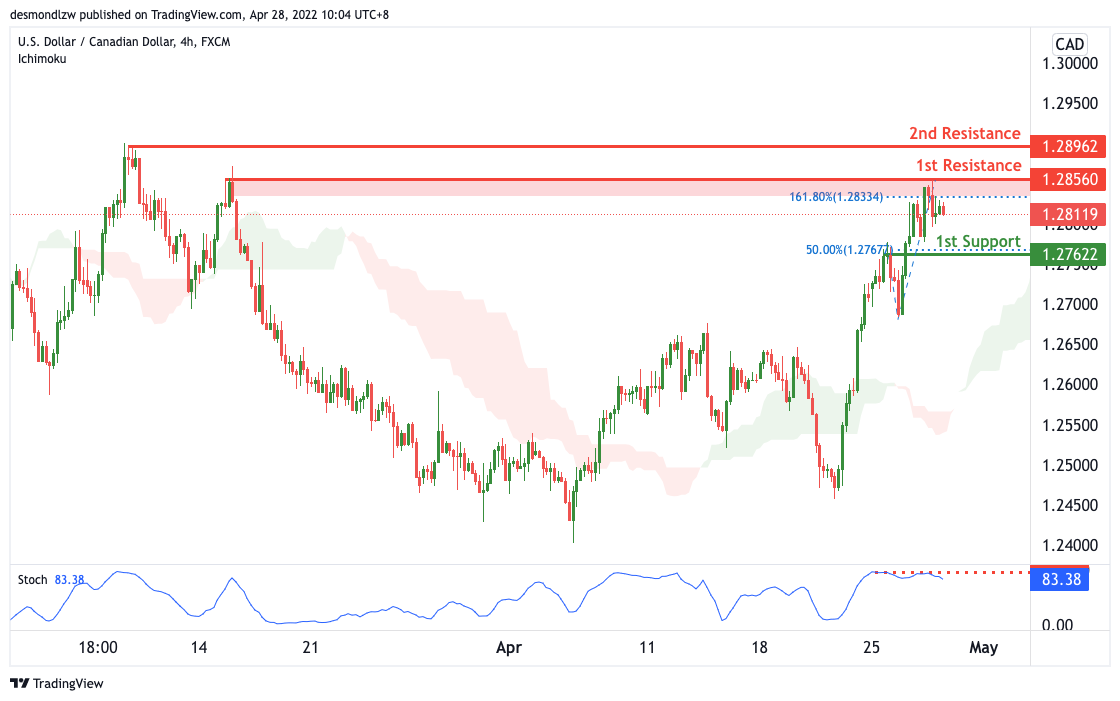
On the H4, with price moving above the ichimoku cloud, we have a bullish bias that price will rise to our 1st resistance at 1.28560 where the swing high resistance and 161.8% Fibonacci extension is from our 1st support at 1.27622 in line with the horizontal pullback support and 50% Fibonacci retracement. Alternatively, price may break 1st support structure and head for 2nd support where the horizontal swing low support and 38.2% Fibonacci retracement is.
Areas of consideration:
- H4 time frame, 1st resistance at 1.28560
- H4 time frame, 1st support at 1.27622
OIL:
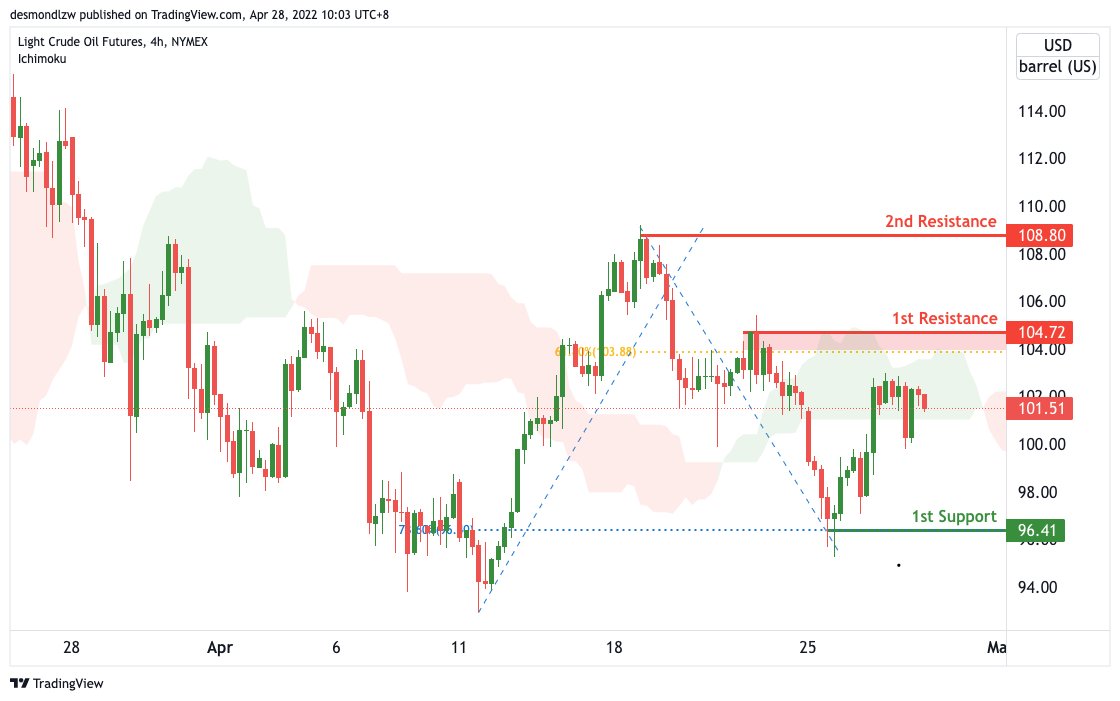
On the H4, with price expected to reverse off the resistance of the ichimoku cloud, we have a bearish bias that price will drop from our 1st resistance at 104.72 where the swing high resistance and 61.8% Fibonacci retracement is to our 1st support at 96.41 in line with the horizontal swing low support and 78.6% Fibonacci retracement. Alternatively, price may break 1st resistance structure and head for 2nd resistance where the horizontal swing high resistance at 108.80.
Areas of consideration:
- H4 time frame, 1st resistance of 104.72
- H4 time frame, 1st support of 96.41
Dow Jones Industrial Average:
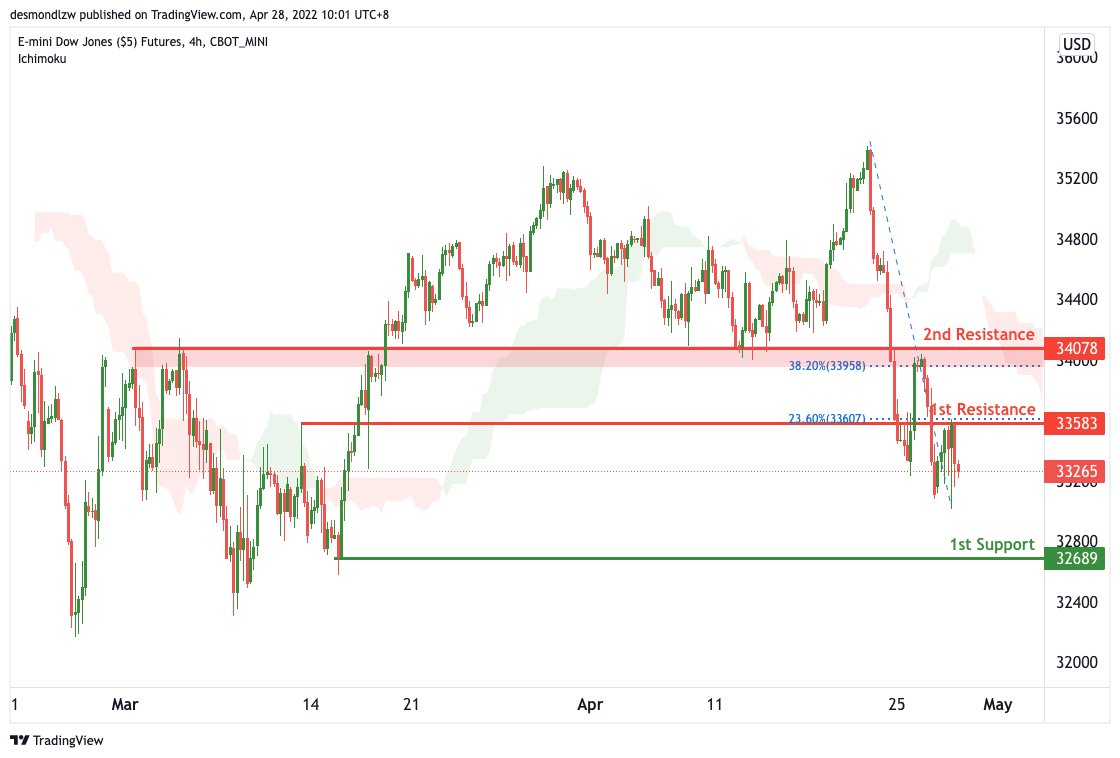
On the H4, with price moving below the ichimoku cloud, we have a bearish bias that price will drop from our 1st resistance at 33583 where the horizontal overlap resistance is to our 1st support at 32689 in line with the horizontal swing low support. Alternatively, price may break 1st resistance structure and head for 2nd resistance where the horizontal overlap resistance and 38.2% Fibonacci retracement is at 34078.
Areas of consideration :
- H4 time frame, 1st resistance at 33583
- H4 time frame, 1st support at 32689
Crude Oil Price Recovery Won’t Be Easy, Hurdles Nearby
Key Highlights
- Crude oil price found support near $95.50 and corrected higher.
- It broke a key bearish trend line with resistance near $100.10 on the 4-hours chart.
- Gold price could extend losses below $1,890 and $1,880.
- The US GDP could grow 1.1% in Q1 2022 (Prelim), down from 6.9%.
Crude Oil Price Technical Analysis
After facing rejection near $109.55, crude oil price started a fresh decline against the US Dollar. The price traded below the $105 support to move into a short-term bearish zone.
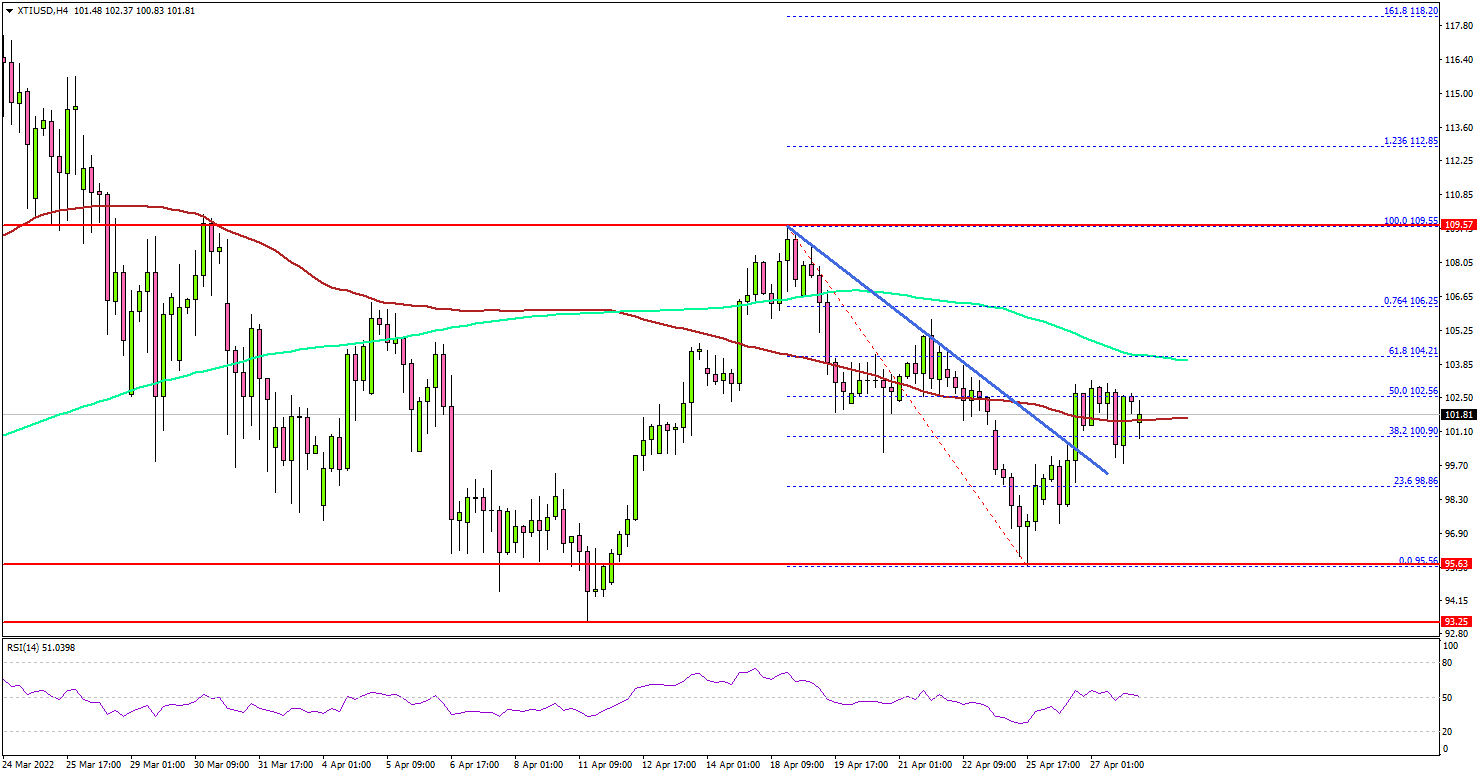
Looking at the 4-hours chart of XTI/USD, the price traded below the $100 support, the 100 simple moving average (red, 4-hours), and the 200 simple moving average (green, 4-hours).
It traded as low as $95.56 before the bulls appeared. The price started an upside correction above the $98 and $99 levels. There was also a break above a key bearish trend line with resistance near $100.10 on the same chart.
However, the price faced resistance near $102.50 and the 50% Fib retracement level of the downward move from the $109.55 swing high to $95.56 low.
The main resistance on the upside is near the $104.20 level. A clear move above the $104.20 resistance zone could open the doors for a steady move towards the $110 resistance level. The next major resistance might be near the $115 level.
If there is no upside break, the price could start another decline below $98. The next major support is near $95.50, below which there is a risk of a move towards the $93.25 level. Any more losses might call for a test of the $85 support.
Looking at the gold price, the bears remained active below the $1,920 level. A close below $1,890 and $1,880 might spark a sharp decline.
Economic Releases to Watch Today
- German Consumer Price Index for April 2022 (YoY) – Forecast +7.2%, versus +7.3% previous.
- German Consumer Price Index for April 2022 (MoM) – Forecast +0.6%, versus +2.52% previous.
- US Gross Domestic Product for Q1 2022 (Preliminary) – Forecast 1.1% versus previous 6.9%.
Elliott Wave View: Dollar Index (DXY) Should Continue to Extend Higher
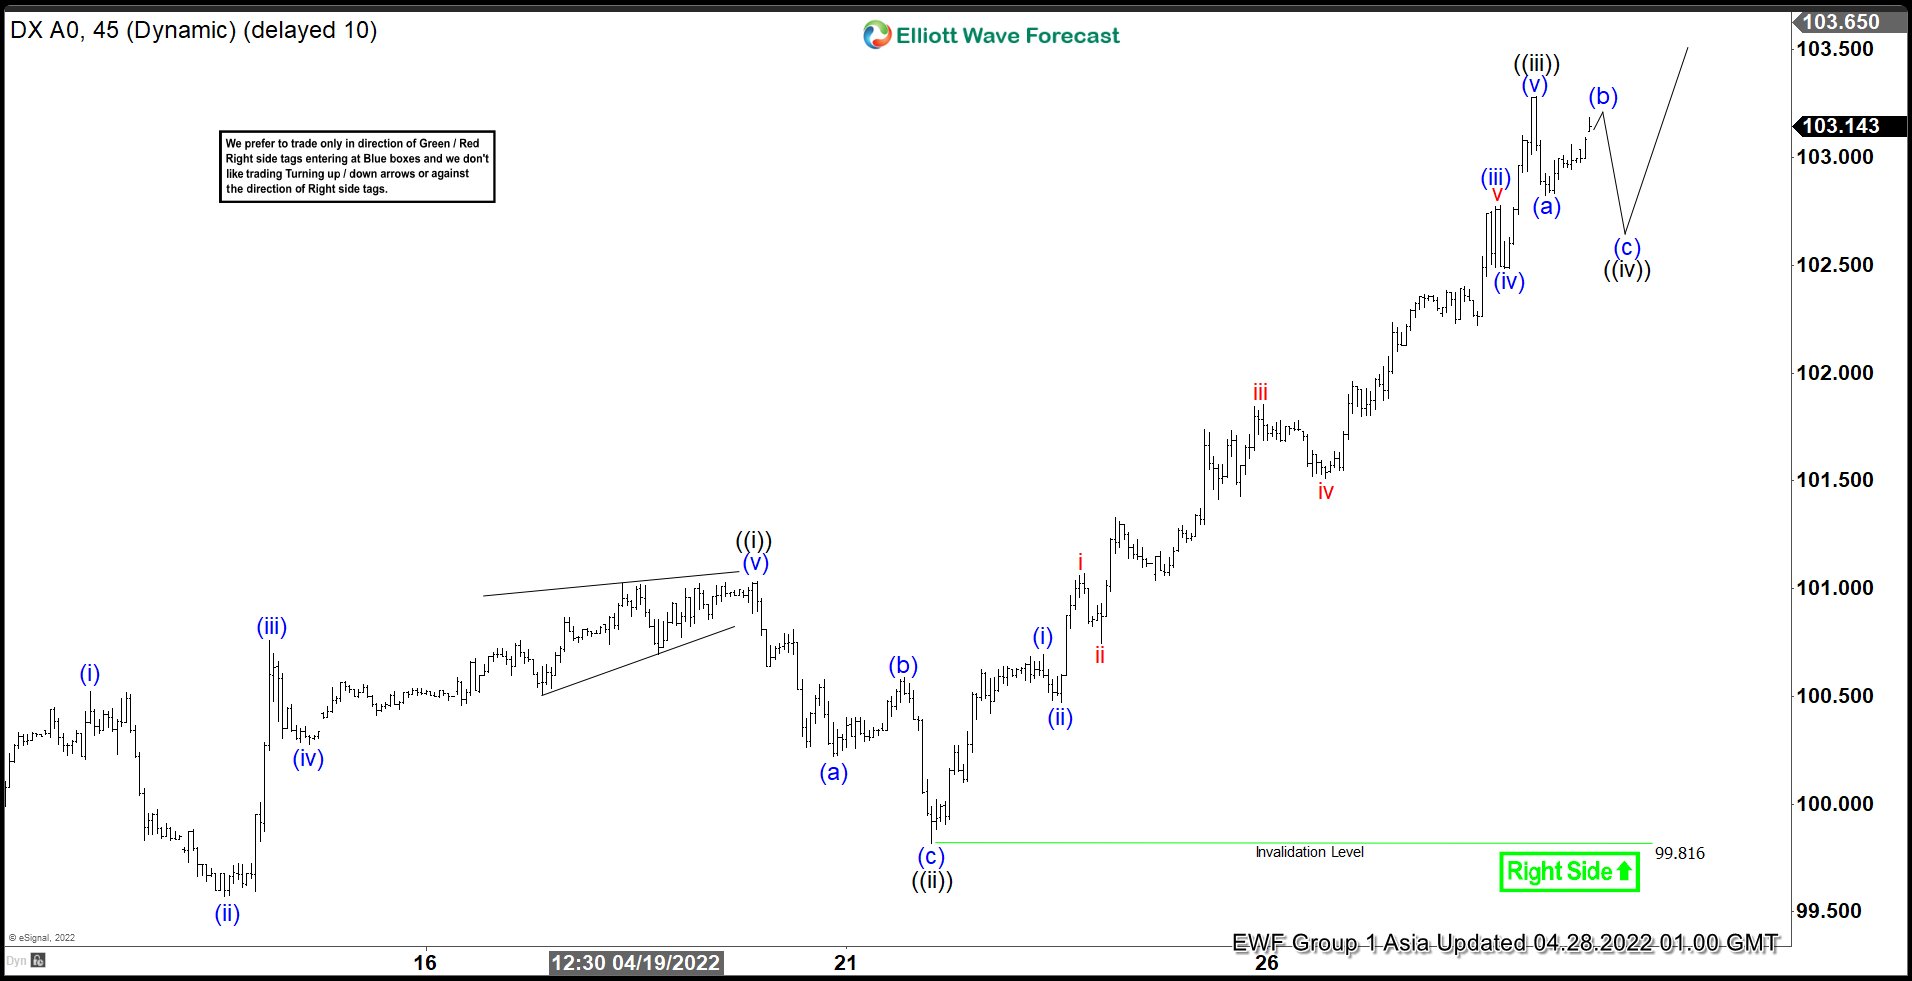
Short term view in Dollar Index (DXY) suggests the cycle from March 30, 2022 low is ongoing as an impulse Elliott Wave structure. Up from March 30 low, wave (i) ended at 100.52 and pullback in wave (ii) ended at 99.57. Index then resumes higher in wave (iii) towards 100.76. Dips in wave (iv) ended at 100.27, and final leg wave (v) ended at 101.03. This completed wave ((i)) in higher degree.
Index then pullback in wave ((ii)) which ended at 99.81. Dollar then rallies higher again and wave ((iii)) is proposed complete at 103.28. If the Index breaks above 103.28 again, then this suggests wave ((iii)) still remains in progress. Short term pullback in wave ((iv)) can see the Index correcting the rally from April 21 low before it resumes higher again.
Pullback is proposed to be in the form of a zigzag (a)-(b)-(c). Near term, as far as March 30 pivot low at 97.7 holds, expect any pullback to find support in 3, 7, or 11 swing for further upside. Assuming wave ((iii)) has really ended, ideally wave ((iv)) ends around 23.6 – 38.2 Fibonacci retracement of wave ((iii)). This comes at 101.95 – 102.46.
Dollar Index 45 Minutes Elliott Wave Chart
EURUSD Wave Analysis
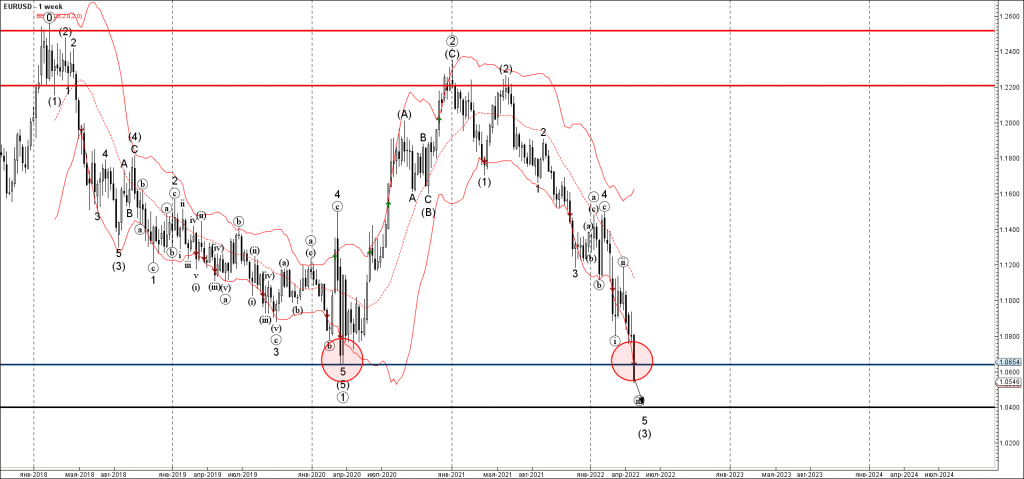
- EURUSD broke long-term support level 1.0640
- Likely to fall to support level 1.0400
EURUSD currency pair under the strong bearish pressure after the price the long-term support level 1.0640 (the previous yearly low from the start of January).
The breakout of the support level 1.0640 accelerated the active impulse waves 5 and (3).
EURUSD currency pair can be expected to fall further toward the next support level 1.0400 (target for the completion of the active impulse waves 5) .
S&P 500 Wave Analysis
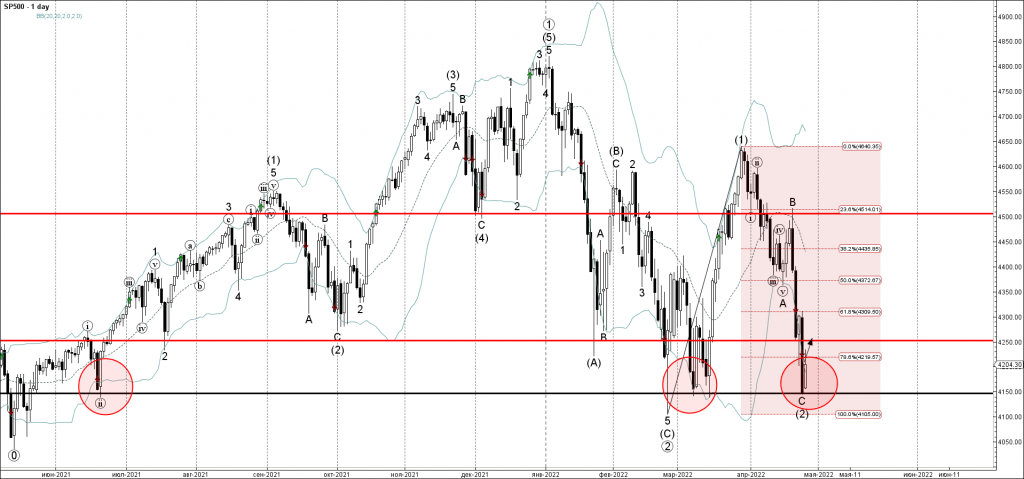
- S&P 500 reversed from support zone
- Likely to rise to resistance level 4250.00
S&P 500 index recently reversed up from the support area lying located between the long-term support level 4150.00 (which has been reversing the price from last June) and the lower daily Bollinger Band.
The upward reversal from this support zone stopped the earlier sharp intermediate ABC correction (2).
Given the strength of the aforementioned support zone – S&P 500 index can be expected to rise further toward the next resistance level 4250.00.
Breakdown of the Swiss Franc’s Half-Century Status
The Swiss franc is on track for its most substantial monthly decline against the dollar in almost ten years.
The USDCHF pair chart has shown neat support on declines from increasingly higher levels since the beginning of last year. And in April, we see the bulls attempting to develop the offensive.
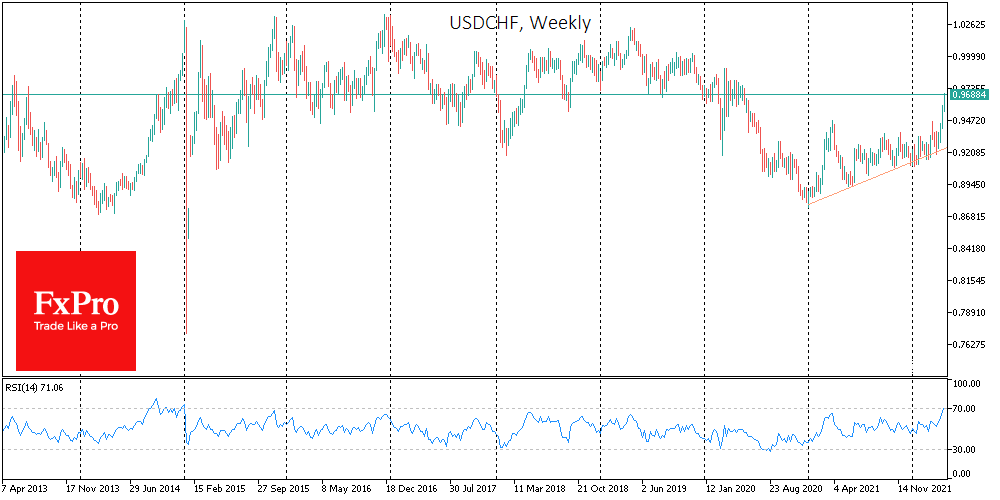
The pair rushes upward without any prolonged stop near 0.9500 (February-March 2021 pivot point). This increase attracts particular attention because it comes at the same time as impressive pressure on the financial markets, which rejects the idea of a weaker franc on recovery of demand for risky assets.
The USDCHF dynamics are now more like the behaviour of long-term government bond yields in the USA, where the downtrend of the last 40 years is breaking down. Interestingly, the long-term buying of the CHF in the previous 50 years has almost completely absorbed the loss in purchasing power of the USD. For a half-century to 2021, CHF has shown an average annual gain of 3.1% versus USD against an average 3.9% inflation.
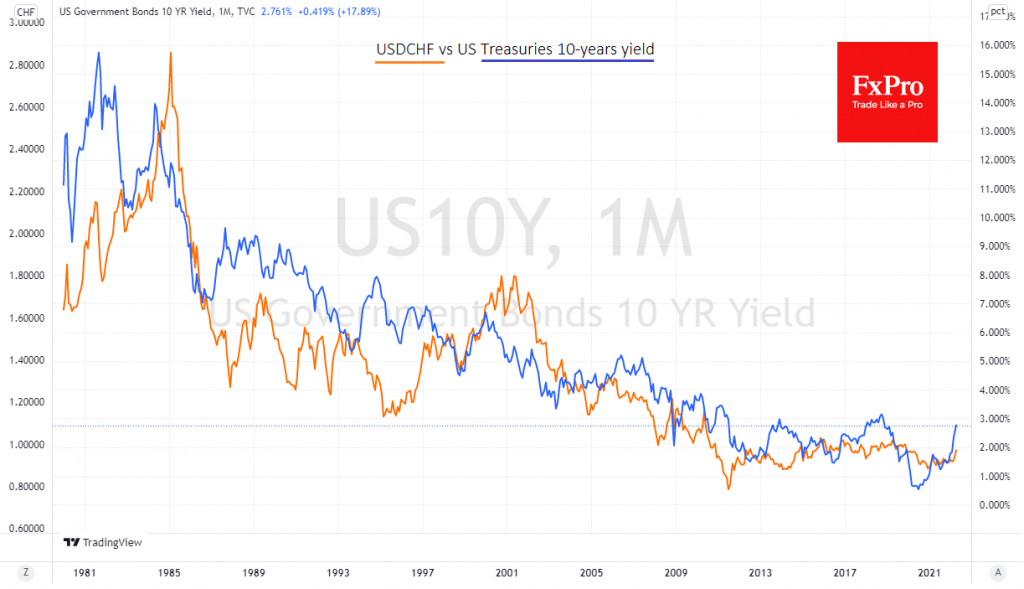
Long-term bond yields, like the USDCHF, have fallen in response to globalisation and accompanying deflationary pressures. However, this trend, which is older than many of us, is about to be broken.
The 2.78% yield on 10-year US bonds is close to the turning points of 2.9% and 3.06% in 2014 and 2018. A consolidation above 3% would thus be a turning point in a trend which has lasted more than two generations. The same can broadly be said of the USDCHF. A move above 1.02 would confirm a break from the historical trend in the 1970s that tunnelled in the mid-1980s.