Sample Category Title
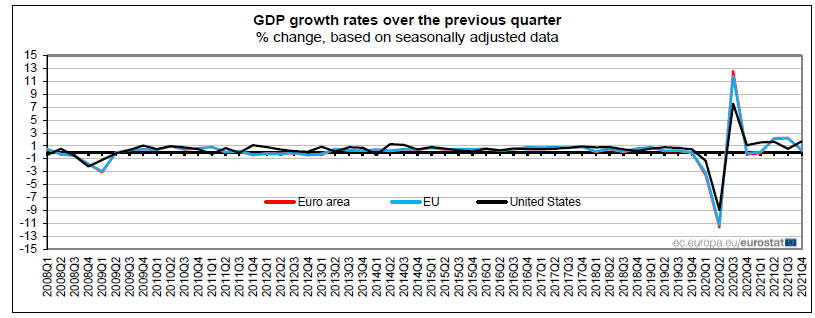
Eurozone Q4 GDP growth finalized at 0.3% qoq, EU at 0.5% qoq
Eurozone Q4 GDP growth was finalized at 0.3% qoq while employment grew 0.5% qoq. For 2021 as a whole, GDP grew 5.3%. GDP was 0.2% above pre-pandemic level in Q4 2019.
EU Q4 GDP growth was finalized at 0.4% qoq while employment grew 0.5% qoq. For 2021 as a whole, GDP grew 5.3%. GDP was 0.6% above pre-pandemic level in Q4 2019.
GDP growth by Member State: Slovenia (+5.4%) recorded the highest increase of GDP compared to the previous quarter, followed by Malta (+2.3%), Spain and Hungary (both +2.0%). Decreases were observed in Ireland (-5.4%), Austria (-1.5%), Germany (-0.3%), Croatia, Latvia and Romania (all -0.1%).
Australian Dollar Extends Losses
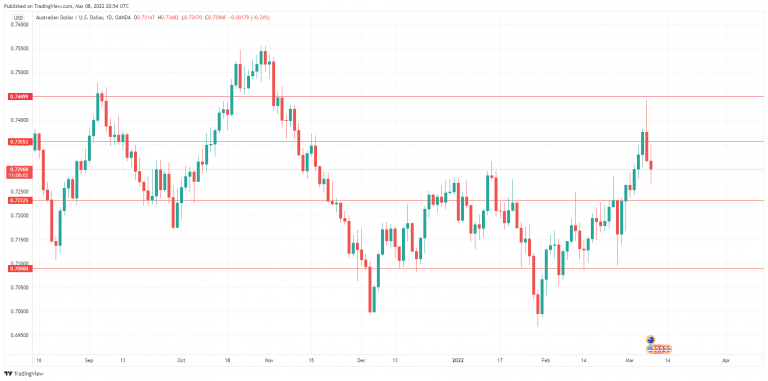
The Australian dollar continues to show strong volatility. After posting gains of 2% last week, AUD/USD has reversed directions and given up half of these gains early in the week.
There are two factors which are putting opposite pressures on the Australian dollar. The currency is a commodity-based asset, and the surge in commodity prices buoyed the Aussie last week, as Australia has many commodities which are in increasing demand in global markets as a result of the Ukraine war. This week, however, risk-aversion flows have strengthened and sent the Australian dollar on its heels, as the currency is risk-sensitive. AUD/USD has fallen below the 0.73 line and the currency is vulnerable to a deeper correction in the short term.
Business confidence jumps
Domestically, there was positive news as business confidence strengthened in February. The NAB monthly survey showed business confidence jumped to 13, up from 4 in January. After a miserable December, with a reading of -12, businesses are showing growing confidence in the first quarter. If commodity prices continue to accelelerate in the coming months, business confidence should follow suit.
We’ll get a look at Australia Westpac Consumer Confidence later today. As well, RBA Governor Philip Lowe will speak at a business summit, and investors will be listening closely for any clues with regard to rate policy.
The US dollar index has ticked lower today and is currently at 99.22. The index is heavily overbought, and traders should be prepared for a significant correction if there is positive news out of Ukraine or a correction in commodity prices. Still, with the lack of risk appetite and the Fed lift-off for rate hikes fast approaching, a drop in the dollar index will likely be temporary.
AUD/USD Technical
- There is resistance at 0.7355 and 0.7444
- AUD/USD has support at 0.7232. Below, there is support at 0.7090
USD/JPY Outlook: Dollar Regains Traction and Eyes 2022 High
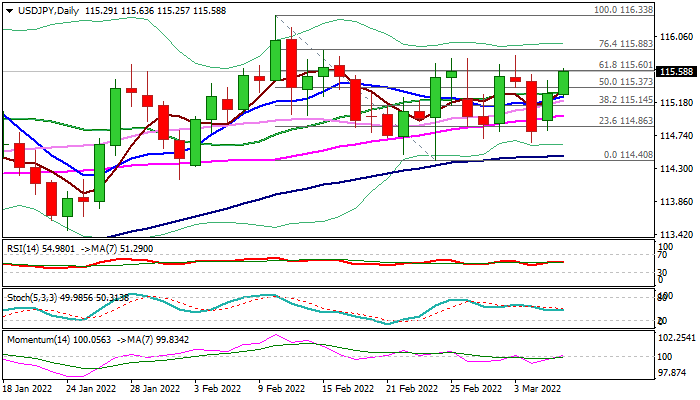
The dollar tightens grip and extends advance against yen into the second day, heading towards the top of three-week congestion at 115.80.
Improving technical studies on daily chart (north-heading 14-d momentum is emerging into positive territory and MA’s turned to full bullish setup) support the action, along with strong buying from Japanese importers.
Fresh push higher probes above pivotal Fibo barrier at 115.60 (61.8% of 116.33/114.40 bear-leg), with break here and range top (115.80) to open way for retest of 2022 high at 116.33.
Converging 10/20DMA’s are on track to form bull-cross and further underpin the action and offer solid support at 115.27 zone, which should keep the downside protected and maintain bullish near-term stance.
Res: 115.80; 116.00; 116.33; 116.79.
Sup: 115.47; 115.37; 115.27; 114.14.
EUR/USD outlook: Bears Take a Breather as News Provide a Mild Relief
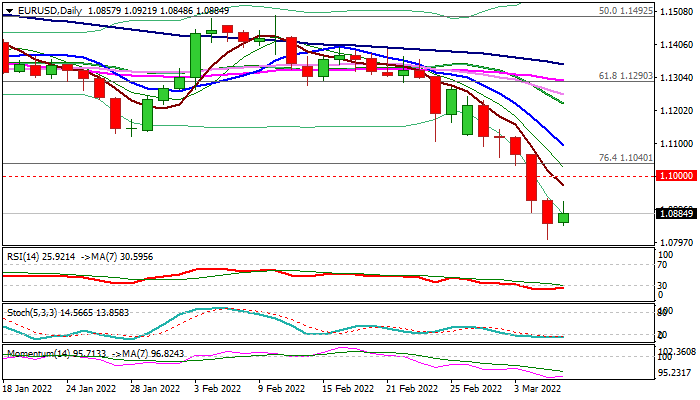
The Euro edged higher in early European trading on Tuesday, after hitting a 22-month low (1.0806) on Monday.
Upbeat German January industrial production data and a dash of optimism, as clashes in Ukraine, eased and talks between two sides gave some results, paused bears.
Germany’s opposition to US suggestion of banning imports of Russian energy products added to improved near-term sentiment and revived risk appetite that prompted investors to collect some profits from the steep fall in past five days.
Overall picture, however, remains bearish, as Europe is facing big problems with skyrocketing energy prices, with the worst scenario seen on adding Russian energy imports to the list of sanctions that would strongly hurt bloc’s economy, highly dependent on Russian gas and oil, as well as raw materials.
Markets focus today’s EU Q4 GDP data (q/q 0.3% f/c vs 2.2% in Q3) and Thursday’s ECB policy meeting, although not expecting any significant relief from the central bank’s decision in the current circumstances.
Current bounce is likely to be limited (ideally under broken key supports, now solid resistances at 1.1040/00) and provide better levels to re-enter bearish market for possible extension towards target at 1.0635 (2020 pandemic low).
Only sustained break above these levels would ease strong bearish pressure and signal temporary bottom that would allow for stronger correction.
Res: 1.0931; 1.0969; 1.1000; 1.1040.
Sup: 1.0806; 1.0766; 1.0727; 1.0700.
Bitcoin Turned Against the Tide
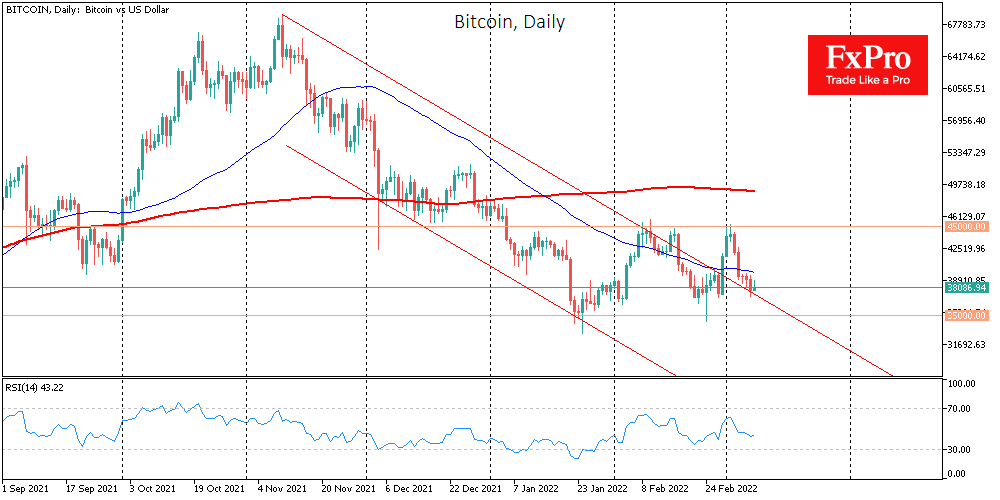
BTC is holding at $38K for the second day in a row, remaining 12% below the levels it reached a week earlier. Ethereum lost 1.3% over the past day, other leading altcoins from the top ten are moving in the range between +1% (BNB) to -4% (XRP).
According to CoinMarketCap, the total capitalization of the crypto market decreased by 0.2% over the day, to $1.71 trillion. The Bitcoin Dominance Index added 0.1% to 42.4%.
The Fear and Greed Cryptocurrency Index lost 2 points to 21 in a day and remains in a state of “extreme fear”.
Bitcoin has started this week with a drawdown along with a decline in all risky assets on reports of intensified hostilities in Ukraine. In the middle of the day, BTC managed to turn against the tide, winning back the initial failure, despite the decline in stock indices.
Big players are piling up USDT during the decline of bitcoin in order to probably buy the first cryptocurrency at a lower price, according to Santiment. Including, according to Whale Alert, a wallet with 407 BTC “woke up”, which has not been active since 2013. It may well expect big deals from him in the near future.
One of the founders of Apple, Steve Wozniak, said that most crypto assets are robbery and fraud. However, he has always admired bitcoin and called it in 2020 a “unique mathematical marvel”, but specified that he wasn’t planning to invest in BTC.
Metals’ melting point
While the world discusses the prospect of an embargo on Russian oil and gas, the absolute madness is in metals. In many of them, Russia has a pretty significant share, and investors fear a ban on exports could be Russia’s response to sanctions, on a par with restricting supplies of agricultural products.
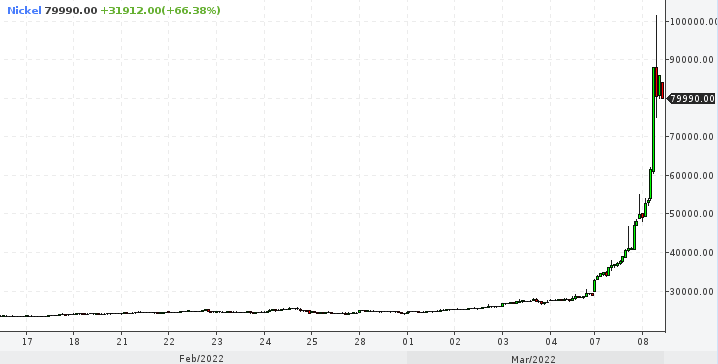
Palladium set a new all-time high at $3439 on Monday, gaining 14.8% on the day at one point. Nickel reached $100,000/tonne, gaining more than 200% over the two days, but soon retreated to $82,000 (+71% since the start of the day). Aluminium reached $4000 per tonne on Monday, compared with stabilization at $2600 from November to mid-December.
Copper exceeded $10800/tonne yesterday, rewriting its historic high.
Still, if we apply ‘peacetime’ patterns, we can see short-squeezes and a final capitulation by the bears in one metal after another. A reversal usually follows this.
Copper and palladium have been sliding hard after making new all-time highs, and we’re now seeing a distinct tug-of-war between the buyers and the sellers, at an impressive distance from yesterday’s extremes. Nickel is retracing a sharp bounce today.
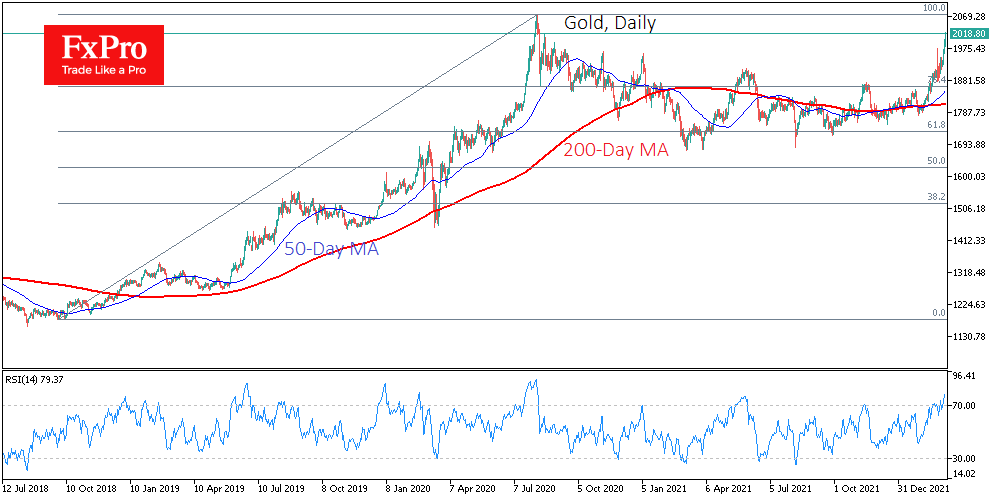
The price of Gold troy ounce reached $2020 earlier on Tuesday, having hit new highs since August 2020. The momentum in gold gained new strength after restrictions from cryptocurrency exchanges for Russian residents.
But here, too, it is worth betting with great caution on the upside, as there will be a big seller entering the market. The Bank of Russia, for the most part, has no other means but to sell off the gold from its reserves in Russia. These steps could be taken tomorrow, as Monday and Tuesday were national holidays. Those actions will keep the price of gold on the way to the all-time highs near $2075, where it could be as early as this week.
However, the chances are higher that more sellers will enter into gold, which will cool the current rally, temporarily correcting the price into the $1960-2000 area before the end of March.
GBPUSD Downside Pressures Weigh on 1.3100 Handle
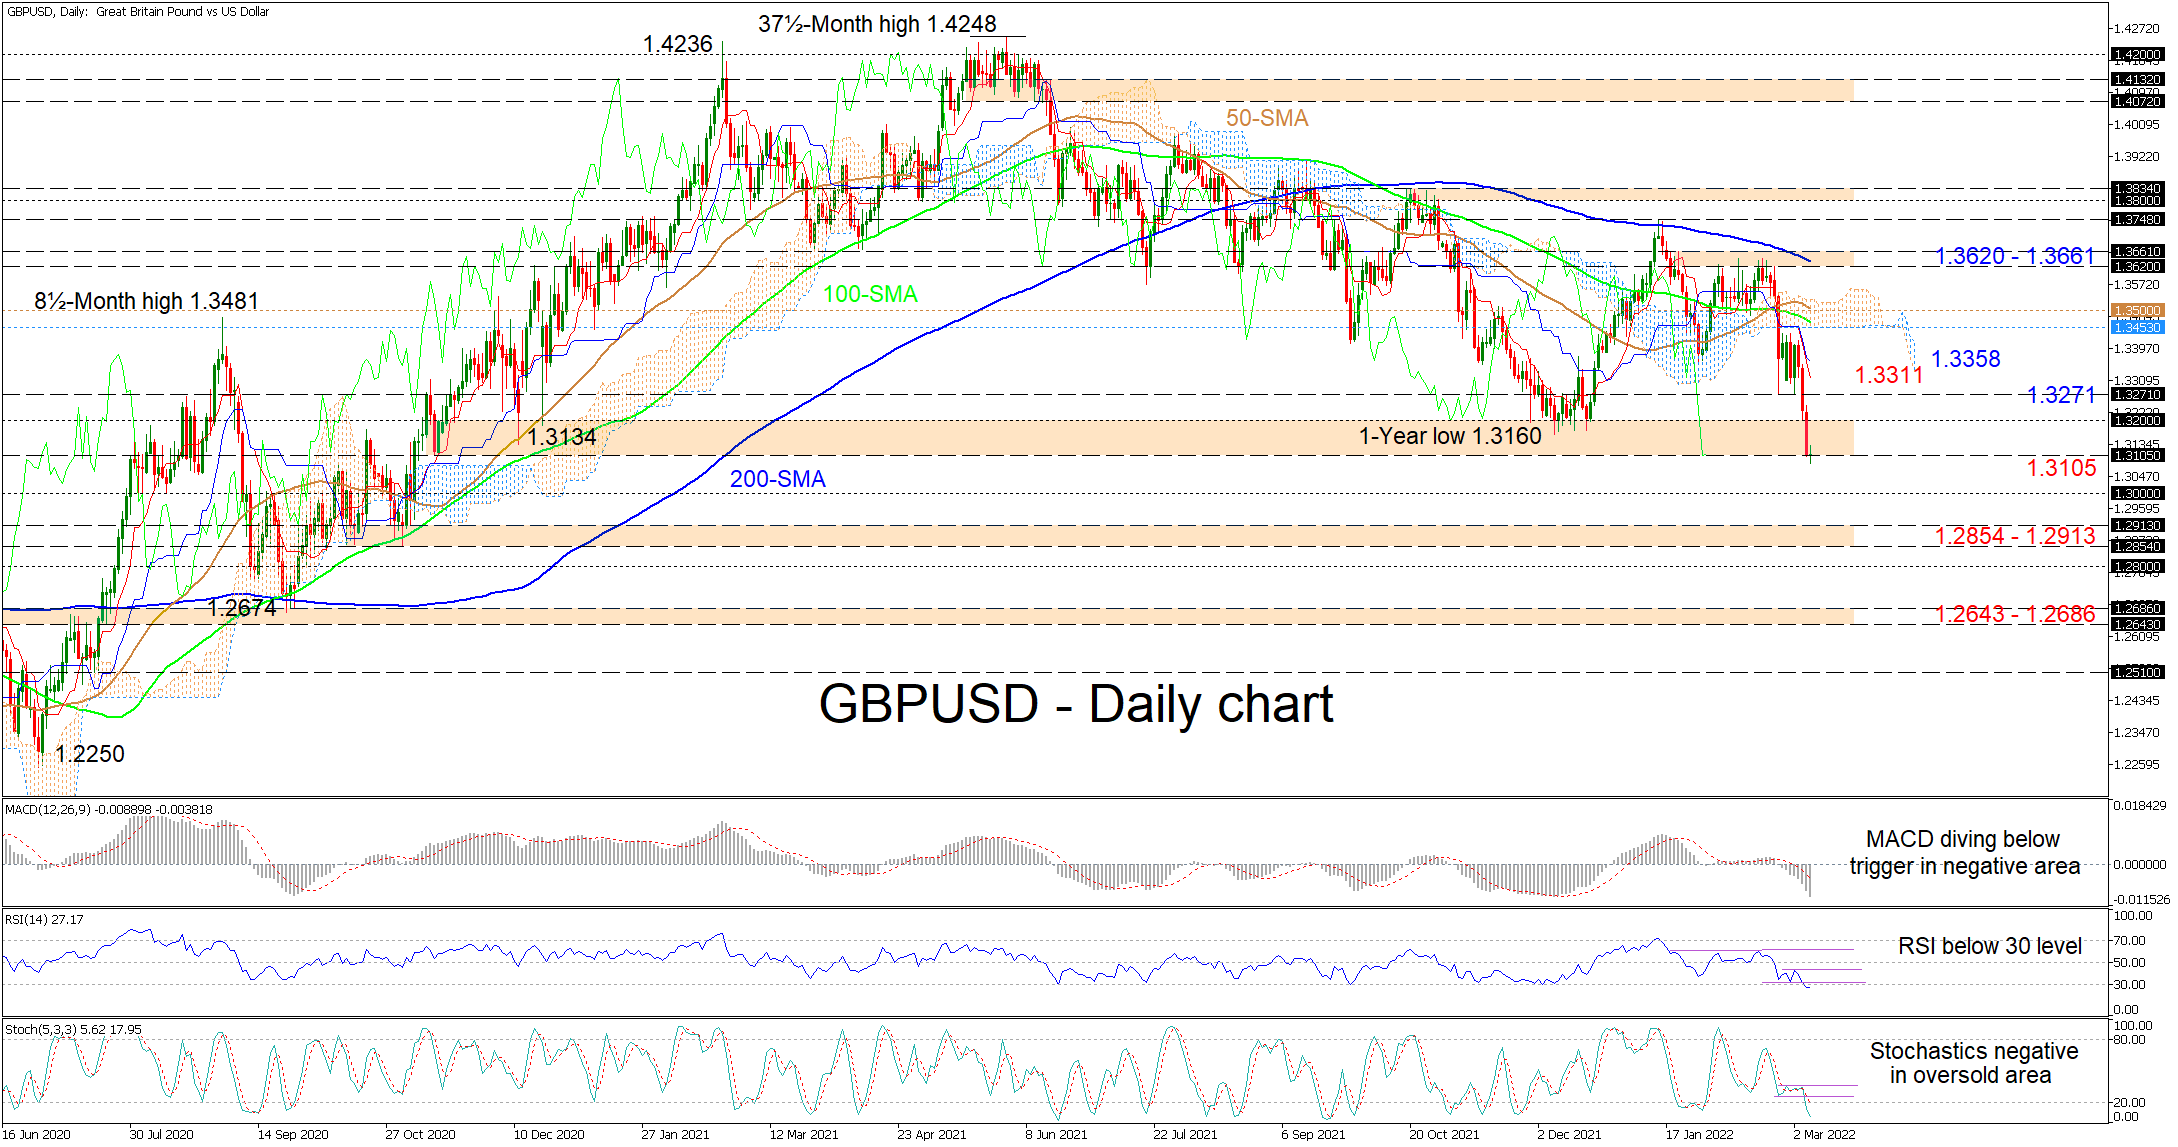
GBPUSD is confronting the lower part of the 1.3105-1.3200 buffer zone, which has defended the broader positive structure since November 2020. The longer-term 100- and 200-day simple moving averages (SMAs) are endorsing a bearish trend, while the fresh dip in the 50-day SMA, indicates the downward trend has intensified.
The falling Ichimoku lines suggest firm bearish forces are present, while the short-term oscillators are skewed to the downside. The MACD, far south of the zero threshold, is sinking deeper beneath its red signal line, while the stochastic oscillator is sustaining a strong negative charge in the oversold territory. The RSI is just underneath the 20 level and has yet to confirm waning in its bearish bearing.
If the 1.3105 barrier fails to keep negative pressures at bay, preliminary downward limitations could evolve around the 1.3000 mark prior to the 1.2854-1.2913 support band, which stretches back to the October 2020 lows. Should sellers maintain dominance, they could then meet the 1.2800 handle before pursuing the 1.2643-1.2686 support border that began around mid-June 2020.
Otherwise, if the 1.3105 region provides buyers with a foothold and the pair lifts back above the 1.3200 level, downside defences could commence around the 1.3271 inside swing low ahead of the descending Ichimoku lines at 1.3311 and 1.3358 respectively. Pushing higher, buyers may then encounter a tough resistance section beginning from the Ichimoku cloud’s floor at 1.3453 until the 50-day SMA at 1.3500. In the event the bulls pilot above the cloud, the door opens for a test of the fortified 1.3620-1.3661 resistance band, which encapsulates the 200-day SMA.
Summarizing, GBPUSD’s short-term picture is looking increasingly bearish. A convincing break below the 1.3105 barrier would ramp up the negative outlook. Meanwhile, for optimism to return in the pair, the price would need to climb above the 1.3620-1.3661 resistance band but piloting beyond the 1.3834 high, would be necessary to resuscitate bullish prospects.
Gold Re-enters 2,000 Zone; Outlook Bullish
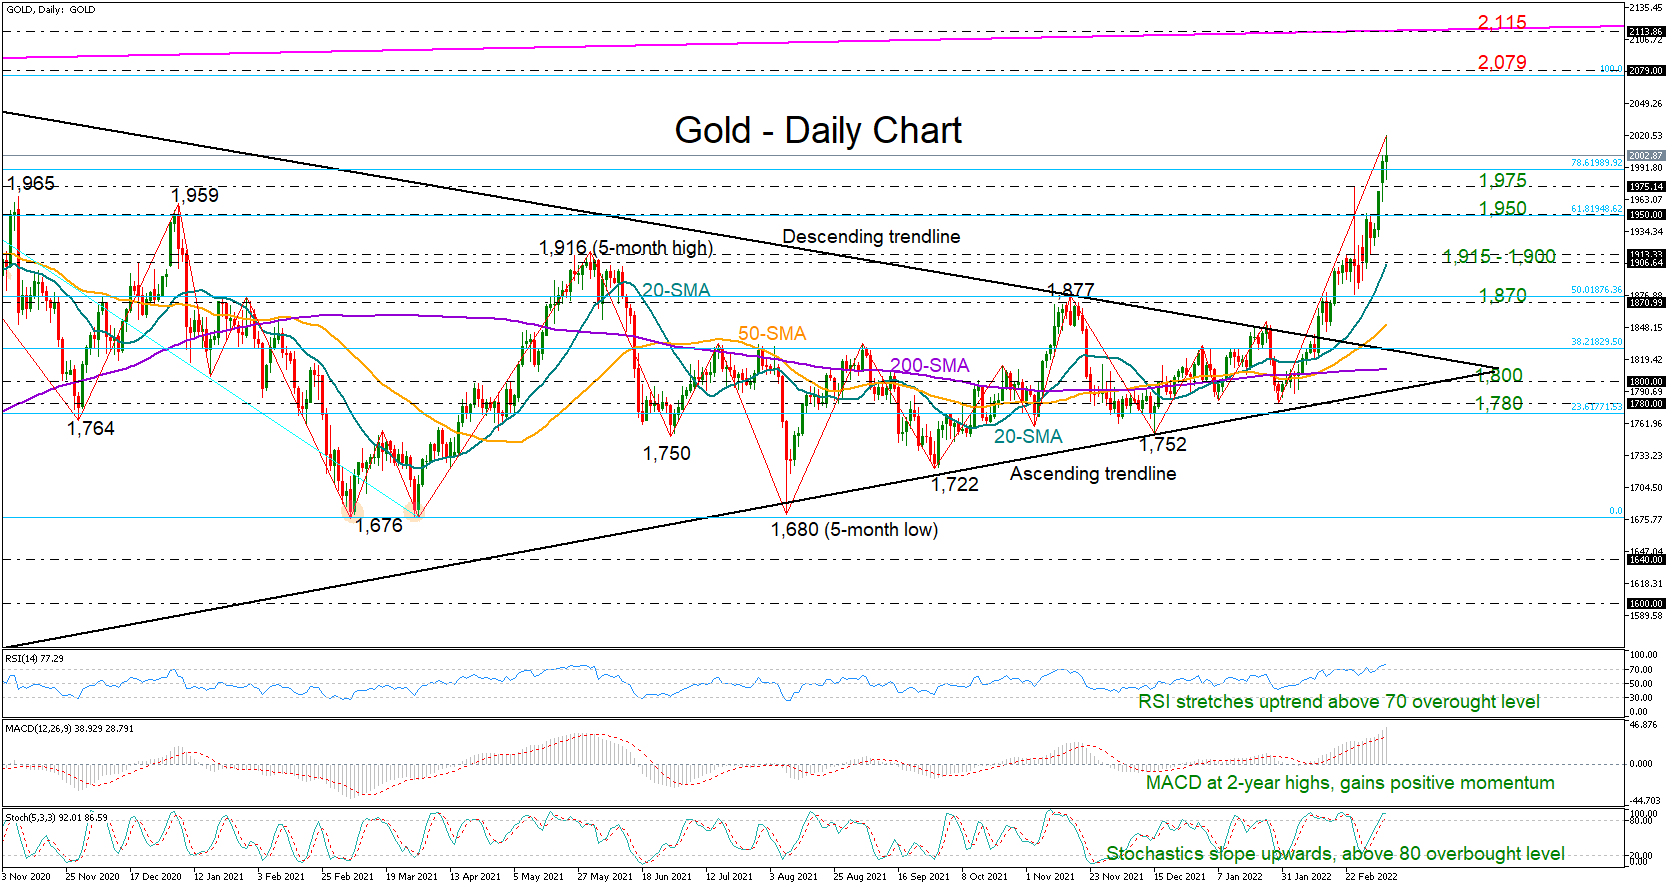
Gold staged another exciting bullish run early on Tuesday to finally re-enter the 2,000 level after almost two years since its pandemic peak.
Particularly, the price is currently testing the resistance zone of 2,020 from August 2020, making any downside corrections or some consolidation likely at this point as the RSI and the Stochastics flash overbought conditions. That said, neither of those indicators is showing signs of abating, while the MACD continues to gain momentum at two-year highs, reflecting persisting buying forces.
Meanwhile in trend indicators, the shorter-term simple moving averages (SMAs) keep pointing upwards with a steeper positive slope than the longer-term SMAs, endorsing the improving broad outlook in the market.
On the upside, the biggest challenge will be the 2,079 record high and potentially the 2,115 region, where the tentative ascending line that joins the 2011 and 2020 peaks is passing through. A sustainable extension above that boundary may hit a new wall around the 2,300 level taken from the 161.8% Fibonacci retracement of the 2,079 – 1,676 downleg.
Should selling pressures resurface, initial support could commence around the 1,975 zone, while a sharper decline below 1,950 could squeeze the price towards the 1,915 – 1,900 area and the 20-day SMA. Lower, the bears could take a rest somewhere near 1,870.
Summarizing, gold has opened the gates towards the 2,079 record high after restoring its bullish outlook in the long-term picture. While some stabilization could be normal after the impressive three-day rally, the technical picture suggests buyers may not easily lose their interest in the market.
SPX 500 Struggles to Rebound
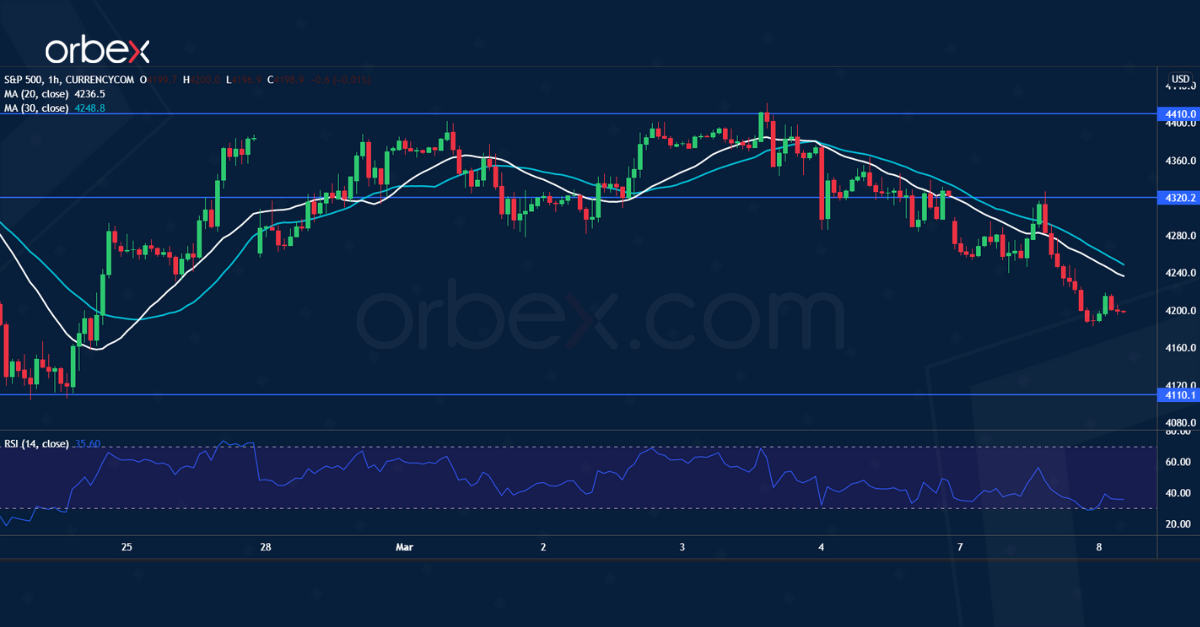
The S&P 500 extended losses as investors are wary of a global economic downturn.
On the daily chart, a brief rebound has met stiff selling pressure on the 30-day moving average (4410). In fact, this indicates that the bearish mood still dominates after the index fell through 4250. Buyers have failed to hold above 4230, leaving the market vulnerable to another round of sell-off.
4110 is the next stop and a bearish breakout could lead to the psychological level of 4000. 4320 is now the closest resistance ahead.
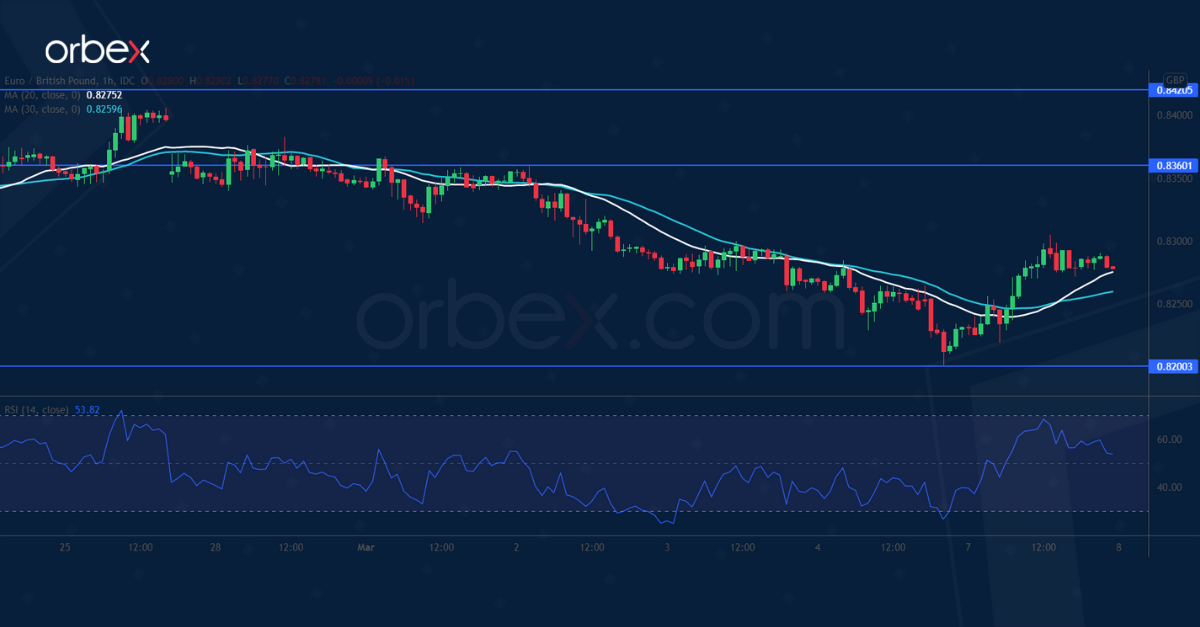
EUR/GBP Bounces Back
The euro recoups losses as shorts cover ahead of the ECB meeting. The pair’s fall below the major floor (0.8280) on the daily chart further weighs on sentiment.
The lack of support suggests that traders’ are wary of catching a falling knife. The RSI’s double-dip into the oversold area has led to profit-taking, driving the price up.
However, the rally could turn out to be a dead cat bounce if the bears fade the rebound in the supply zone around 0.8360. 0.8200 is fresh support when momentum comes back again.