Sample Category Title
S&P 500 Index: Chart Analysis After Friday’s Sell-Off
Trading on 12 December was overshadowed by a sharp decline in the S&P 500 (US SPX 500 mini on FXOpen), with the session low approaching December’s previous trough.
Among the key fundamental drivers behind Friday’s drop was the market reaction to Broadcom’s quarterly report. Shares (AVGO) plunged more than 10%, possibly as investors aggressively took profits in tech stocks, concerned that the AI hype may be overheated.
A review of the 4-hour chart of the S&P 500 (US SPX 500 mini on FXOpen) suggests that Friday’s negative sentiment may have begun to ease, as the index is now recovering. Overall, this presents an interesting picture from a price-action perspective.
Technical Analysis of the S&P 500 Chart
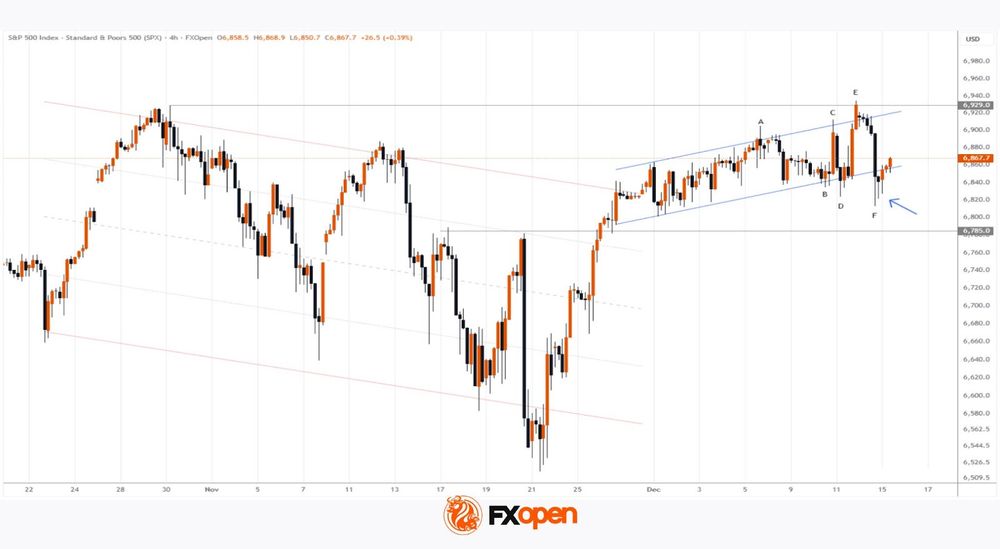
Five days ago, we noted that an ascending channel had formed in early December, which could be interpreted as cautious optimism ahead of key news.
However, Fed-related announcements triggered a surge in volatility (as we described, “the calm before the storm”), pushing prices beyond both boundaries of the blue channel:
→ The failure to hold above the upper boundary can be seen as bulls lacking confidence to challenge the all-time high. The false break around 6929 looks like a trader trap.
→ Conversely, bears may have been unable to suppress buying near Friday’s low, as indicated by the long lower wicks on the candles (highlighted by the arrow).
The chart now shows a complex Megaphone pattern (marked A–F).
It is possible that the coming week will be characterised by consolidation following Wednesday–Friday’s swings, with market sentiment increasingly influenced by the approaching holiday period.
Trade global index CFDs with zero commission and tight spreads. Open your FXOpen account now or learn more about trading index CFDs with FXOpen.
This article represents the opinion of the Companies operating under the FXOpen brand only. It is not to be construed as an offer, solicitation, or recommendation with respect to products and services provided by the Companies operating under the FXOpen brand, nor is it to be considered financial advice.
AUD/USD and NZD/USD Test Support, Break or Bounce Next?
AUD/USD is attempting a fresh increase from 0.6630. NZD/USD is consolidating and could aim for a move above 0.5800 in the short term.
Important Takeaways for AUD/USD and NZD/USD Analysis Today
- The Aussie Dollar started a minor pullback from 0.6685 against the US Dollar.
- There is a key bullish trend line forming with support at 0.6645 on the hourly chart of AUD/USD at FXOpen.
- NZD/USD is consolidating above 0.5765 and 0.5755.
- There is a major bullish trend line forming with support at 0.5765 on the hourly chart of NZD/USD at FXOpen.
AUD/USD Technical Analysis
On the hourly chart of AUD/USD at FXOpen, the pair formed a base above 0.6600. The Aussie Dollar started a decent increase above 0.6630 against the US Dollar to enter a short-term positive zone.
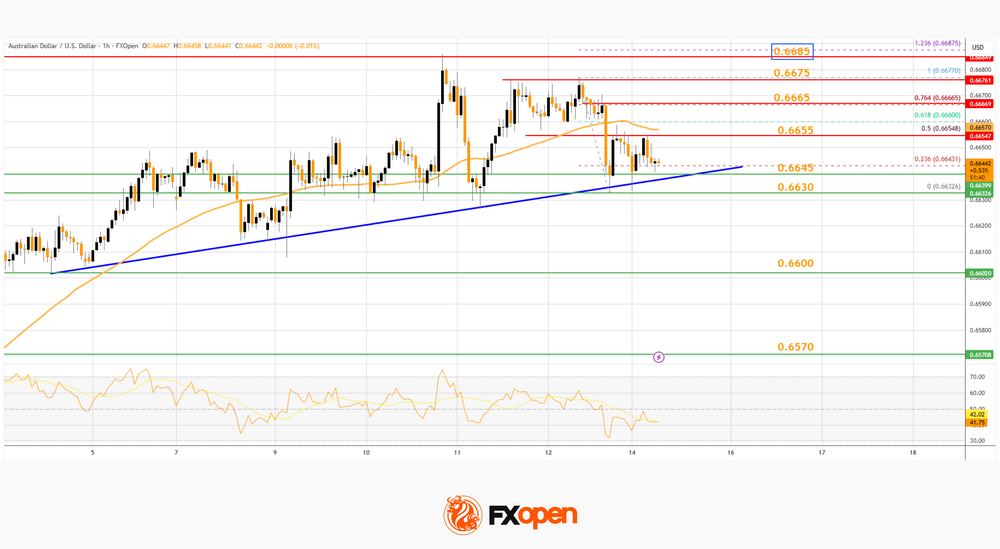
The pair struggled above 0.6680 and recently corrected some gains. The recent low was formed at 0.6632. The pair is now consolidating and facing resistance near the 50% Fib retracement level of the downward move from the 0.6677 swing high to the 0.6632 low at 0.6655 and the 50-hour simple moving average.
The AUD/USD chart indicates that the pair could struggle to clear the 76.4% Fib retracement at 0.6665. The first major hurdle for the bulls could be 0.6685.
An upside break above 0.6685 resistance might send the pair further higher. The next major target is near the 0.6720 level. Any more gains could clear the path for a move toward 0.6750. If there is no close above 0.6665, the pair might start a fresh decline.
Immediate bid zone could be near the 0.6645 level. There is also a key bullish trend line forming with support at 0.6645. The next area of interest is 0.6630. If there is a downside break below 0.6630, the pair could extend its decline toward 0.6600. Any more losses might signal a move toward 0.6570.
NZD/USD Technical Analysis
On the hourly chart of NZD/USD on FXOpen, the pair also followed AUD/USD. The New Zealand Dollar failed to stay above 0.5800 and corrected gains against the US Dollar.
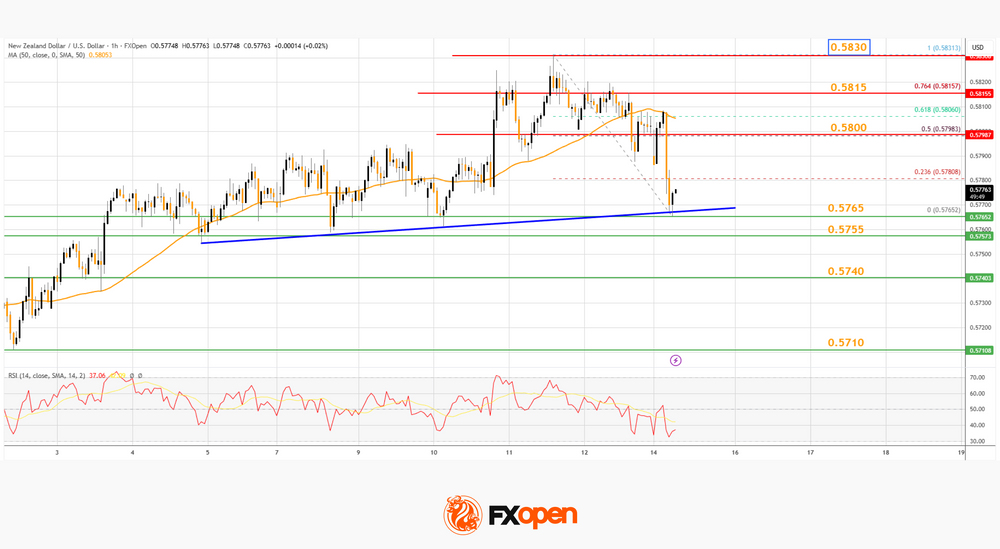
The pair dipped below 0.5790 and the 50-hour simple moving average and 0.5830. A low was formed at 0.5765, and the pair is now consolidating below the 23.6% Fib retracement level of the downward move from the 0.5831 swing high to the 0.5765 low.
The NZD/USD chart suggests that the RSI is below 40, signaling a short-term negative bias. On the upside, the pair is facing resistance near the 50% Fib retracement level at 0.5800.
The next major hurdle for buyers could be 0.5815. A clear move above 0.5815 might even push the pair toward 0.5830. Any more gains might clear the path for a move toward the 0.5880 pivot zone in the coming sessions.
On the downside, there is support forming near the 0.5765 zone and a bullish trend line. If there is a downside break below 0.5765, the pair might slide toward 0.5740. Any more losses could lead NZD/USD into a bearish zone to 0.5710.
Trade over 50 forex markets 24 hours a day with FXOpen. Take advantage of low commissions, deep liquidity, and spreads from 0.0 pips. Open your FXOpen account now or learn more about trading forex with FXOpen.
This article represents the opinion of the Companies operating under the FXOpen brand only. It is not to be construed as an offer, solicitation, or recommendation with respect to products and services provided by the Companies operating under the FXOpen brand, nor is it to be considered financial advice.
USD/JPY Slides Towards Key Support
A Bank of Japan monetary policy meeting is due this week, and expectations around the decision are supporting the yen today. Traders increasingly believe that the central bank may raise its policy rate by 25 basis points to 0.75%.
Moreover, according to Trading Economics, analysts expect the interest rate to reach 1% by July 2026. Senior officials in Prime Minister Sanae Takaichi’s cabinet are also unlikely to oppose tighter policy, as an excessively weak yen could drive up import costs and fuel inflation.
Technical Analysis of the USD/JPY Chart
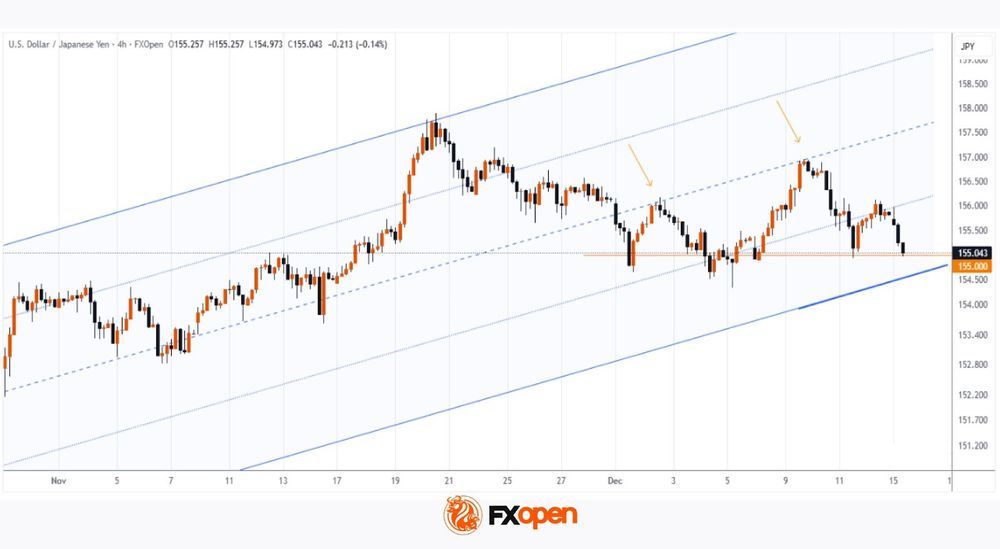
The chart shows USD/JPY moving lower today towards the important support level at ¥155 per dollar. Earlier this month, bears attempted to break below this level but failed to gain leading momentum.
Notably, market fluctuations since October have formed an ascending channel. Within this framework:
→ the channel median has twice acted as resistance, a bearish signal;
→ the price is currently near the lower boundary of the channel, which may serve as strong support.
Given these factors, it is reasonable to assume that expectations of tighter monetary policy could lead to a break below the combined support formed by the lower channel boundary and the key 155.00 level. If this occurs, the area could turn into resistance, opening the way for USD/JPY to move towards the next major support near ¥150 per dollar.
Trade over 50 forex markets 24 hours a day with FXOpen. Take advantage of low commissions, deep liquidity, and spreads from 0.0 pips. Open your FXOpen account now or learn more about trading forex with FXOpen.
This article represents the opinion of the Companies operating under the FXOpen brand only. It is not to be construed as an offer, solicitation, or recommendation with respect to products and services provided by the Companies operating under the FXOpen brand, nor is it to be considered financial advice.
EUR/USD Daily Outlook
Daily Pivots: (S1) 1.1723; (P) 1.1737; (R1) 1.1753; More….
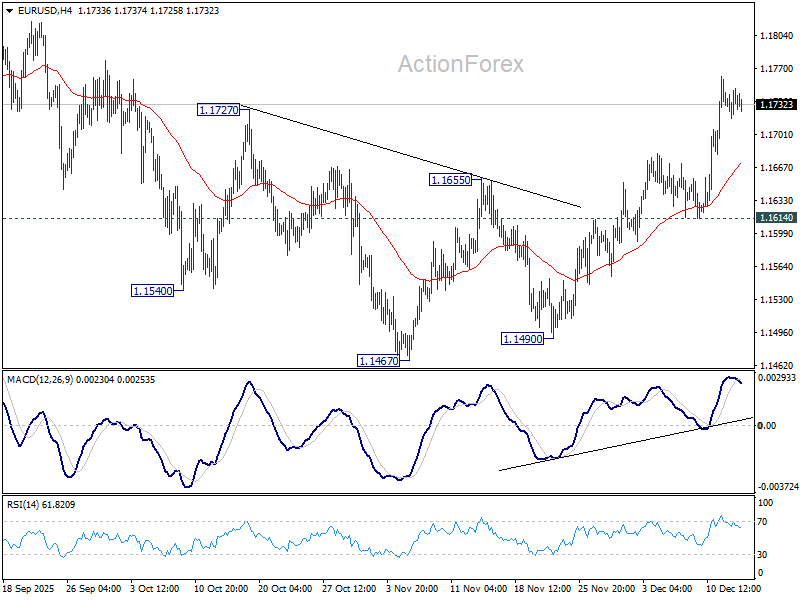
Intraday bias in EUR/USD remains mildly on the upside for the moment. Further rise should be seen to retest 1.1917 high. Decisive break there will resume larger up trend. For now, risk will stay on the upside as long as 1.1614 support holds, in case of retreat.
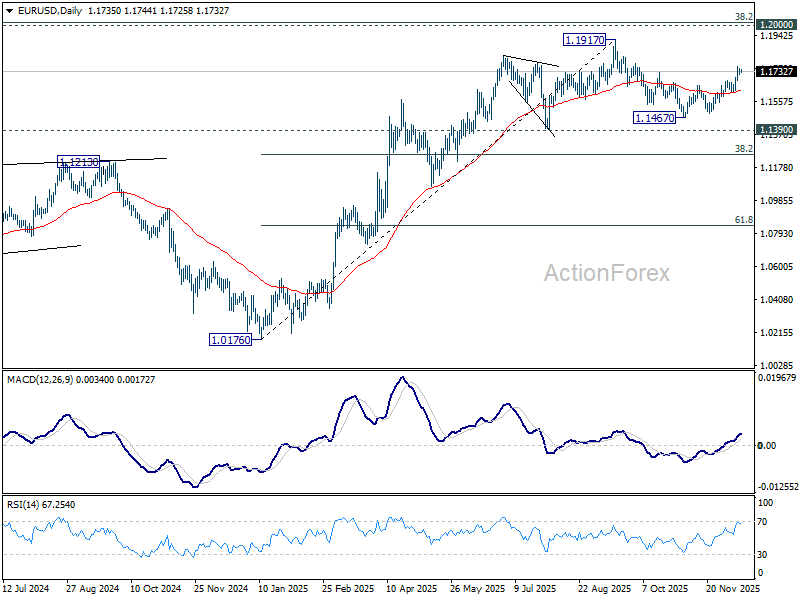
In the bigger picture, as long as 55 W EMA (now at 1.1373) holds, up trend from 0.9534 (2022 low) is still in favor to continue. Decisive break of 1.2 key psychological level will carry larger bullish implication. However, sustained trading below 55 W EMA will argue that rise from 0.9534 has completed as a three wave corrective bounce, and keep long term outlook bearish.
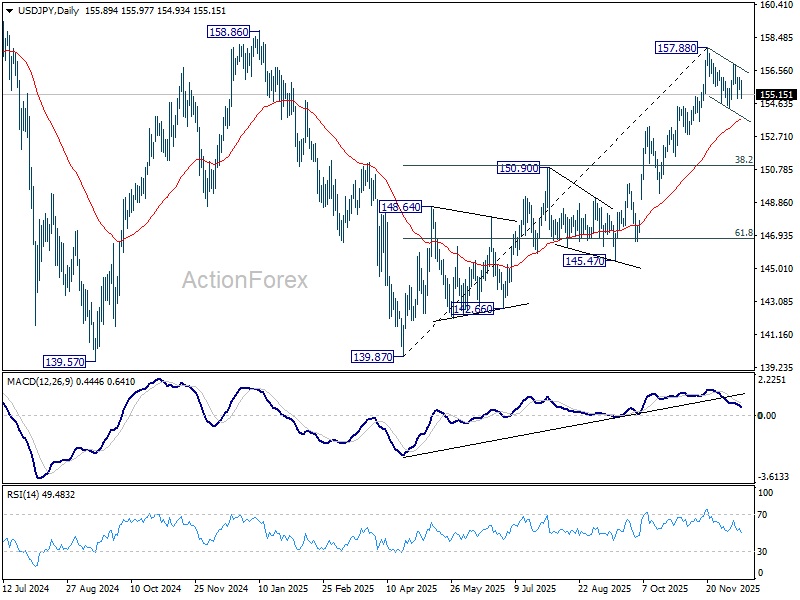
USD/JPY Daily Outlook
Daily Pivots: (S1) 155.47; (P) 155.80; (R1) 156.15; More...
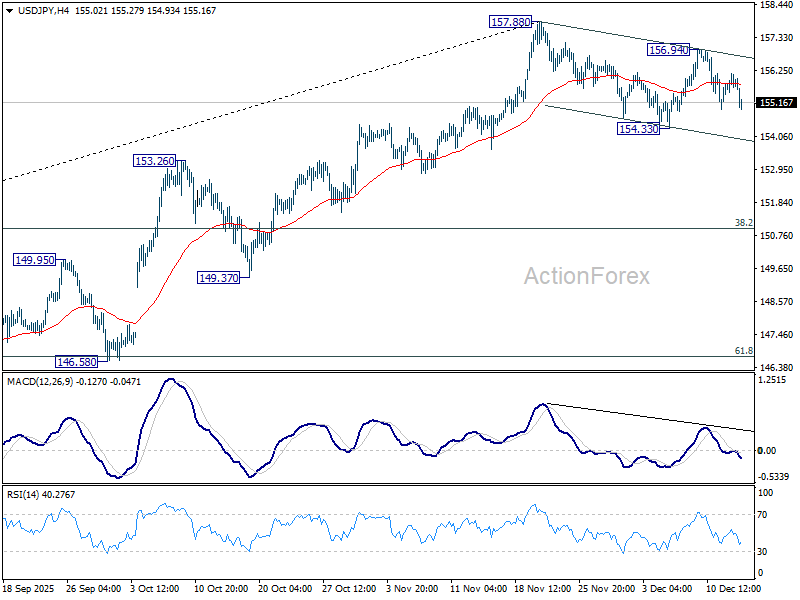
Intraday bias in USD/JPY stays neutral as consolidations from 157.88 is in progress. On the downside, break of 154.33 will target 55 D EMA (now at 153.66) and possibly below. On the upside, above 156.94 will bring retest of 157.88. Firm break there will resume whole rally from 139.87 to 158.85 key structural resistance.
In the bigger picture, corrective pattern from 161.94 (2024 high) could have completed with three waves at 139.87. Larger up trend from 102.58 (2021 low) could be ready to resume through 161.94 high. Decisive break of 158.85 structural resistance will solidify this bullish case and target 161.94 for confirmation. On the downside, break of 150.90 resistance turned support will dampen this bullish view and extend the corrective range pattern with another falling leg.
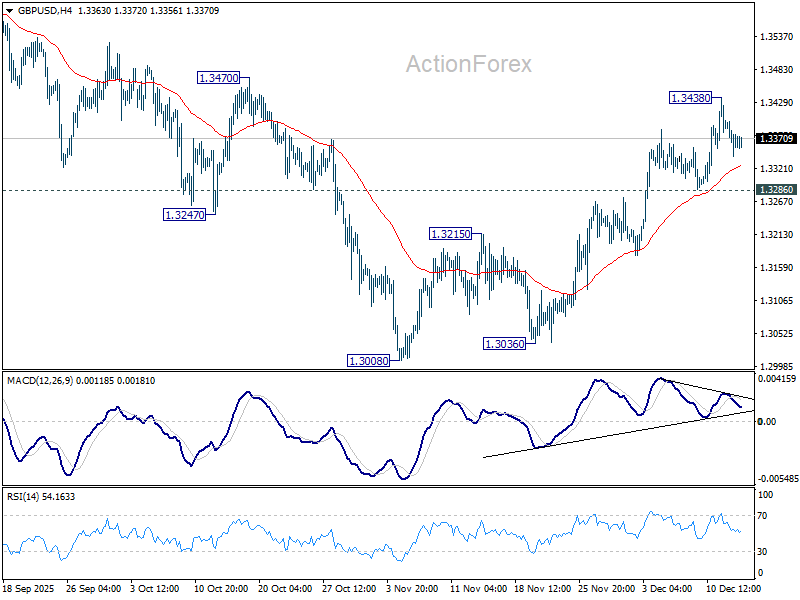
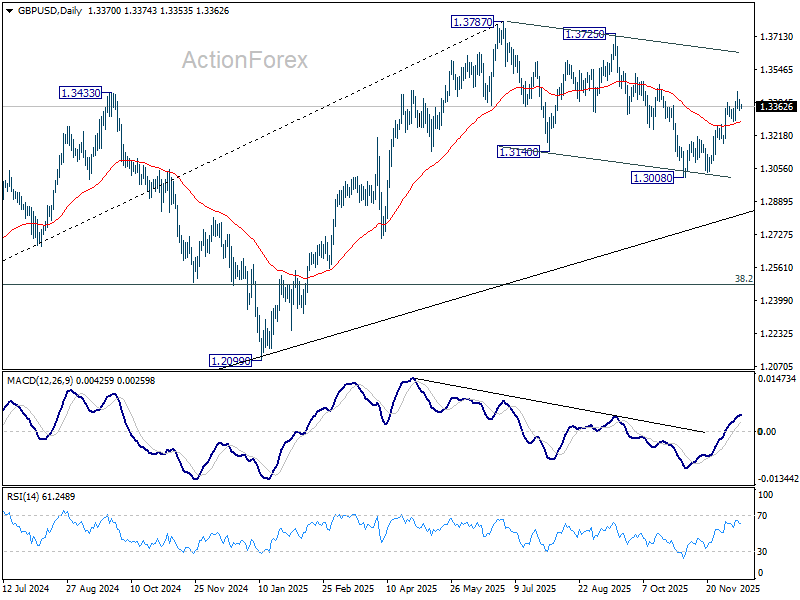
GBP/USD Daily Outlook
Daily Pivots: (S1) 1.3342; (P) 1.3371; (R1) 1.3400; More...
Intraday bias in GBP/USD remains neutral and further rally is expected as long as 1.3286 support holds. As noted before, fall from 1.3787 should have completed as a three-wave correction to 1.3008. Above 1.3428 and firm break of 1.3470 resistance will pave the way back to retest 1.3787 high. However, sustained break of 1.3286 support will mix up the near term outlook.
In the bigger picture, current development suggests that fall from 1.3787 is merely a corrective move, and larger rise from 1.0351 (2022 low) is still in progress. Firm break of 1.3787 will target 1.4248 (2021 high) key structural resistance. This will remain the favored case as long as target 38.2% retracement of 1.0351 to 1.3787 at 1.2474 holds, in case of another fall.
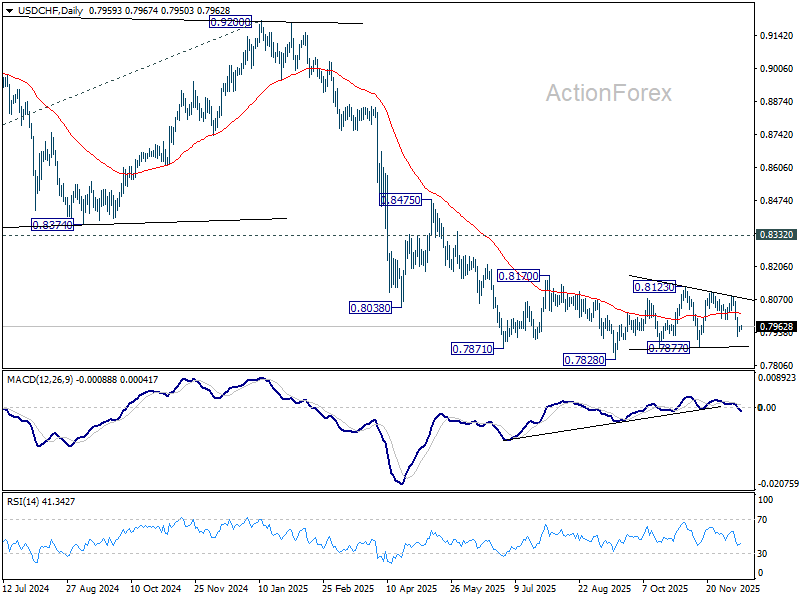
USD/CHF Daily Outlook
Daily Pivots: (S1) 0.7946; (P) 0.7955; (R1) 0.7970; More…
Intraday bias in USD/CHF remains neutral for the moment. Overall outlook is unchanged that corrective pattern from 0.7828 is still extending. On the downside, below 0.7923 will target 0.7877 support. On the upside, though, break of 0.7990 support turned resistance will bring stronger rebound towards 0.8084.
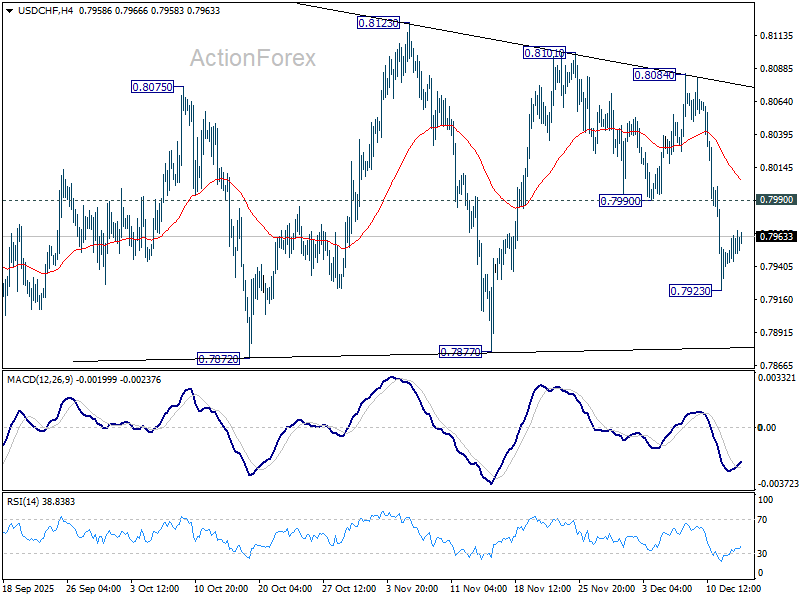
In the bigger picture, outlook will stay bearish as long as 0.8332 support turned resistance holds (2023 low). Long term down trend from 1.0342 (2017 high) is still in progress. Next target is 100% projection of 1.0146 (2022 high) to 0.8332 from 0.9200 at 0.7382.
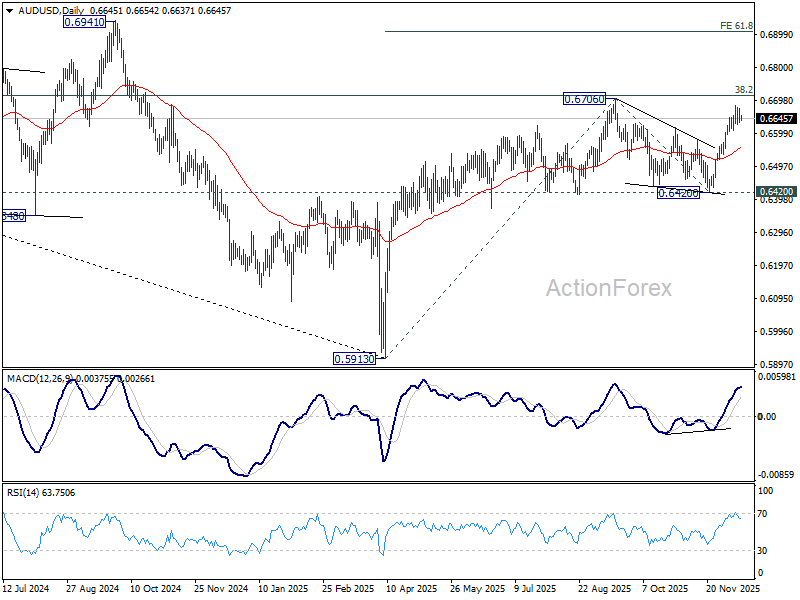
AUD/USD Daily Report
Daily Pivots: (S1) 0.6632; (P) 0.6655; (R1) 0.0.6676; More...
Intraday bias in AUD/USD stays neutral and some more consolidations could be seen below 0.6685. On the upside, firm break of 0.6706 will confirm resumption of whole rise from 0.5913. Next target is 61.8% projection of 0.5913 to 0.6706 from 0.6420 at 0.6910. However, break of 55 D EMA (now at 0.6556) will extend the corrective pattern from 0.6706 with another falling leg.
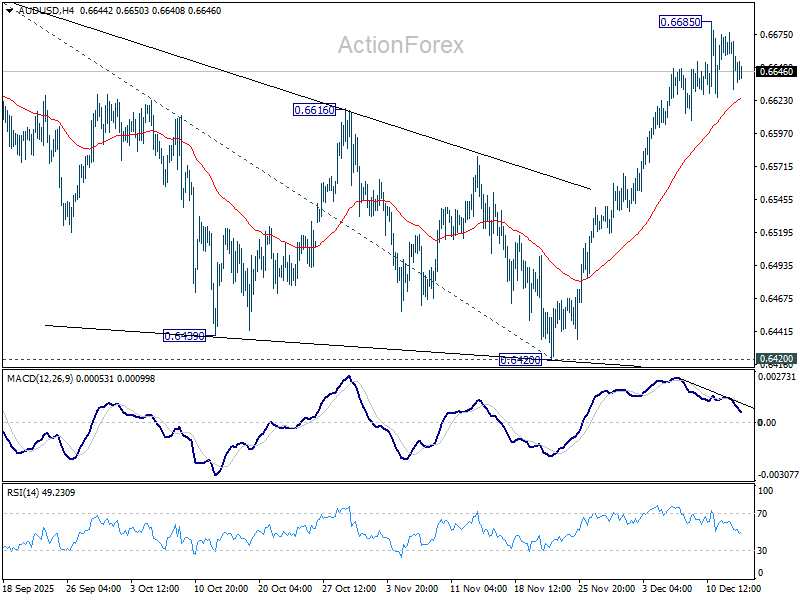
In the bigger picture, the break of multi-year falling trend line resistance suggests that rise from 0.5913 is possibly reversing whole down trend from 08006 (2021 high). Decisive break of 38.2% retracement of 0.8006 to 0.5913 at 0.6713 will solidify this case, and bring further rally to 61.8% retracement at 0.7206. On the downside, however, firm break of 0.6420 support will suggest rejection by 0.6713 and retain medium term bearishness.
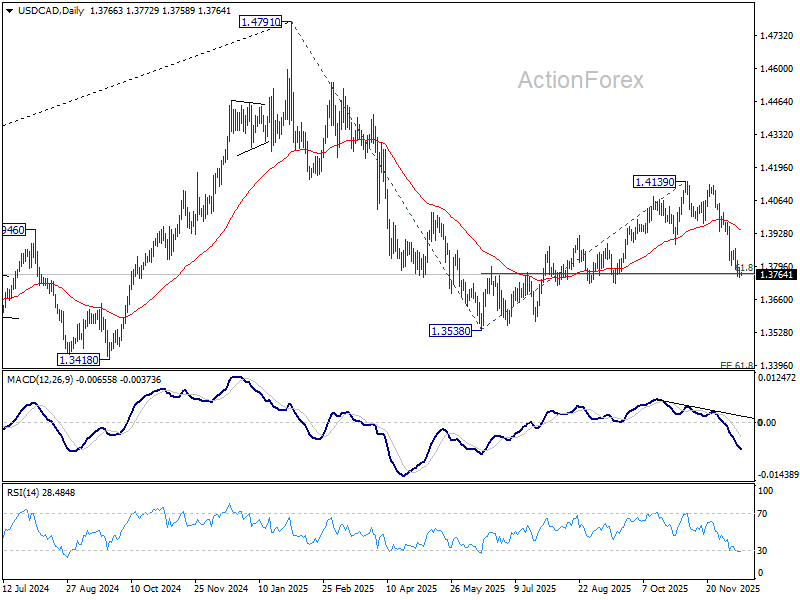
USD/CAD Daily Outlook
Daily Pivots: (S1) 1.3752; (P) 1.3773; (R1) 1.3793; More...
Intraday bias in USD/CAD stays mildly on the downside for the moment. Sustained trading below 61.8% retracement of 1.3538 to 1.4139 at 1.3768 will argue that whole decline form 1.4791 might be ready to resume and targets a retest on 1.3538 low. On the upside, however, break of 1.3870 resistance will indicate short term bottoming, and turn bias back to the upside for stronger rebound.
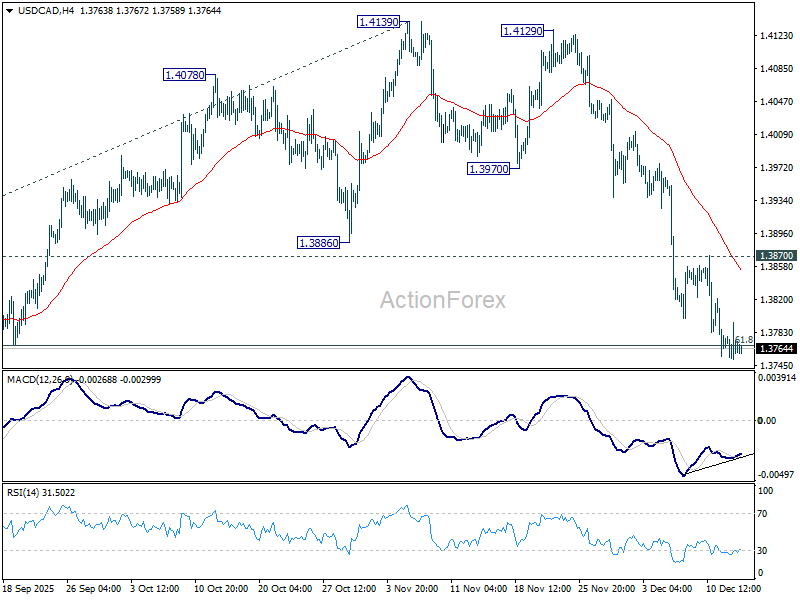
In the bigger picture, current development suggests that price actions from 1.4791 is developing into a deeper, larger scale correction. In the less bearish case, it's just correcting the rise from 1.2005 (2021 low). But even so, break of 1.3538 will pave the way to 61.8% projection of 1.4791 to 1.3538 from 1.4139 at 1.3365. This will remain the favored case as long as 1.4139 resistance holds, in case of rebound.
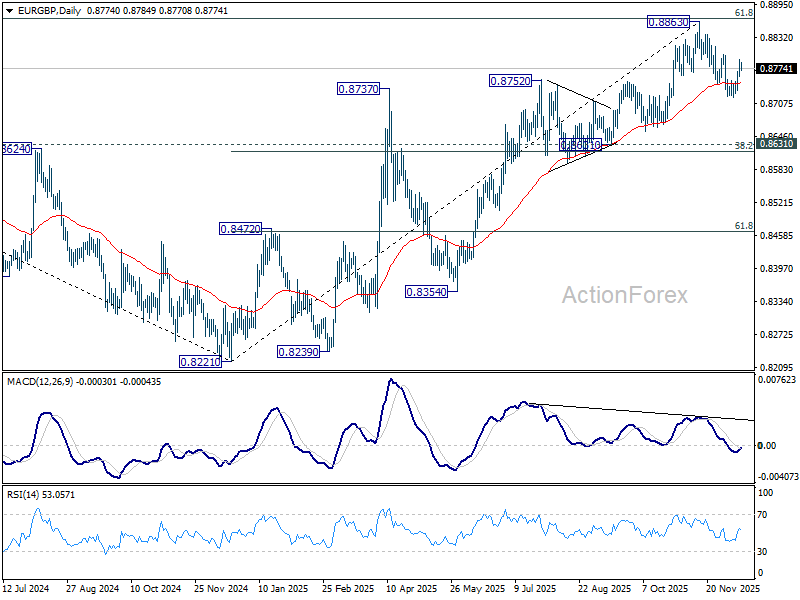
EUR/GBP Daily Outlook
Daily Pivots: (S1) 0.8763; (P) 0.8777; (R1) 0.8794; More…
Intraday bias in EUR/GBP stays neutral at this point. With 0.8800 resistance intact, further decline is mildly in favor. Below 0.8720 will target 0.8631 cluster (38.2% retracement of 0.8221 to 0.8663 at 0.8618). However, break of 0.8800 will turn bias back to the upside for retesting 0.8863.
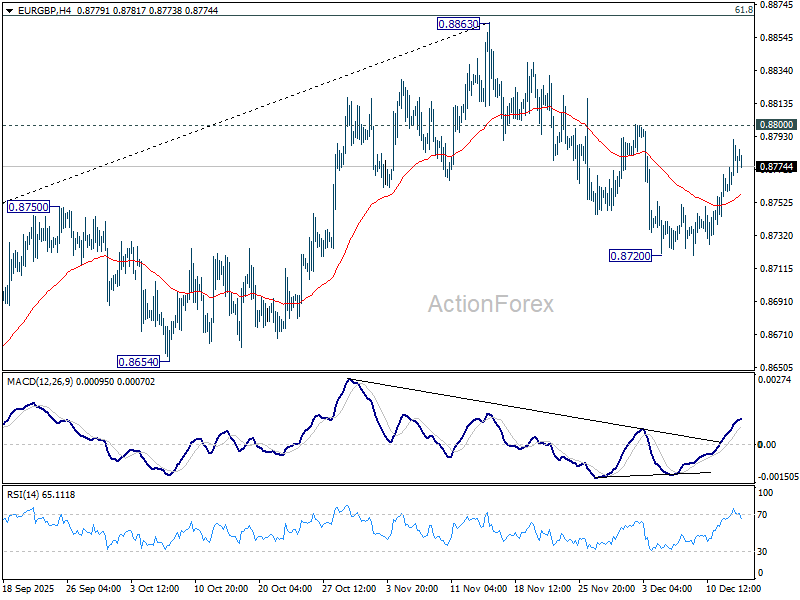
In the bigger picture, rise from 0.8221 medium term bottom is still seen as a corrective move. Upside should be limited by 61.8% retracement of 0.9267 to 0.8221 at 0.8867. Sustained trading below 55 W EMA (now at 0.8605) should confirm that this corrective bounce has completed. However, decisive break of 0.8867 will suggest that EUR/GBP is already reversing whole decline from 0.9267 (2022 high). That should pave the way back to 0.9267.