

Sample Category Title
Wall Street Sell-Off Accelerates as Earnings and Bond Worries Remain
American stocks declined sharply on Tuesday after relatively weak results from some of the biggest companies in the US. For example, Goldman Sachs reported that its total earnings declined by 13% while its revenue fell by 6%. The weak results came a few days after JP Morgan and Citigroup published weak earnings as their costs rose. Stocks also declined after US bond yields rose to the highest level in over two years, signaling that investors are still worried about the rising interest rates. One of the biggest movers in Wall Street was Activision Blizzard. The stock jumped sharply after being acquired by Microsoft in a $68 billion deal.
The price of crude oil maintained its bullish trend on Tuesday as investors remained optimistic that demand growth will be stronger than supplies. Recent data by the Energy Information Administration (EIA) showed that inventories have declined in the past 7 weeks straight. The EIA will publish the latest inventories data later today. At the same time, more countries have reopened, meaning that demand will continue being strong. Oil prices also surged as geopolitical risks rose in the Middle East. Houthi rebels attacked Abu Dhabi, the third-biggest producer in OPEC.
The economic calendar will have several important events today. In the UK, the Office of National Statistics will publish the latest consumer price index (CPI) data. Economists expect the data to show that prices jumped by 5.2% in December. Excluding food and energy prices, they expect the data to show that the country’s inflation rose to 3.9%. These numbers will come a day after the ONS published strong jobs numbers. The next key data to watch will be the latest Canadian consumer inflation data. As in other countries, analysts expect the numbers to show that inflation rose to 3.5%.
XTIUSD
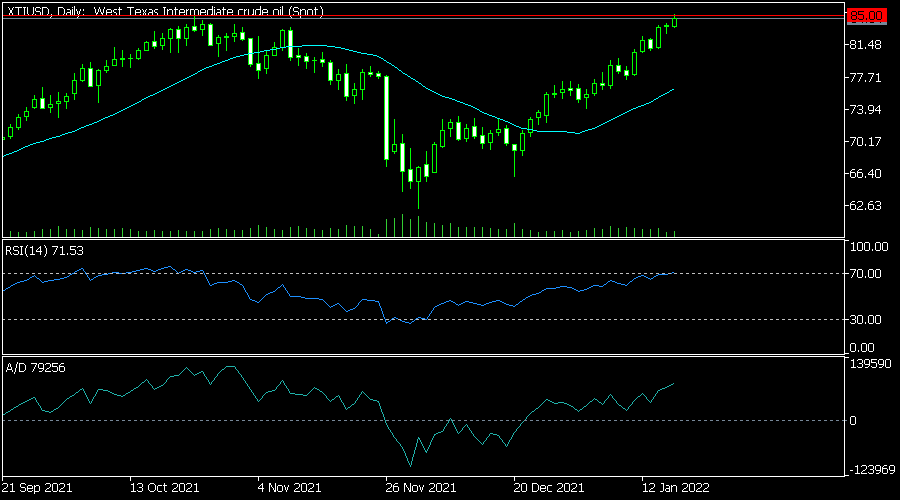
The XTIUSD pair has been in a strong bullish trend in the past few months. It has managed to rise from a low of 62.15 in December to the current 84.70. On the daily chart, the pair moved above the 25-day and 50-day moving averages. The Relative Strength Index (RSI) is approaching its oversold level while the accumulation and distribution indicator has kept rising. Therefore, the pair will likely keep rising as bulls target the key resistance at 86.
EURUSD
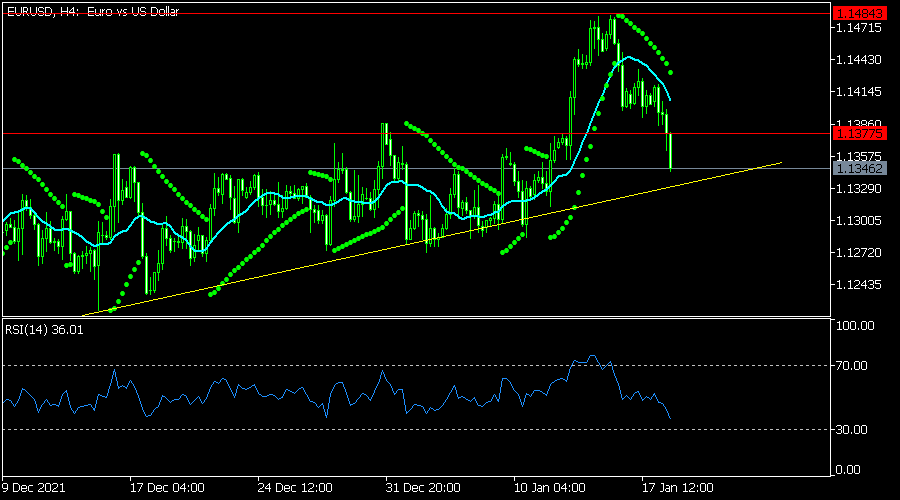
The EURUSD declined sharply in the overnight session as US bond yields rose. It declined to a low of 1.1350, which was significantly lower than last week’s high of 1.1485. The price is approaching its ascending trendline shown in yellow. It has also moved slightly below the 25-day and 50-day moving average and the dots of the Parabolic SAR. Therefore, the pair will likely keep falling as bears target the key support at 1.1300.
GBPUSD
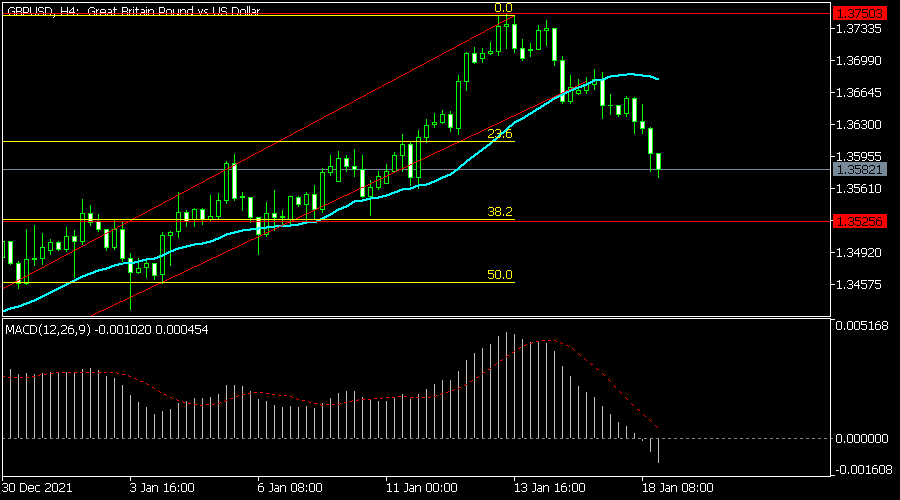
The GBPUSD pair continued its bearish trend after strong UK jobs numbers. It is trading at 1.3518, which was the lowest level in weeks. It has crossed the 23.6% Fibonacci retracement level on the four-hour chart. It has also moved below the 25-day and 50-day moving averages while oscillators have been falling. Therefore, the pair will likely keep falling, with the next key support being at the 38.2% retracement level at 1.3525.
NZDUSD Preserves Buying Interest with Technical Support
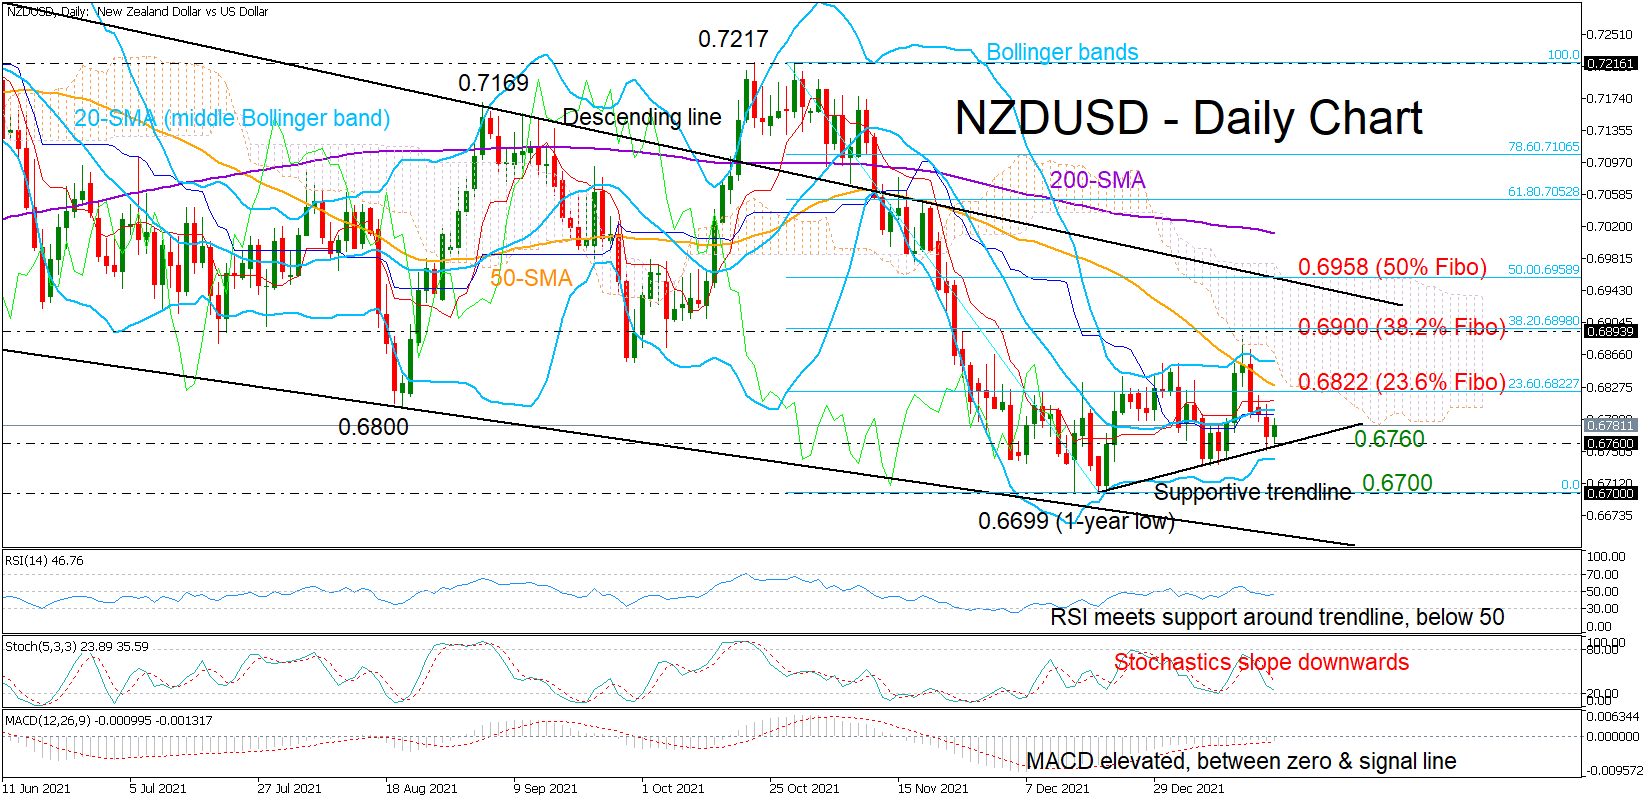
NZDUSD has been quite unstable, oscillating between gains and losses within the 0.6700 – 0.6900 territory since the drop to a one-year low of 0.6699 in December. Yet, despite the fluctuations, the pair managed to build a soft upward trajectory in the short-term picture with the help of a strong supportive trendline.
The 20-day simple moving average (SMA), which represents the middle Bollinger band, is currently blocking bullish actions around the 0.6800 round level as the momentum indicators provide little direction about what the next move in the price could be. The RSI has yet to set a foothold within the bullish area despite maintaining a positive trend above an ascending trendline, currently hovering marginally below its 50 neutral mark. The MACD is also following a positive direction, though it is still trapped between its red signal and zero lines, while the Stochastics keep sloping downwards.
The 0.6800 – 0.6820 region, which encapsulates the 20- and 50-day SMAs and the 23.6% Fibonacci retracement of the 0.7217 – 0.6699 down leg, is currently the main target. A successful step above it could generate additional upside corrections up to the 38.2% Fibonacci of 0.6900, where the price almost topped last week. Further up, the bulls may attempt to breach the descending trendline from February 2021 and the 50% Fibonacci of 0.6958.
On the downside, the short-term supportive trendline is preserving some optimism in the market for now. Should it crack, the price will probably see another test near the one-year low of 0.6699 before it seeks shelter again around the downward-sloping line stretched from March 2021 at 0.6650. Lower, the pair would strengthen its broad bearish outlook, shifting attention to the 0.6600 and 0.6500 psychological marks.
In brief, although technical signals are unclear at the moment, the soft upward pattern in the short-term picture could feed buying interest, making additional higher highs above 0.6900 likely. Otherwise, a close below the ascending trendline at 0.6760 would bring bearish risks back into play.
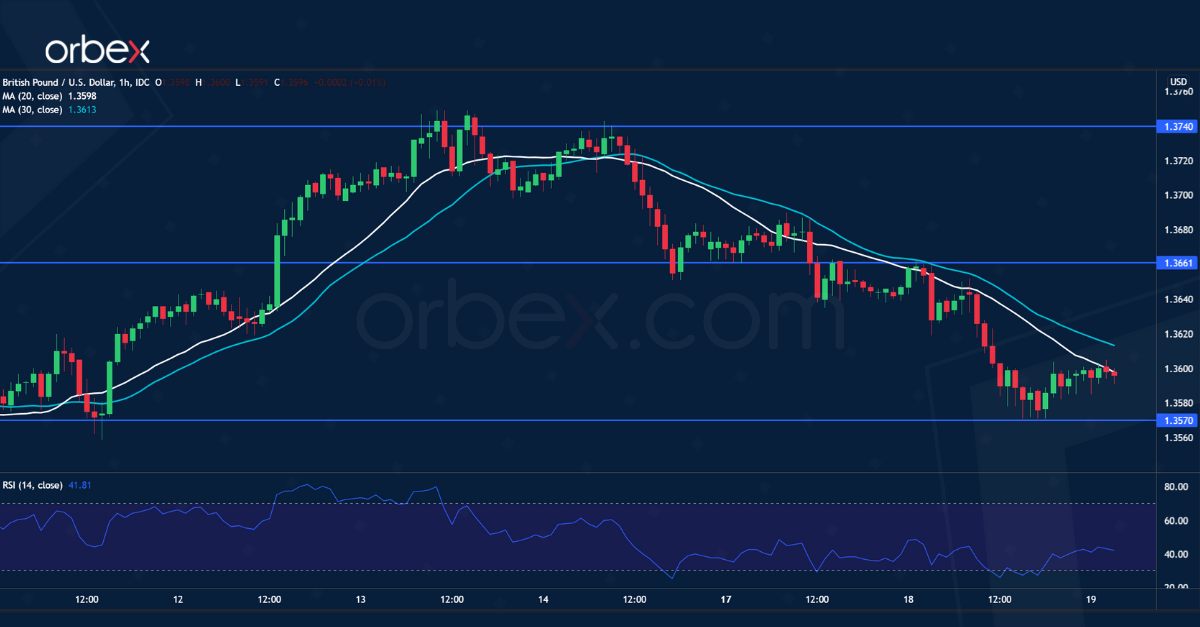
GBP/USD Pair is Now Facing Resistance Near the 1.3600 zone
The British Pound started a downside correction from the 1.3740 zone against the US Dollar. The GBP/USD pair traded below the 1.3680 level to move into a short-term bearish zone.
There was a close below the 1.3600 level and the 50 hourly simple moving average. The pair traded as low as 1.3573 and is currently consolidating losses. On the upside, the pair is now facing resistance near the 1.3600 zone.
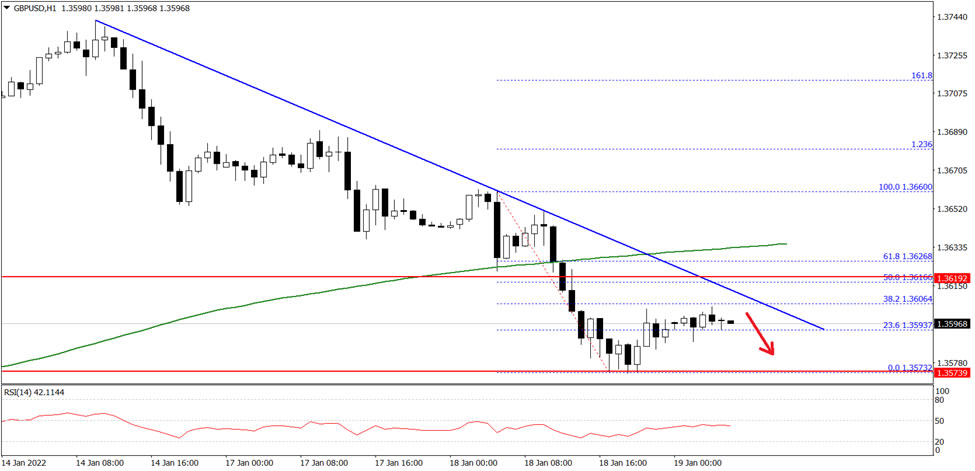
There is also a key bearish trend line with resistance near 1.3600 on the hourly chart. The next key resistance is near the 1.3640 level. Any more gains might push the pair towards the 1.3700 level.
An initial support on the downside is near 1.3580 on FXOpen. The main support is forming near the 1.3565 level. A break below the 1.3565 support level could even push the pair below the 1.3550 support.
USDJPY Struggles within SMAs after Bullish Doji
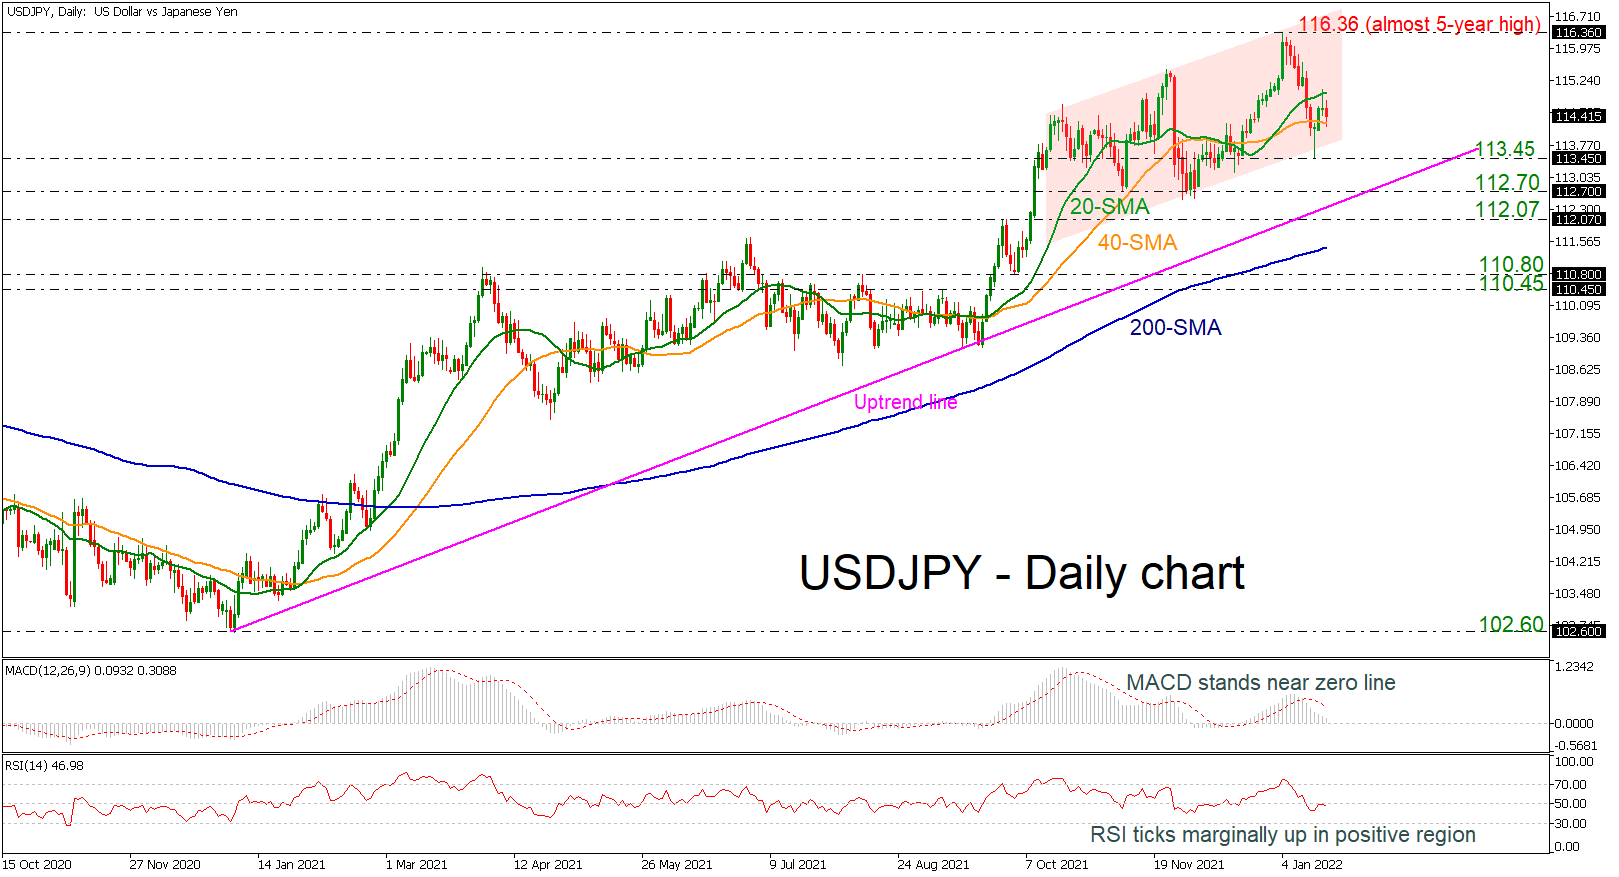
USDJPY is hovering within the 20- and 40-day simple moving averages (SMAs) after the bounce off the 113.45 support level that posted on Friday, creating an impressive spike. If the price jumps above the 20-day SMA, it could confirm a bullish doji pattern which is behaving as a reversal formation.
Regarding the technical indicators, the MACD is weakening in the positive area, below its trigger line, while the RSI is sloping marginally down in the negative region, both suggesting the next move to the downside rather to the upside.
If sellers drive the pair lower, immediate support could come from the recent low at 113.45 before touching the long-term ascending trend line around 112.70. A dive below this line could open the door for bearish moves, hitting 112.07 and the 200-day SMA at 111.45.
On the flip side, a climb beyond the 20-day SMA may boost the price until the almost five-year high of 116.36 before the bullish rally continues towards the January 2017 high of 118.60.
In brief, the long- and medium-term pictures are bullish, but if there is a decline below the uptrend line near 112.70, it may turn the outlook to neutral.
SPX 500 to Test Daily Support
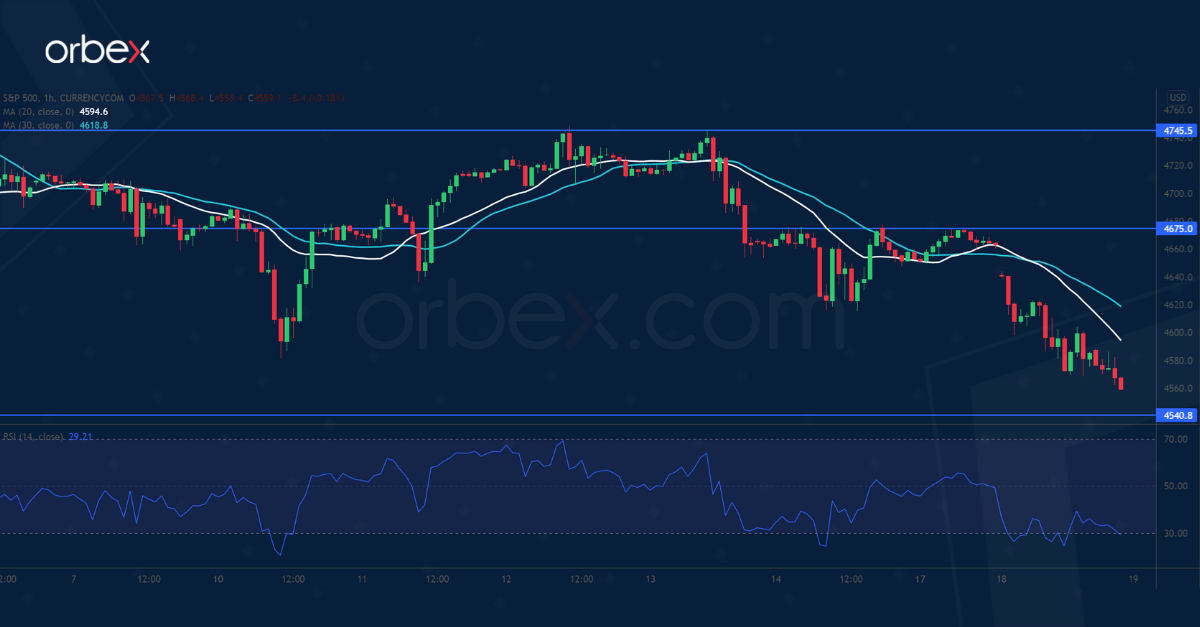
The S&P 500 extended losses over rising rate worries. The fall below 4640 invalidates the latest rebound and indicates that sentiment is still downbeat.
Below the psychological level of 4600, 4540 is key support near last December’s lows on the daily chart. A bearish breakout would trigger a deeper correction towards 4400, the origin of the October rally.
An oversold RSI may cause a limited rebound. Nonetheless, the bulls need to clear offers around 4675 and then 4745 to gain momentum.
USD/JPY Struggles to Bounce
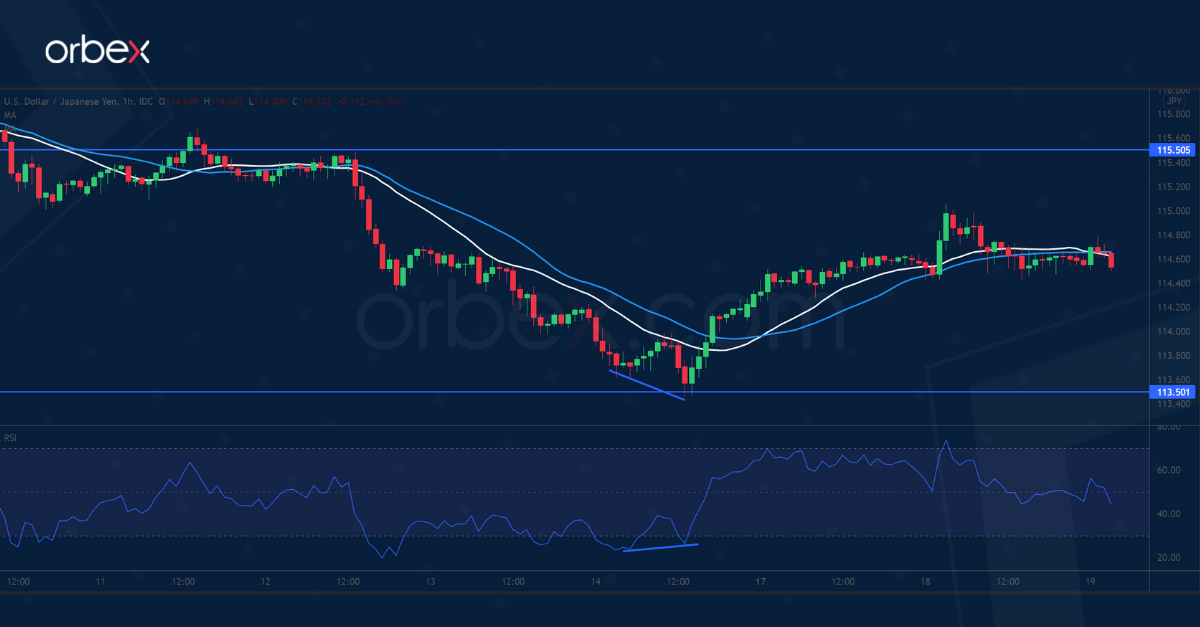
The yen softened after the Bank of Japan signaled no shift in its ultra-loose monetary policy. The US dollar bounced off the critical floor at 113.50 from the daily chart.
A bullish RSI divergence revealed a deceleration in the downward impetus. The indicator’s oversold situation also attracted a number of bargain hunters.
A break above 114.70 suggests a strong interest in keeping the correction in check. 115.50 from the latest sell-off is a major hurdle and its breach could extend the rally to the recent peak at 116.30.
GBP/USD Falls into Correction
The sterling fell back after a slowdown in Britain’s wage growth in November. Sentiment favors the pound after it rallied above the daily resistance at 1.3700.
However, an overbought RSI has cut back buyers’ appetite. A break below 1.3630 has prompted some traders to take profit, driving down the price.
As the RSI dips into the oversold zone, 1.3570 is the next support. A bearish breakout would send the pair to 1.3480 which sits on the 30-day moving average. 1.3660 is the immediate resistance when a rebound takes shape.
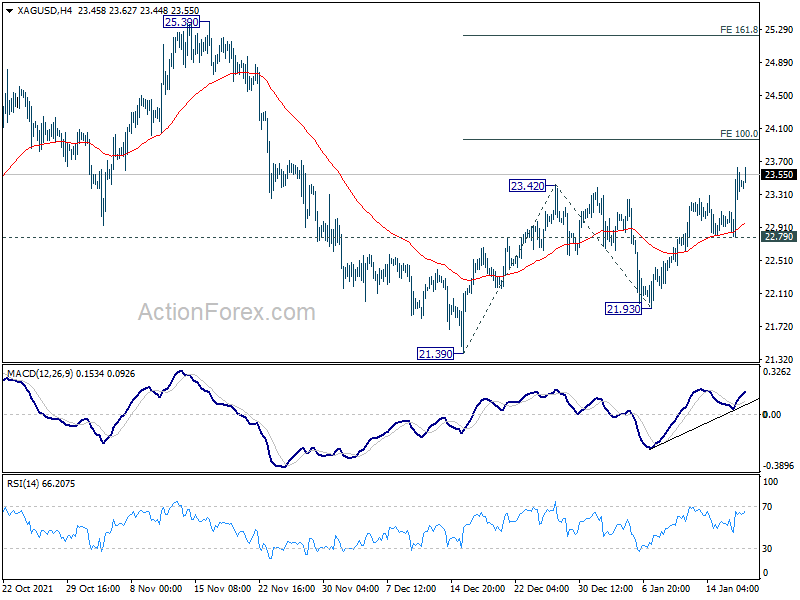
Silver resumes rebound from 21.39, targeting 23.90 first
Silver's rebound from 21.39 resumed by breaking through 23.42 and hitting as high as 23.63 so far. Further rise is now in favor as long as 22.79 support holds. Next target is 100% projection of 21.39 to 23.42 from 21.93 at 23.90.
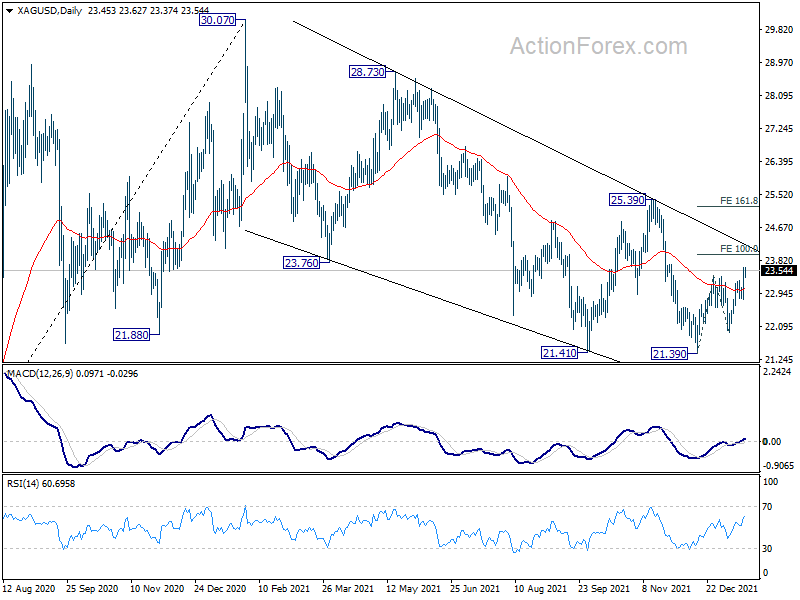
The main question is still on whether corrective pattern from 30.07 has completed as a five-wave descending triangle at 21.39. Break of 23.90 projection level will affirm the bullish case. Upside acceleration could then follow to 161.8% projection at 25.21, which is close to 25.39.
However, rejection by 21.39 will keep the rebound from 21.39 corrective and maintain medium term bearishness.
Daily Technical Analysis
EUR/USD
Yesterday, the pair continued to lose ground against the U.S. dollar, reaching the support at 1.1320. It seems that the bears have started to lose momentum and, at the time of writing, the price is hovering around the mentioned support. The forecast for today’s trading session is for the pair to rebound from this support and to be traded in the range between 1.1320 – 1.1360. On the other hand, the downward movement may be expected to continue, but only in case the bears manage to violate the support at 1.1320. If this happens, then the pair may head towards the critical support at 1.1272. The data on the building permits for the U.S., which is to be announced today at 13:30 GMT, is expected to cause a spike in volatility.
USD/JPY
After the pair rebounded from the resistance at 115.00, the bears couldn’t gain enough momentum to test the support at 114.28. A possible scenario for today’s trading session is for the bulls to try to reclaim their control over the market and to attack the resistance at 115.00. In case the mentioned level is successfully violated, then this would pave the way for the pair towards the next resistance at 115.63. In the opposite direction, the first important support can be found at 114.28.
GBP/USD
The current situation for the pair is similar to that of the EUR/USD. The market sentiment remains negative and the sell-offs may deepen, heading the pair towards the zone of 1.3555 – 1.3507. However, the bulls may try to intervene and limit the sell-offs, so a short-term correction towards 1.3650, before the confirmation of a potential downward movement, is not to be excluded.
EUGERMANY40
During yesterday’s trading session, the German index recorded significant losses and fell 1.76%. However, the bulls managed to enter the market and this led to a fake breach of the support at 15711. Afterwards, the index started consolidating in the narrow range of 15711 – 15835. After reaching record values in the last months, it seems that the bulls have started losing their positions and the sell-offs may deepen, which could lead to a reversal of the long-term uptrend. A confirmed breach of the critical support at 15711 that is coming from the higher time frames would signal for a further impulsive downward movement towards 15518. Until the bears attack the mentioned support, however, trading activity may remain limited to the narrow range of 15711 – 15835.
US30
The U.S. blue-chip stock index has also been hit hard over the past few days, losing just over 1.8% of its value in the last trading session alone and reaching the support zone at 35375. This situation was largely the result of the poorer-than-expected Q4 results of Goldman Sachs and due to the rising bond yields in the U.S. At the time of writing, the index is testing the support at 35375 and the forecasts are for the bears to prevail and violate this level, heading the price towards the support at 35375. In the opposite direction, the first important resistance sits at 35900.
Markets Ever More See Inflation as Obstacle to Growth
Markets
The new paradigm that dominates trading since the start of the year simply continued as trading resumed post Martin Luther King Day. Markets ever more see inflation as an obstacle to growth rather than a result of healthy demand, raising speculation that the Fed will have to act sooner and more aggressive than anticipated until now. A further rise in oil due to geopolitical tensions add to that picture. Investors are also looking out for signs of cost pressures affecting corporate margins as the earnings season comes into full swing (cf Goldman results). Especially US yield markets ever more embrace the idea of further frontloading of Fed normalization (or will it be real tightening?). US yields yesterday jumped between 7.6 bps for the 2y, 10 bps for the 5y and 6.6 bps for the 30y. Despite the rise in oil prices, the move was almost solely due to a rise in the real yield component (10y +8.4bps). A mediocre US NY Fed empire manufacturing survey didn’t change the intraday dynamics. European yields initially tried to join the uptrend in USD markets but couldn’t hold to that momentum. The German yield curve steepened marginally with the 2y declining 0.9 bps and the 30y rising 1.4 bps. The 10y Bund yield this morning opens in positive territory for the first time since May 2019. The rise in US real yields continued to weigh on global equity markets with US indices underperforming (Nasdaq -2.60%, Dow -1.51%, Euro Stoxx 50 -1.03%). Last week, the sharp rise in US inflation triggered a temporary setback of the dollar. However, this apparently was nothing more than profit taking on overdue long positions. The dollar yesterday again profited from the rally in US (real) yields. The DXY TW index regained the previous neckline near 95.55. EUR/USD dropped below the top of the previous consolidation pattern (1.1386) to close the day at 1.1325. USD/JPY finished the day little changed at 114.61. So the yen held up well, even as the BOJ at its policy meeting didn’t make a big U-turn on its inflation assessment.
This morning, Asian equities join the sell-off from WS, with Japan underperforming (Nikkei -2.8%).In a briefing, PBOC Deputy Governor Liu Guoqiang indicated that the central bank will use a wide range of tools in order to support credit flows to the economy. The yen outperforms on the risk-off with USD/JPY drifting to the 114.25 area. The oil price extends its rise on headlines of an explosion affecting operations of a key pipeline between Turkey and Iraq (Brent $88/b). The US eco calendar contains the building permits and housing starts. EMU data are second tier. A risk-off sentiment currently is no good enough reason to slow the rise, especially in US yields. Even so, the pace of the move might slow as markets will look out for new guidance from next week’s Fed meeting. The technical picture for the dollar improves again. EUR/USD returned in the 1.1186/1.1386 trading range. UK CPI data published this morning mostly were higher than expected with headline CPI rising from 5.1% to 5.4%. The debate on a new BOE rate hike in February seems settled. EUR/GBP is holding near recent lows (EUR/GBP 0.8330).
News Headlines
Tory rebels in the UK sat down yesterday to discuss a no-confidence vote in PM Johnson. They claim to soon have the necessary 54 letters required to trigger such a vote. Johnson is under heavy pressure from both the opposition and (for now mostly internally) from his own party over the “partygate” scandal. In a bid to sooth increasingly frustrated Tories, Johnson will today announce the lifting of some Covid restrictions. These may include scrapping the work-from-home guidance and the use of Covid passes to attend big events. Sterling thus far remains immune for the political showdown. EUR/GBP yesterday even to a fresh 2022 low at 0.833.
Washington ups diplomatic efforts to de-escalate a building crisis with Moscow over Ukraine. Secretary of State Blinken will first meet Ukrainian president Zelenskiy and Foreign Minister Kuleba today. He will then travel to Berlin to discuss the matter with German Foreign Minister Baerbock and will later hold a “Transatlantic Quad”, involving the US, UK, France and Germany. On Friday, Blinken is due to meet with Russian Foreign Minister Lavrov in Geneva. On markets meanwhile, Russian assets are getting hammered. Bonds tanked, pushing yields in one month time 90 – 125 bps higher across the curve. The MOEX stock index stumbled more than 20% lower since hitting an all-time high in October last year. The rubble over that same period declined 8%. EUR/RUB trades around 87.23.