

Sample Category Title
Gold Traders Eyeing Economic Developments Around the World
Gold closed the previous week in positive territory, yet did not manage to break outside the sideways motion it has been trading in, for most of the past month. In the current week, Gold is marginally lower yet traders seem to remain excited as a sentiment for stabilization at higher grounds may be in the market’s focus. This report will present an overview of the key matters currently driving the Gold market, from our perspective. Our aim is to provide a brief but analytical presentation to traders, enabling them to trade the gold market successfully. Our closure will consist of Gold’s technical analysis, indicating important levels and possible trending scenarios.
At the moment the market’s concern turns the gloomy outlook for the first quarter of the current year. Some of the largest economies of the world like the US and China are still dealing with the spread of the omicron variant that is a great threat to consumer spending and business growth or investment. Yesterday, economic data from China indicated the Mainland’s yearly GDP rates for Q4 fell from previous 4.9% to 4.0%. Even though the figure remains comfortably high, the slowdown is significant and could be preparing the ground for what can follow in the first part of 2022. However, the most important development in China came unexpectedly on Monday when China’s central bank cut the borrowing costs of its medium-term loans by 10 basis points to 2.85% from 2.95% for the first time since April 2020. China’s unexpected rate cut tends to signal some uncertainty for its future growth. This can also be a confirmation that circumstances in the Chinese economy may have worsened recently leaving the central bank with no other option. Gold’s price received some support during the Asian session on Monday, possibly as a result of this development.
In the US, Inflationary pressures are still very strong and investors are possibly making adjustments to their strategy to cover for possible losses. In the previous week the US weekly CPI rate was just at 0.5%, while the yearly headline and Core rates ticked higher and reached 7.0% and 5.5% accordingly. Higher inflation tends to add demand for Gold as the metal can be used as a source for hedging risks arising from higher prices. Upon release of the news Gold gained but in a rather controlled manner. At the same time, in the US, market participants are expecting the Federal Reserve to enact interest rate hikes in the near future. Rate hikes are a broad expectation of the market due to the fact that this tool can help counter the inflation pressures that are worrying at the moment. Yet if the market receives further information and was to price in a rate hike by the Fed anytime soon, then we expect Gold traders to take substantial action placing orders. Yet we expect Gold’s unpredictable nature to be more prone to developments on the pandemic at this stage.
As our final part of the fundamental analysis we note the upcoming US financial releases that can possibly move Gold’s price in the following days. On the 19th of January we get the US Housing Starts Number for December, while on the 20th we get the US Philly Fed Business Index for January, the weekly initial Jobless claims figure and the Existing Home Sales figure for December. In the next week on Monday the 24th we get the very important Flash Markit Manufacturing and Services figures for January. Finally, on the 25th we get the US Consumer Confidence figure for January.
Technical Analysis
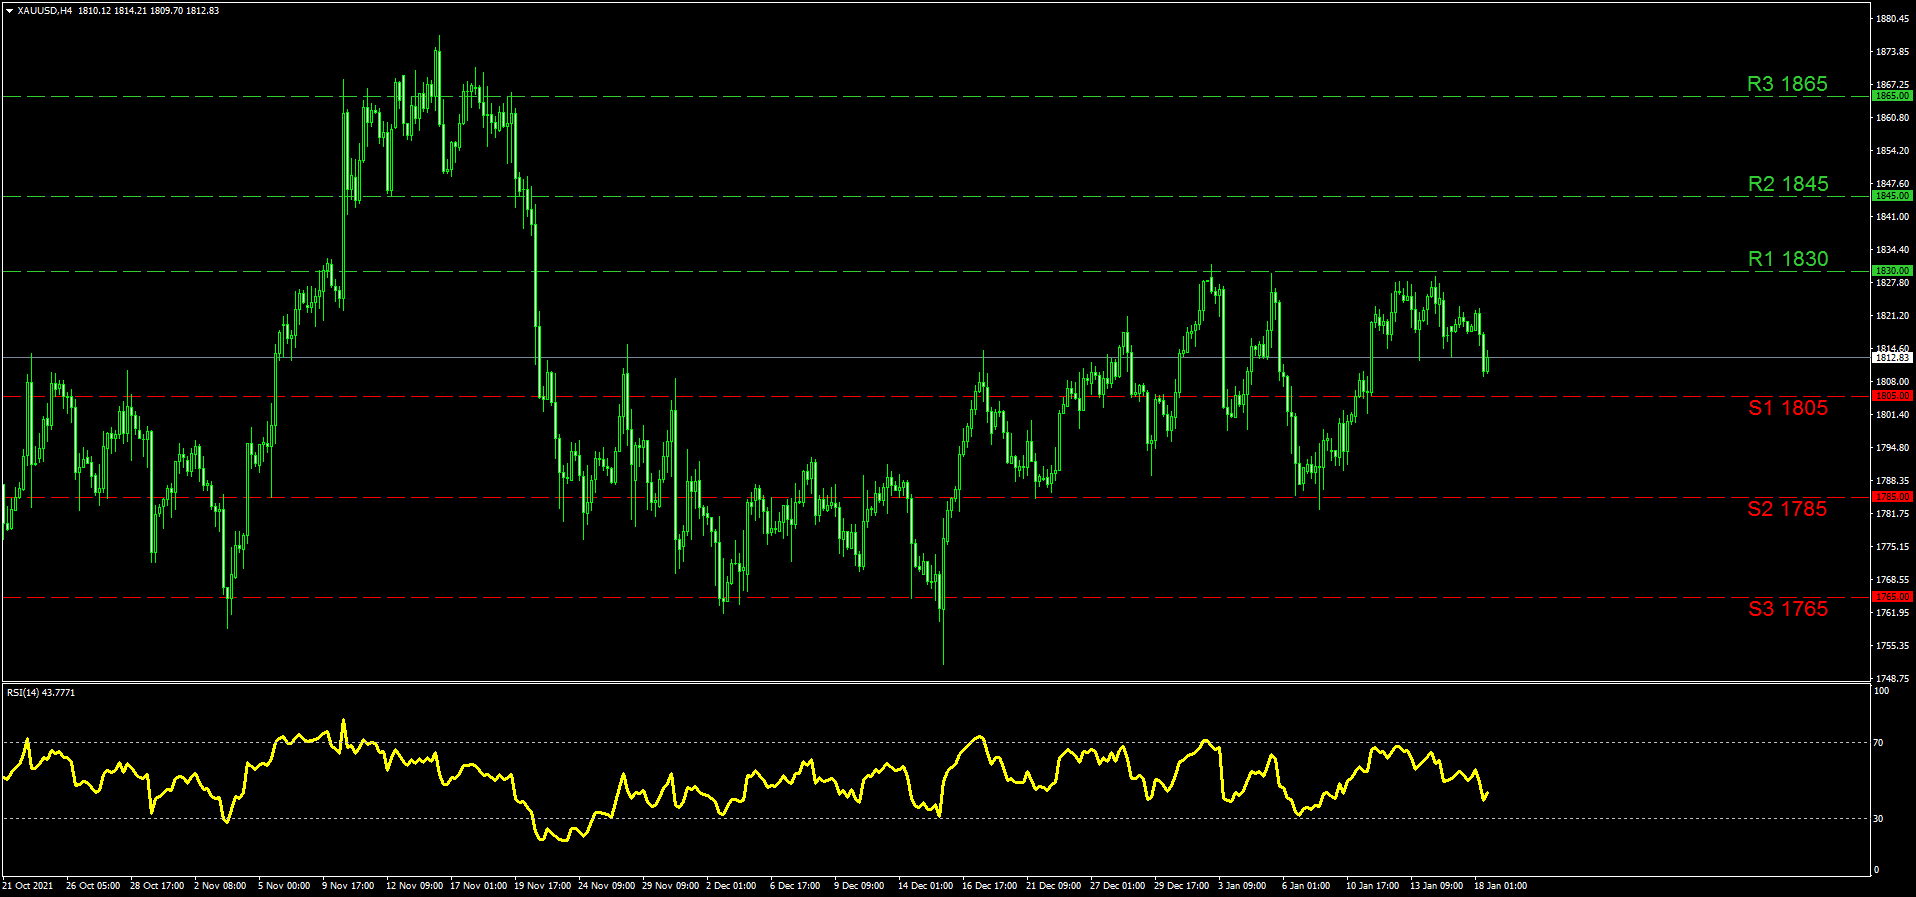
Gold continues to move in a wide sideways motion between the (R1) 1830 resistance and the (S2) 1785 support level. These levels have both been tested but not breached in January making them important for traders to keep in mind. The top, the (R1) has been tested clearly two times in January and was closely approached a third time on the 14th, making it a crucial barometer for Gold’s price further appreciation. If the price action does break above the (R1) then the (R2) 1845 level can be tested first. Our highest resistance line is noted at the (R3) 1865 level that was used as a high back in November. In the opposite direction, if a selling interest arises we could see Gold moving closer to the (S1) 1805 support level that was used previously as a resistance. The price action, has risen above and submerged below the (S1) various time since December thus traders may have to use it with alertness due to the fact that it may be ignored occasionally. Lower, as we noted stands the very distinguished (S2) 1785 level which has not been breached to the downside for more than a month. At the end we keep the (S3) 1765 line as our lowest support and can be used as a pending order or a target in an extensive selling strategy. The RSI indicator remains above 30 for the time being confirming the bearish tendencies in the short-term. Overall we tend to maintain a sideways bias yet a break above the (R1) could signal bullish tendencies for Gold while a move below the (S1) could invite bearish ones.
Brent Will Reach $95
What is happening?
The global energy crisis spreads around the globe. At the end of December, XBR/USD exceeded $80 per barrel for the first time since November, and in January, it even exceeded $85, also for the first time since November. On Friday, January 14, the price has reached $86, the highest point since October 2018.
Reasons for XBR/USD growth
It becomes evident that the possibility of additional supply of oil on the market in the short term may be less than previously thought due to significant underinvestment in the sector over the past six years.
At the end of last year, Russian oil companies stated that they were operating at the limit of their production. Moreover, OPEC + potential for production increase could be much less than the 4 million barrels per day growth planned in 2022.
According to the International Energy Agency data, the current shortage of supply in the oil market is 3 million barrels per day, and the expected growth in demand this year is 3.4 million barrels per day.
The second factor is that the Omicron strain is much milder despite being more contagious and may not lead to severe and long-term lockdowns.
According to these facts, there is a high probability that the deficit will remain in the short term.
Technical analysis
XBR/USD daily chart
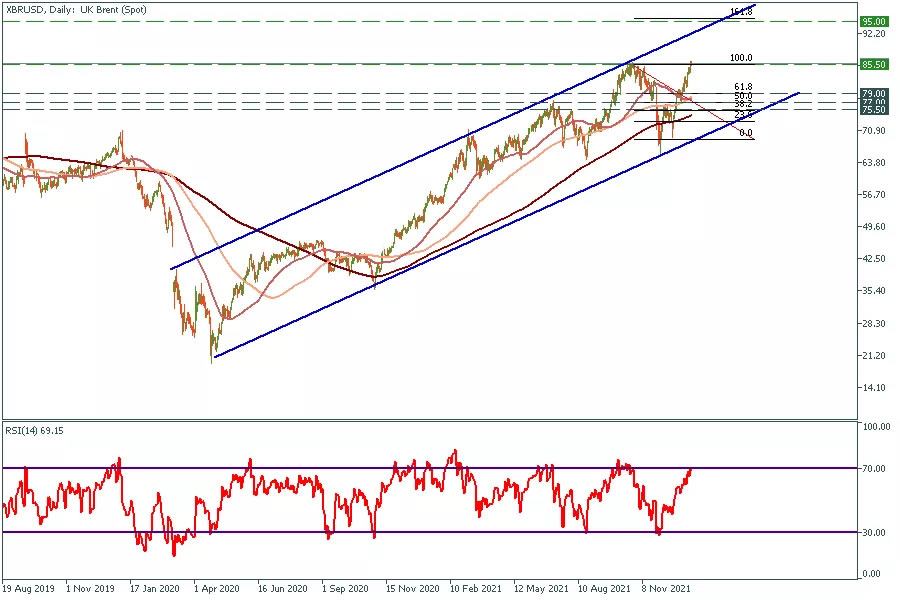
XBR/USD has been moving in the ascending channel since March 2020. At the moment, it is a moment of truth for XBR/USD. If the price manages to hold above $85.5 for at least two days, it will reach the channel's upper border at $95, which is 161.8 Fibonacci level, without any resistance.
Otherwise, the price might head towards the bottom border of the channel. In this case, targets will be at $79, $77, and $75.5, which are 61.8, 50.0, 38.2 Fibonacci levels, respectively.
Gold Struggling to Withstand Market Pressure
Gold is trading near $1819 an ounce, unable to take advantage of a spike in geopolitical risks due to an environment of rising interest rates. Two-year US government bond yields have reached 1.06%, pre-pandemic levels.
Rising yields on expectations of a sharp Fed key rate hike this year (compared to the previous tightening cycle) are putting pressure on the stock market, where Nasdaq futures are losing 1.3% since the start of the day and 9% from their late November peak.
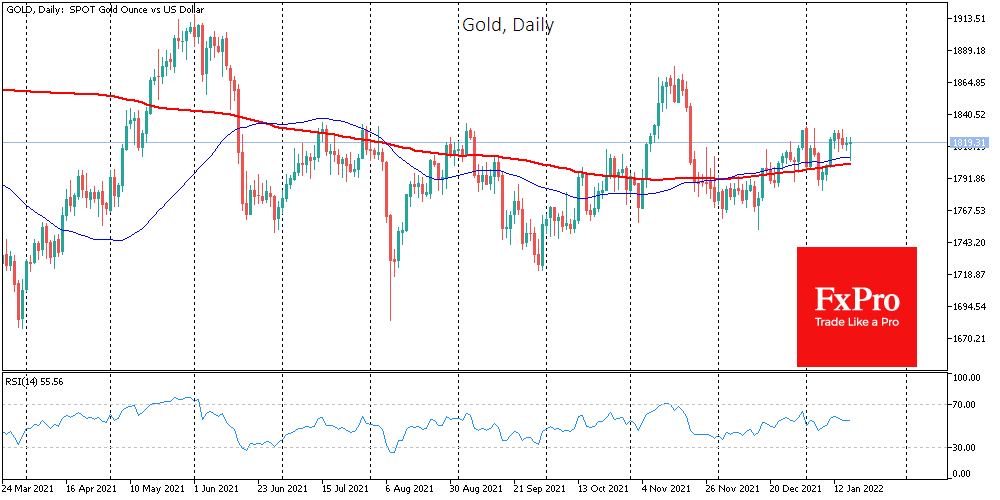
The debt market’s continued reassessment of the outlook for monetary policy is a serious threat to gold. Its price is now above the 50- and 200-day moving averages, reflecting the strength of buyers in previous months.
We have also previously noted a sequence of increasingly higher local lows. But as the market enters higher levels of volatility, previous local support levels might not hold.
While in previous days we could see gold strengthening along with growth stocks falling, there are now increasing signs that the sell-off in the markets is taking on a global nature, affecting almost all asset classes. In this environment, a break of the upward support line (now around $1800) can only further increase the volatility of gold prices. Further sell-offs in equities could send gold to retest the $1760-1770 area before the end of the week. If it fails as well, we could see a very quick dip towards $1730 or even $1680.
Where is Bitcoin’s bottom?
The cryptocurrency market lost 2% of its capitalisation in the past day to $2.0trn. Buyers stepped up in the market between 8-11 January, soon after a dip to this round level. But as we can see, the bulls’ strength was not prolonged enough.
The Crypto Fear and Greed Index added 2 points to 24. The 18th of November was the last time we saw levels above 50. Since then, the cryptocurrency market has been steadily in a downtrend, with the overall crypto market capitalisation down 30%.
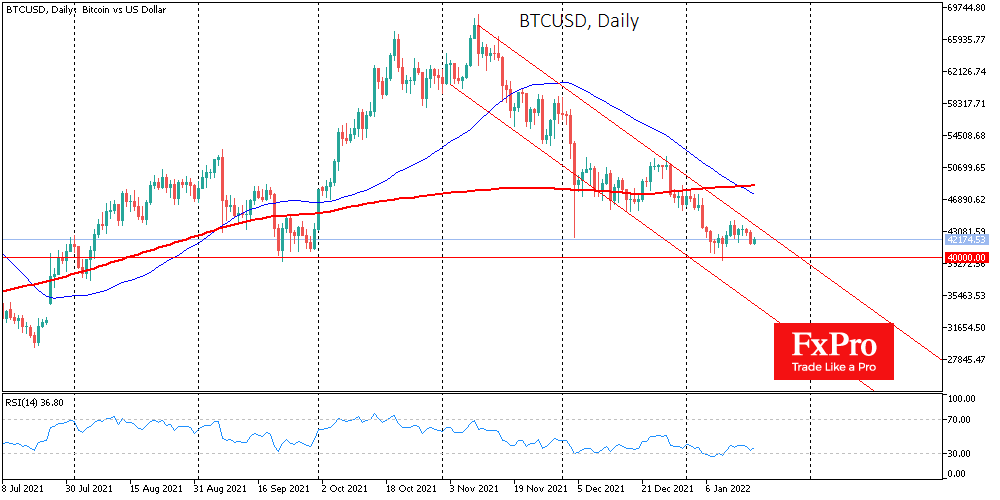
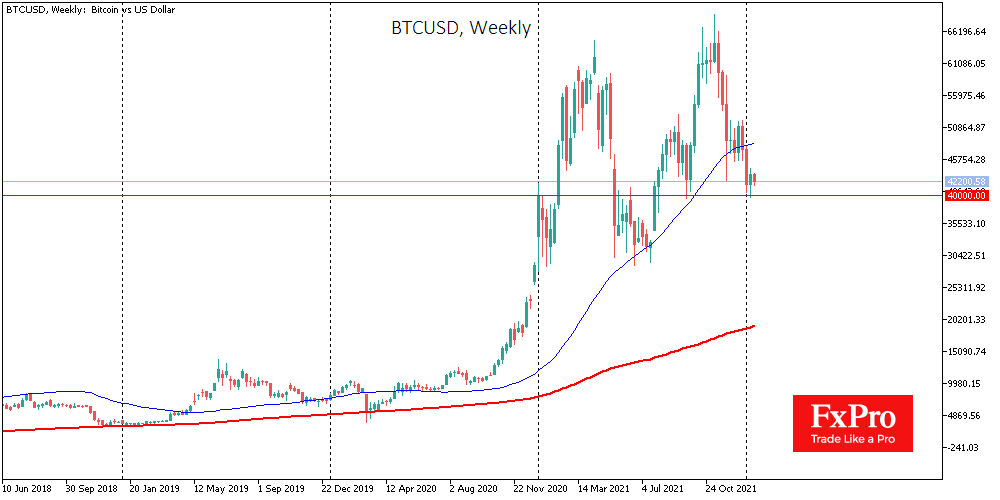
Bitcoin is losing 2% overnight, retreating to the $42K mark, returning to an area of local lows before last week’s rebound. Wariness prevails in traditional financial markets on Tuesday morning, so a fall under $42K could quickly turn into a test of the $40K level.
The bitcoin chart is increasingly clearly showing a downward reversal with a continuation within the three-month down channel. The RSI index on the daily charts remains in neutral territory, meaning there is still room for a decline. The 50-day moving average is deeper under the 200-day moving average, indicating that the pair is in a bearish trend.
Ether pulled back to $3180 from the region of $3500, and it is sinking under the bears’ pressure.
The methodical selloffs are exhausting market participants, where the feedback loop is solid: price increases spur purchases, pushing prices up even more. Downturns or a prolonged period of sideways trading causes disappointment and waning interest. After all, many people come to cryptocurrencies looking for a quick buck. They are willing to take high risks, but the lack of momentum dampens the excitement. After rapid growth in 2020 and 2021, we should not be surprised to see the market cool down.
The long-term weekly candlestick chart of Bitcoin shows that over the past seven years, support turns the market around, even during a depression, it passes through the 200-week moving average. This line is now near 19k, and by the end of the year, it will be slightly above 20K.
A bear market development for cryptocurrencies could push Bitcoin back to 20 before the end of 2022 in a pessimistic scenario. These levels could be the best prices to buy, although experience suggests it could take another year of sluggish growth before seeing a new powerful uptrend and FOMO.
EURUSD Wave Analysis
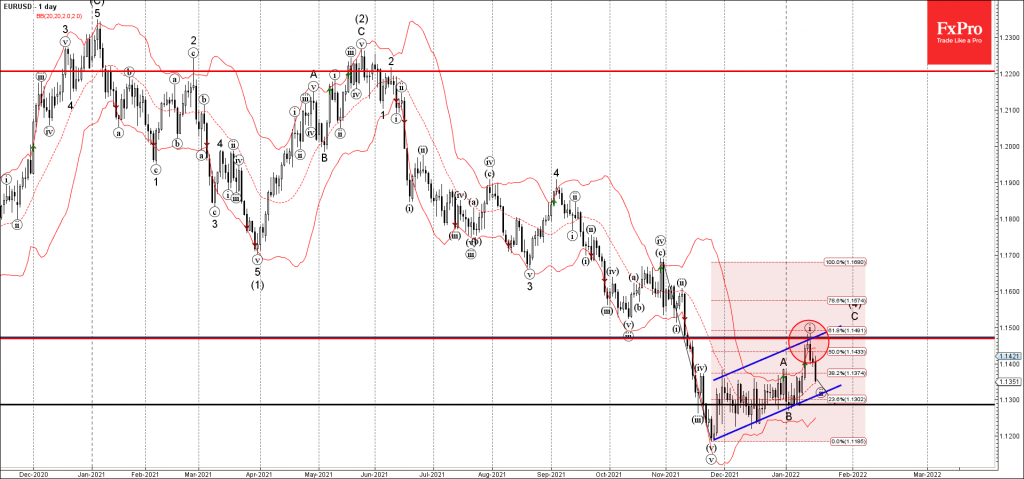
- EURUSD reversed from resistance level 1.1470
- Likely to fall to support level 1.13
EURUSD currency pair recently reversed down from the resistance level 1.1470, intersecting with the upper daily Bollinger Band and the daily up channel from November.
The downward reversal from the resistance level 1.1470 is aligned with the clear daily downtrend.
EURUSD currency pair can be expected to fall further toward the next support level 1.13 (which has been reversing the pair from the end of December).
Don’t Expect The Emerging Market FX Rally to Last
Summary
In something of a surprise, the U.S. dollar has weakened over the first few weeks of this year and emerging market currencies have outperformed. A sharp shift in monetary policy stance from the Fed supported the greenback late last year but has done little to help the dollar so far in 2022; however, once the "buy the rumor, sell the fact" dynamics come to an end and markets focus on underlying fundamentals, the U.S. dollar should strengthen going forward. We also expect emerging market currencies to come under the most pressure in 2022-2023 as tighter Fed policy, higher bond yields and local political developments result in weaker currencies across the emerging markets spectrum.
Dollar Down This Year, EM Currencies Leading The Way
The first few weeks of 2022 have surprised us. Just over the past two weeks, financial markets have priced a significantly more hawkish Fed. Instead of two rate hikes this year, market participants, including us, now forecast four hikes. And what seemed unlikely at the start of the year, economists and strategists alike have taken the FOMC's guidance and now forecast the Fed to begin shrinking its balance sheet in the second half of the year. Despite the Fed's latest and sharp shift in its monetary policy stance, the U.S. dollar has depreciated against most foreign currencies. Through the first few weeks of this year, the U.S. dollar index (DXY) is down 0.15%, indicating depreciation against G10 currencies. Dollar weakness has also spread into the emerging markets as currencies across Latin America, Asia and the EMEA (Europe, Middle East, Africa) region have strengthened against the greenback.
We can point to a few likely reasons why the dollar has started 2022 on the back foot, the first being Fed Chair Powell's commentary at his U.S. Senate confirmation hearing. When questioned about the direction of Fed monetary policy, Powell indicated the FOMC will look to raise interest rates in a way where the U.S. and global economic recovery will not be interrupted, a comment somewhat supportive of foreign currency and especially emerging currency sentiment. In addition, U.S. December inflation data was "as expected", a break from several months of upside surprises and a factor that may have reined in the U.S. dollar to some extent. And finally, there may also be capital flows from the U.S. to foreign markets. To that point, by many measures, U.S. equities are currently relatively expensive, while international equities could be more fairly priced. In order to potentially take advantage of more attractive valuations abroad, investors could be shifting capital toward international equities. Major equity index performance year-to-date supports this thesis, as the S&P500 is down 2.5% this year, while major European and emerging market equity indices have positive returns to start the year.
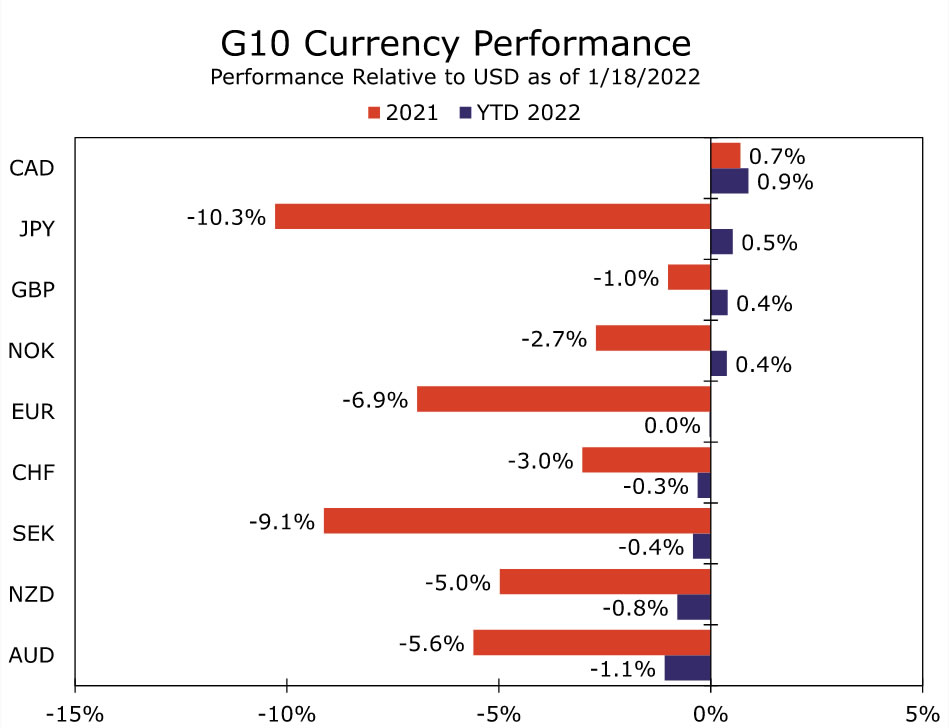
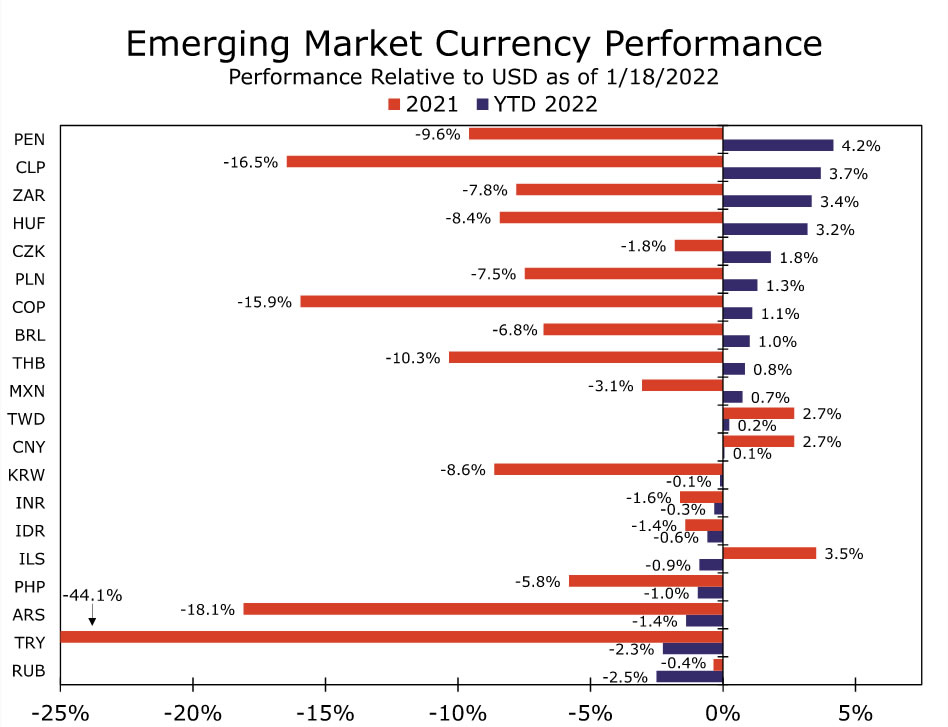
Foreign currency strength has been significant enough where currencies across the G10 and emerging markets have broken through key technical levels. 50-day, 100-day, and in some cases, 200-day moving averages have been breached, suggesting the current trend could continue for the time being. Following a year when foreign currencies largely underperformed, G10 currencies are mixed, but on balance, performing solidly (Figure 1); however, emerging market currencies are outperforming more broadly. With the exception of select outliers where idiosyncratic issues are factors (i.e: Russia, Turkey and Argentina), just about all major emerging market currencies have strengthened this year (Figure 2). To date, the Peruvian sol is the top performing currency, strengthening over 4%, as the central bank maintains a hawkish monetary policy stance amid its commitment to contain elevated inflation and as political risk tied to President Castillo's administration eases. Similar dynamics exist in Chile as inflation remains high and the central bank remains committed to interest rate hikes to bring CPI within target. In addition, the election of Gabriel Boric has yet to yield concerning rhetoric, also supporting the Chilean peso. On down the list, emerging market currencies from the South African rand to the Chinese renminbi have strengthened, despite underlying fundamentals associated with most developing economies still rather fragile.
But, Don't Expect The Rally to Continue
In our view, the dynamics that have supported foreign currencies, in particular emerging market currencies, are unlikely to persist for an extended period, and we maintain our view for a stronger U.S. dollar as 2022 progresses and into 2023. Despite the Fed's guidance on monetary policy doing little to support the dollar early this year, we believe actual changes to policy settings could and should result in capital flows back toward the U.S. dollar. Should the Fed start raising interest rates in March or shortly thereafter, the relative attractiveness of the U.S. dollar could improve, and we believe, can support the greenback going forward. In addition, we believe market participants will eventually begin to focus on underlying fundamentals associated with individual economies. In that sense, the U.S. economy is still a relative outperformer as underlying fundamentals associated with the American economy remain sturdy. Economies across the G10 are still lagging the U.S., while most developing economies have struggled to gather or maintain economic momentum since the start of the pandemic. As the focus shifts back to country-specific fundamentals, we believe investors will again divert capital back towards U.S. dollar denominated assets, which should be supportive of the greenback over time.
We believe the dollar can strengthen against G10 currencies; however, we expect the most pronounced strength to come against the emerging markets. Tighter Fed monetary policy and higher bond yields in the United States have historically weighed on emerging currencies, and we expect these dynamics to play out over the course of this year. In addition to higher bond yields, we expect local political developments in many developing countries to also be a source of currency depreciation in 2022. Latin American politics shifted sharply left last year, and we believe new policy platforms and political ideologies in countries such as Chile and Peru can still weigh on these currencies. In addition, Presidential elections will take place in Brazil and Colombia this year, and we expect left-leaning politicians to gather significant momentum in the lead up to each vote. Political risk tied to each election should also weigh on the Brazilian and Colombian currencies this year. In the EMEA region, unorthodox policy should continue to weigh on the Turkish lira, while a fragile economy and heightened political risk in South Africa should keep the rand on the back foot. In Russia, while the underlying fundamentals of the economy are strong, geopolitical tensions with the U.S. related to Ukraine and other regional issues should keep the ruble under pressure. And finally in Asia, we expect the diverging monetary policy path between the Fed and the PBoC to push the renminbi weaker against the dollar. In addition, geopolitical tensions and PBoC intervention could also place depreciation pressure on the renminbi. As the Chinese currency weakens, we expect other emerging Asian currencies to follow given the influence the path of the renminbi within Asia and for other Asian currencies.
US Bond Yields Had a Roaring Start
Markets
US bond yields had a roaring start coming out of a long weekend during early morning trading hours. We’ve distinguished some general drivers for the aggressive bond selloff. First, there was already some general yield momentum lingering as suggested by German/European markets on Monday, when the US was closed. A Houthi drone strike at the United Arab Emirates prompted oil supply fears. It caused prices to rise to the highest level since 2014, helping push up yields as well. Brent oil currently trades at $87.57 per barrel. Both the short and long end were able to cap some high-profile targets of 1% for the 2Y and 1.77% resistance in the 10Y, allowing for a technical acceleration that send the curve at some point more than 7 bps higher. That US yield vigor largely held up during the European session even as (second tier) data were a mixed bag: the US manufacturing index (see below) declined sharply but the German ZEW (expectations component) crushed estimates. Current gains on the US yield curve range from 4.9 bps (2y) over 5.5 bps (5y) to 3.3 bps (30y) with the bulk driven by real yields. Today’s move brings the spread between the US 30y and 5y to the lowest level since March 2020. The yield surge sours equity mood. Losses add up to 1% in Europe and almost 2% in the US (Nasdaq). German and European yields initially joined US peers but soon met with resistance. For the German 10y this meant another throw to the symbolic 0% ended in tears (-0.1 bp). The short end outperforms with the 2y yield 1.1 bp down. In other bond news, the Kingdom of Belgium successfully launched its first (out of three) syndicated benchmark deal. It sold €5bn of a 2032 at MS-6 compared to MS-5 guidance. Books were above €21bn. Greece intends to launch its first new 10y benchmark of the year, most likely tomorrow. The country is underperforming peers in terms of peripheral yield changes today (+2 bps).
Contrary to what was the case lately, the US dollar is finally starting to profit from the real yield surge. The 10y variant (-0.66%) is closing in on the previous cycle high of -0.60% in a steep move that started since the new year. DXY (trade-weighted dollar) bounces of support from the upward sloping trend line at 95.13 to 95.57. EUR/USD gives up on 1.14 to trade around 1.136, below intermediate support of 1.1386. Risk-off (equity) and rising US bond yields keep USD/JPY in check. Sterling was largely unaffected by a generally solid labour market report. EUR/GBP whipsawed near the short-term equilibrium of 0.835/0.836.
News Headlines
The New York Manufacturing Index unexpectedly declined from 31.9 in December to -0.7 in January. The NY Fed concludes that activity stalled after a period of 18 months of expansion. The new orders index also suggests a slight decline in orders (-5.0 from 27.1). At 1.0 (from 27.1) the shipment index also suggested limited growth. However, indicators related to supply chains (delivery times, inventories unfilled orders) remain at elevated levels. Firms continue to expand employment (16.1) and the average workweek. At respectively 76.7 and 37.1 for prices paid and prices received, pressure remains elevated even as they slowed slightly. Looking forward, the sentiment on activity six months ahead remains more or less stable at a solid 35.1. Future price subindices even are rising further to a record high. Conclusion: NY manufacturing is temporarily dented by omicron, but the outlook remains constructive with few indications that price pressures are easing.
In an interview with DeniKN, Czech central bank head Rusnok was quoted as saying that the CNB plans to raise interest rates further. However, the pace of monetary tightening will probably be slower than at the end of last year. The article indicates that Rusnok expects the interest rate to move above 4% but not beyond 5.0%. He was also quoted that the exchange rate now already reflects a large part of the rate hikes. Despite the rise in core (US) yields, the koruna maintains recent gains trading near EUR/CZK 24.415.
Canadian Housing Starts Ease But Remain Elevated in December
In December, Canadian housing starts fell by 22% m/m from November's extremely elevated level, coming in at 236.1k units. This marked the lowest pace of starts activity since December 2020. However, the six-month moving average remained exceptionally strong at 260.6k units.
In urban markets, declines were registered in both single-detached and multi-family units. Starts of single-detached units fell by 4% m/m to 55.2k units. Meanwhile, multi-family starts dropped by 29% m/m to 157.7k units, almost fully unwinding November's robust gain.
Urban starts were lower in six of 10 Provinces:
- In Ontario, starts plunged from their November level (-59.1k to 66.3k units)
- Starts fell by 10.1k units in the Prairies, leaving their level at 39.5k units. Alberta was the largest drag, followed by Saskatchewan.
- In the Atlantic Region, starts increased (+1.4k to 14.2k units), boosted by Newfoundland and Labrador and Nova Scotia. December also marked the 3rd straight strong month for starts in the Atlantic.
- Starts declined by 14.3k in Quebec to 41.2k units and jumped by 15.2k to 51.0k units in B.C.
Key Implications
Some easing in December's starts data was expected, given the outsized November surge. On a trend basis, the pace of starts remains robust, stimulated by strong demand, low levels of unsold new inventories, and elevated prices.
For the fourth quarter overall, starts dipped by a mere 1%. This introduces an upside risk to our forecast calling for an outsized drop in residential investment in the fourth quarter.
Moving forward, building permit data point to starts remaining well above pre-pandemic levels in the near-term. Looking further ahead, we expect starts to move lower, trending towards levels more in-line with underlying fundamentals. Higher interest rates are likely to take some steam from demand, thus moderating the pace of homebuilding, albeit with a lag.
Stocks Retreat and Dollar Nudges Higher as Yields Spike
Dollar and safe havens shine; loonie amongst the few winners
The US dollar is storming higher today, heavily supported by surging Treasury yields, as markets seem to be pricing in four rate hikes by the Fed in 2022. Moreover, the significant losses observed in risky assets due to rising Treasury yields triggered a broader risk-off sentiment in the markets, adding more fuel to the dollar’s rally. In addition, the soaring risk aversion in today’s session favours safe haven currencies such as the Japanese Yen and the Swiss franc, which are appreciating against a broad range of currencies.
However, the loonie is the stronger currency on the forex spectrum today as it is the only commodity-linked currency that managed to capitalize on the fact that oil is trading near seven-year highs. On the other hand, the aussie and kiwi are inching lower, largely pressured by the prevailing risk-off sentiment.
The euro and British pound are struggling in today’s session without any major headlines behind these weaknesses as their pullback is mainly attributed to the stronger dollar.
US stocks tumble amid surging yields
Wall Street is set to open the week lower as surging Treasury yields seem to be inflicting serious damage on tech stocks and consequently on the Nasdaq. Moreover, weaker-than-expected Q4 earnings reported by most major US banks are dragging the S&P 500 lower as well. More specifically, e-mini futures for the Nasdaq, S&P 500 and Dow Jones are taking a hard hit in pre-market trade, currently losing 1.65%, 1.05% and 0.9% on the day, respectively.
In Europe, most major indexes are in the red today as increasing odds for faster rate hikes by the Fed seem to be affecting investors’ risk appetite.
Oil near 7-year highs; gold holds steady
Oil prices jumped to their highest levels since 2014 today as geopolitical flare-ups in the Mideast Gulf increased fears for renewed supply disruptions amid an already tight supply outlook. Gold is a little softer on the day but it is holding its ground, probably endorsed by the general risk-off sentiment in the markets, although it is being heavily pressured by rising Treasury yields and a stronger dollar.
Bitcoin and the broader cryptocurrency market continue to be a sea of red today as surging Treasury yields are significantly weighing on risky assets.