Sample Category Title
EUR/JPY Daily Outlook
Daily Pivots: (S1) 129.83; (P) 130.34; (R1) 130.90; More....
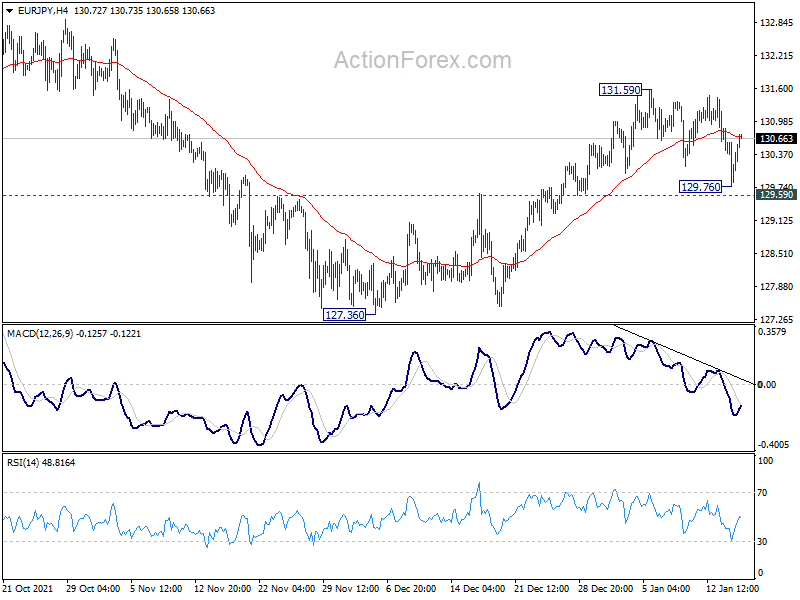
Intraday bias in EUR/JPY remains neutral for the moment. On the upside, break of 131.59 resistance will reaffirm the bullish case that consolidation from 134.11 could have completed with three waves down to 127.36, ahead of 126.58 medium term fibonacci level. Further rally would then be seen to retest 133.44/134.11 resistance zone. On the downside break of 129.59 minor support will argue that rebound from 127.36 has completed and turn bias back to the downside for this support.
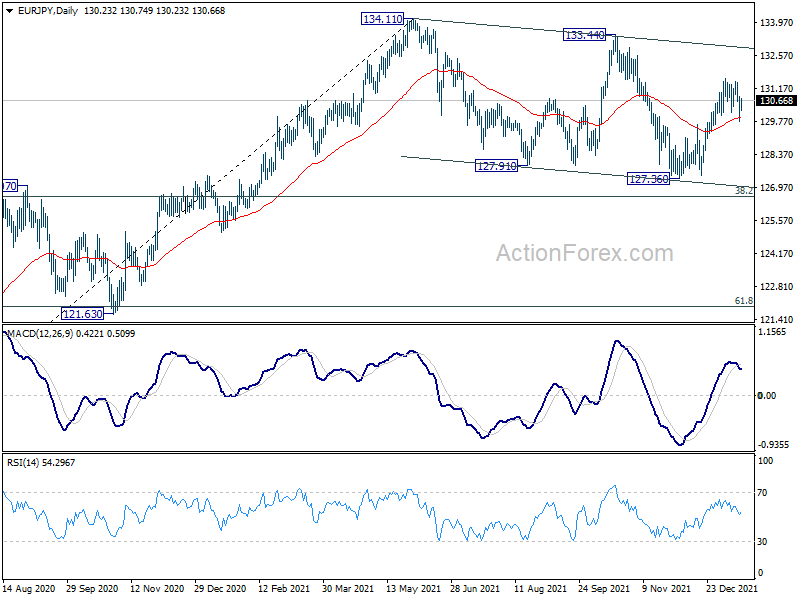
In the bigger picture, as long as 38.2% retracement of 114.42 (2020 low) to 134.11 at 126.58 holds, up trend from 114.42 is still in favor to continue. Break of 134.11 will target long term resistance at 137.49 (2018 high). However, sustained break of 126.58 will raise the chance of medium term bearish reversal. In this case, deeper decline would be seen to 61.8% retracement at 121.94, and possibly below.
GBP/JPY Daily Outlook
Daily Pivots: (S1) 155.59; (P) 156.11; (R1) 156.75; More...
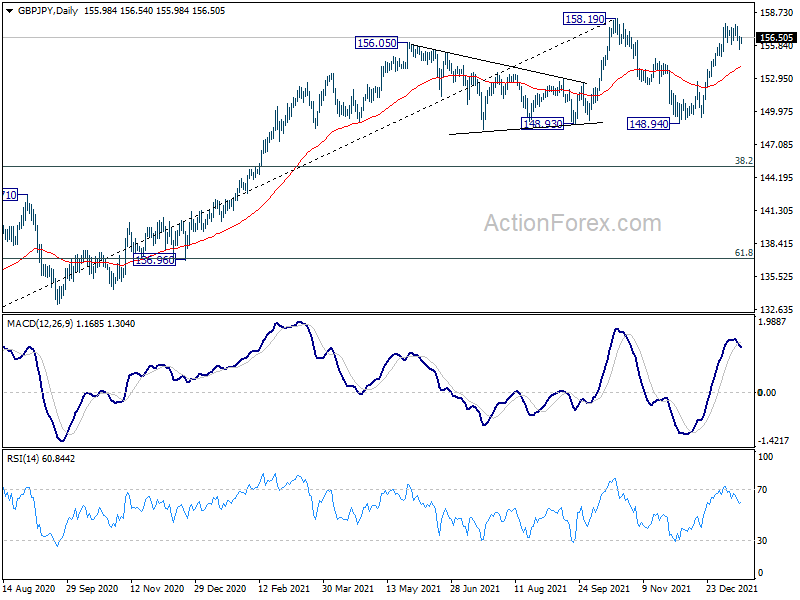
Intraday bias in GBP/JPY remains neutral for the moment, and consolidation from 157.74 could extend. Overall, further rise is still expected with 154.86 support intact. On the upside, decisive break of 158.19 high will resume larger up trend to 167.93 long term fibonacci level. On the downside, below 154.86 minor support will turn intraday bias back to the downside for deeper pull back.
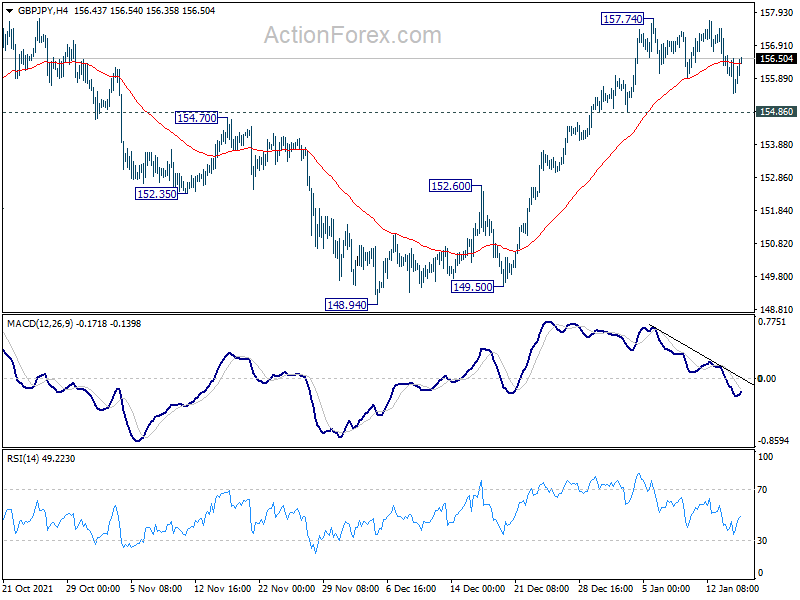
In the bigger picture, strong rebound from 148.93 key structural support retains medium term bullishness. Firm break of 158.19 high will resume whole up trend from 123.94 (2020 low), to 61.8% retracement of 195.86 to 122.75 at 167.93. Nevertheless, firm break of 148.93 will bring deeper correction to 38.2% retracement of 123.94 to 158.19 at 145.10, and possibly further lower, as a correction to up trend from 123.94 at least.
Yen Paring Some Gains in Quiet Asia
The markets are overall relatively quietly in Asian session today and trading could be subdued with US on holiday. Canadian Dollar is resilient with WTI oil staying firm at around 84 handle. Euro and Dollar are both strengthening notably. On the other hand, Yen, Aussie and Kiwi are softening. In particular, traders seem to be lightening up Yen positions ahead of tomorrow's BoJ policy decision and statement.
Technically, while the selloff in USD/JPY was steep last week, EUR/JPY and GBP/JPY are staying in consolidative range only. In particular, GBP/JPY is holding comfortably above 154.86 minor support. We'll turn our focus to 131.59 and 157.12 resistance in EUR/JPY and GBP/JPY today. Break there will resume recent rally in both crosses. If that happens, we'll see if EUR/USD and GBP/USD would break through corresponding levels at 1.1482 and 1.3748.
In Asia, at the time of writing, Nikkei is up 0.77%. Hong Kong HSI is down -0.59%. China Shanghai SSE is up 0.59%. Singapore Strait Times is up 0.08%. Japan 10-year JGB yield is up 0.0044 at 0.155.
China GDP grew 4.0% yoy in Q4, weak retail sales
China GDP grew 4.0% yoy in Q4, much faster than expectation of 3.3% yoy. On a quarterly basis, GDP grew 1.6% qoq, above expectation of 1.1% qoq. For 2021 as a whole, GDP grew 8.1%, slightly above expectation of 8.1%.
In December, industrial production rose 4.3% yoy, above expectation of 3.6%. Retail sales rose 1.7% yoy, below expectation of 3.7% yoy. Fixed asset investment rose 4.9% ytd yoy, slightly above expectation of 4.8%.
The National Bureau of Statistics said, "we must be aware that the external environment is more complicated and uncertain, and the domestic economy is under the triple pressure of demand contraction, supply shock and weakening expectations."
Also from China, steel production dropped for the first time in six years in 2021, down -3% from 1.065B tonnes to 1.03B tonnes. Birth rate dropped to a record low of 7.52 births per 1000 people in 2021, down from 2020's 8.52 births per 1000 people.
Bitcoin staying in sideway consolidation, still defending 40k
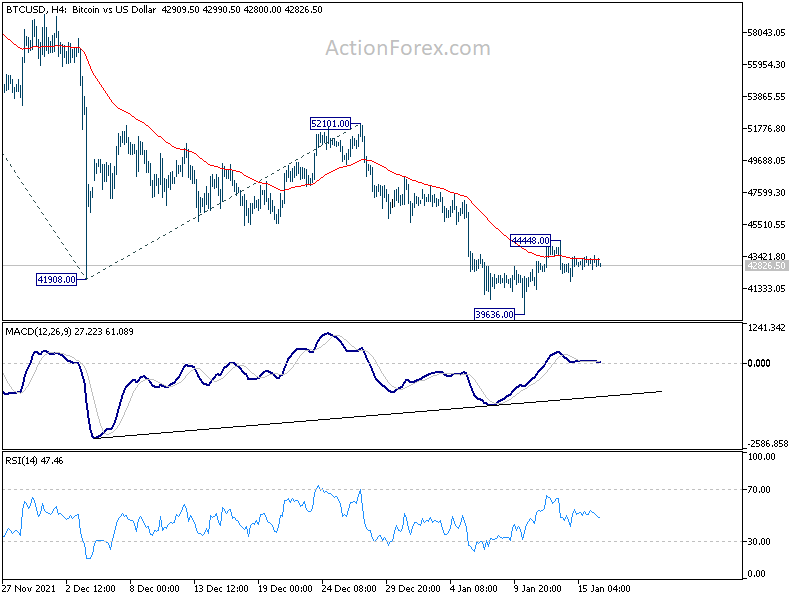
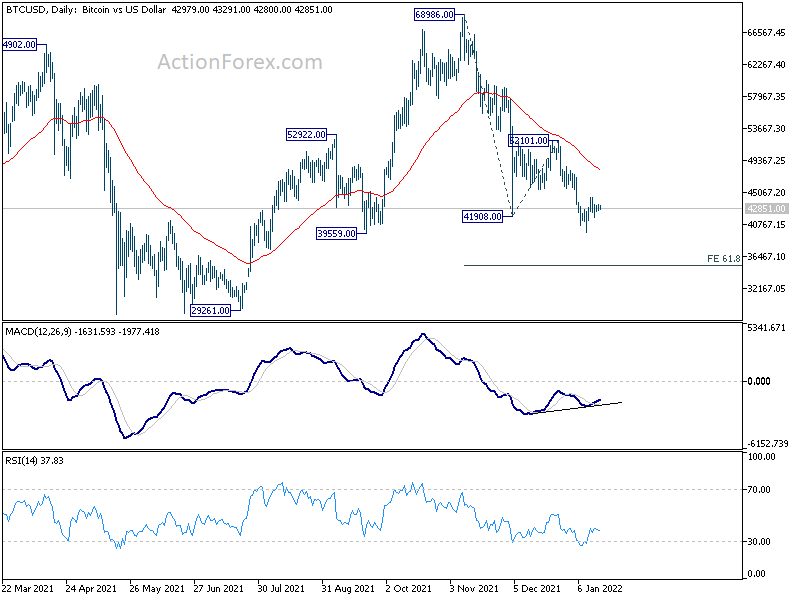
Bitcoin is now staying in consolidation above 39636 short term bottom, after quickly defending 40k handle. Considering that it's sitting just above 39559 structural support too, the consolidation could extend for a while. But outlook will stay bearish for another fall to 61.8% projection of 68986 to 41908 from 52101 at 35366 before completing the decline from 68986 high.
The timing of the downside breakout will depend on the eventual reaction to 4 hour 55 EMA (now at 43211) which it's struggling with. A strong break above 4 hour 55 EMA will stronger rebound to 55 day EMA (now at 48230) first, and rejected there to bring down trend resumption. Meanwhile, rejection by the current level could bring downside breakout rather quickly through 396363 to the mentioned 35366 target.
BoJ to highlight the week, with a batch of UK data
BoJ meeting is a focus for the week even though no policy change is expected. There are talks that debates on telegraphing a rate hike has already started between policymakers. While BoJ is still distant from actually delivering it, they may start to build up market expectations for an eventual hike, by gradually tweaking the forward guidance. It could also be argued that a hint on rate increase could help solidify positive inflation expectation. Meanwhile, CPI from japan will also be closely watched.
Elsewhere, UK will also release a batch of data including employment, inflation and retail sales. But it unsure if markets would shrug off them just like the strong GDP data released last week. Germany ZEW, Canada CPI and retail sales, Australia employment, and China GDP will also be closely watched.
Here are some highlights for the week:
- Monday: Japan machine orders, tertiary industry index; China GDP, retail sales, industrial production, fixed asset investment; Canada foreign securities purchases, manufacturing sales, BoC business outlook survey.
- Tuesday: New Zealand NZIER business confidence; BoJ rate decision; UK employment; Swiss PPI; Germany ZEW economic sentiment; Canada housing starts; US empire state manufacturing, NABH housing index.
- Wednesday: Australia Westpac consumer sentiment; Germany CPI final; UK CPI, PPI; Eurozone current account; Canada CPI, wholesale sales; US housing starts and building permits.
- Thursday: Japan trade balance; Australia employment; Eurozone CPI final, ECB meeting accounts; Germany PPI; US jobless claims, Philly Fed survey, existing home sales.
- Friday: New Zealand BusinessNZ manufacturing index; Japan CPI, BoJ meetings; UK Gfk consumer confidence, retail sales; Canada retail sales, new housing price index.
GBP/JPY Daily Outlook
Daily Pivots: (S1) 155.59; (P) 156.11; (R1) 156.75; More...
Intraday bias in GBP/JPY remains neutral for the moment, and consolidation from 157.74 could extend. Overall, further rise is still expected with 154.86 support intact. On the upside, decisive break of 158.19 high will resume larger up trend to 167.93 long term fibonacci level. On the downside, below 154.86 minor support will turn intraday bias back to the downside for deeper pull back.
In the bigger picture, strong rebound from 148.93 key structural support retains medium term bullishness. Firm break of 158.19 high will resume whole up trend from 123.94 (2020 low), to 61.8% retracement of 195.86 to 122.75 at 167.93. Nevertheless, firm break of 148.93 will bring deeper correction to 38.2% retracement of 123.94 to 158.19 at 145.10, and possibly further lower, as a correction to up trend from 123.94 at least.
Economic Indicators Update
| GMT | Ccy | Events | Actual | Forecast | Previous | Revised |
|---|---|---|---|---|---|---|
| 23:50 | JPY | Machinery Orders M/M Nov | 3.40% | 1.40% | 3.80% | |
| 00:01 | GBP | Rightmove House Price Index M/M Jan | 0.30% | -0.70% | ||
| 02:00 | CNY | GDP Y/Y Q4 | 4.00% | 3.30% | 4.90% | |
| 02:00 | CNY | Retail Sales Y/Y Dec | 1.70% | 3.70% | 3.90% | |
| 02:00 | CNY | Industrial Production Y/Y Dec | 4.30% | 3.60% | 3.80% | |
| 02:00 | CNY | Fixed Asset Investment YTD Y/Y Dec | 4.90% | 4.80% | 5.20% | |
| 04:30 | JPY | Tertiary Industry Index M/M Nov | 1.10% | 1.50% | ||
| 11:00 | EUR | German Buba Monthly Report | ||||
| 13:30 | GBP | NIESR GDP Estimate (3M) Dec | 0.90% | |||
| 13:30 | CAD | Manufacturing Sales M/M Nov | 1.70% | 4.30% | ||
| 15:30 | CAD | BoC Business Outlook Survey |
Technical Outlook and Review
DXY:
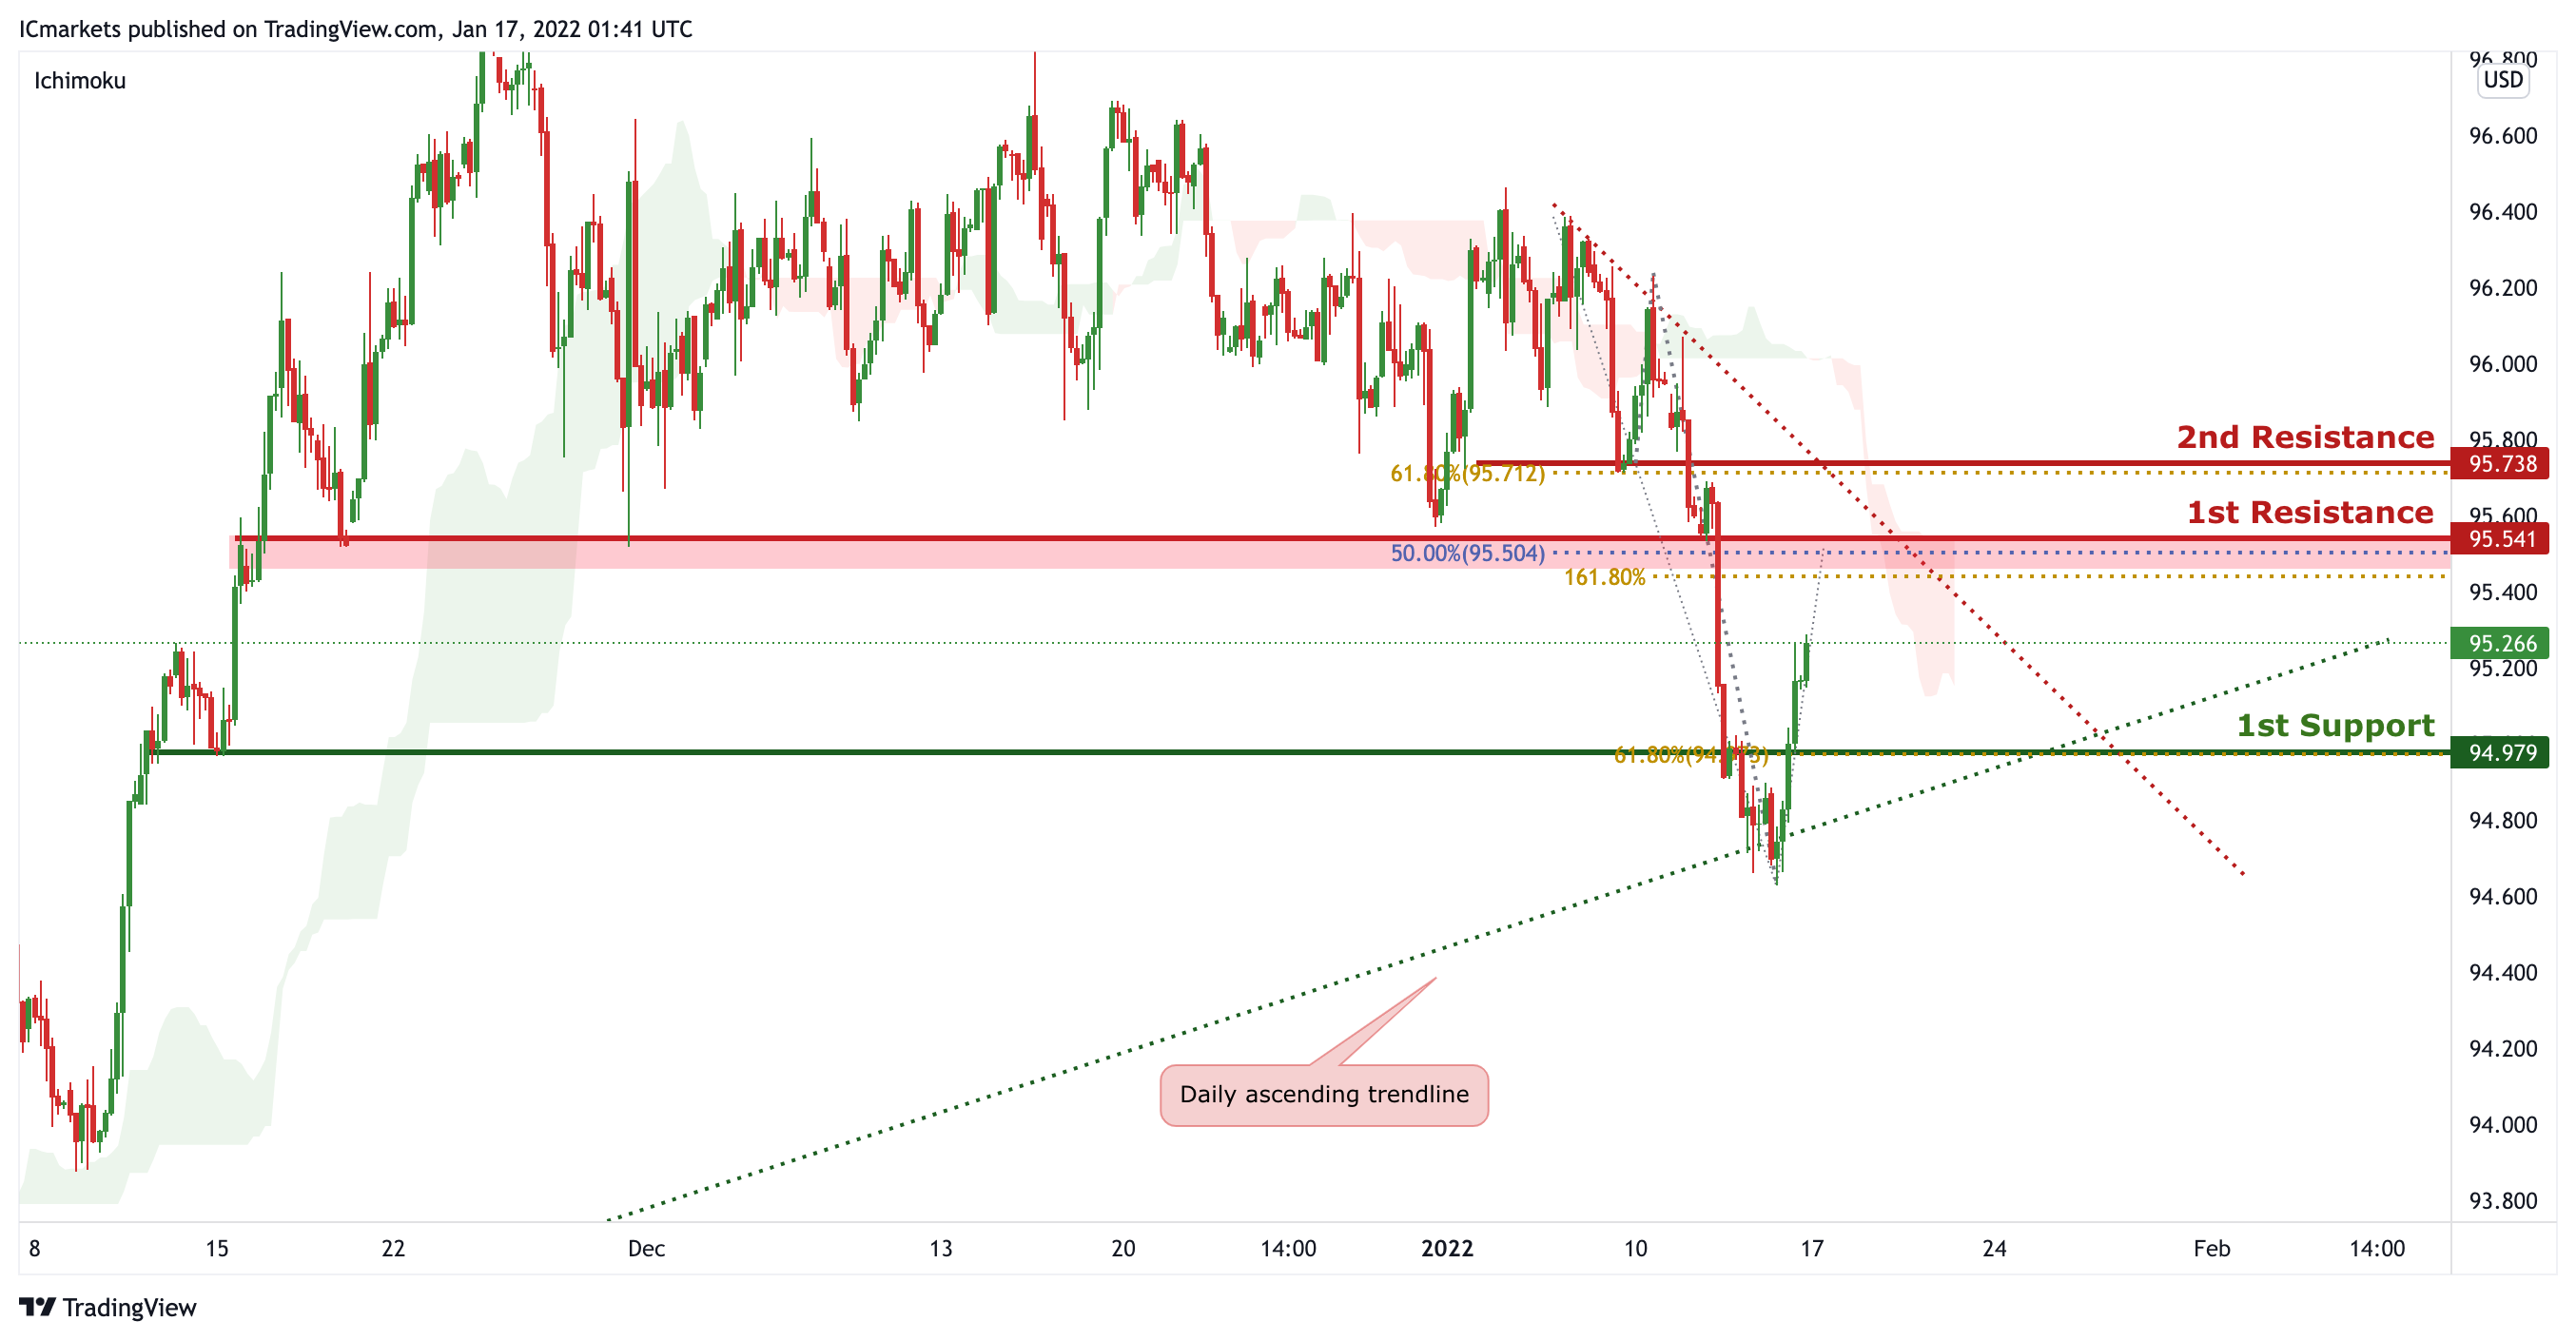
On the H4 timeframe, price is abiding to the ascending trendline support on the daily and descending trendline resistance on the H4. We can now expect price to push higher up to the 1st Resistance in line with 50% Fibonacci retracement and 161.8% Fibonacci projection and drop to 1st Support in line with 61.8% Fibonacci retracement. Our short-term bearish bias is further supported by the Ichimoku cloud indicator acting as a resistance.
Areas of consideration:
- H4 time frame, 1st resistance at 95.541
- H4 time frame, 1st support at 94.979
XAU/USD (GOLD):
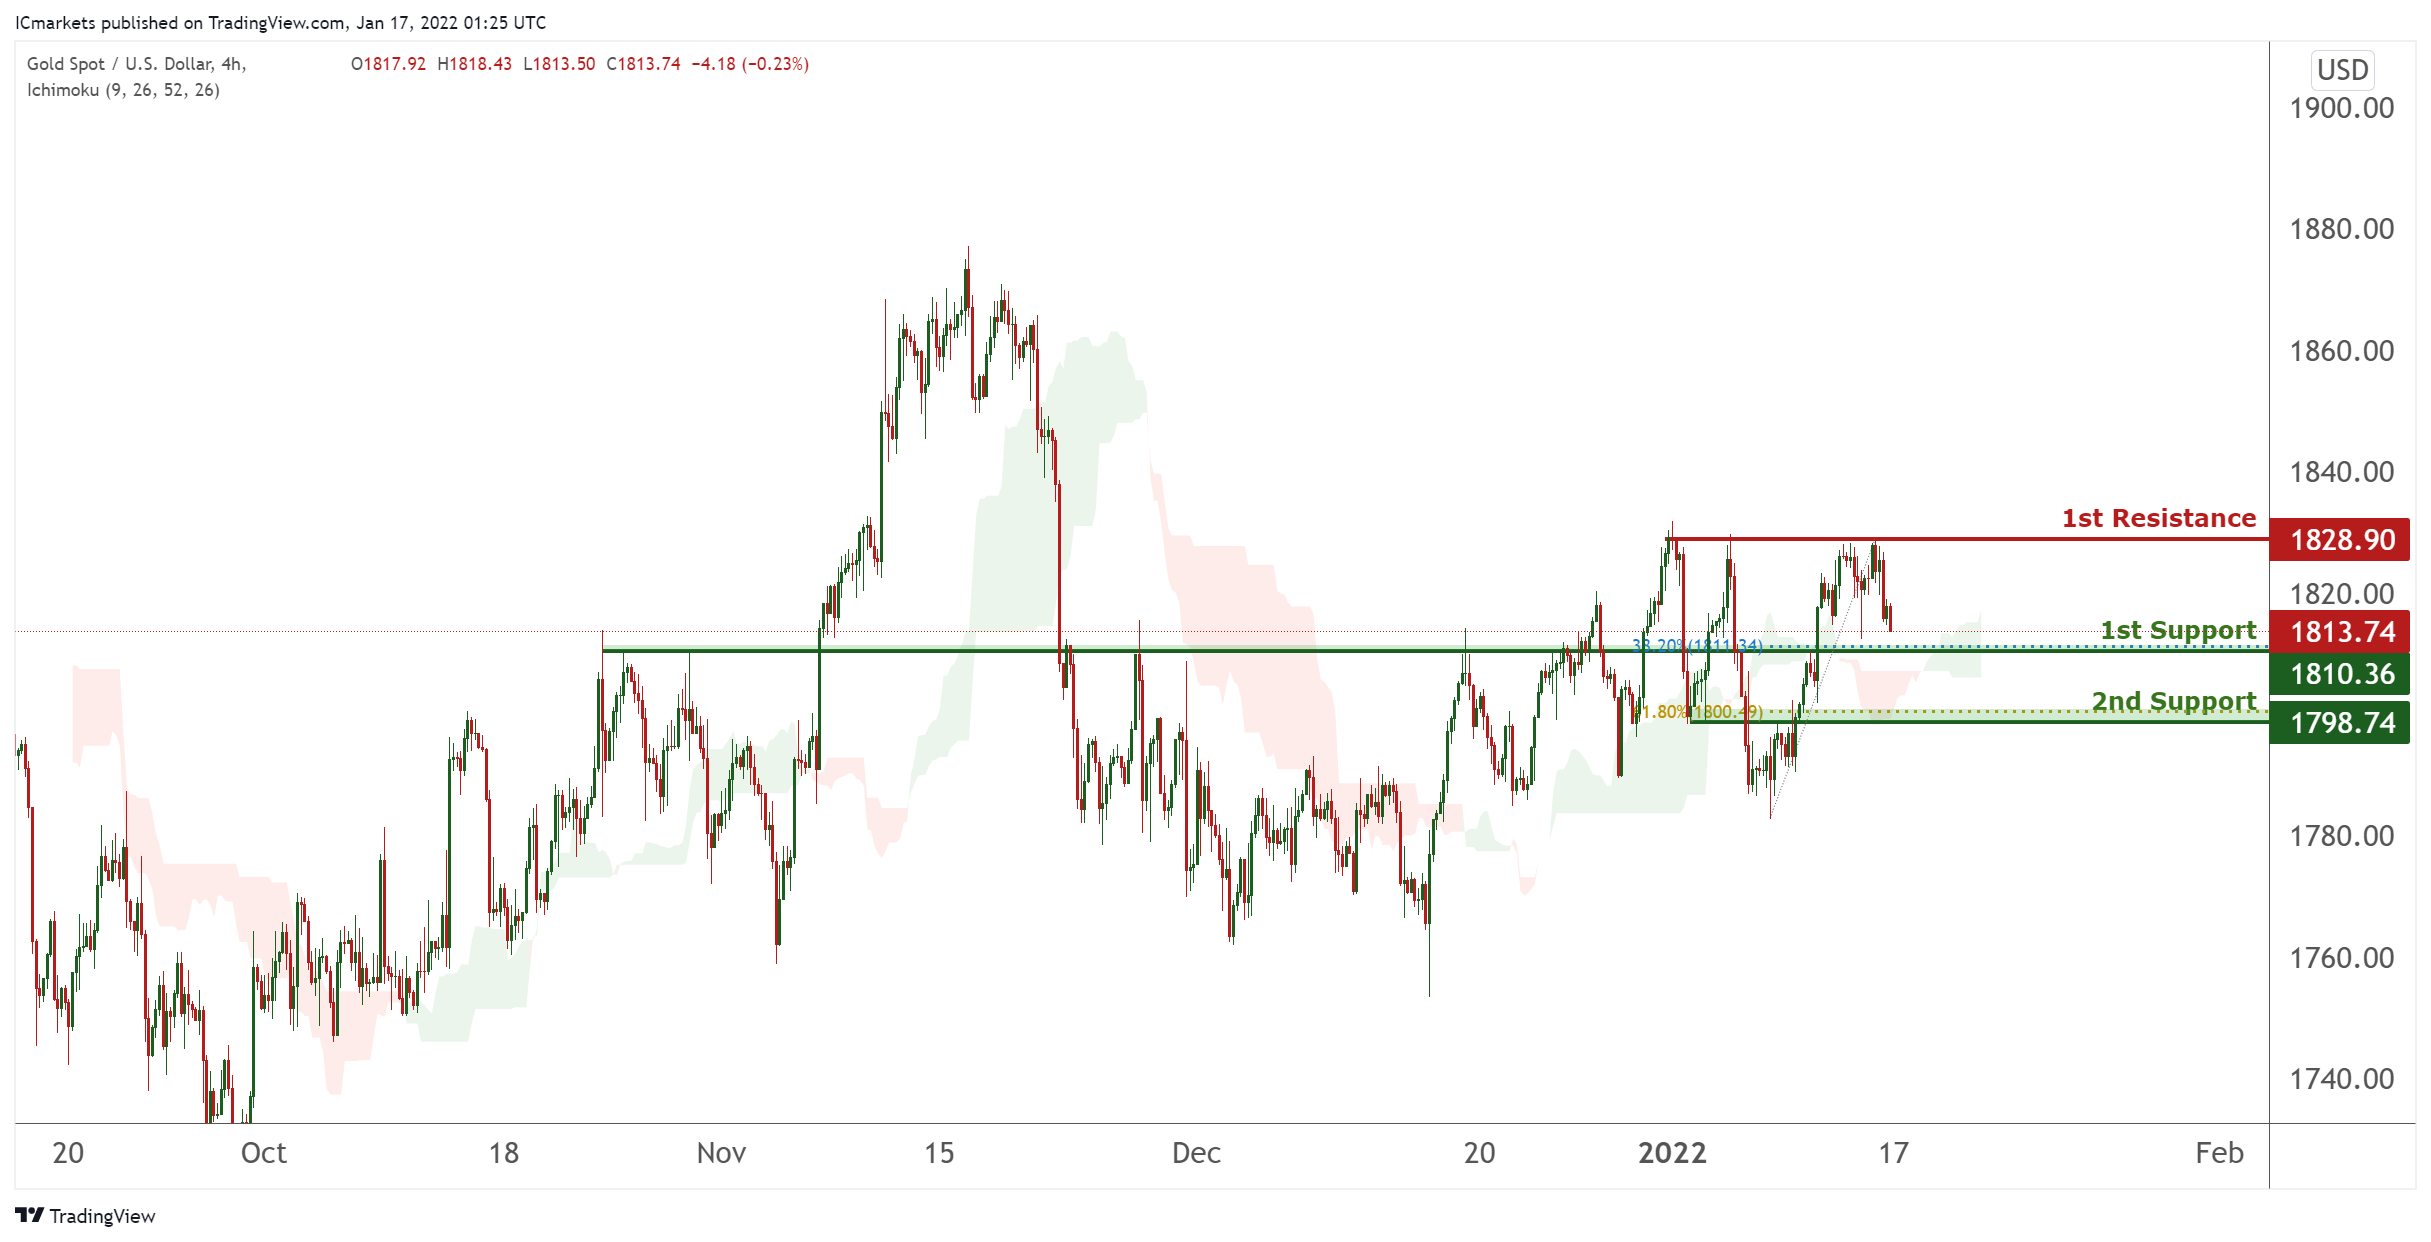
On the H4, with price moving above the ichimoku cloud, we have a bullish bias that price will rise to our 1st resistance at 1828 which is in line with horizontal swing high resistance from 1st support at 1810, which is in line with horizontal overlap support and 738.2% Fibonacci retracement level. Alternatively, price may break 1st support structure and head for 2nd support at 1798, which coincides with horizontal swing overlap support and 61.8% Fibonacci retracement level .
Areas of consideration:
- 4h 1st support at 1828
- 4h 1st resistance at 1810
GBP/USD
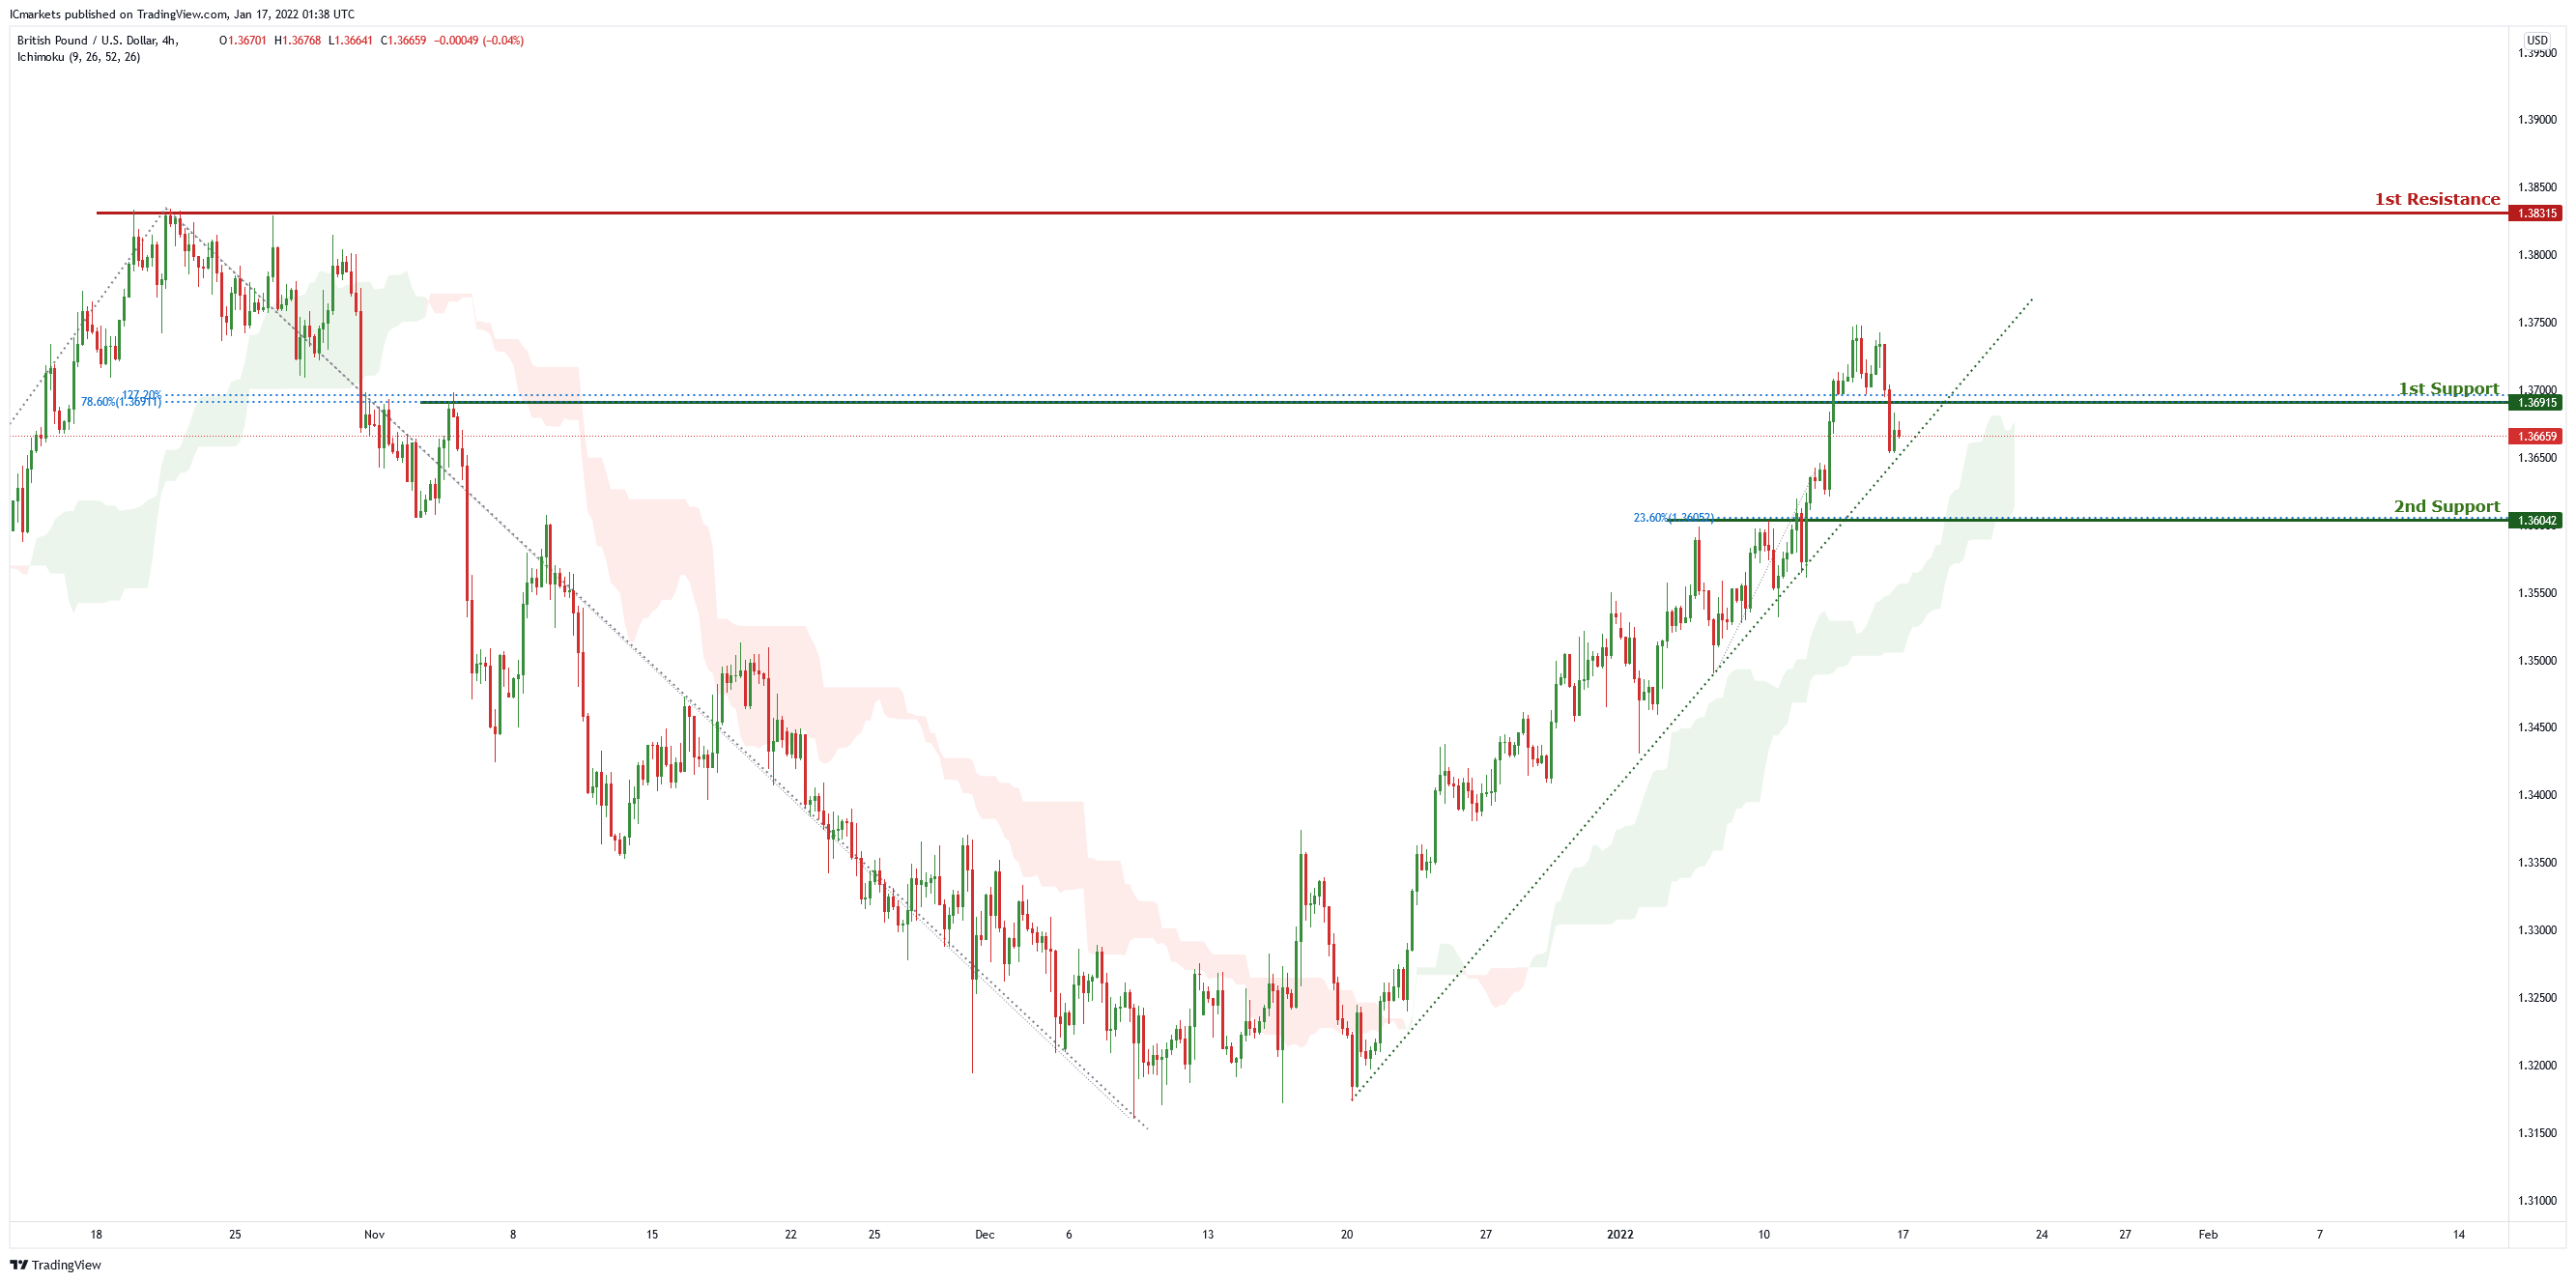
On the H4 chart price is abiding by an ascending trendline and near the first support level of 1.36915 which is also 78.6%% Fibonacci retracement and 127.2% Fibonacci projection . Price can potentially go to the 1st resistance level of 1.38315 which is the graphical swing high level. Our bullish bias is supported by the ichimoku cloud indicator as price is trading above it.
Areas of consideration:
- H4 1st resistance at 1.38315
- H4 1st support 1.36915
USD/CHF
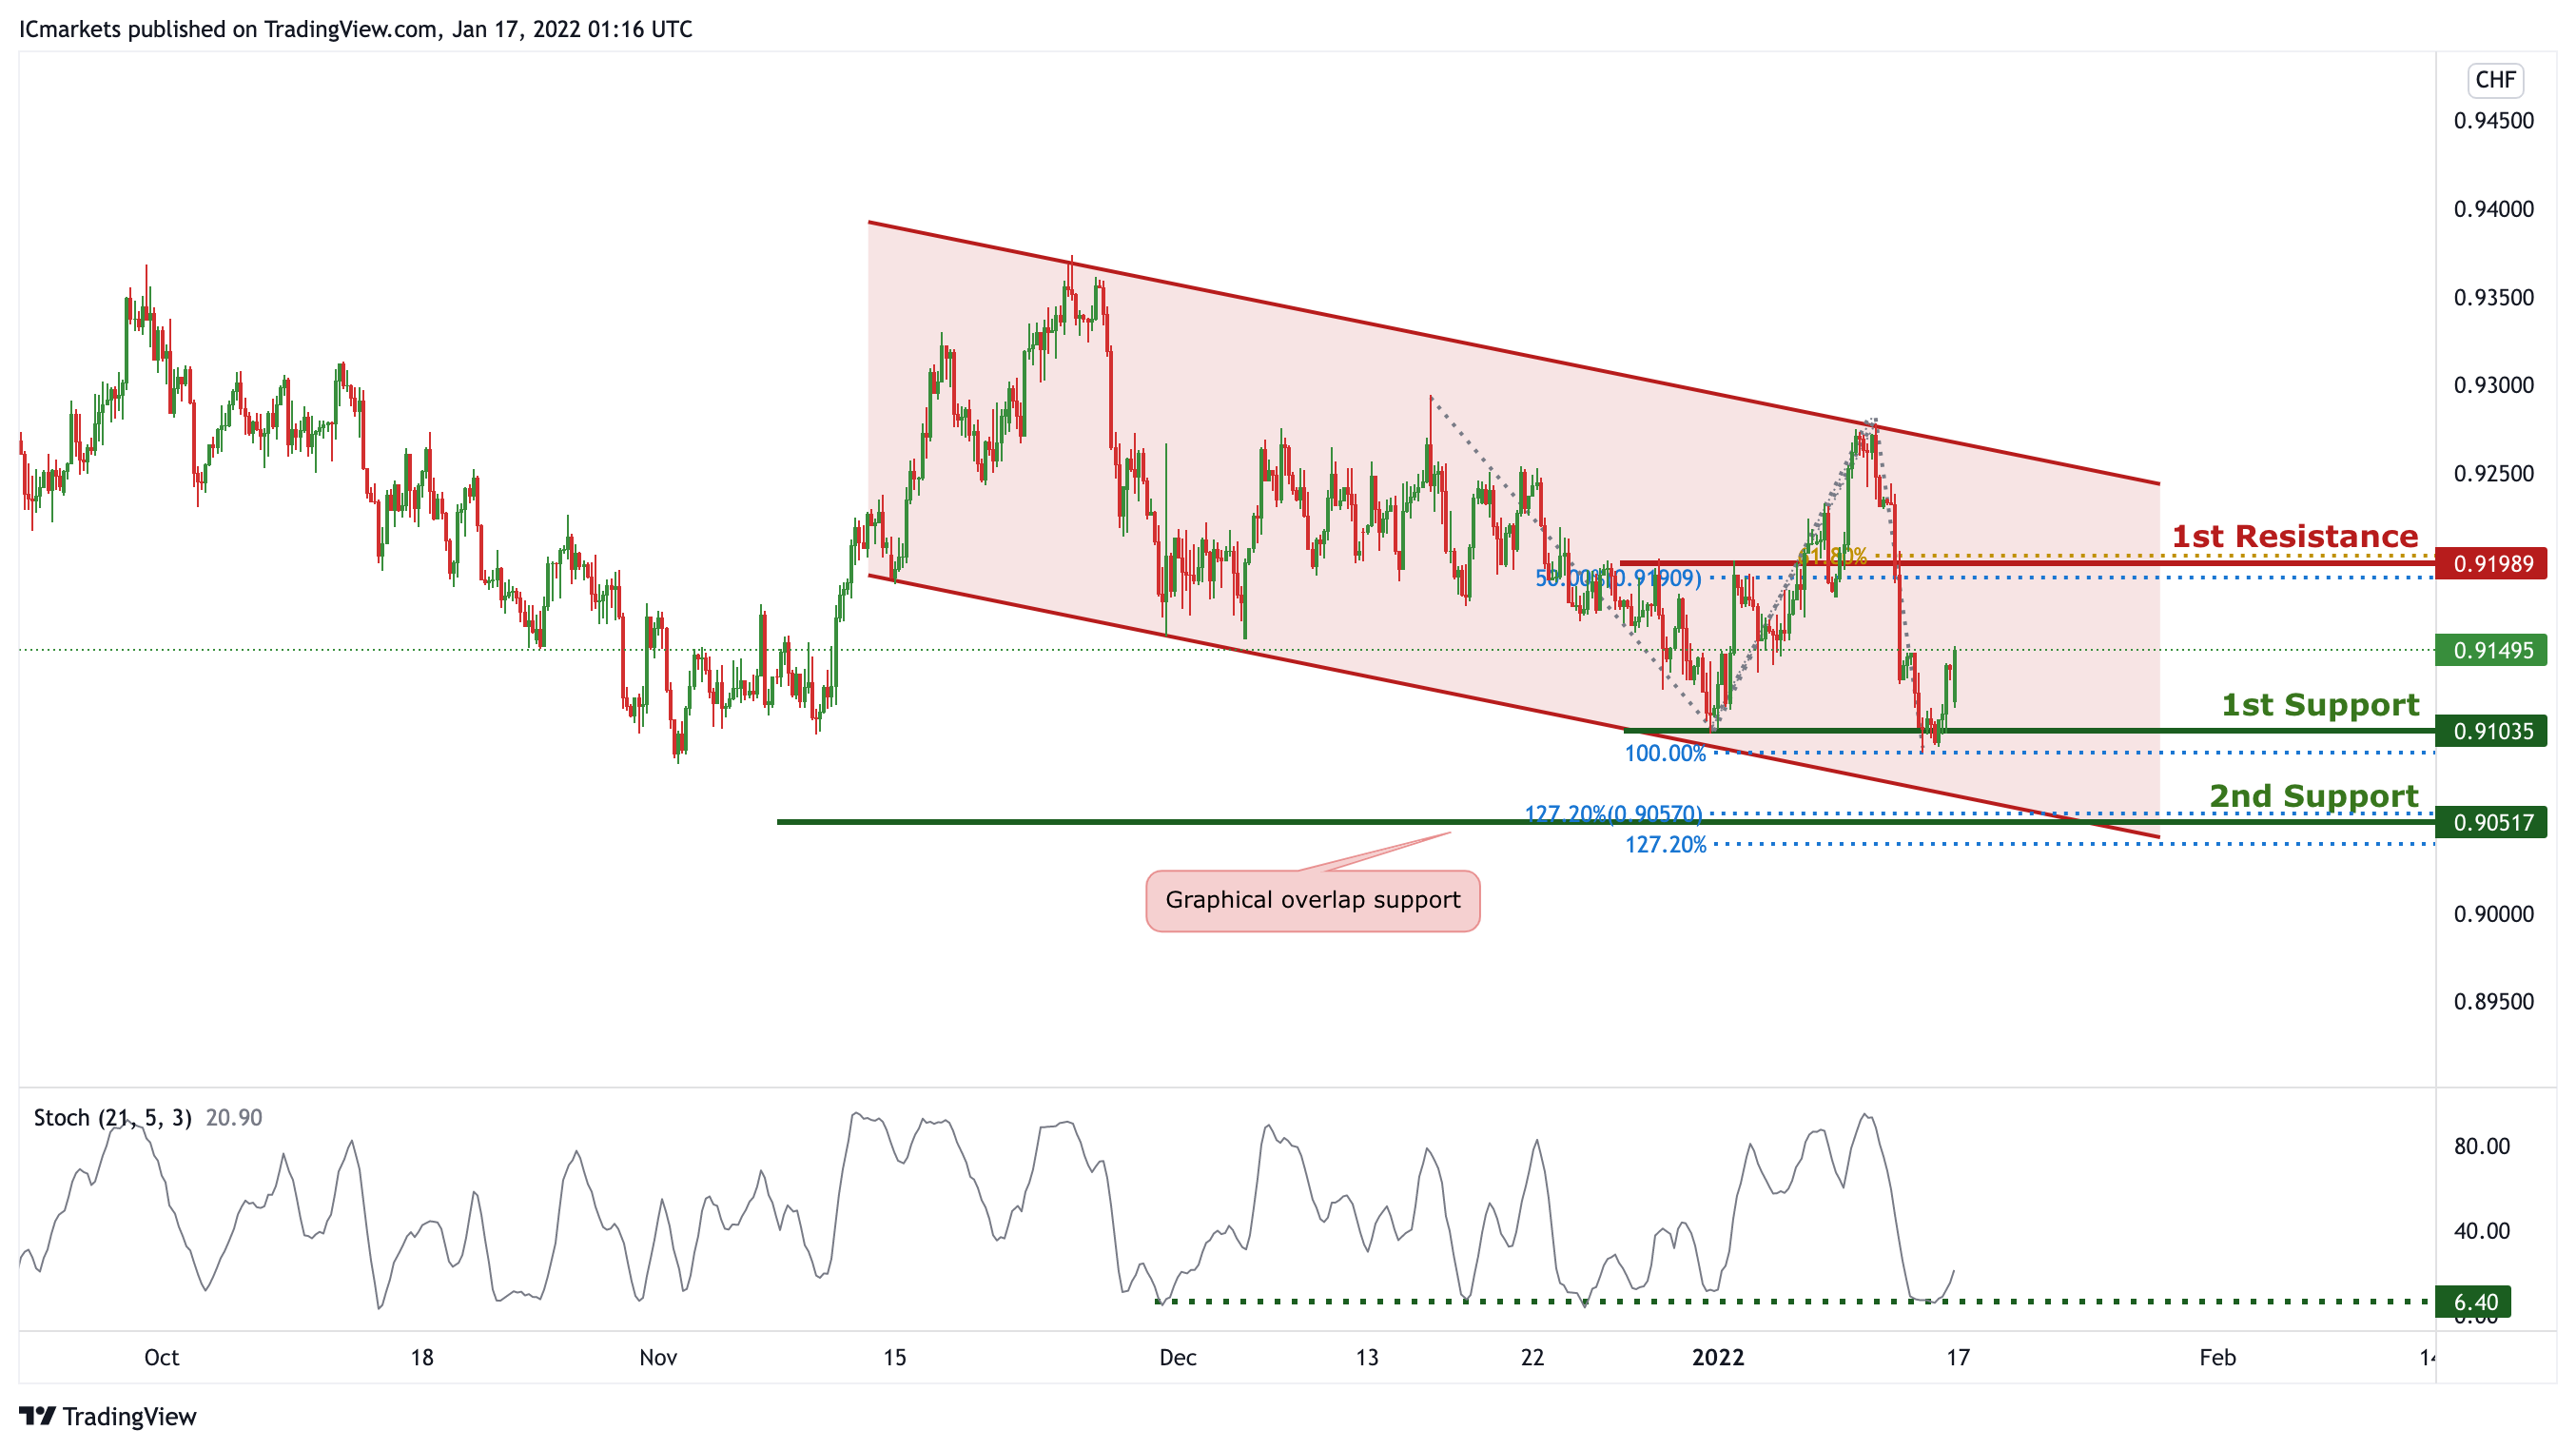
On the H4 timeframe, price is abiding to a descending channel, signifying a bearish momentum. Price is approaching a support level, we can expect price to make a short-term bullish bounce in line with 78.6% Fibonacci Projection and 161.8% Fibonacci retracement towards 1st Resistance in line with 78.6% Fibonacci projection. Our short-term bullish bias is further supported by the stochastic indicator where the %K line is approaching the support level.
Areas of consideration:
- Watch 1st Support at 0.91113
- Watch 1st Resistance at 0.92698
EUR/USD :
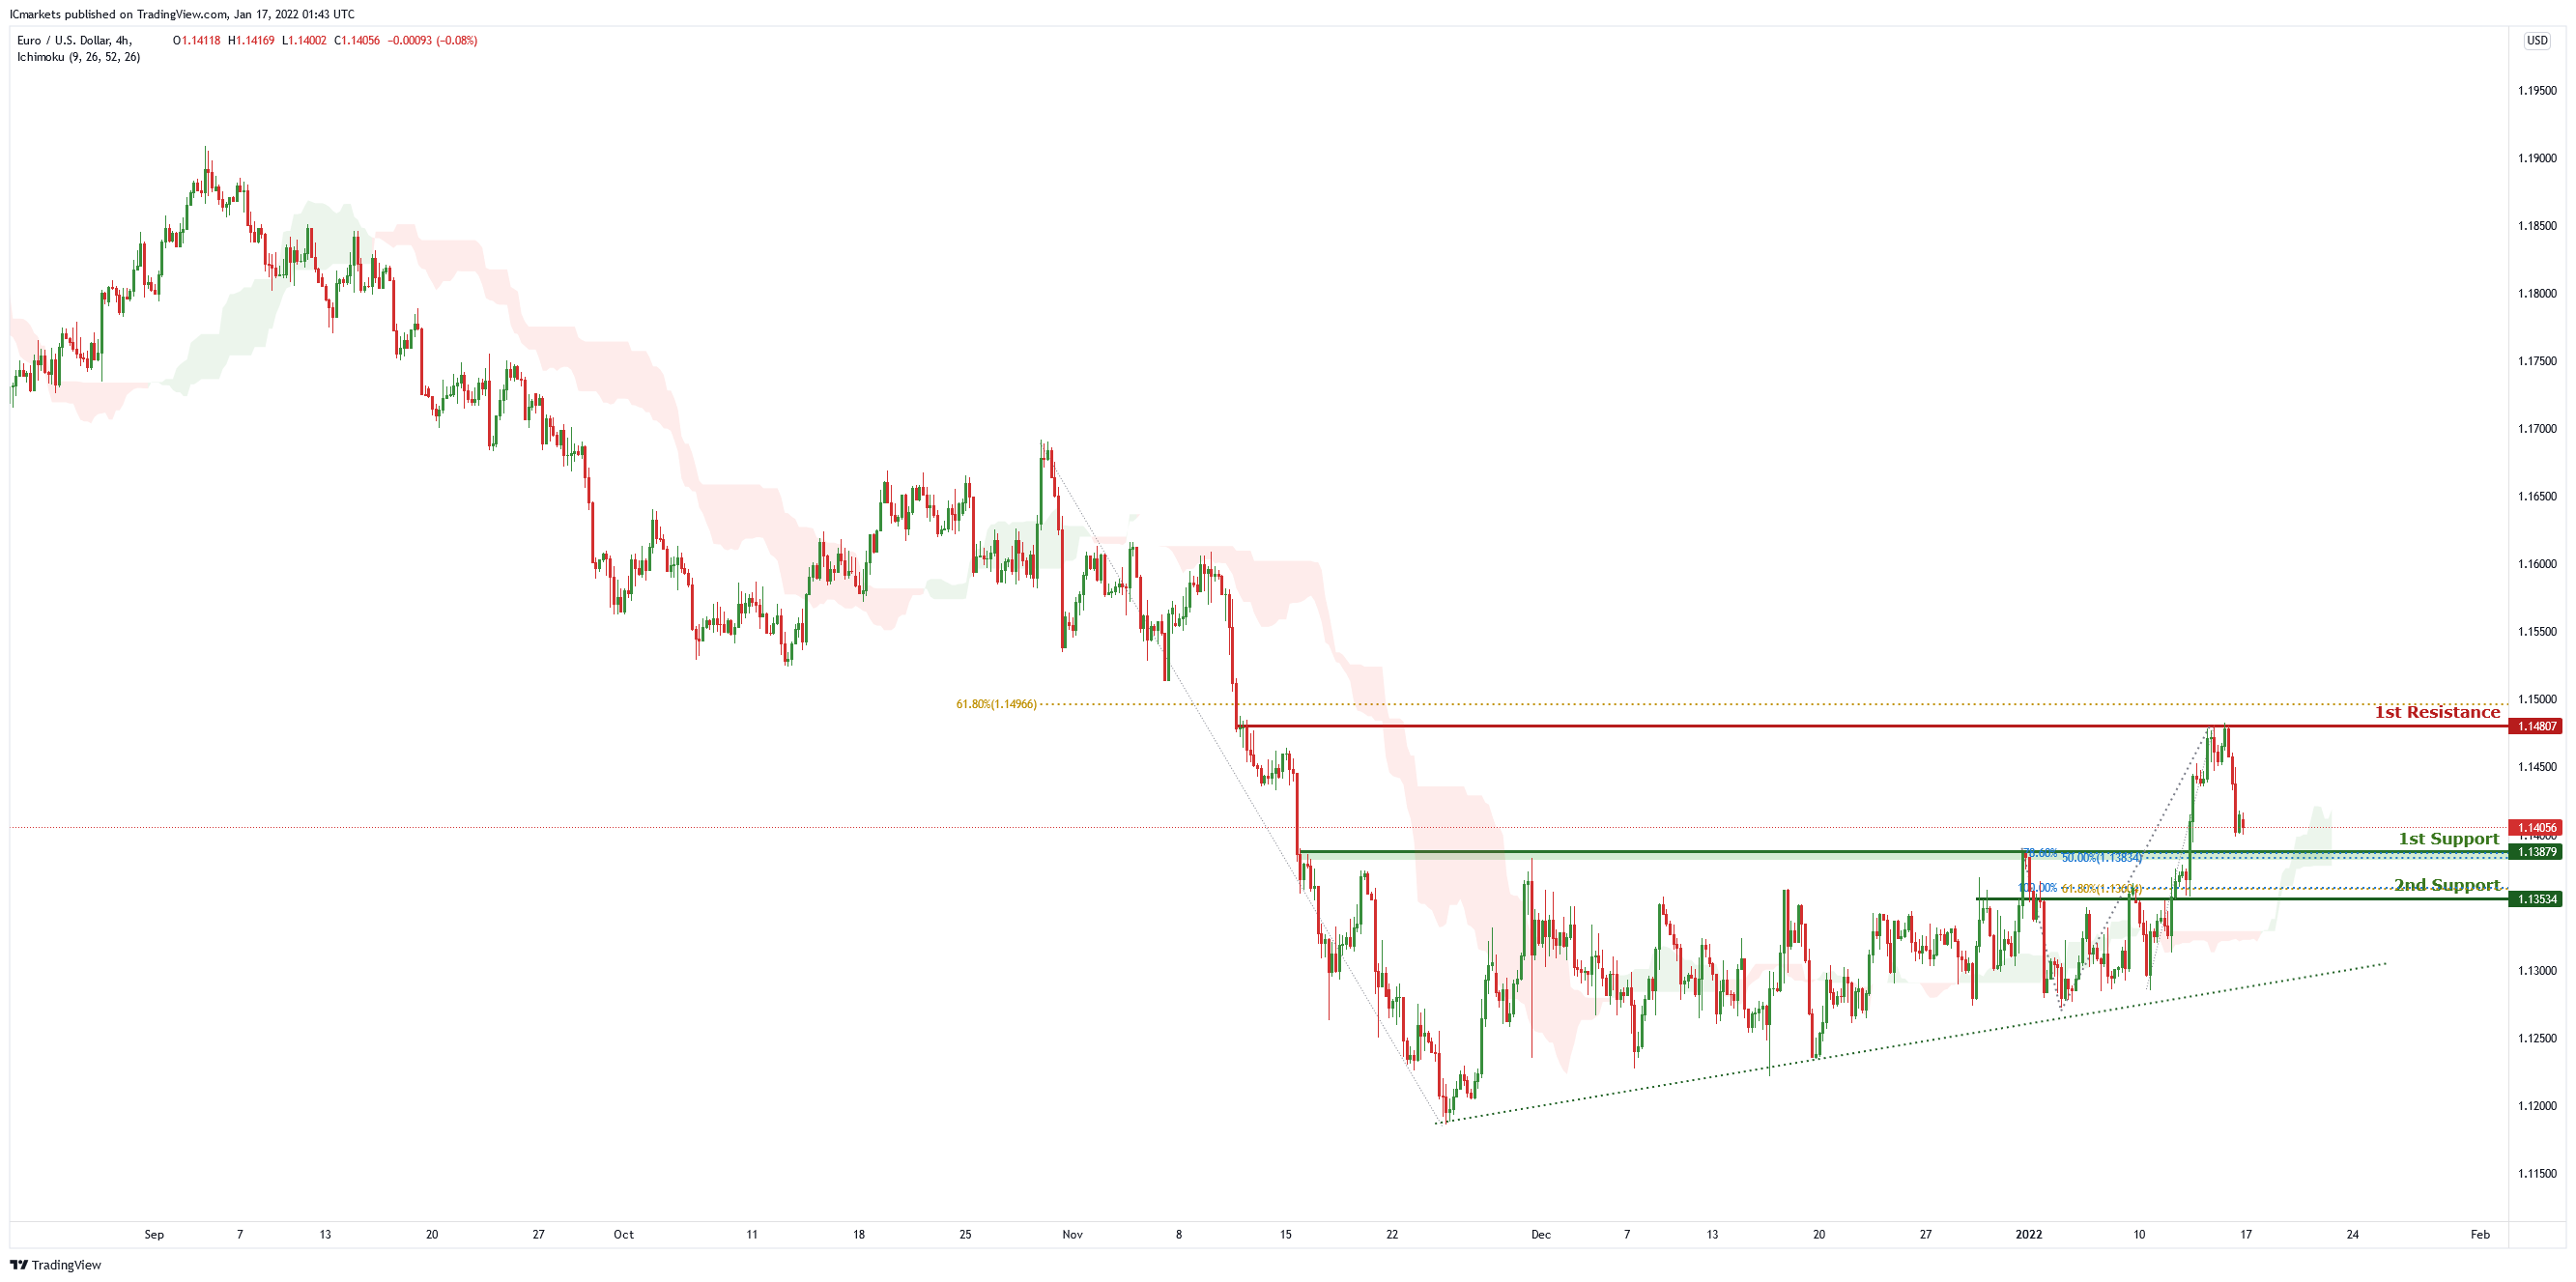
On the H4 chart , price is abiding by an ascending trendline and is near 1st support level of 1.13879 which is also 78.6% Fibonacci projection and 50% Fibonacci retracement. Price can potentially go to the 1st resistance level of 1.14807 which is also 61.8% Fibonacci retracement. Our bullish bias is supported by the ichimoku cloud indicator as price is trading above it.
Areas of consideration:
- H4 1st resistance at 1.14807
- H4 1st support at 1.13879
USD/JPY:
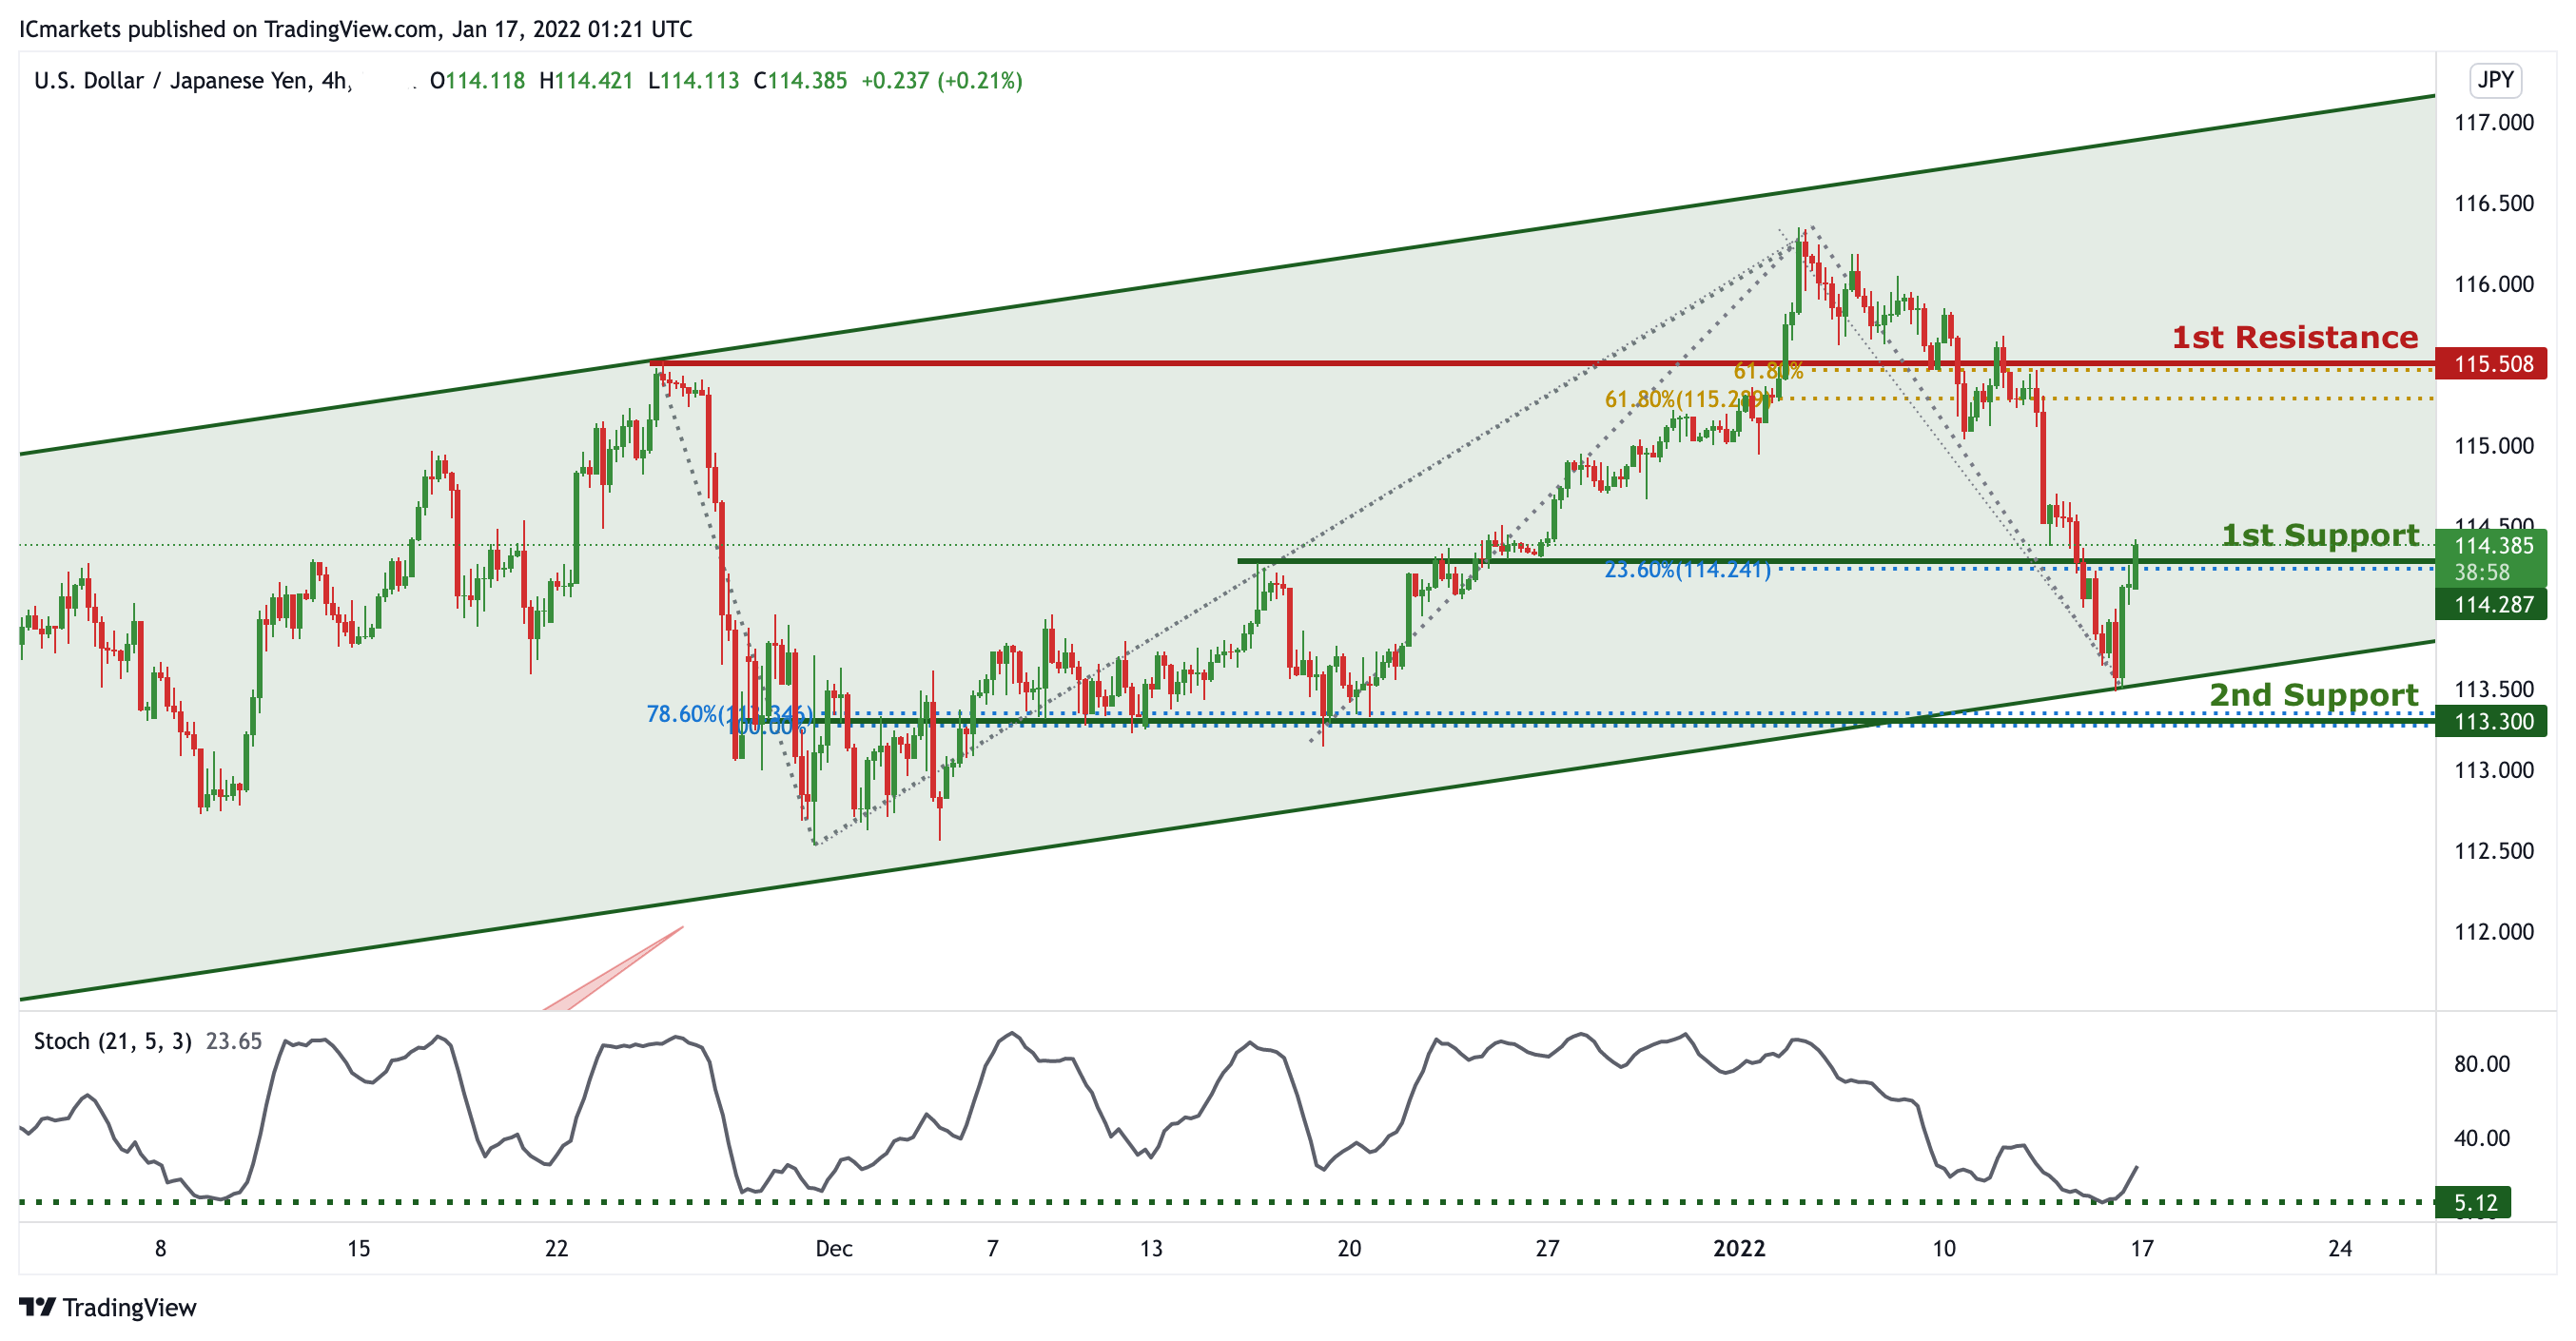
In reference to last week’s analysis, price indeed bounced at previous 1st Support. On the H4 timeframe, is abiding to the ascending channel on the daily, signifying an overall bullish momentum. We can now expect price to push higher from 1st Support in line with 23.6% Fibonacci retracement and graphical overlap support towards 1st Resistance in line with 61.8% Fibonacci projection and 61.8% Fibonacci retracement. Our bullish bias is further supported by the stochastic indicator where the %K line is at the support level.
Areas of consideration:
- H4 1st resistance level 115.508
- H4 1st support level 114.287
AUD/USD:
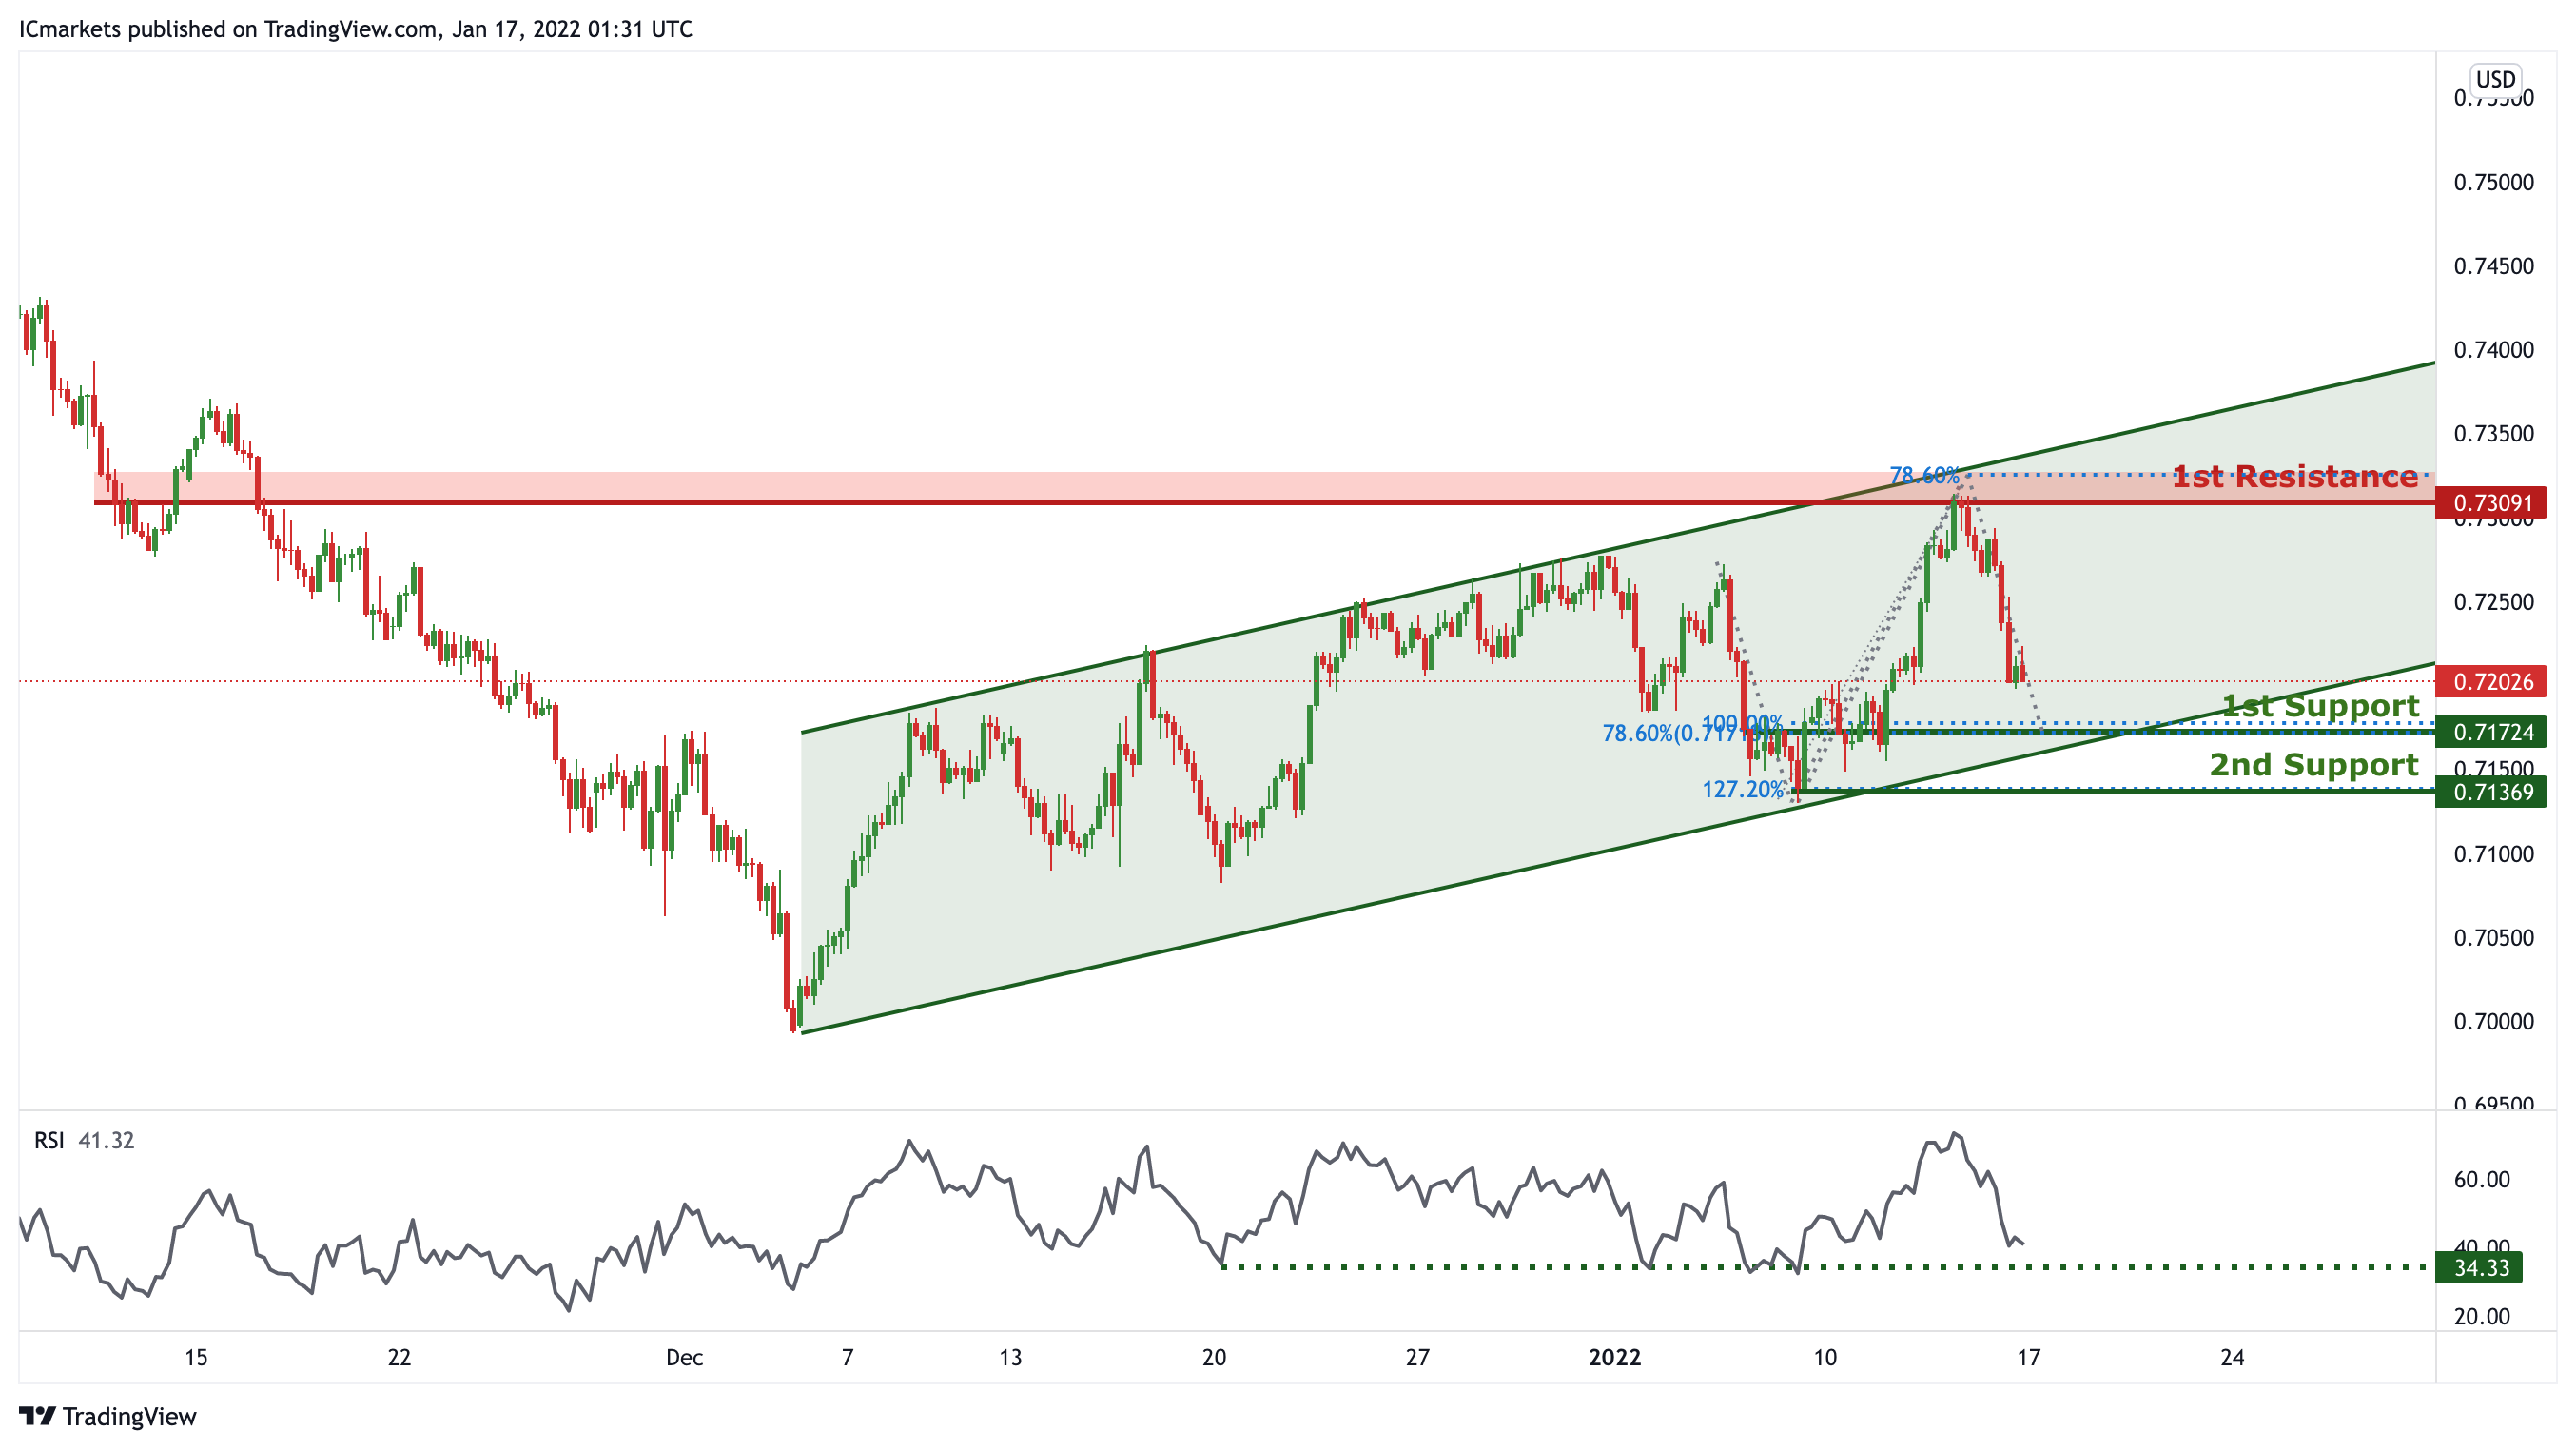
In reference to last week’s analysis, price indeed dropped to 1st Support @ 0.72023. On the H4, price is reacting within the ascending channel, signifying an overall bullish momentum. Price is approaching the 1st Support, we can expect to see price make a bullish bounce from 1st Support in line with 100% Fibonacci projection, 78.6% Fibonacci retracement and ascending channel support towards 1st Resistance in line with previous swing high and 78.6% Fibonacci projection. Our short-term bearish bias is further supported by the RSI indicator where it is approaching the support level.
Areas of consideration:
- H4 1st Support level 0.71724
- H4 1st resistance level 0.73091
NZD/USD:
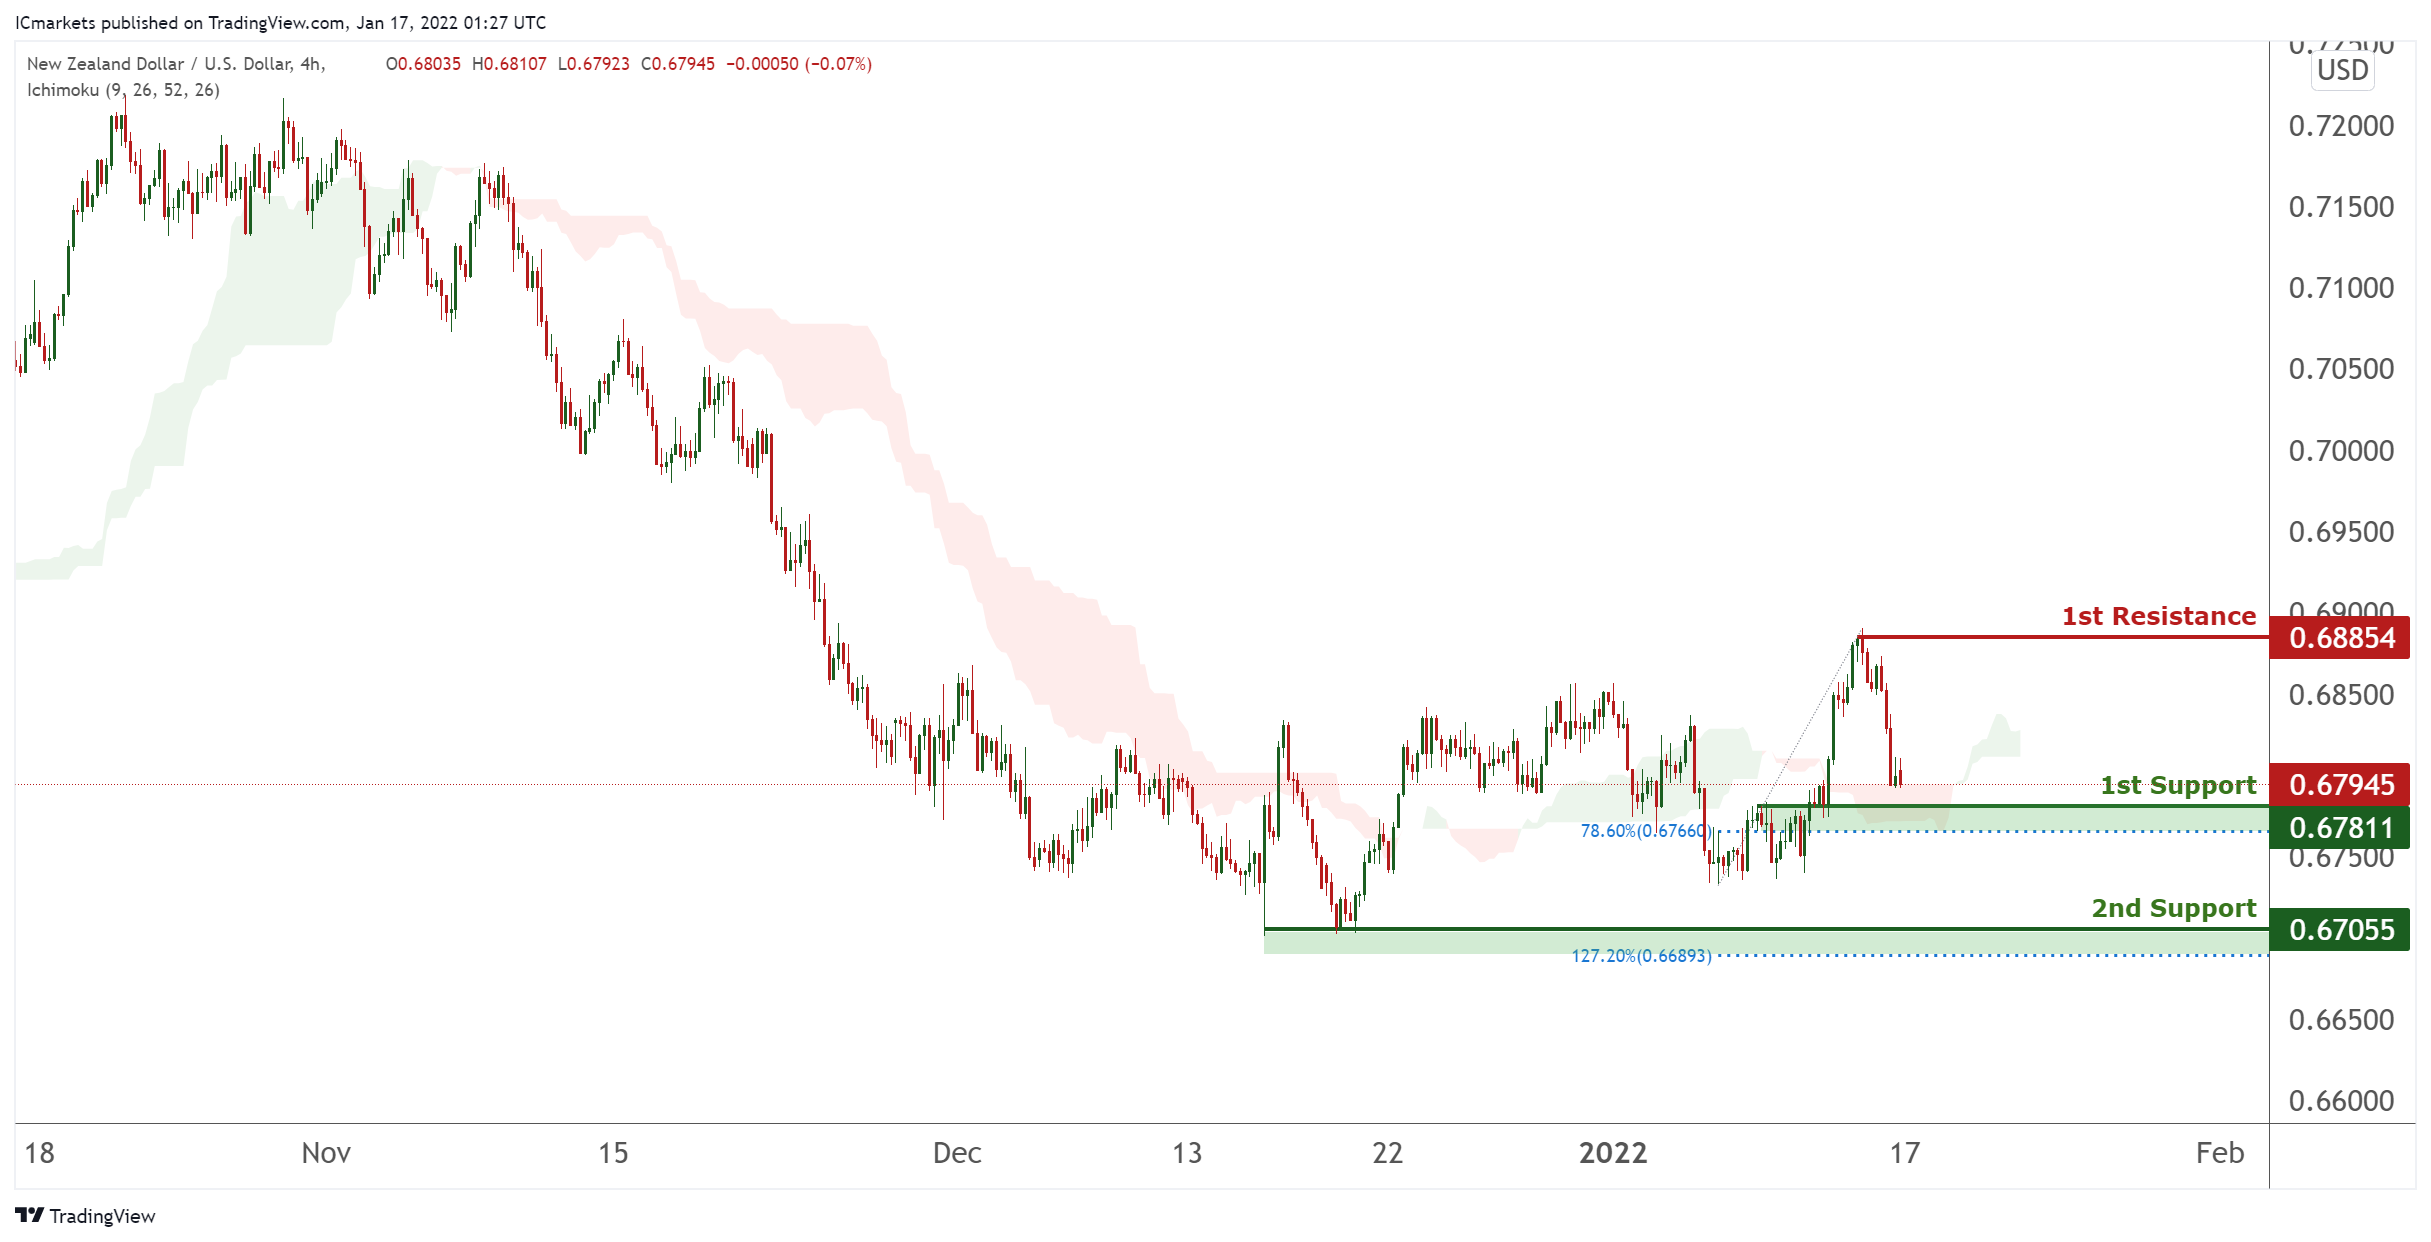
On the H4, with price moving above the ichimoku cloud, we have a bullish bias that price will rise to our 1st resistance at 0.68854 which is in line with horizontal swing high resistance from 1st support at 0.67811, which is in line with horizontal overlap support and 78.6% Fibonacci retracement level. Alternatively, price may break 1st support structure and head for 2nd support at 0.67055, which coincides with horizontal swing low support and 127.2% Fibonacci extension level .
Aras of consideration:
- H4 time frame, 1st resistance at 0.68854
- H4 time frame, 1st support at 0.67811
USD/CAD:
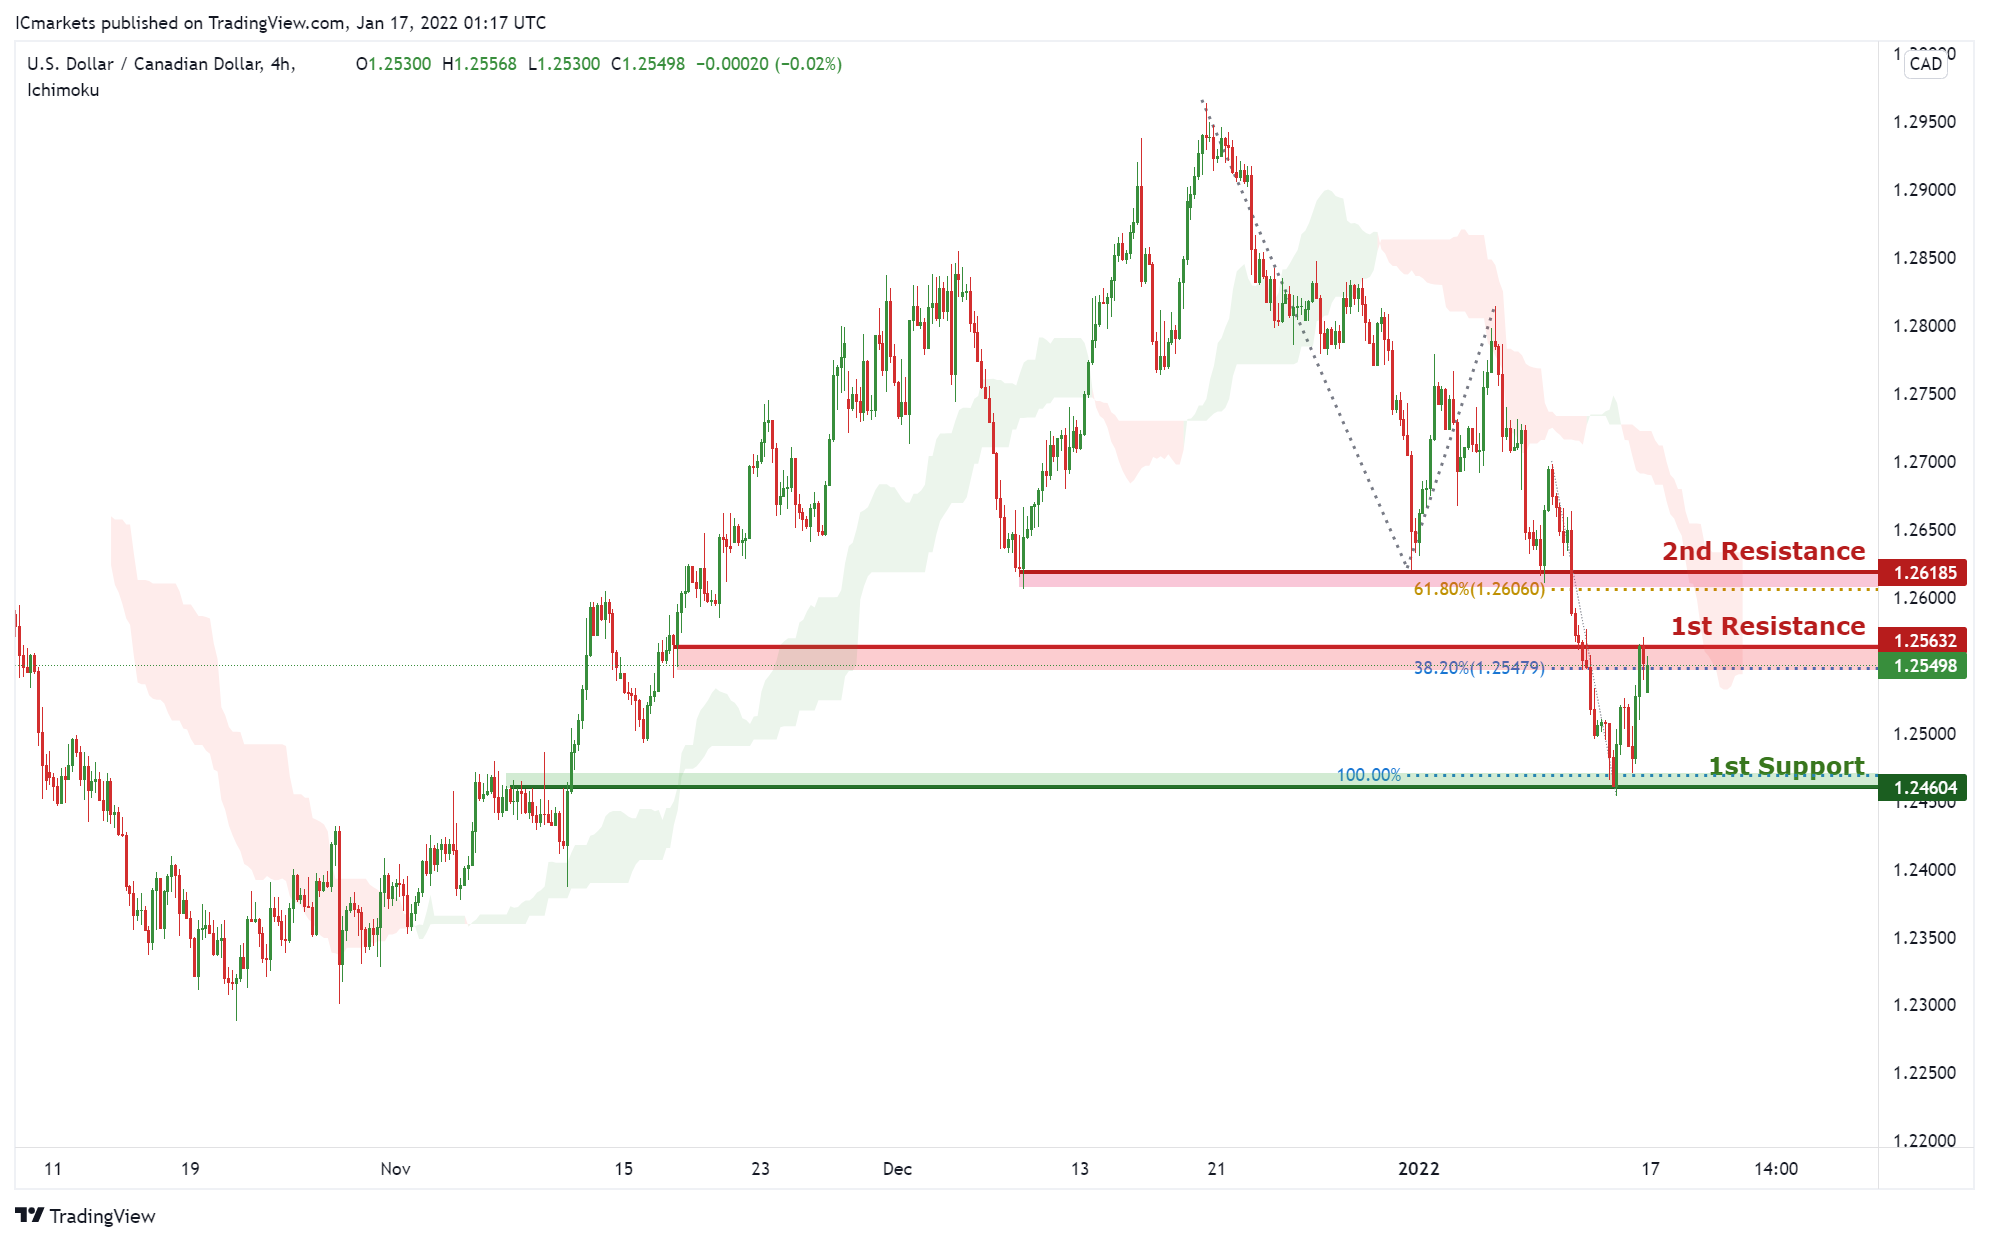
On the H4, with price moving below the ichimoku cloud, we have a bearish bias that price will from from our 1st resistance at 1.25632 which is in line with horizontal overlap resistance and 38.2% Fibonacci retracement to 1st support at 1.24604, which is in line with horizontal overlap support and 100% Fibonacci projection level. Alternatively, price may break 1st resistance structure and head for 2nd resistance at 1.26185, which coincides with horizontal overlap resistance and 61.8% Fibonacci retracement.
Areas of consideration:
- H4 time frame, 1st support at 1.24604
- H4 time frame, 1st resistance at 1.25479
OIL:
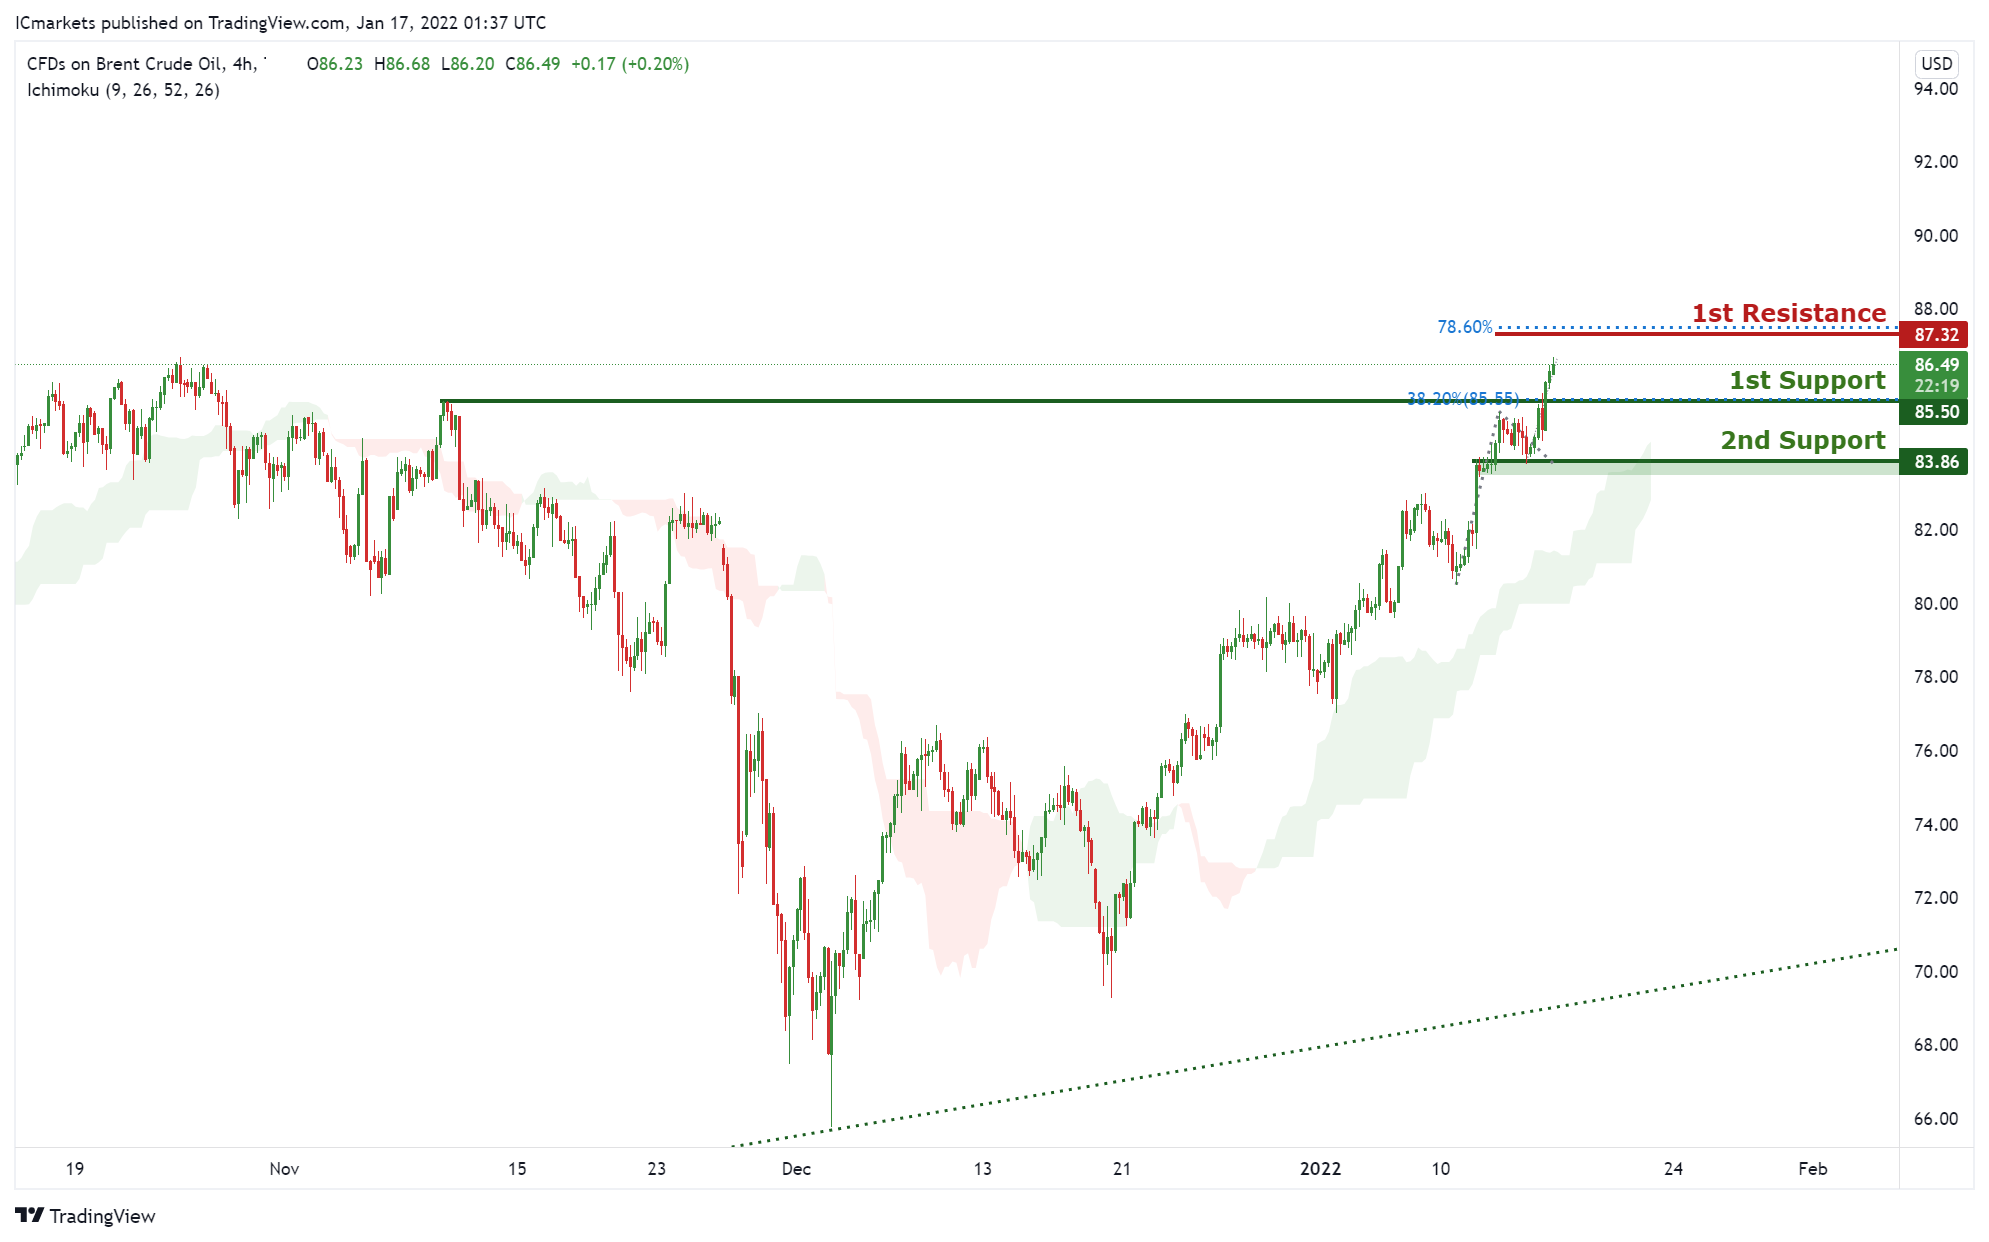
On the H4, with price moving above the ichimoku cloud, we have a bullish bias that price will rise to our 1st resistance at 87.32 which is in line with horizontal swing high resistance and 78.6% Fibonacci projection level from 1st support at 85.5, which is in line with horizontal overlap support and 38.2% Fibonacci retracement level. Alternatively, price may break 1st support structure and head for 2nd support at 83.86, which coincides with horizontal overlap support.
Areas of consideration:
- H4 time frame, 1st resistance of 87.32
- H4 time frame, 1st support of 85.5
Dow Jones Industrial Average:
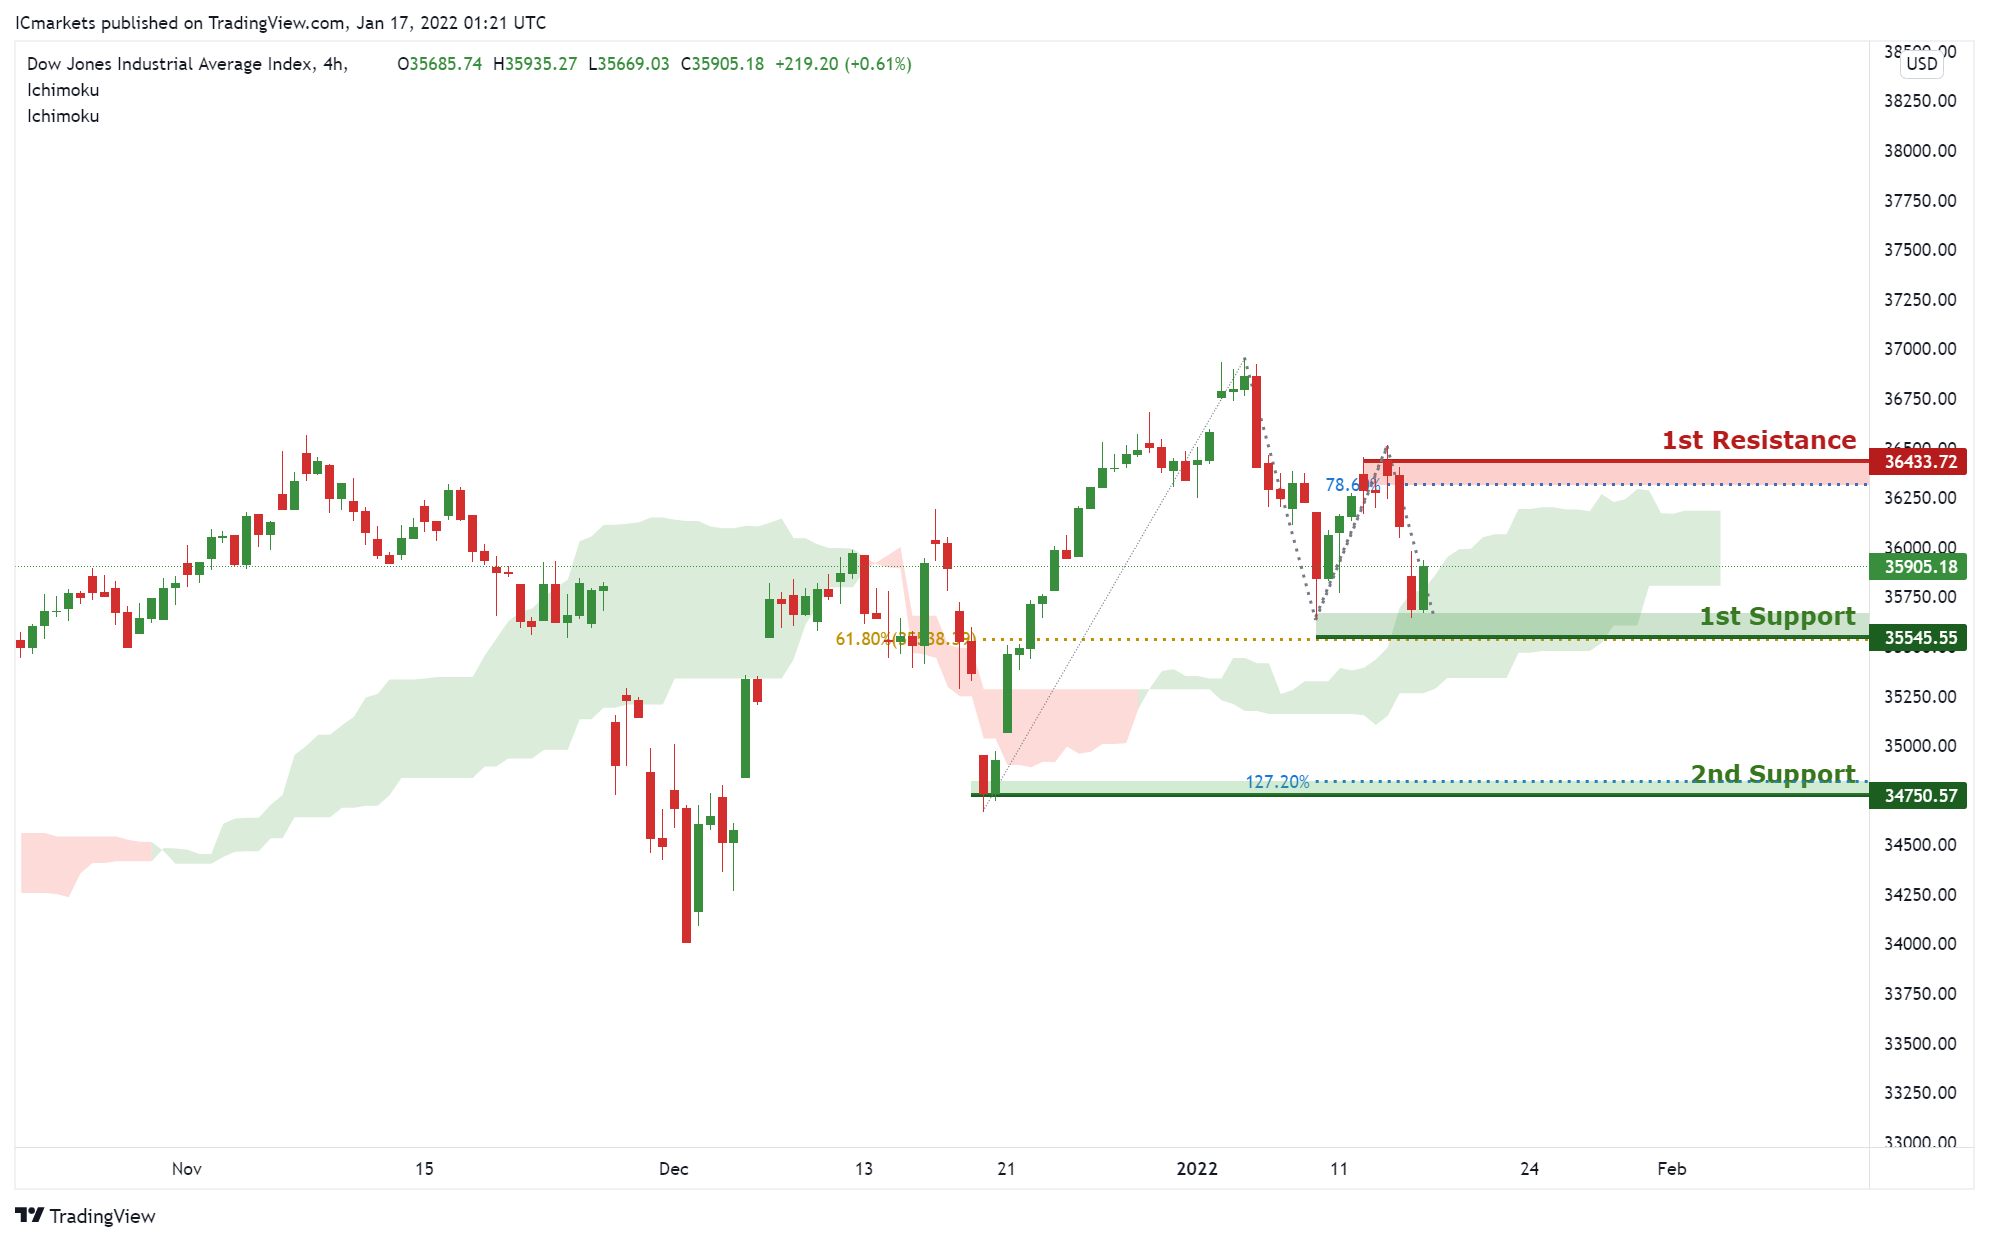
On the H4, with price moving above the ichimoku cloud, we have a bullish bias that price will rise to our 1st resistance at 36433 which is in line with horizontal swing high resistance and 78.6% Fibonacci retracement level from 1st support at 35545, which is in line with horizontal swing low support and 61.8% Fibonacci retracement level. Alternatively, price may break 1st support structure and head for 2nd support at 34750, which coincides with horizontal swing low support and 127.2% Fibonacci extension level.
Areas of consideration:
- H4 time frame, 1st resistance of 36433
- H4 time frame, 1st support of 35545
EUR/USD Corrects Gains, Resistance Turned Support
Key Highlights
- EUR/USD rallied after it broke the 1.1400 resistance zone.
- A major bullish trend line is forming with support near 1.1340 on the 4-hours chart.
- GBP/USD rallied above 1.3700 before it faced sellers.
- USD/JPY found support near 113.60 and corrected higher.
EUR/USD Technical Analysis
This past week, the Euro started a major increase after it cleared the 1.1380 resistance against the US Dollar. EUR/USD rallied above 1.1400 to move into a positive zone.
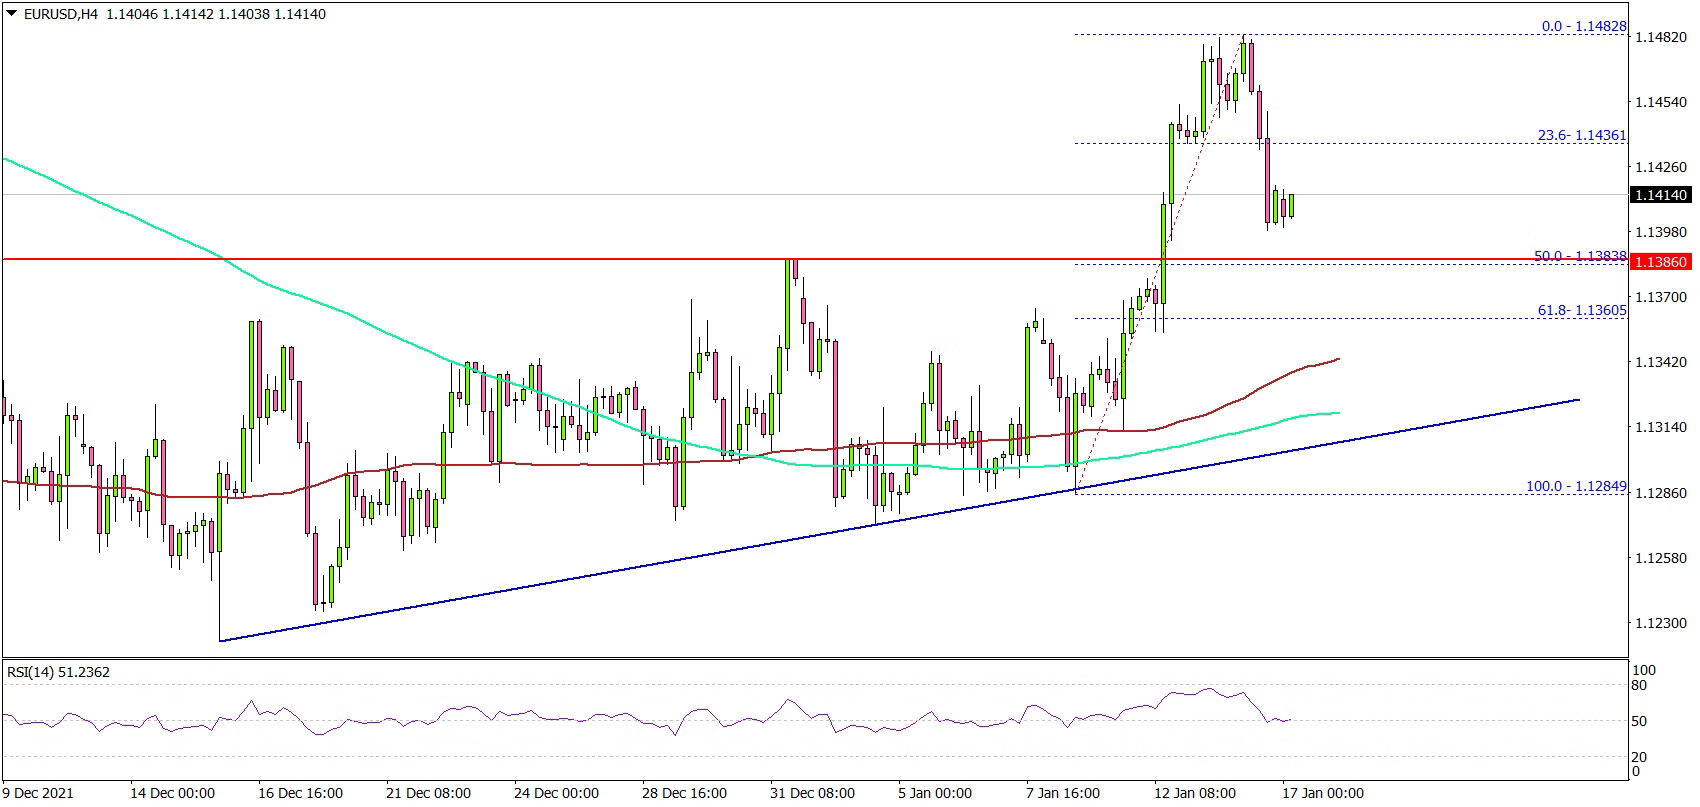
Looking at the 4-hours chart, the pair gained pace above the 1.1420 level. There was a close above the 1.1400 level, the 100 simple moving average (red, 4-hours), and the 200 simple moving average (green, 4-hours).
The pair climbed above the 1.1450 level and traded as high as 1.1482. It is now correcting gains below 1.1450. There was a break below the 23.6% Fib retracement level of the upward move from the 1.1284 low to 1.1482 high.
On the downside, an immediate support is near the 1.1380 (resistance turned support) level. It is close to the 50% Fib retracement level of the upward move from the 1.1284 low to 1.1482 high.
The main support is forming near the 1.1340 level. There is also a major bullish trend line forming with support near 1.1340 on the same chart, below which the pair could drop to 1.1280.
On the upside, the pair is facing resistance near 1.1450 level. The next major resistance is near the 1.1480 level, above which the pair could test 1.1550.
Looking at GBP/USD, there was a strong upward move above the 1.3600 and 1.3650 resistance levels.
Economic Releases
- German Buba Monthly Budget.
Bitcoin staying in sideway consolidation, still defending 40k
Bitcoin is now staying in consolidation above 39636 short term bottom, after quickly defending 40k handle. Considering that it's sitting just above 39559 structural support too, the consolidation could extend for a while. But outlook will stay bearish for another fall to 61.8% projection of 68986 to 41908 from 52101 at 35366 before completing the decline from 68986 high.
The timing of the downside breakout will depend on the eventual reaction to 4 hour 55 EMA (now at 43211) which it's struggling with. A strong break above 4 hour 55 EMA will stronger rebound to 55 day EMA (now at 48230) first, and rejected there to bring down trend resumption. Meanwhile, rejection by the current level could bring downside breakout rather quickly through 396363 to the mentioned 35366 target.
China GDP grew 4.0% yoy in Q4, weak retail sales
China GDP grew 4.0% yoy in Q4, much faster than expectation of 3.3% yoy. On a quarterly basis, GDP grew 1.6% qoq, above expectation of 1.1% qoq. For 2021 as a whole, GDP grew 8.1%, slightly above expectation of 8.1%.
In December, industrial production rose 4.3% yoy, above expectation of 3.6%. Retail sales rose 1.7% yoy, below expectation of 3.7% yoy. Fixed asset investment rose 4.9% ytd yoy, slightly above expectation of 4.8%.
The National Bureau of Statistics said, "we must be aware that the external environment is more complicated and uncertain, and the domestic economy is under the triple pressure of demand contraction, supply shock and weakening expectations."
Also from China, steel production dropped for the first time in six years in 2021, down -3% from 1.065B tonnes to 1.03B tonnes. Birth rate dropped to a record low of 7.52 births per 1000 people in 2021, down from 2020's 8.52 births per 1000 people.
Forex and Cryptocurrency Forecast
EUR/USD: Rumors That Drive the Markets
The weather on the market is quite often determined by rumors which have very little to do with reality. Or nothing at all. But those who spread them can earn good money by speculating on them. Something similar seems to have happened last week.
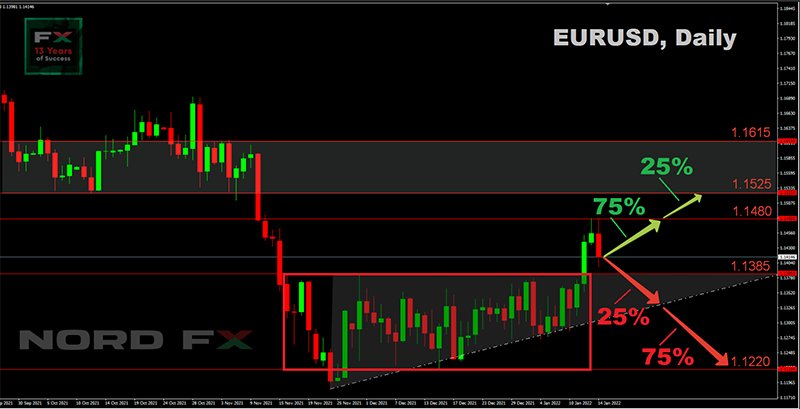
Recall that the EUR/USD pair has been in a sideways trend since November, fluctuating in the range of 1.1220-1.1385. And most analysts voted for the continuation of such a movement a week ago, with a predominance of bearish sentiment. The US Fed's hawkish intentions to end the emergency stimulus program, raise interest rates, and start normalizing the balance sheet were an argument in favor of the dollar's strength.
Note that neither the head of the Fed, Jerome Powell, nor other officials of the American central bank have ever said or even hinted that the rate could be raised four times during 2022. It is unclear where this figure came from, but rumors about such an opportunity began to be actively exaggerated and, as a result, many investors believed in it.
Speaking in the US Congress on Tuesday, January 11, Jerome Powell just repeated what he had already voiced earlier. He said once again that the Fed is going to raise the refinancing rate at least twice this year in order to combat a record inflation in forty years, and that if necessary, it can be raised three times. That is, nothing new was actually said. But the market was waiting for the number "four" and was disappointed because it did not sound.
As a result, the DXY dollar index went into a deep peak, closing below the 50-day moving average, and the EUR/USD pair, instead of moving south, went north.
Thanks to US inflation data, the euro further strengthened its position the next day, on Wednesday, January 12, and the pair EUR/USD, having broken through the border of the medium-term sideways channel, went further up. The breakdown of resistance in the 1.1385 zone served as a trigger for a correction after the strengthening of the dollar that began in May 2021 and the subsequent month-and-a-half sideways trend. The weekly high was reached on the morning of Friday, January 14 at the height of 1.1482.
US retail sales and consumer confidence data released at the end of the week were much worse than previous figures, confirming the negative impact of the Omicron coronavirus strain on the US economy. It is not yet possible to predict exactly how much they will affect the next steps of the Fed. But, judging by the reaction of the market, investors decided that such statistics would push the regulator to take more decisive action. As a result, the EUR/USD pair finished at 1.1415.
Of course, the dollar may retreat a little more in the short term. However, the difference between the hawkish policy of the Fed and the dovish policy of the ECB should still support the USD. Moreover, the head of the Fed once again stressed in recent comments that the fight against inflation is a top priority for the US regulator, and expressed confidence that the US economy will cope with the rate increase.
Also, according to a number of experts, the increase in rates may occur more often than once a quarter, as was the case in the previous cycle of monetary tightening. However, this is just an opinion so far that can give rise to another wave of rumors and expectations. Investors expect to find out what will happen in reality following the results of the January FOMC (Federal Open Market Committee) meeting of the US Federal Reserve on January 26-27.
At the time of writing, 75% of D1 oscillators are green and 25% are giving signals EUR/USD is overbought. Trend indicators have 65% green and 35% red. Among the experts, the majority (75%) does not exclude the growth of the pair in the coming week. However, the weather vane of opinions turns 180 degrees in the forecast for February, and here it is already 75% of analysts who are in favor of the dollar strengthening. Resistances are located at the levels of 1.1450, 1.1480, 1.1525, 1.1570 and 1.1615. Support levels and zones are 1.1385-1.1400, 1.1300, 1.1275, 1.1220. This is followed by the November 24 low of last year at 1.1185 and the 1.1075-1.1100 zone.
As for the economic calendar for the coming week, we can note the release of data on the consumer market of the Eurozone on Monday January 17 and Thursday January 20. The ECB's statement on monetary policy and the issue of statistics on the US labor market are also expected on Thursday. The head of the ECB, Christine Lagarde, is to speak on Friday, January 21.
GBP/USD: Bank of England vs Fed: a Game to Stay Ahead
Naturally, in addition to the meetings of the FRS and the ECB, the meeting of the Bank of England will also take place in January. It should be borne in mind that, unlike its peers, this regulator started attacking rising prices back in December, and this made a strong impression on the market. After inflation in the UK rose to 5.1%, reaching a 10-year peak, the Central bank of the kingdom raised the rate from 0.1% to 0.25% for the first time in three years. The decision was made despite the worsening epidemiological situation due to a new coronavirus strain. And here the opinion of the head of the Bank of England, Andrew Bailey, coincided with that of Jerome Powell: for both, the No. 1 task was to reduce price pressure on the economy and society. But the position of the former looks more hawkish, although the rate increase by 15 basis points is not significant. But the first step has been taken, and the market expects a second rate hike in February.
Such expectations continue to support the British currency, thanks to which the GBP/USD pair was able to update the high of the last eleven weeks, reaching the height of 1.3748. However, it failed to break above the 200-day SMA, and the last chord of the five-day week, after the strengthening of the dollar in the second half of Friday, January 14, sounded at 1.3678.
According to 60% of analysts, the GBP/USD pair may make another attempt to rise above the 1.3800 horizon in the coming days. This scenario is supported by 90% of trend indicators on D1 and 80% of oscillators. The remaining 20% signal that the pair is overbought. However, as in the case of EUR/USD, the scales tilt in favor of the bears, when moving from a weekly to a monthly forecast, and here it is already 55% that are waiting for the pair to move down.
Supports are located at 1.3659, 1.3600, 1.3525, 1.3480, 1.3430, 1.3375, the next strong support is 100 points lower. The resistance levels are 1.3700, 1.3750, 1.3835 and 1.3900.
Important macro data from the UK will suffice next week. There will be data on unemployment and the average wages in the country on Tuesday, January 18. Then, the consumer price index will be known the next day. In addition, the Governor of the Bank of England, Andrew Bailey, will speak on Wednesday, January 19, and retail sales for December 2021 will be published on Friday, January 19. This is an important indicator of consumer spending, which also correlates with consumer confidence and is considered as an indicator of the UK economy development pace. According to forecasts, it is expected to fall from 1.4% to minus 0.6%.
USD/JPY: The Yen Strength Is the Weak Dollar
USD/JPY dropped from 116.35 high (high since January 2017) to 113.47 last week on the back of Jerome Powell's speech and lower US Treasury yields. However, the ultra-dove position of the Japanese regulator is unlikely to further strengthen the yen. The dollar seems to be gaining strength again, and the pair went up again at the end of the weekly session, rising to the level of 114.18.
With USD/JPY moving south for the last week and a half, most of the indicators on D1 turned red. Among the oscillators, these are 80% of them, 10% give signals of the pair being oversold, and 10% have already changed their color to green. Among trend indicators, 60% recommend selling, 40% recommend buying. Among experts, 50% vote for the growth of the pair, 40% for its fall, and 10% have taken a neutral position.
Support levels are 113.50, 113.20, 112.55 and 112.70. The nearest resistance zone is 114.40-114.65, then there are levels 115.00, 115.45, 116.00 and 116.35.
The decision of the Bank of Japan on the key interest rate will be announced on Tuesday, January 18. And it will highly likely remain at the same negative level as before, minus 0.1%. As we wrote earlier, according to this regulator, the country does not need a strong currency, and a weak yen is more likely to help the country's economy, as it supports exports and corporate profits.
CRYPTOCURRENCIES: And Here Too, Thank You Jerome Powell
Satoshi Nakamoto launched the bitcoin mainnet by mining the genesis block with 50 BTC in January 2009. Only some 13 years have passed since then, and The National Development and Reform Commission of China declares crypto mining "obsolete" in January 2022. It follows from the official statement of this top economic planning body that preference will now be given to cleaner and less resource-intensive industries, and mining is on the list of "obsolete" technologies that will be banned from investment and must be eliminated.
William Shakespeare was right; nothing lasts forever under the moon. And after digital currencies were declared "persona non grata" in China, the center of influence on the crypto market shifted completely to the United States. Another proof of this was last week, when a few words from Fed Chairman Jerome Powell were enough to stop the fall of bitcoin and turn the trend of the crypto market upwards.
Speaking at the US Senate Banking Committee, Powell said that stablecoins can be used with the Central Bank official digital currencies CBDC (Central Bank Digital Currency is fiat money in digital form, which are issued and provided by the Central Bank). But this is not what allowed crypto quotes to move north, but the general weakening of the dollar and the return of investors' risk appetites.
As mentioned above, Jerome Powell made it clear that the Federal Reserve has not yet decided to reduce its balance sheet by almost $9 trillion, and that there will be no four rate hikes in 2022, but no more than three. As a result, the DXY dollar index went down, while stock indices and cryptocurrency quotes went up.
BTC/USD dropped to $39,660 on January 10. It has not fallen this low since September 2021. However, then, following the growth of the S&P500, Dow Jones and Nasdaq, it rose to $44,300 on January 12, and the total capitalization of the crypto market exceeded the psychologically important level of $2 trillion once again, reaching $2.091 trillion. But the Crypto Fear & Greed Index did not get out of the Extreme Fear zone, although it rose from 15 to 21 points.
It is clear that it is too early to talk about the beginning of a new rally in the crypto market. The BTC/USD pair is 35% below its all-time high, and the total capitalization is still very far from the almost $3 trillion that it reached on November 10, 2021. And, if the dollar starts to gain strength again, we can expect digital assets to return to a downward trend.
Of course, crypto enthusiasts predict as usual that top coins will soon rise to new heights. Changpeng Zhao, CEO of the Binance crypto exchange, claims in an article for Fortune that global adoption of cryptocurrencies will jump from the current 5% to 20% in 2022. And Galaxy Digital founder Mike Novogratz sees the 35% drop as just a "healthy pullback." In his opinion, the main cryptocurrency will find support around $38,000-40,000, after which it will return to growth. Nigel Green, CEO of consulting company DeVere Group, also states that now is the most convenient time to buy bitcoin in the current cycle.
However, some experts consider such sentiments to be too optimistic. Thus, the ENCRY Foundation predicts that bitcoin may return to growth only after its price drops to $28,000-30,000. "The flows of liquidity to the markets will decrease in the second half of 2022, after the completion of the asset repurchase program in the United States. Then bitcoin may fall to $30,000," the company's specialists explain.
The current levels cannot yet be described as a market bottom. This is indicated by another expert, Viktor Pershikov, a leading analyst at 8848 Invest. According to him, conditions that have not yet been observed must be fulfilled for the formation of the bottom. This is a long flat (at least two months in the current circumstances) with the accumulation of long positions and an increase in open interest, a decrease in BTC sales by market participants as well as clarification of the speed and degree of tightening of monetary policy by world central banks.
"The current state of the crypto market is characterized by emotional selling to a large extent, including at a loss, which is typical for situations when retail participants are shaken out of the market. The current decline does not pose a threat for large BTC holders and is a normal market correction before further growth," Pershikov says. In his opinion, bitcoin will spend most of the year in the price range of $30,000-70,000.
It is clear that a serious growth of BTC is possible only with the same growth of interest in it from institutional investors. But they seem to be a problem for now. According to Bloomberg, only 5% of customers surveyed by JPMorgan believe that the bitcoin price will reach $100,000 by the end of 2022. More than 40% believe that it will only return to the $60,000 level. According to bank strategist Nikolaos Panigirtzoglou, the fair value of the cryptocurrency ranges from $35,000 to $73,000.
As for bitcoin's main competitor, ethereum, crypto analyst Justin Bennett believes that "as long as ETH is below $4,000, you need to be careful" against the backdrop of a downtrend in the entire market. If only ETH returns to this area in the coming weeks and months and can gain a foothold there, then we can talk about the continuation of the strong bullish trend observed in 2021."
The analyst also looks at ETH against BTC and believes that the ETH/BTC pair could start a long-term rally to 0.18 BTC ($7.388) for 1 ETH, but this would require holding the 0.075 BTC ($3.077) level as support.
All of the above shows that the situation is currently ambiguous. And then how do you make money on virtual currencies? The answer to this question is given in our humorous crypto life hacks column by San Francisco (USA) resident Siraj Raval, who uses his 2018 Tesla Model 3 car for ethereum mining. To do this, he launched the corresponding free software on the Apple Mac mini M1, connecting it to the car's center console. Five graphics cards are powered by the Tesla battery. According to Raval, he mined for about 20 hours a day this way and earned from $400 to $800 a month during 2021.
The numbers do look attractive. It only remains to find about $50,000 to buy such a car and find out if the Chinese authorities will not consider this method of mining harmful and obsolete.
EUR/USD Weekly Outlook
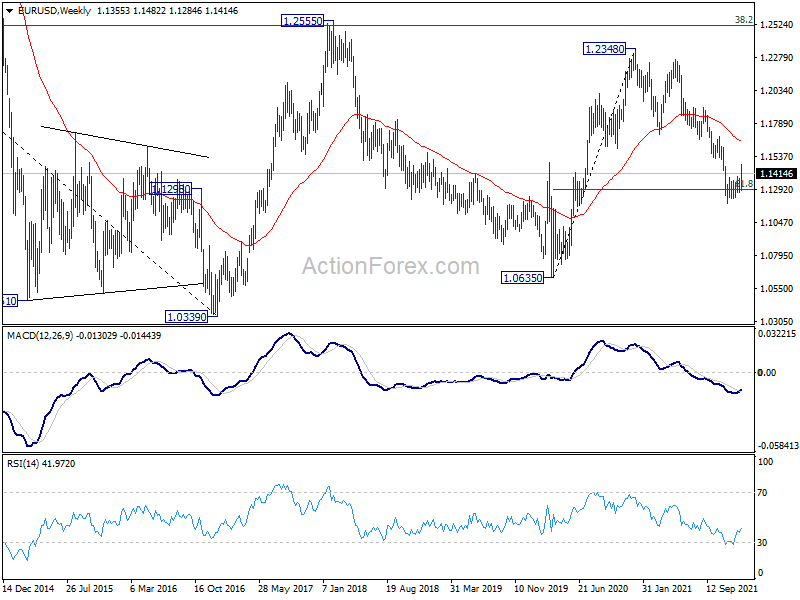
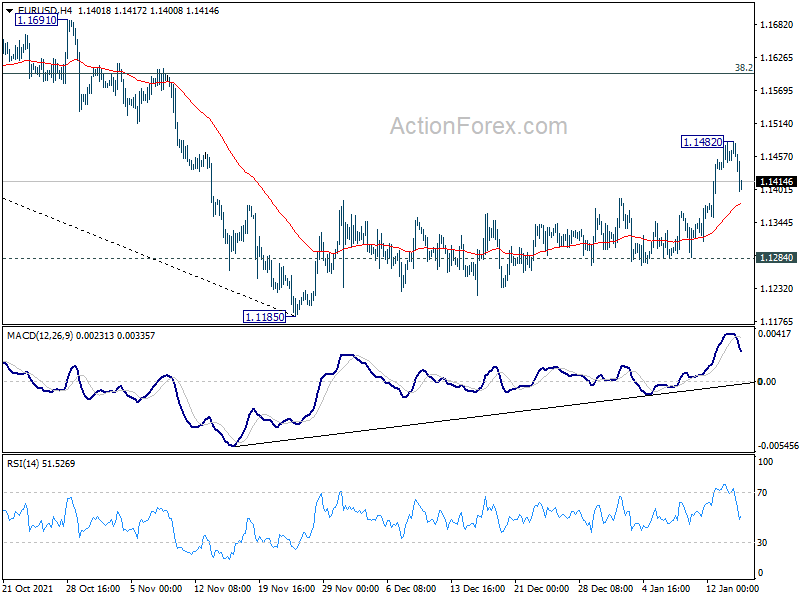
EUR/USD finally resumed the rebound from 1.1185 last week and hit as high as 1.1482. But as temporary top was formed with subsequent retreat, initial bias is neutral this week first. rebound from 1.1185 is seen as a corrective move, hence, in case of another rally, upside should be limited by 38.2% retracement of 1.2265 to 1.1185 at 1.1598. On the downside, below 1.1284 support will bring retest of 1.1185 low. However, sustained break of 1.1598 will argue that the trend is reversing already.
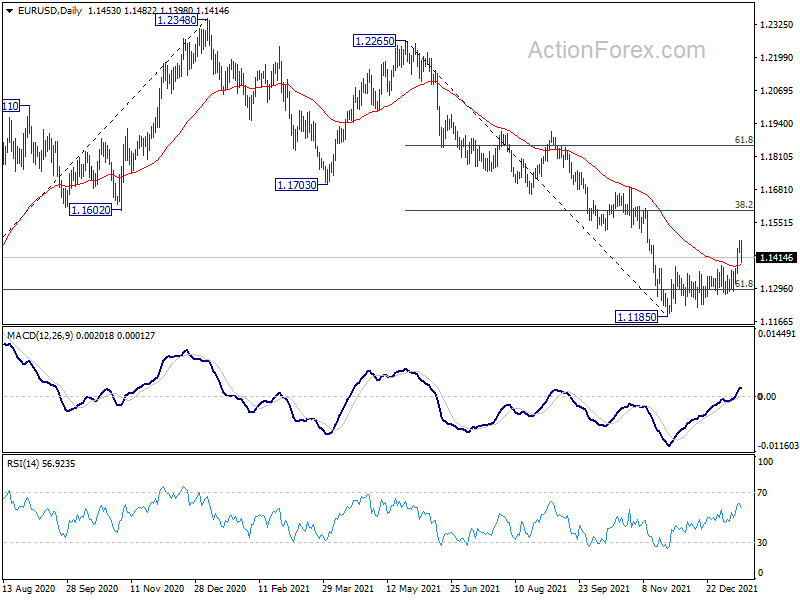
In the bigger picture, there are various ways of interpreting the fall from 1.2348 (2021 high). It could be a correction to rise from 1.0635 (2020 low), the fourth leg of a sideway pattern from 1.0339 (2017 low), or resuming long term down trend. In any case, outlook will now stay bearish as long as 1.1703 support turned resistance holds. Sustained break of 61.8% retracement of 1.0635 to 1.2348 at 1.1289 would pave the way back to 1.0635.
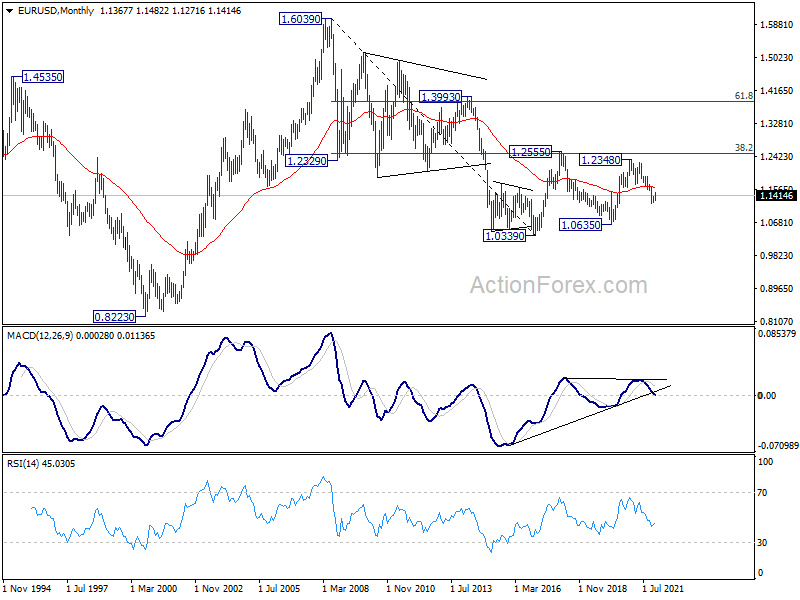
In the long term picture, EUR/USD has possibly failed 1.2555 cluster resistance (38.2% retracement of 1.6039 to 1.0339 at 1.2516) again. Long term outlook will remain neutral as sideway pattern from 1.0339 (2017 low) is extending with another medium term fall. For now, we'd hold back from assessing the chance of downside breakout, and monitor the momentum of the decline from 1.2348 first.