

Sample Category Title
NASDAQ staged strong rebound after initial dive
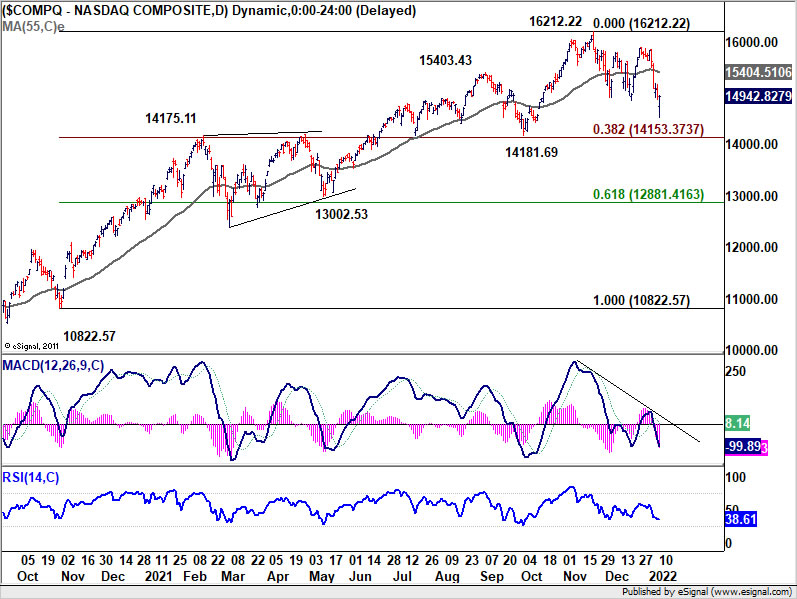
NASDAQ initially dived sharply to as low as 14530.22 overnight, but staged a strong rebound to close up 0.05% at 14942.82. Technically, we're seeing NASDAQ as in correction to the move from 10822.57 to 16212.22. It's envisaged as a range pattern that could last for a while.
Nevertheless, 14100/14200 zone should provide enough support to floor any decline attempt. We're talking about a cluster of support levels there, including 14175.11 resistance turned support, 14181.69 support, and 38.2% retracement of 10822.57 to 16212.22 at 14153.37.
However, it should be noted that a firm break of 14181.69 structural level, which is unlikely, would indicate that NASDAQ could be in a larger scale correction.
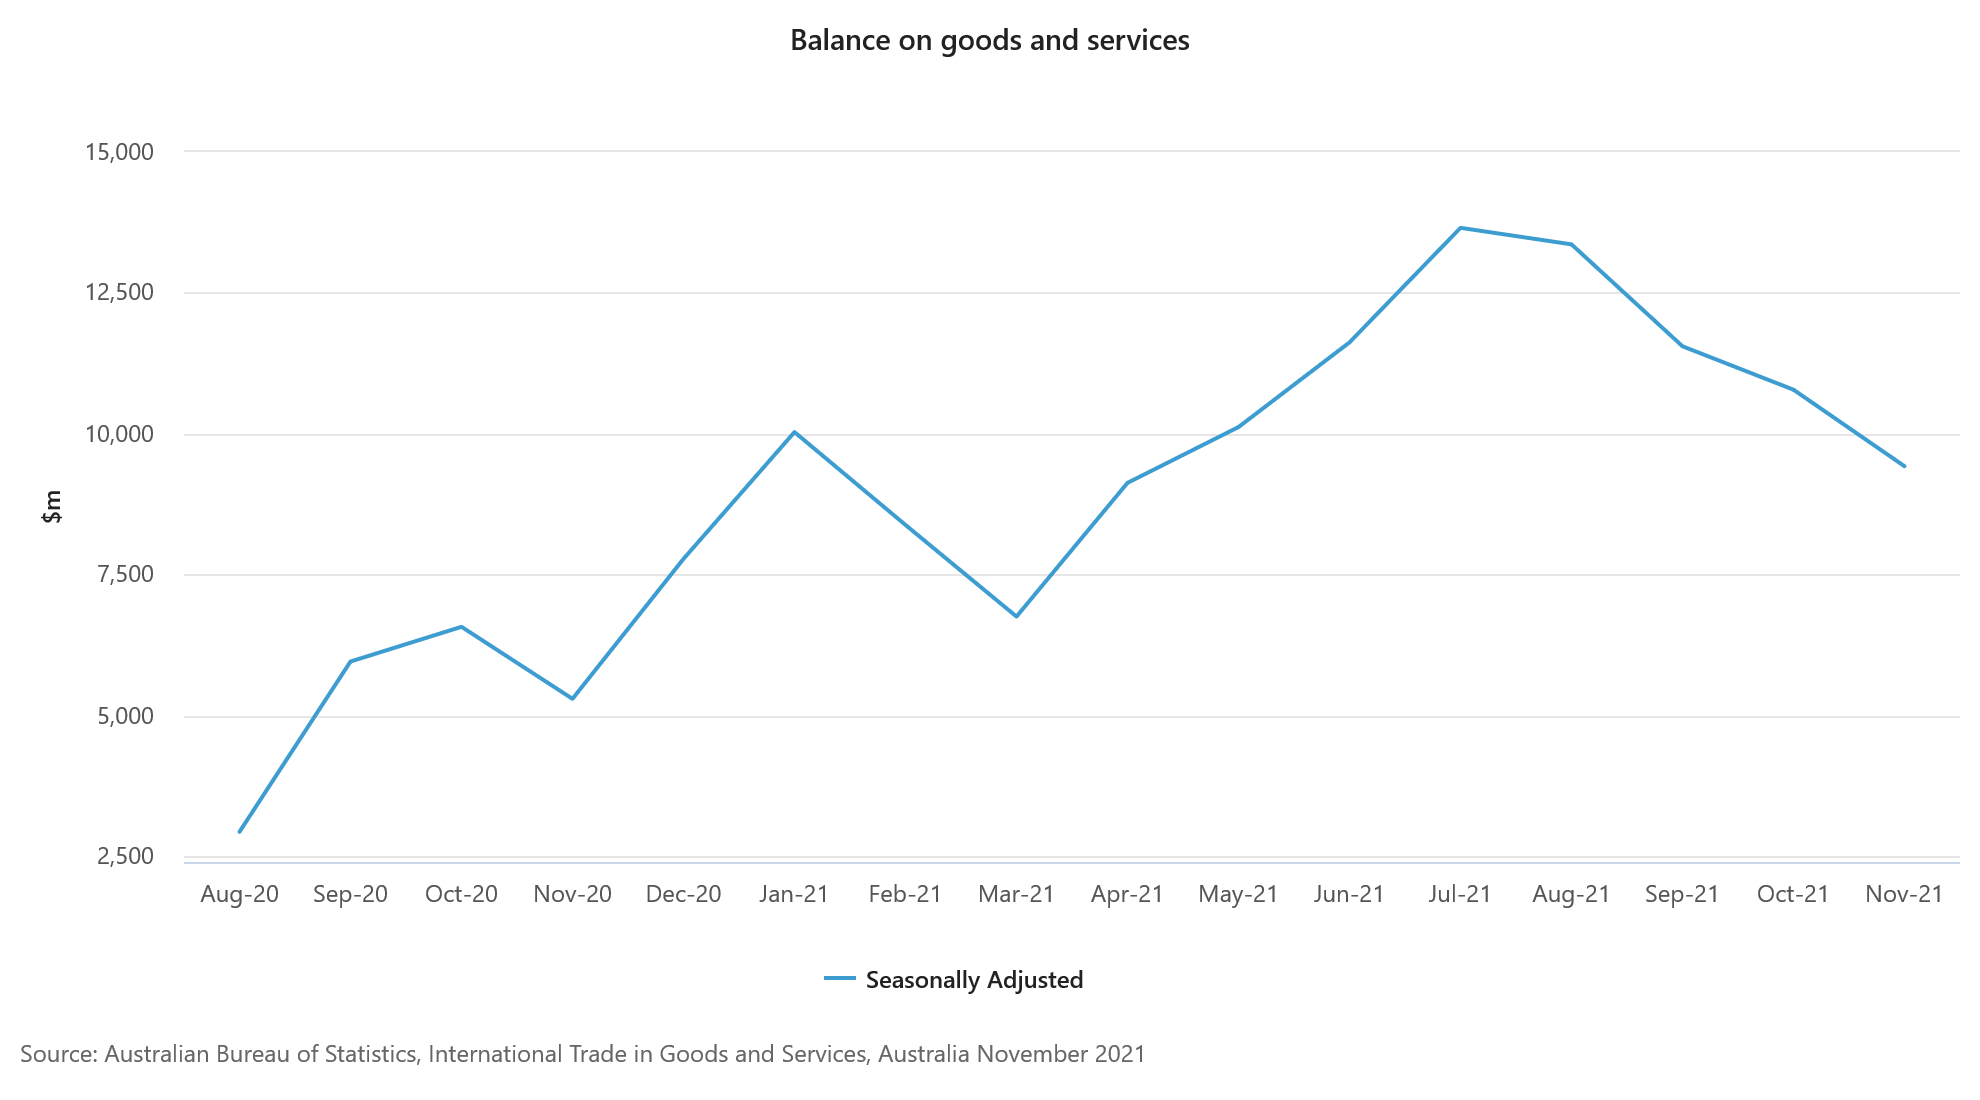
Australia exports rose 2% in Nov, imports rose 6%
Australia goods and services exports rose 2% mom or AUD 691m to AUD 43.86B in November. Goods and services imports rose 6% mom or AUD 2049m to AUD 34.44B. Trade surplus came in at 9.42B, below expectation of AUD 10.75B.
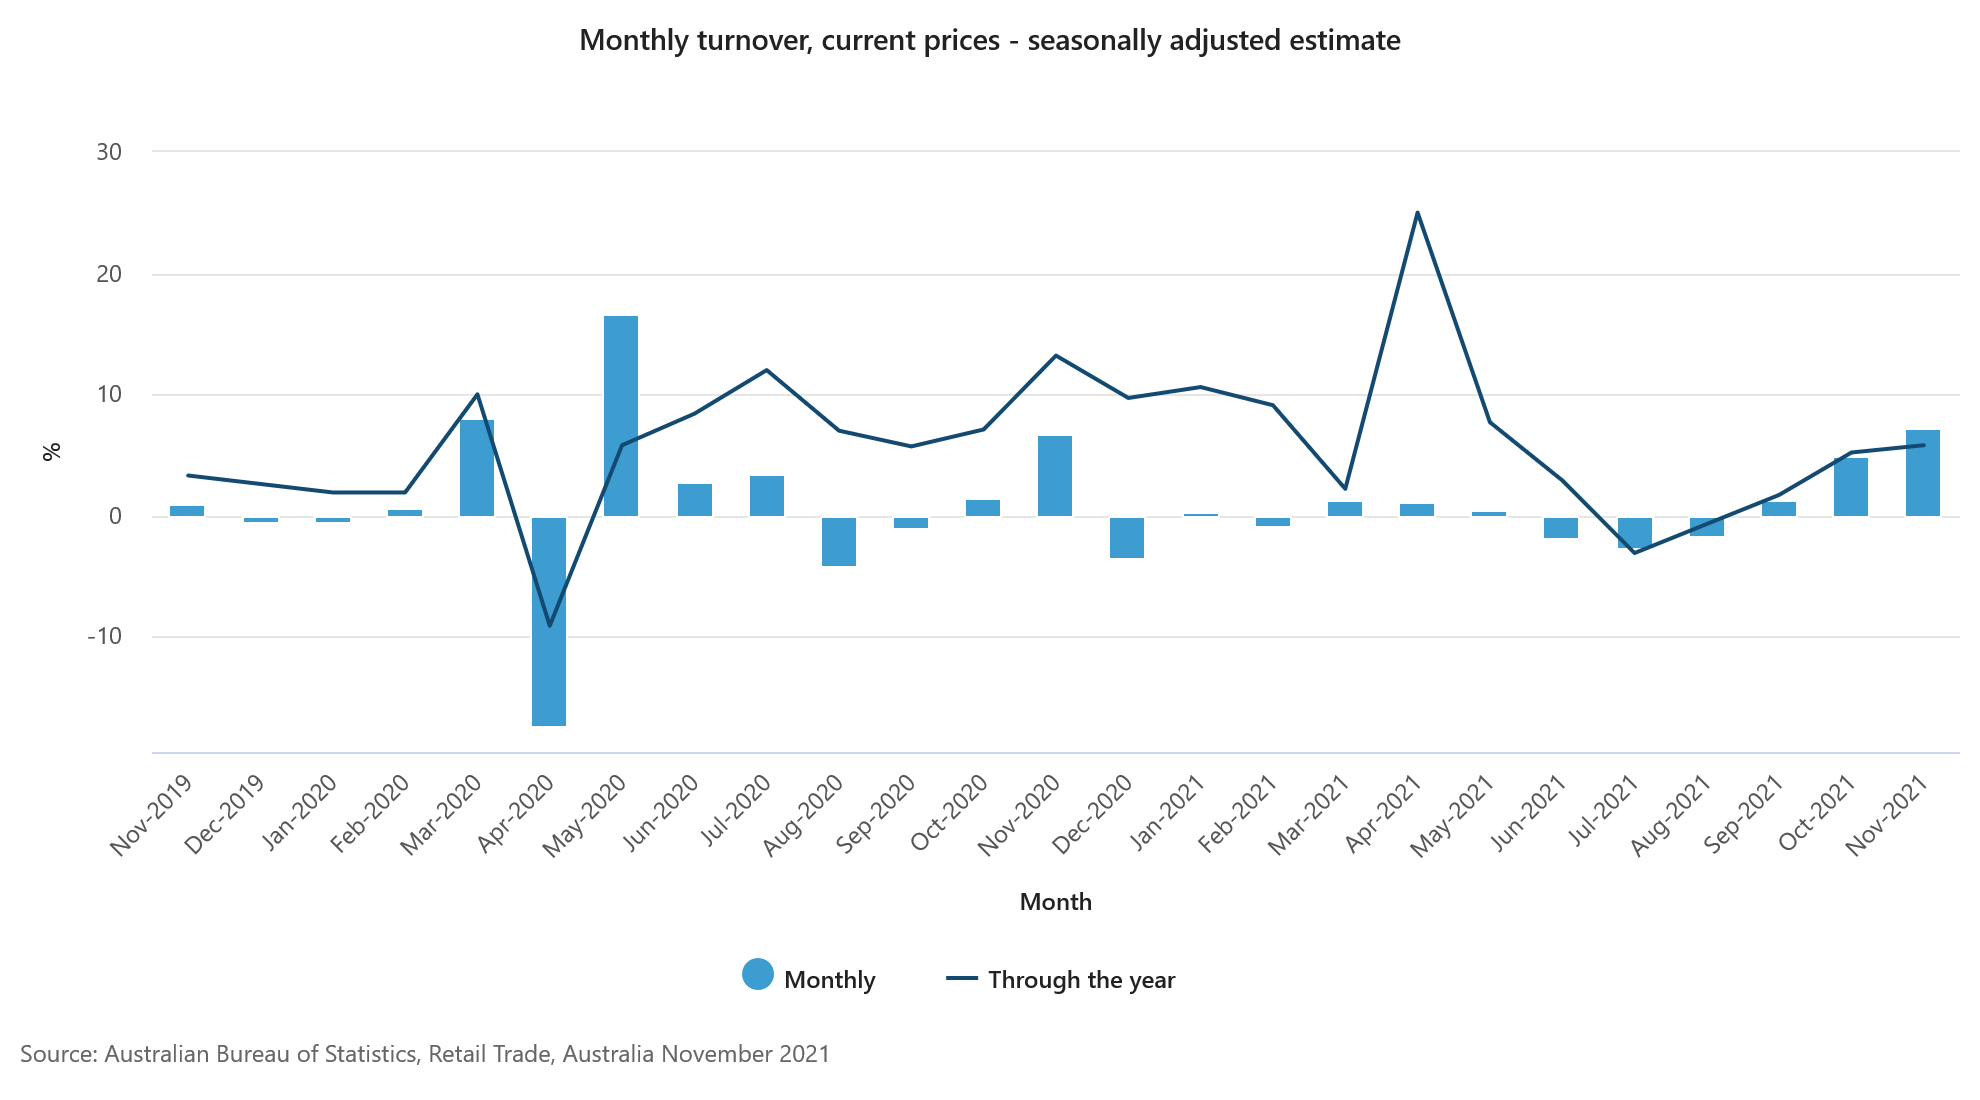
Australia retail sales rose 7.3% mom in Nov as restrictions eased
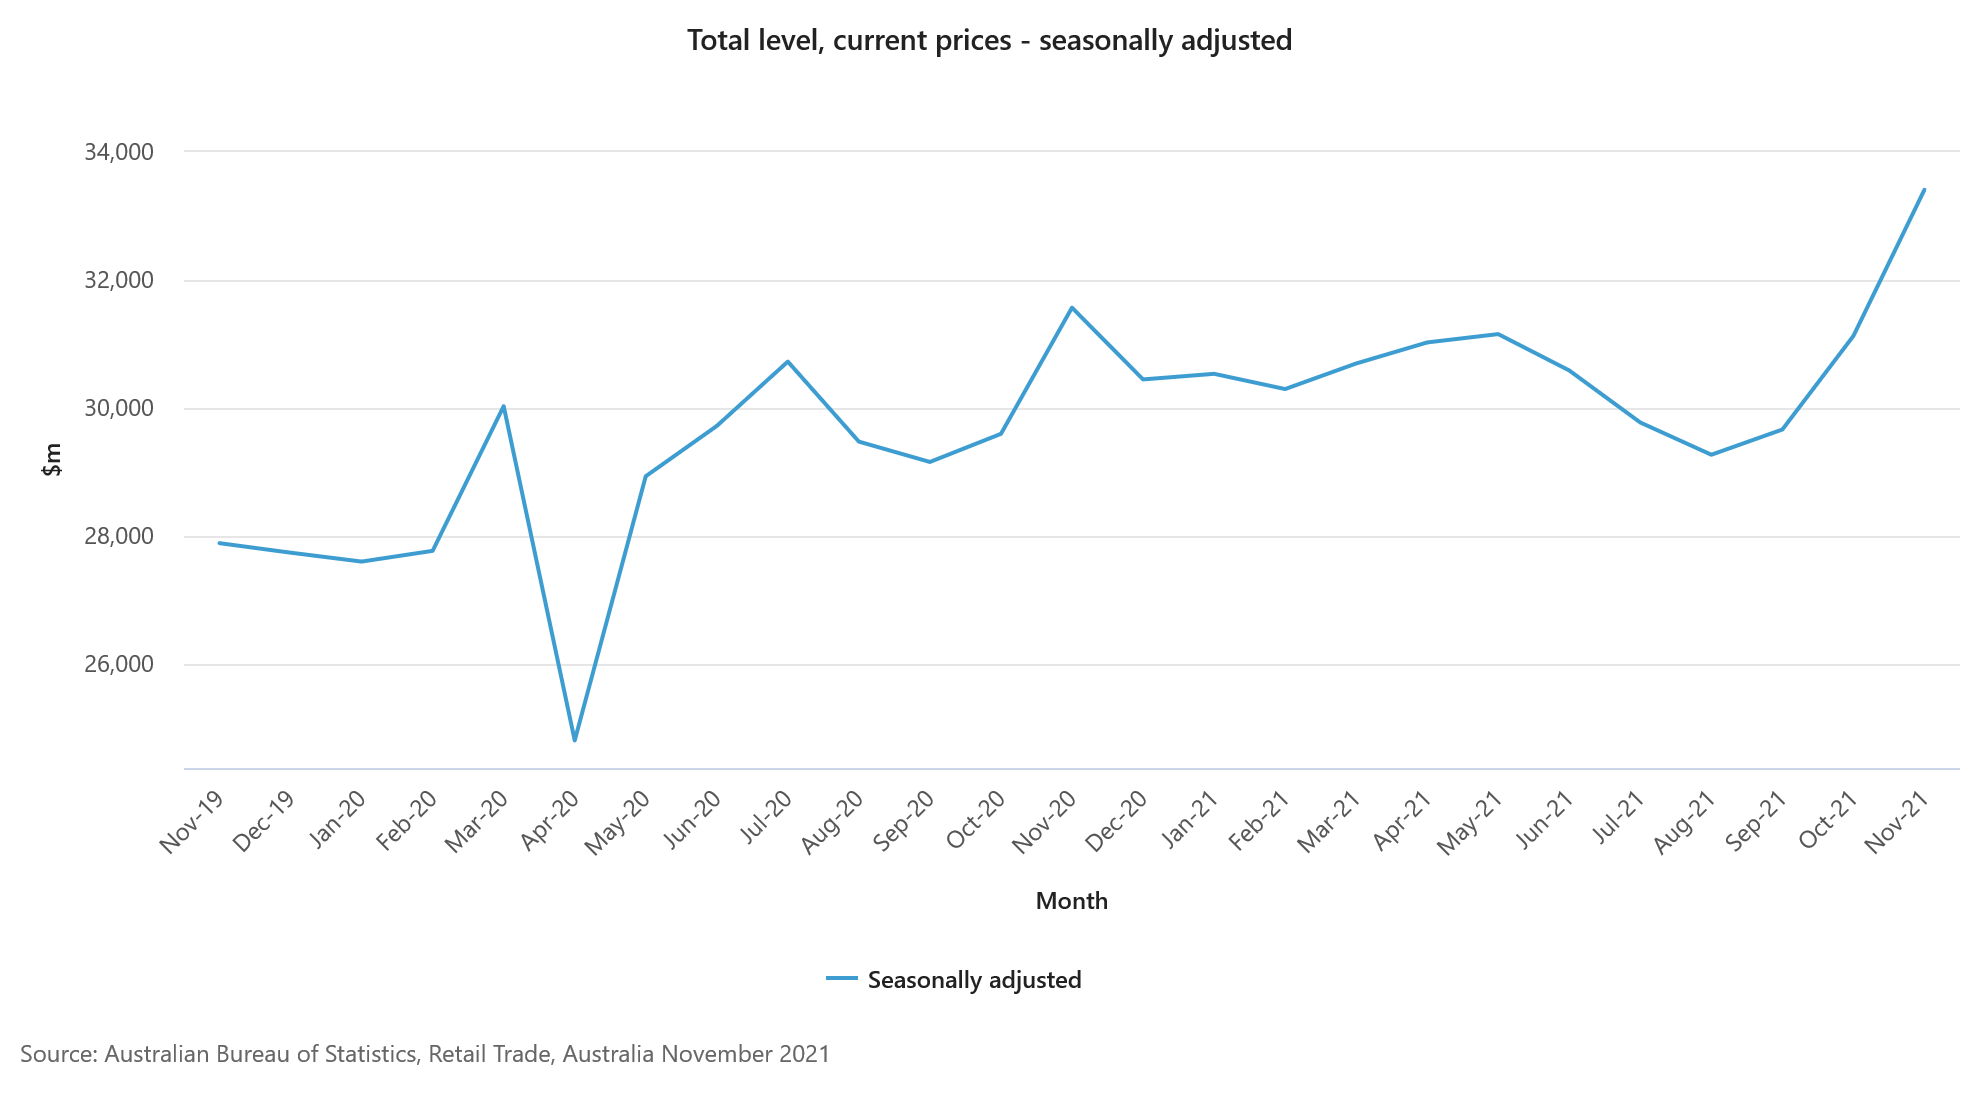
Australia retail sales rose 7.3% mom in November, well above expectation of 4.0% mom. That's also the fourth strongest monthly rise on record. Total turnover at current prices hit a record AUD 33.4B.
"Further easing of COVID-19 restrictions in the South-Eastern states and territories has seen the retail industry recover all lost momentum caused by the Delta outbreak," Ben James, Director of Quarterly Economy Wide Statistics, said. "Victoria recorded the largest state rise, up 20.0 per cent, reaching its highest level of the series. This follows the state's lockdown ending in late October."
"Continued easing of COVID-19 restrictions, including less strict density and capacity limits, in New South Wales (5.1 per cent) and the Australian Capital Territory (19.2 per cent) led to rises in turnover to record levels."
Fed Powell committed to prevent higher inflation from becoming entrenched
In the prepared remarks for the nomination hearing before Senate Banking Committee, Fed Chair Jerome Powell said, "today the economy is expanding at its fastest pace in many years, and the labor market is strong."
After the initial shutdown and the subsequent reopening, "the economy has rapidly gained strength despite the ongoing pandemic, giving rise to persistent supply and demand imbalances and bottlenecks, and thus to elevated inflation."
"We are strongly committed to achieving our statutory goals of maximum employment and price stability," Powell said. "We will use our tools to support the economy and a strong labor market and to prevent higher inflation from becoming entrenched."
Technical Outlook and Review
DXY:
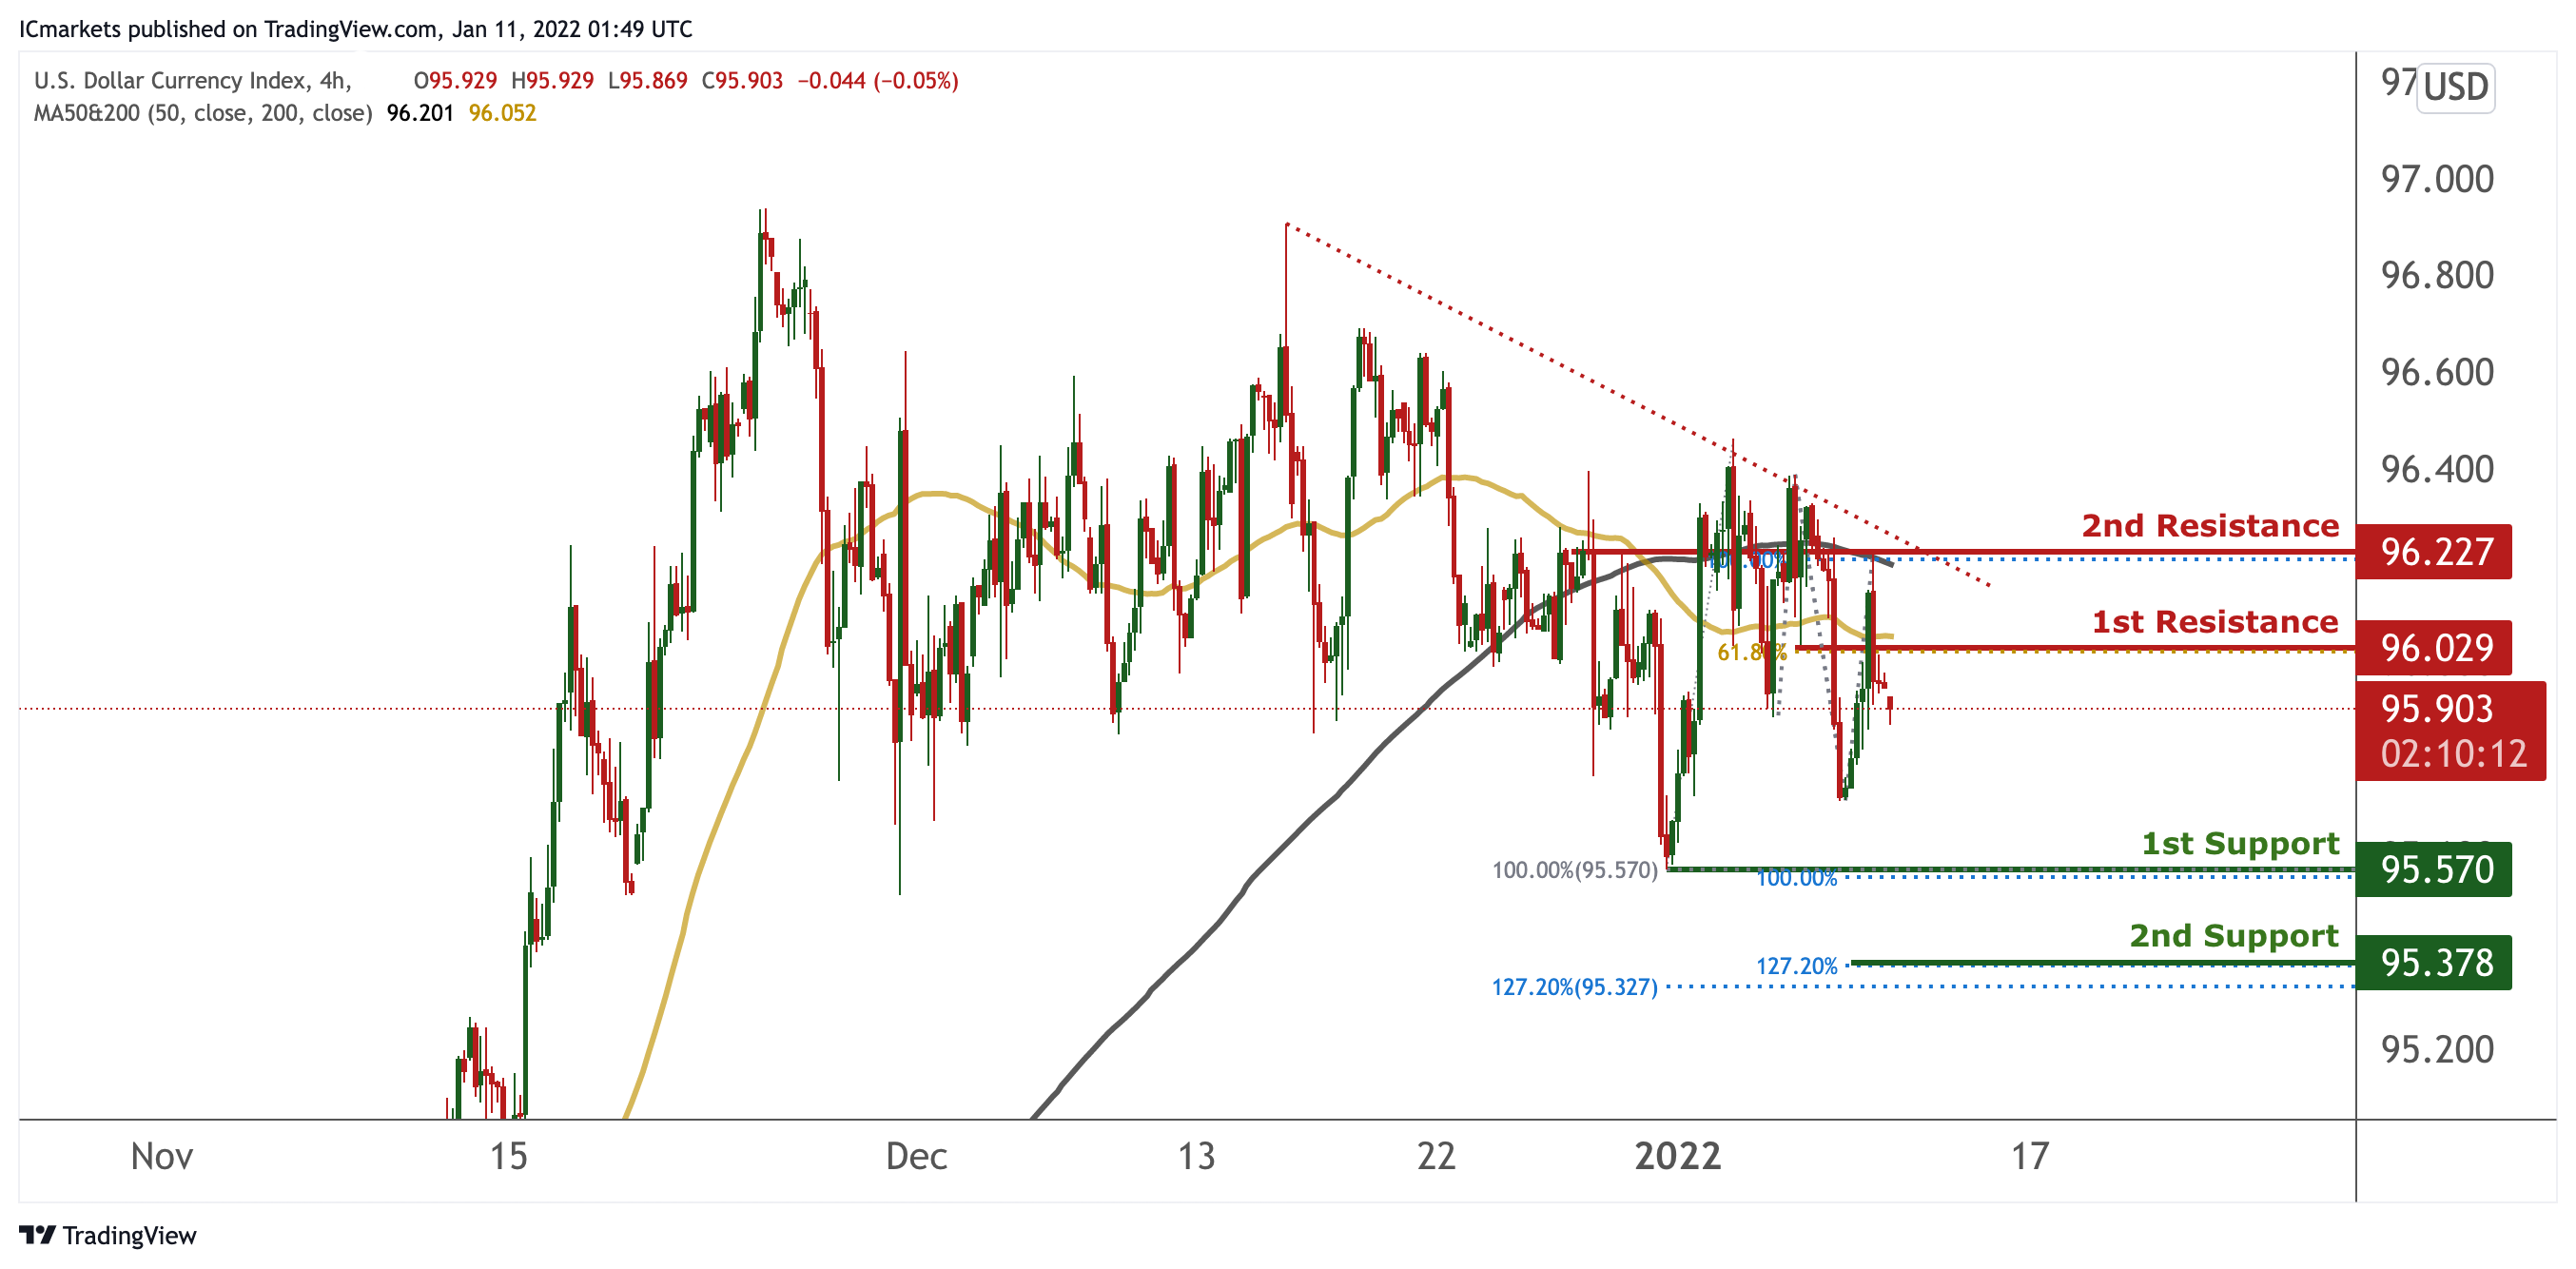
On the H4 timeframe, prices are on bearish momentum and abiding to our bearish trendline. We would expect further bearish continuation from our 1st resistance at 96.029 in line with 61.8% Fibonacci extension towards our 1st support at 95.570 in line with 100% Fibonacci extension and 100% Fibonacci retracement. Our bearish bias is further supported by MA 50 and 200 forming a death cross.
Areas of consideration:
- H4 time frame, 1st resistance at 96.029
- H4 time frame, 1st support at 95.570
XAU/USD (GOLD):
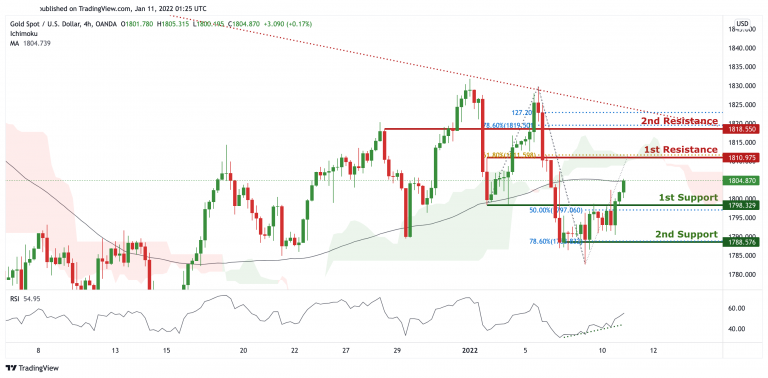
On the H4 chart, prices are consolidating sideways and hovering in between our 1st support and 1st resistance. We see the potential for further bullish movement towards our 1st resistance at 1810.975 in line with 61.8% Fibonacci extension. RSI is also portraying bullish momentum and prices are surpassing our MA, further supporting our hypothesis. Alternatively, breaking our 1st support will find prices dipping towards our 2nd support at 1788.576 in line with 78.6% Fibonacci retracement.
Areas of consideration:
- H4 1st support at 1798.329
- H4 1st resistance at 1810.945
GBP/USD
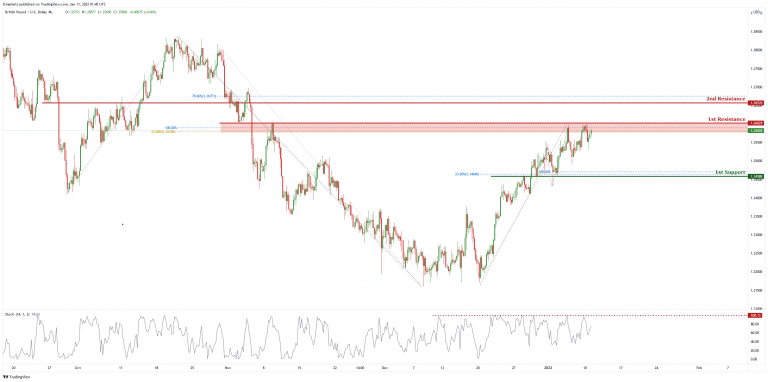
On the H4 chart, price is at the first resistance level of 1.36029 which is also 100% Fibonacci projection and 61.8% Fibonacci retracement. Price can potentially dip to the 1st support level of 1.34588 which is also 23.6% Fibonacci retracement and 100% Fibonacci projection. Our bearish bias is supported by the stochastic indicator as it is near resistance level.
Areas of consideration:
- H4 1st resistance at 1.36029
- H4 1st support 1.34588
USD/CHF
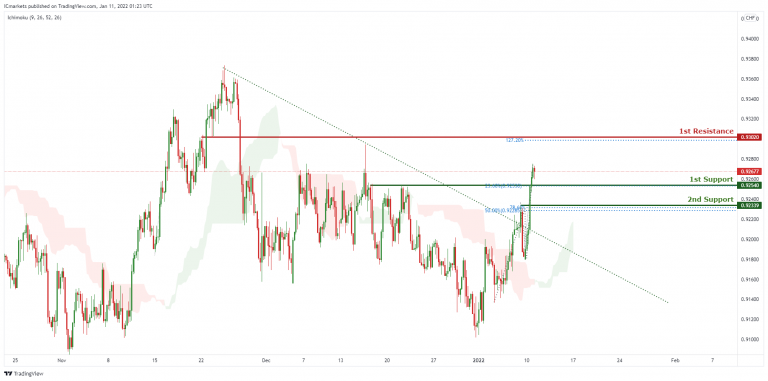
On the H4 timeframe, price recently broke out of the descending trendline resistance, signifying an overall bullish momentum. We can expect price to bounce from the 1st Support level in line with 23.6% Fibonacci retracement towards the 1st Resistance in line with 127.2% Fibonacci projection. Our bullish bias is further supported by the Ichimoku cloud indicator where the price is holding above it.
Areas of consideration:
- Watch 1st Support at 0.92540
- Watch 1st Resistance at 0.93020
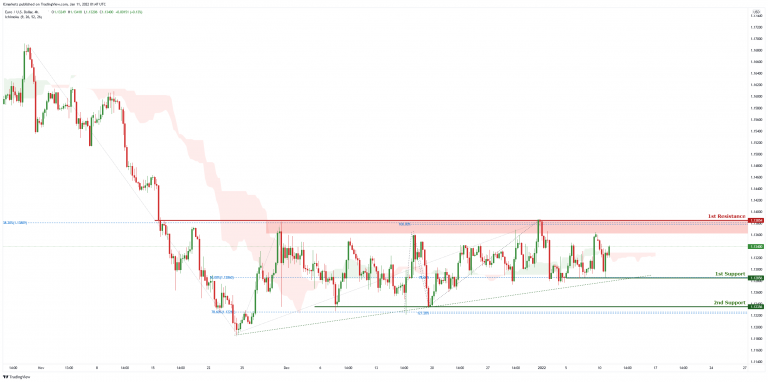
EUR/USD :
On the H4 chart, price is abiding by an ascending trendline and is heading to the 1st resistance level of 1.13854 which is also 100% Fibonacci projection and 38.2% Fibonacci retracement. Price can potentially dip to the 1st support level of 1.12783 which is also 50% Fibonacci retracement and 78.6% Fibonacci projection. Our bearish bias is supported by the ichimoku cloud indicator
Areas of consideration :
- H4 1st support at 1.12783
- H4 1st resistance at 1.13854
USD/JPY:
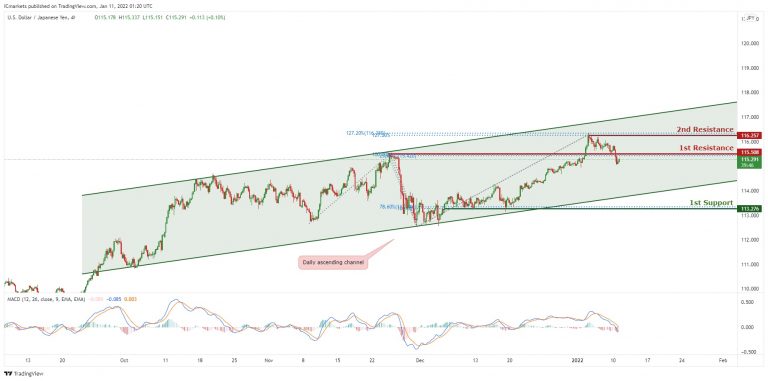
In reference to yesterday’s analysis, price is moving down nicely towards the 1st Support. On the H4 timeframe, is abiding to the ascending channel on the daily, signifying an overall bullish momentum. However, we can expect price to make a short-term bearish drop from 1st Resistance in line with 100% Fibonacci projection and 23.6% Fibonacci Retracement towards 1st Support in line with 78.6% Fibonacci retracement. Our short-term bearish bias is further supported by the MACD indicator where the signal line is above the MACD line.
Areas of consideration:
- H4 1st resistance level 115.508
- H4 1st support level 113.276
AUD/USD:
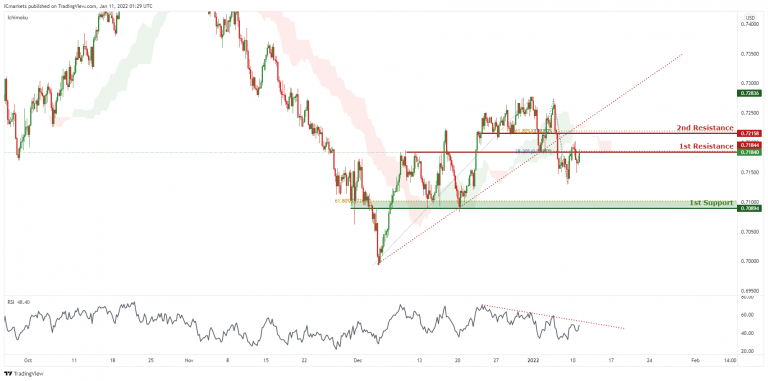
On the H4, price broke out of the ascending trendline support, signifying a bearish momentum. We can expect price to drop from 1st Resistance in line with 38.2% Fibonacci retracement and 61.8% Fibonacci projection towards 1st Support in line with 61.8% Fibonacci retracement. Our bearish bias is further supported by the price holding below the Ichimoku cloud and RSI indicator where it is abiding to the descending trendline resistance.
Areas of consideration:
- H4 1st Support level 0.70894
- H4 1st resistance level 0.71844
NZD/USD:
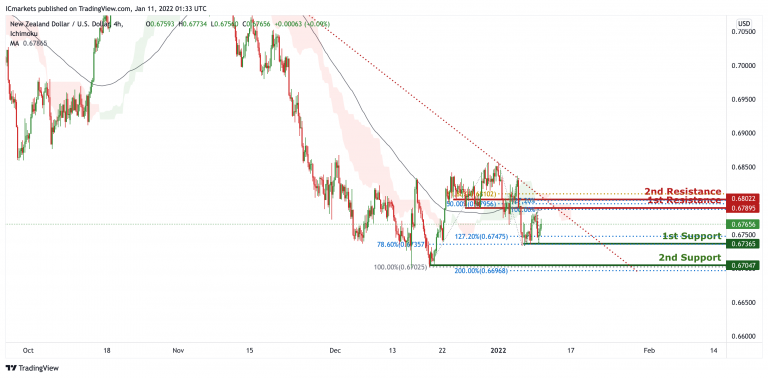
On the H4 timeframe, prices are on bearish momentum and abiding to our bearish trendline. We see potential for prices to dip further from our 1st resistance at 0.67895 in line with 100% Fibonacci extension and 50% Fibonacci retracement towards our 1st support at 0.67365 in line with 78.6% Fibonacci retracements and 127.2% Fibonacci extension. Our bias is further supported by ichimoku clouds forecasting the dip and also prices trading below our MA. If prices break our 1st support, prices can potentially dip towards our 2nd support at 0.67047 in line with 200% Fibonacci projection and 100% Fibonacci retracement.
Areas of consideration:
- H4 time frame, 1st resistance at 0.67895
- H4 time frame, 1st support at 0.67365
USD/CAD:
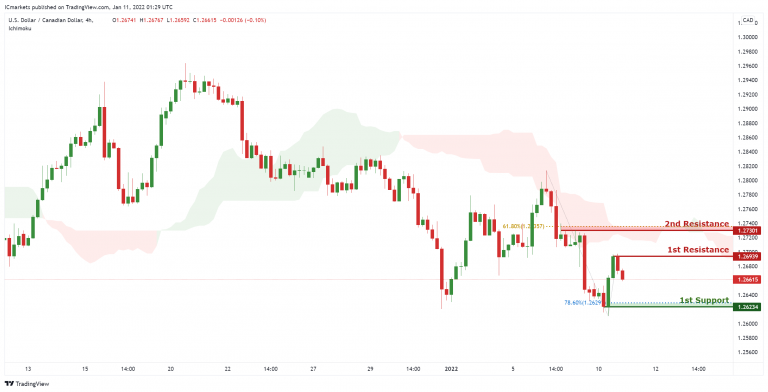
On the H4, with price moving below the ichimoku cloud, we have a bearish bias that price will drop from our 1st resistance at 1.26939 which is in line with horizontal swing high resistance to 1st support at 1.26234, which is in line with horizontal swing low support and 78.6% fibonacci retracement. Alternatively, price may break 1st resistance structure and head for 2nd resistance at 1.27301, which coincides with horizontal swing high resistance and 61.8% Fibonacci retracement.
Areas of consideration:
- H4 time frame, 1st support at 1.26234
- H4 time frame, 1st resistance at 1.26939
OIL:
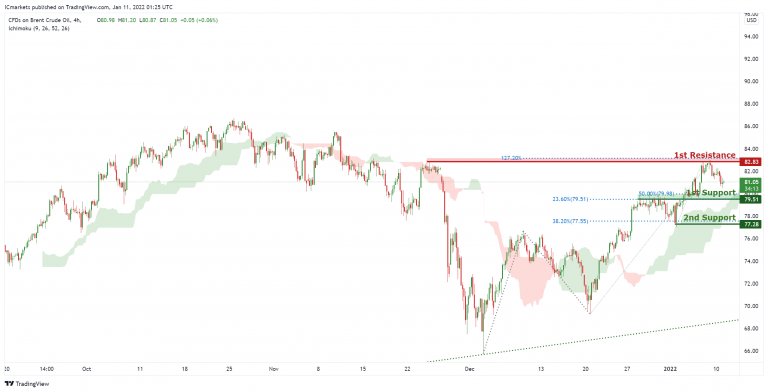
On the H4, with price moving above the ichimoku cloud, we have a bullish bias that price will rise to our 1st resistance at 82.83 which is in line with horizontal swing high resistance and 127.2% Fibonacci extension from 1st support at 79.51, which is in line with horizontal overlap support and 23.6% and 50% Fibonacci retracement level. Alternatively, price may break 1st support structure and head for 2nd support at 77.28, which coincides with horizontal overlap support and 61.8% Fibonacci retracement level .
Areas of consideration:
- H4 time frame, 1st resistance of 82.83
- H4 time frame, 1st support of 79.51
Dow Jones Industrial Average:
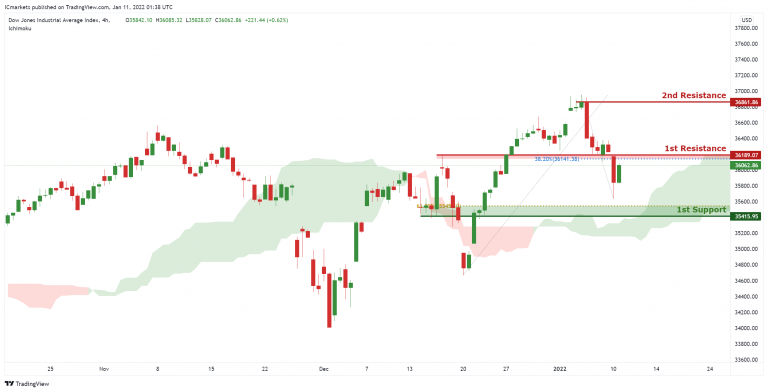
On the H4, with price moving below the ichimoku cloud, we have a bearish bias that price will drop from our 1st resistance at 36189 which is in line with horizontal swing overlap resistance to 1st support at 35415, which is in line with horizontal overlap support and 61.8% fibonacci retracement. Alternatively, price may break 1st resistance structure and head for 2nd resistance at 36861, which coincides with horizontal swing high resistance.
Areas of consideration:
- H4 time frame, 1st resistance of 36189
- H4 time frame, 1st support of 35415
Dow Jones Wave Analysis
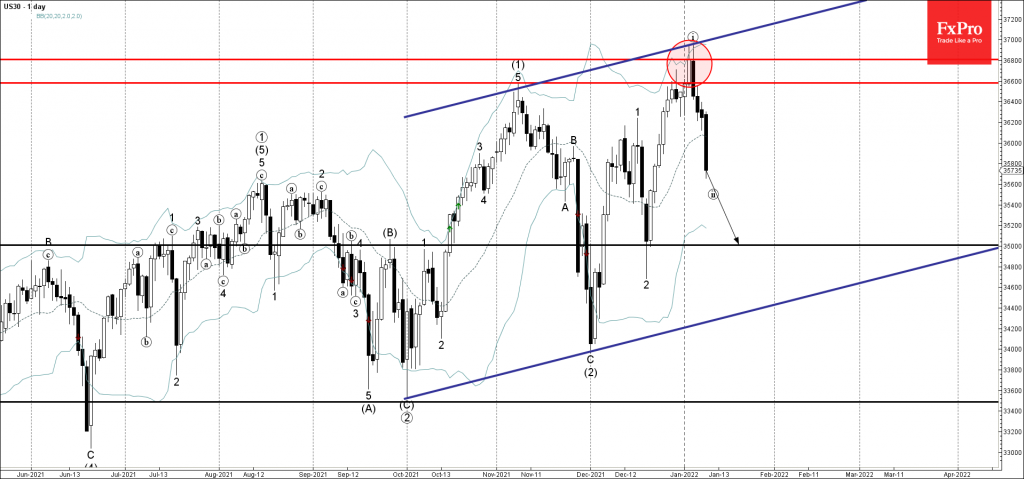
- Dow Jones reversed from resistance level 36800.00
- Likely to fall to support level 35000.00
Dow Jones index recently reversed down with the daily bearish Engulfing from the resistance level 36800.00, intersecting with the upper daily Bollinger Band and the weekly up channel from September.
The downward reversal from the resistance level 36800.00 started the active short-term corrective wave (ii).
Dow Jones index can be expected to fall further toward the next key support level 35000.00 (which reversed the price in December).
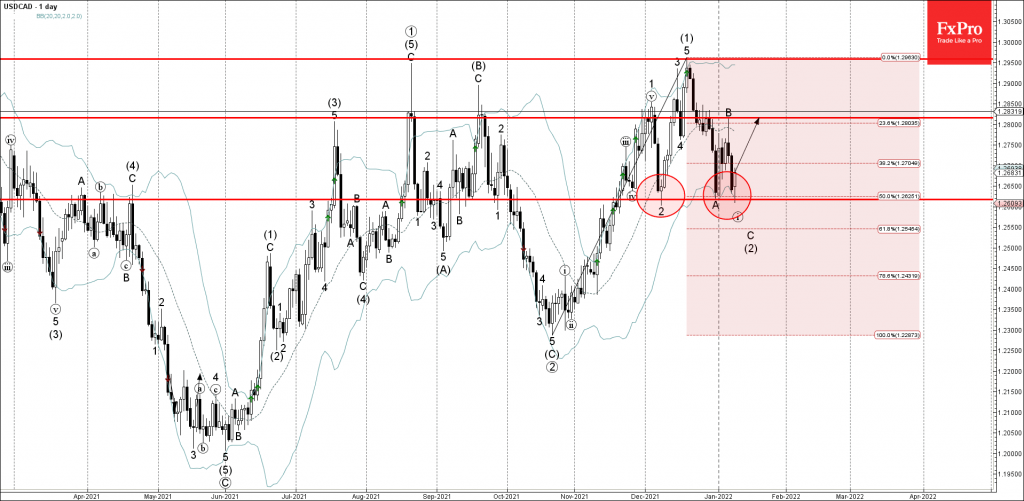
USDCAD Wave Analysis
- USDCAD reversed from support level 1.2615
- Likely to rise to resistance level 1.2800
USDCAD currency pair recently reversed up from the key support level 1.2615 (which has been reversing the price from the start of December), intersecting with the lower daily Bollinger Band and the 50% Fibonacci correction of the upward impulse (1) from October.
The upward reversal from the support level 1.2615 stopped the earlier short-term impulse waves C.
Given the rising US dollar bullishness seen today – USDCAD currency pair can be expected to rise further toward the next resistance level 1.2800 (top of the previous wave B).
Will Oil Drop to $60 or Rise to $100 in 2022?
Predicting oil prices is a difficult job at the best of times. Still, it is increasingly difficult as COVID-19 and its variants continue to suspend consumers' plans and disrupt the balance between oil demand and supply. In addition, governments are also working to dismantle the current global energy system and shift to clean energy. All this puts oil prices and energy companies under the fog of uncertainty.
We expect crude oil prices to decline in the coming months, as it appears that supply will outpace demand, and we will find a surplus that turns things upside down. However, this does not mean that oil will not continue the rally that began late last year in 2022.
The potential failure to revive the Iran nuclear deal, the expected return of higher oil demand during the summer season, and the inability of OPEC+ to commit to pumping the agreed on amounts of supplies due to slowing production may push oil prices up.
Prices will begin to rebalance in the first quarter of 2022. According to Energy Information Agency (EIA), the average price of Brent crude will average $70 a barrel during 2022, according to Energy Information Agency (EIA).
Oil price, supply, and demand forecasts
The International Energy Agency (IEA) has forecasted that the global oil supply will exceed demand this year.
Global oil supply is expected to increase by 6.4 million barrels per day in 2022, compared to 1.5 million barrels per day in 2021. According to IEA, global demand will expand by 3.3 million barrels per day in 2022, compared to 5.4 million barrels per day in 2021.
According to the agency's report, the first quarter of 2022 could see a surplus of 1.7 million barrels per day and grow to 2 million barrels per day in the second quarter of 2022.
This surplus may push oil prices to calm down a bit and return to levels of $70 a barrel during this period.
Will oil return to $60 a barrel?
Oil prices may be at risk of dropping to $60 during the coming months due to the slowing demand associated with Omicron, and its effects on economies, production, aviation, and travel. This will happen if:
- OPEC+ meets its collective production obligations.
- The United States takes back its role as an influential producer, and the US shale oil comes back strongly to the field.
- A breakthrough occurs in the Iranian nuclear deal with Western forces, and Iranian oil returns to the market in 2022.
The oil price may collapse to $60 a barrel. However, it will be an excellent opportunity to buy because the long-term trend will be bullish.
Is it possible for oil to jump to $100 a barrel in 2022?
As global economies reopen from the pandemic, oil demand may exceed global supply. However, forecasts of an oversupply in the first quarter of 2022 will disappear for good, as OPEC and its non-OPEC allies led by Russia can still not deliver the planned 400,000 BPD increase each month.
Excess supply will turn into tight supply, as demand for oil fuel increases as economies recover, and the driving season begins during the summer. This may push prices to $85-$90 a barrel during 2022. In addition, OPEC+ is expected to maintain a tight grip on production, which is an excellent recipe for pushing prices higher.
The absence of Iranian oil in the market, as we wait for the possible failure of the Iran nuclear deal talks, may open the door for oil to break $100 a barrel, especially if inflation and rising production costs reach the oil services sector.
In the end, to sum it up, we expect oil to continue its rally, but it will calm down a bit, and prices will range between $73-$85 during the year. According to the circumstances, oil should witness some volatility between ups and downs.
Bitcoin Tests Key Support at $40K
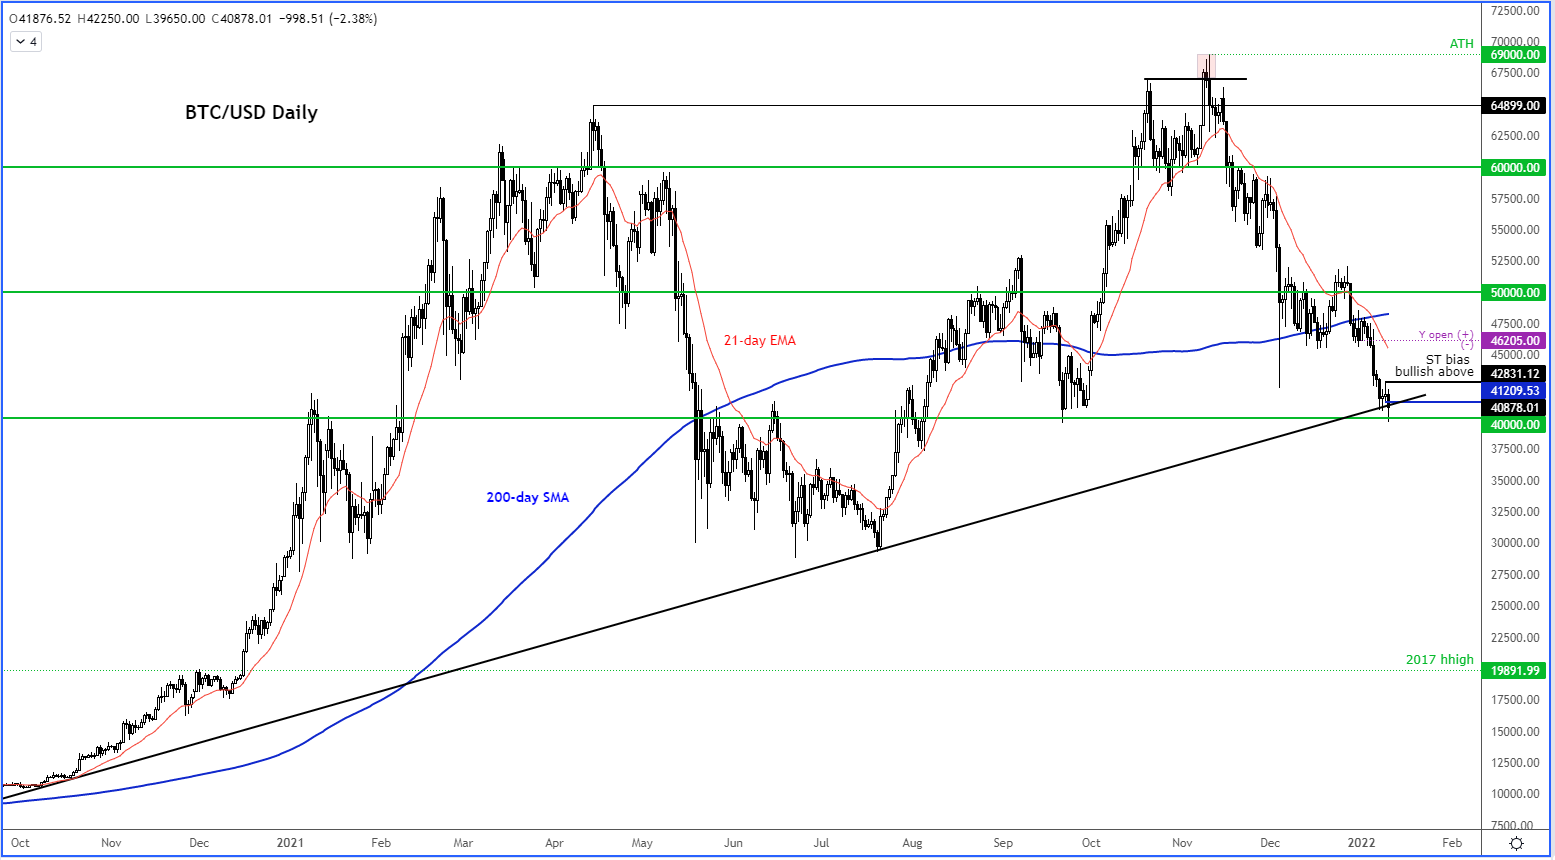
As mentioned earlier, there hasn’t been any relief for technology stocks or cryptocurrencies at the start of the new week. But at the time of writing, Bitcoin was sharply of its earlier low after dipping below the $40K handle.
It is important to note that Bitcoin is testing a major support area here and what happens next will be key insofar as direction for the next few days are concerned.
As well as a psychologically-important level, the area around $40K marks the convergence of previous support and this bullish trend line:
Source: ThinkMarkets and TradingView.com
It is possible that after a major dip like, we could see dip buyers return here, supporting prices. However, if support breaks down decisively then we will have to wait a little longer before prices potentially bottom out.
So, keep a very close eye on Bitcoin here for bottoming signs. What the bulls will want to see here is daily hammer or bullish engulfing, or the like, here.
Ideally, this should happen as soon as possible – within the next few days. However, if price doesn’t start rising soon in the way we have highlighted the possibility, then this would likely precede further short-term weakness.
GBP/USD Could Rally Further Above 1.3600
Key Highlights
- GBP/USD extended increase above the 1.3550 resistance zone.
- A major bullish trend line is forming with support near 1.3525 on the 4-hours chart.
- EUR/USD failed to continue above 1.1380 and corrected lower.
- Crude oil price failed to clear the $80.00 resistance zone.
GBP/USD Technical Analysis
This past week, the British Pound started a major increase above 1.3400 against the US Dollar. GBP/USD even broke the 1.3500 zone to move into a bullish zone.
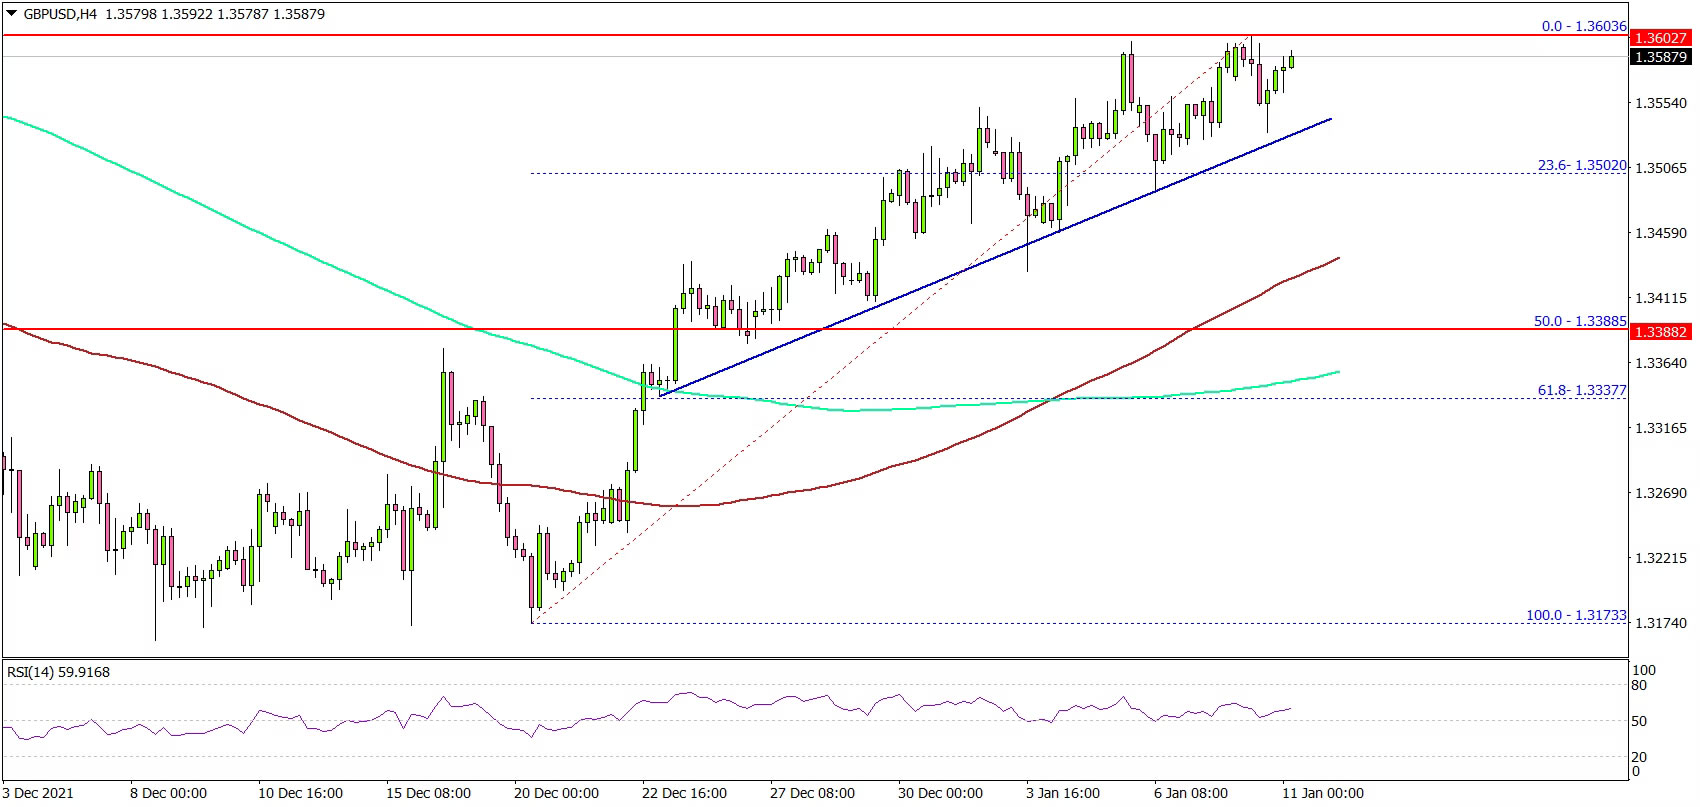
Looking at the 4-hours chart, the pair settled well above the 1.3500 level, the 100 simple moving average (red, 4-hours) and the 200 simple moving average (green, 4-hours).
The pair even spiked above the 1.3600 level and traded to a new multi-week high near 1.3603. Recently, there was a minor downside correction below 1.3560. On the downside, there is a decent support forming near 1.3525.
There is also a major bullish trend line forming with support near 1.3525 on the same chart. The main support is forming near the 1.3400 level and the 100 simple moving average (red, 4-hours).
The 50% Fib retracement level of the upward move from the 1.3173 swing low to 1.3603 high is also near the 1.3388 level. If there is a downside break below 1.3388, the pair could dive towards the 1.3300 level.
On the upside, the pair is facing resistance near 1.3600 level. The next major resistance is near the 1.3620 level. A close above 1.3620 could open the doors for more gains.
Looking at EUR/USD, the pair once again failed to clear the 1.1380 zone and started a fresh decline in the near term.
Economic Releases
- Federal Reserve Chair Jerome Powell testifies before Congress.
- European Central Bank's President Christine Lagarde Speech.