Sample Category Title
AUD/USD Currently Correcting Higher from 0.7129 Low
The Aussie Dollar started a fresh decline from well above 0.7250 against the US Dollar. The AUD/USD pair traded below the 0.7220 support to move into a bearish zone.
The pair even traded below the 0.7160 level and the 50 hourly simple moving average. A low was formed near 0.7129 and is currently correcting higher. There was a break above a key bearish trend line with resistance near 0.7150 on the hourly chart.
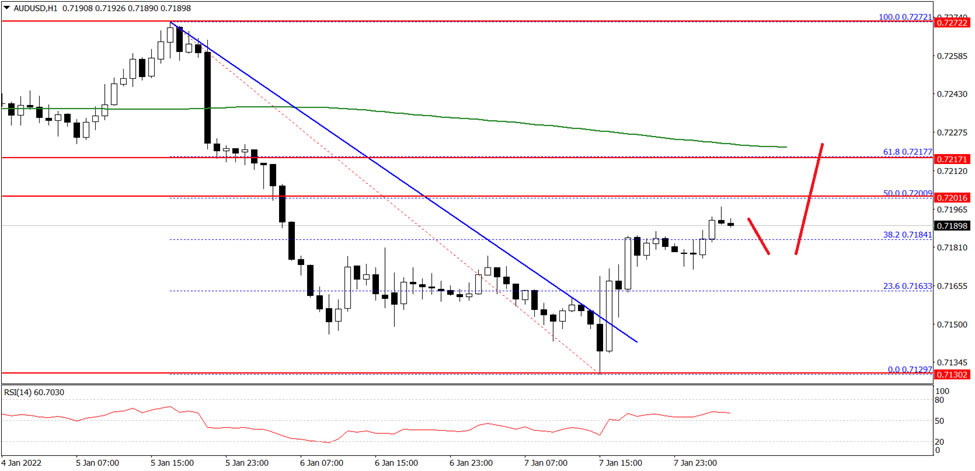
The next major resistance is near the 0.7200 level and the 50 hourly SMA, above which the pair could rise steadily towards the 0.7250 level in the near term.
An immediate support on the downside is near 0.7160 on FXOpen. The next key support is near the 0.7130 level. A clear break below the 0.7130 support could lead the pair towards the 0.7080 support.
EURGBP Continues its Descending Move; Bearish Forces Linger
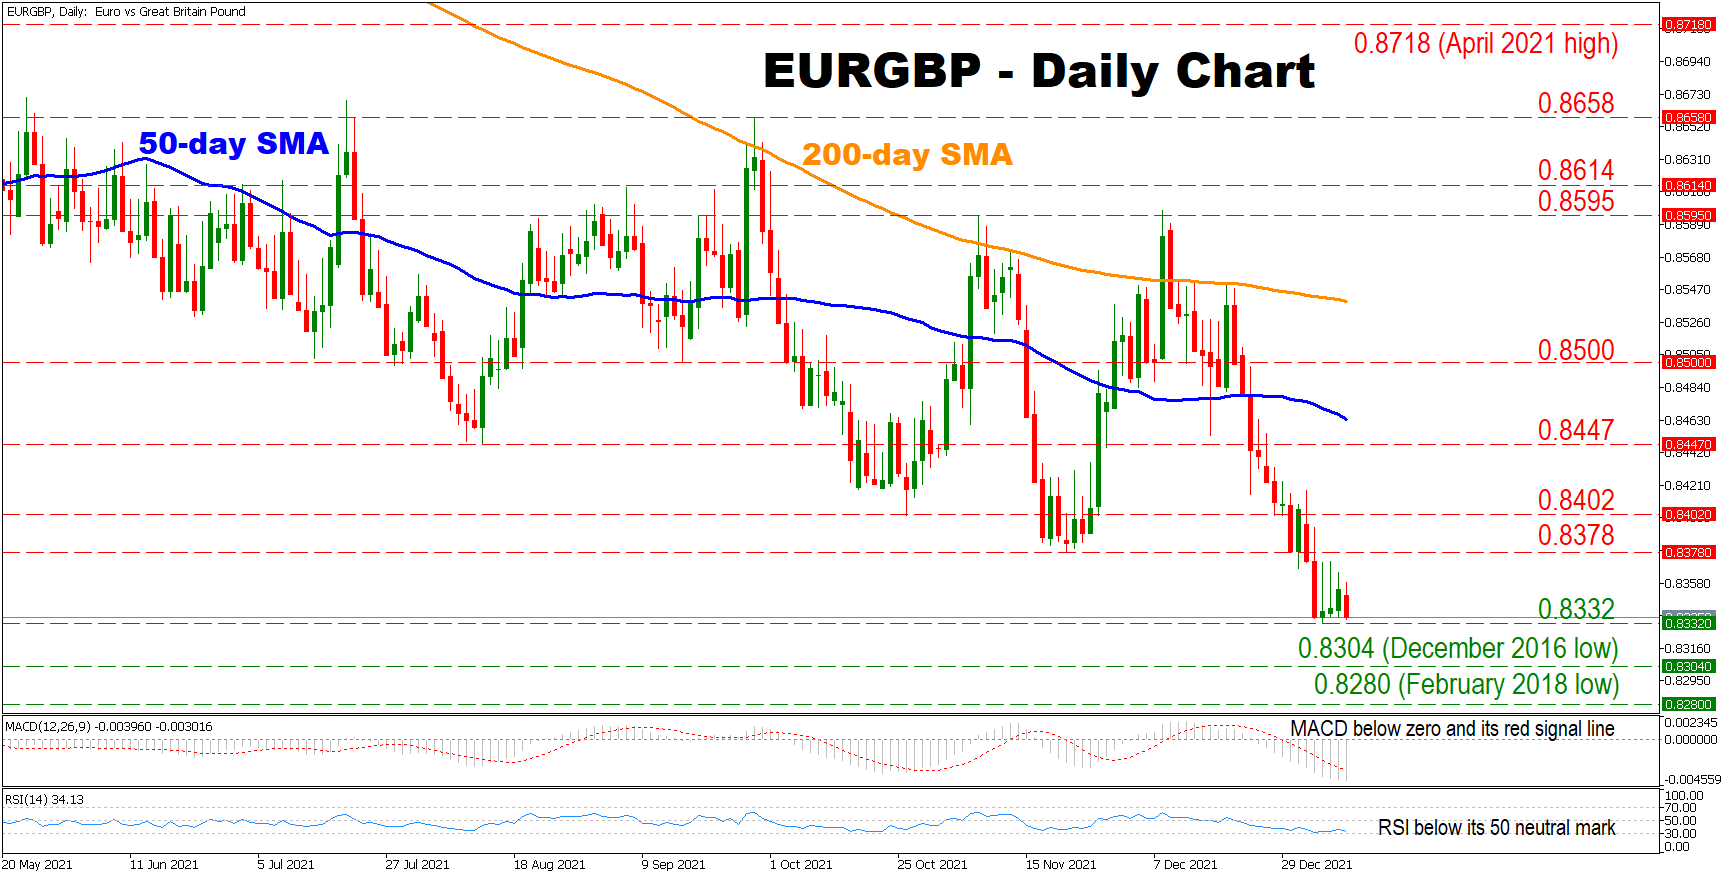
EURGBP came under pressure during December, crossing below its 50- and 200-day simple moving average (SMA). Moreover, the pair has marked yet more lower lows, reinforcing its overall bearish outlook.
Short-term momentum indicators are supporting a negative bias for the pair as the RSI is found below its 50 neutral mark, while the MACD is located below zero and its red signal line.
Should the bears maintain control, initial resistance might be found at the 0.8332 level. A break below that crucial point could intensify selling pressures, paving the way towards the December 2016 low of 0.8304. A decisive move below the latter could send the price to test the February 2018 low of 0.8280.
On the flip side, if the bulls regain control, initial support might be found at the 0.8378 level, before buyers eye the 0.8402 hurdle. A break above that point could open the door towards the 0.8447 obstacle, before testing the 50-day SMA currently at 0.8463. Surpassing the latter could strengthen the pair's positive momentum, sending the price towards the 0.8500 barrier.
In brief, the outlook for EURGBP is cautiously bearish as the price is trading well below its 50- and 200-day SMA. For sentiment to change, the bears would need to break above the 200-day SMA currently at 0.8539.
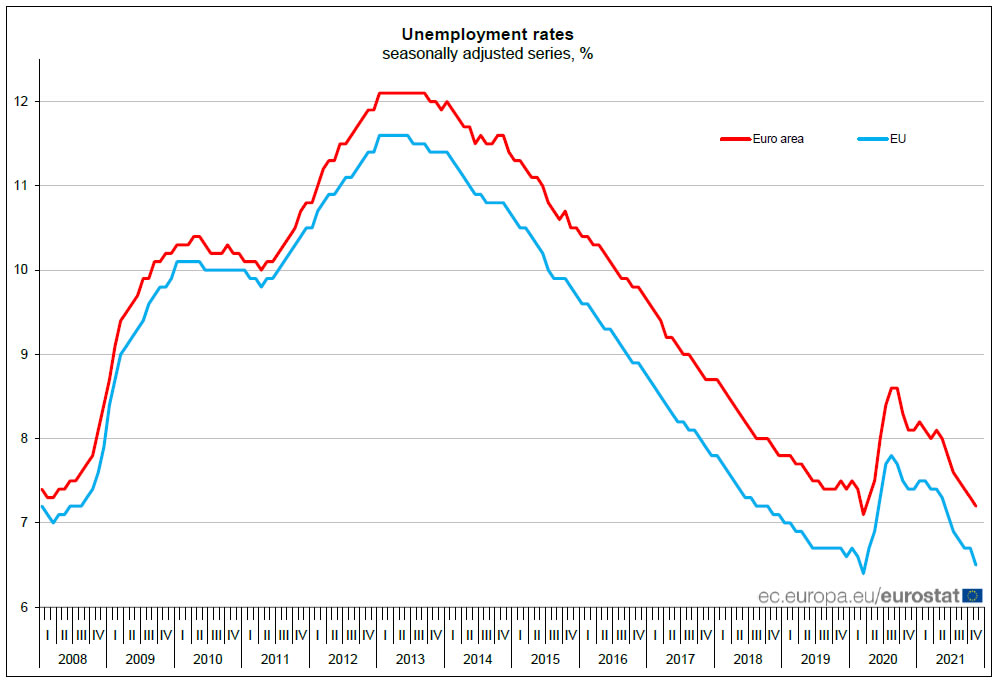
Eurozone unemployment rate dropped to 7.2% in Nov, EU down to 6.5%
Eurozone unemployment rate dropped from 7.3% to 7.2% in November, matched expectations. EU unemployment rate dropped from 6.7% to 6.5%.
Eurostat estimates that 13.984 million men and women in the EU, of whom 11.829 million in the euro area, were unemployed in November 2021. Compared with October 2021, the number of persons unemployed decreased by 247 000 in the EU and by 222 000 in the euro area. Compared with November 2020, unemployment decreased by 1.659 million in the EU and by 1.411 million in the euro area.
Cable Cracks 1.36 Barrier in Extension of Advance after Disappointing US NFP Data
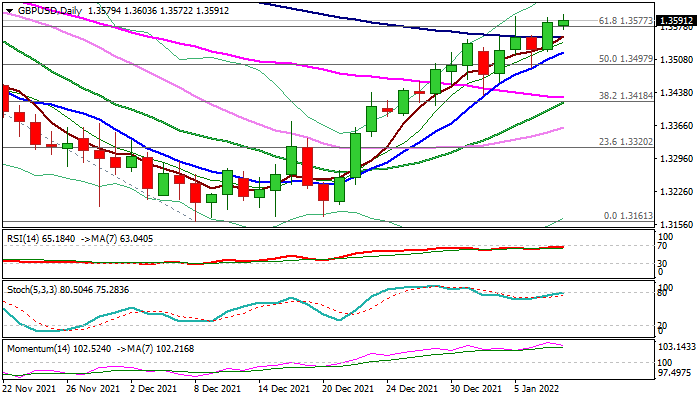
Cable cracks 1.36 barrier in early Monday’s trading, maintaining positive stance following last Friday’s jump on well below expectations US non-farm payrolls data.
Bullish setup of daily MA’s underpins the action, along with positive signal generated on Friday’s close above pivotal double-Fibo barriers at 1.3575/77 (38.2% of 1.4249/1.3161 descend and 61.8% retracement of 1.3834/1.3161 downleg), which looks for confirmation on repeated daily close above these levels.
Sustained break above 1.36 zone (round-figure / Nov 9 high) would open way towards 1.3675 (Fibo 76.4% of 1.3834/1.3161) and possibly unmask 200DMA (1.3736).
Weaker bullish momentum and stochastic entering overbought territory on daily chart, warn that bulls might be losing steam and consolidation may precede fresh push higher.
Initial support lays at 1.3553 (5/100DMA bull-cross) with extended dips to remain above broken daily cloud top (1.3514) to keep bulls intact.
Res: 1.3607; 1.3675; 1.3700; 1.3736
Sup: 1.3575; 1.3553; 1.3514; 1.3490
Intraday Market Analysis: US Dollar Index Struggles for Support
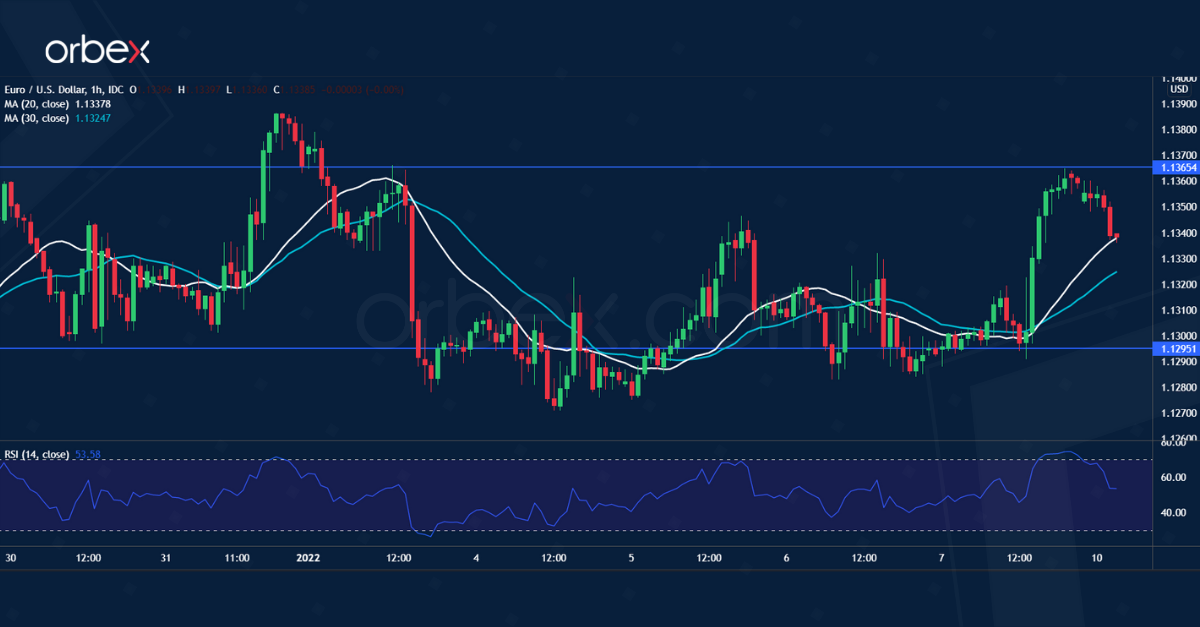
EUR/USD tests key resistance
The US dollar retreated after December’s Nonfarm Payrolls came in far below expectations. The pair has been in a narrowing range between 1.1270 and 1.1365.
The previous fall below 1.1280 added pressure on the buy side, though it turned out to be an opportunity for the bulls to accumulate at a bargain.
A break above the resistance could end the sideways action and trigger a runaway rally towards 1.1460. The RSI surged into the overbought area and may cause a brief pullback above 1.1295.
USD/CAD tests daily support
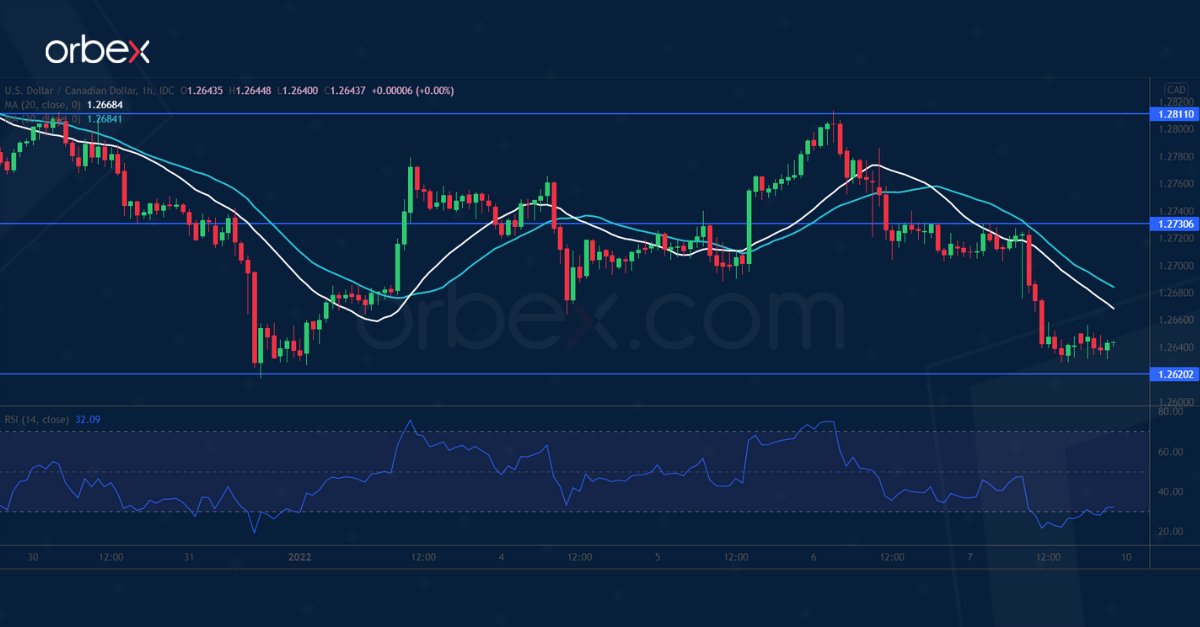
The loonie rallied after Canada added twice as many jobs as expected in December. The year-end sell-off met strong bids near the daily support at 1.2620.
But the rebound came to halt at the supply zone around 1.2810, which used to support from the previous consolidation. The RSI’s double top in the overbought zone has restrained the upward momentum.
1.2730 is a fresh resistance as price action is about to retest the critical level at 1.2620. A bearish breakout could trigger a plunge to 1.2540.
GER 40 seeks support
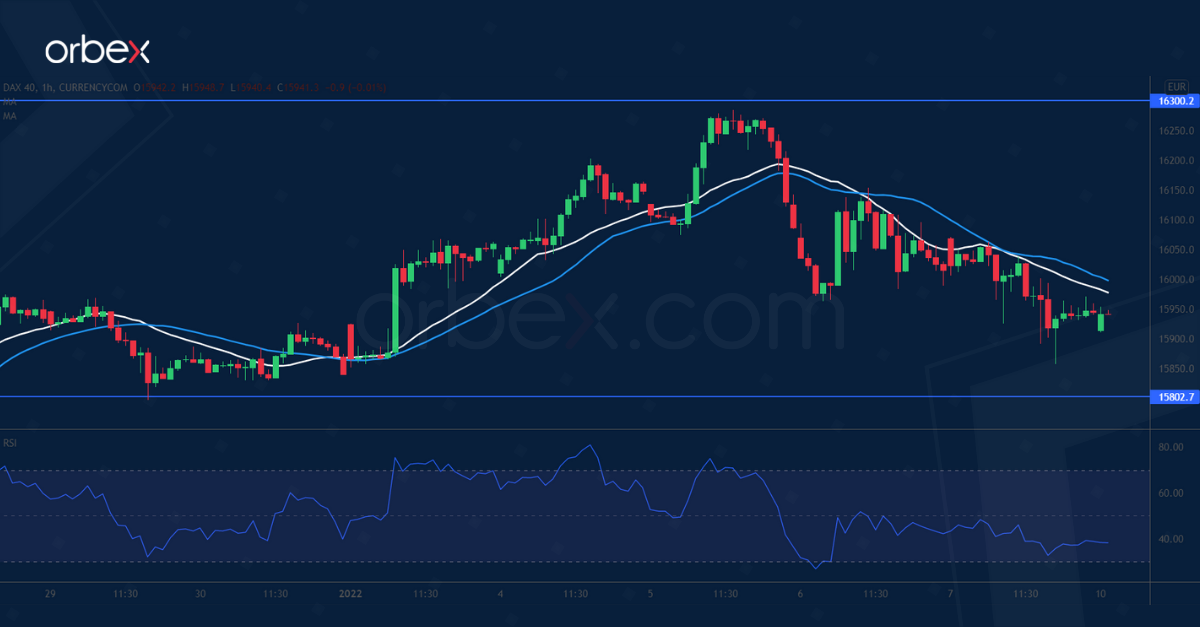
The Dax 40 edged lower as rising CPI in the eurozone argues in favor of tightening. The index saw stiff selling pressure right under the all-time high at 16300.
A bearish RSI divergence in this major supply area indicates a lack of commitment from the bulls as buying slows down. A combination of profit-taking and fresh selling has led to a drop below 16100, a warning sign for a steeper correction.
15800 is the next key support. A breakout could send the index to 15500 at the base of the latest rally.
Eurozone Sentix rose to 14.9 in Jan, fundamentally constructive outlook with an Achilles’ heel
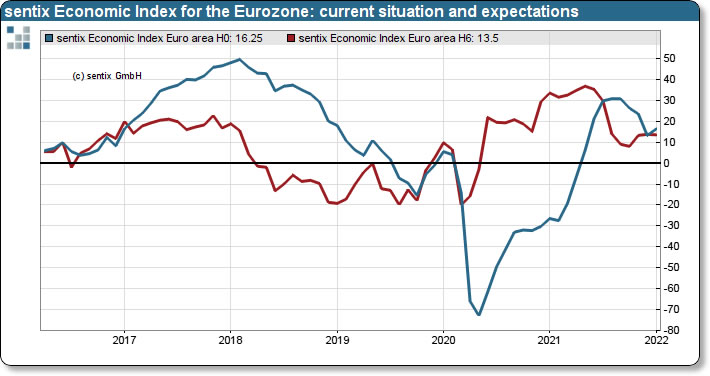
Eurozone Sentix Investor Confidence rose from 13.5 to 14.9 in January, above expectation of 12.0. Current Situation Index rose from 13.3 to 16.3. Expectations Index dropped slightly from 13.8 to 13.5.
Sentix said, "our fundamentally constructive outlook for the economy in 2022 (especially the first half of the year) has an Achilles' heel: The support of expansive central banks is threatening to run out faster than expected.
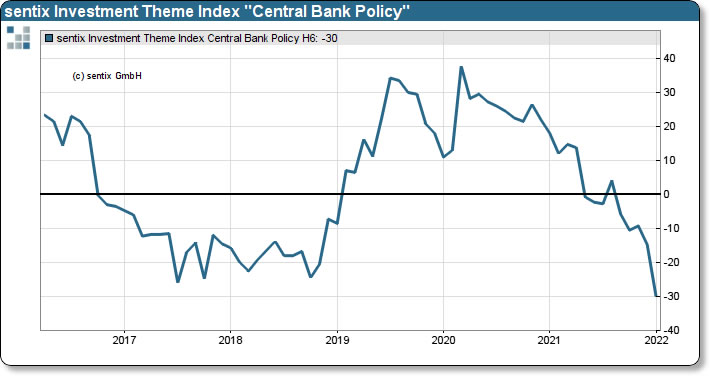
"The sentix topic barometer 'Central Bank Policy' indicates an increasing burden for the bond market and thus for the real economy. The burden on this is estimated to be greater than in 2018, when the monetary guardians also adopted a more restrictive course.
"Fiscal balancing impulses must therefore be put in place swiftly to cushion the weakening monetary impetus from the central banks."
Gold Slips Back Below 1,800 But Trendless Bias Holds
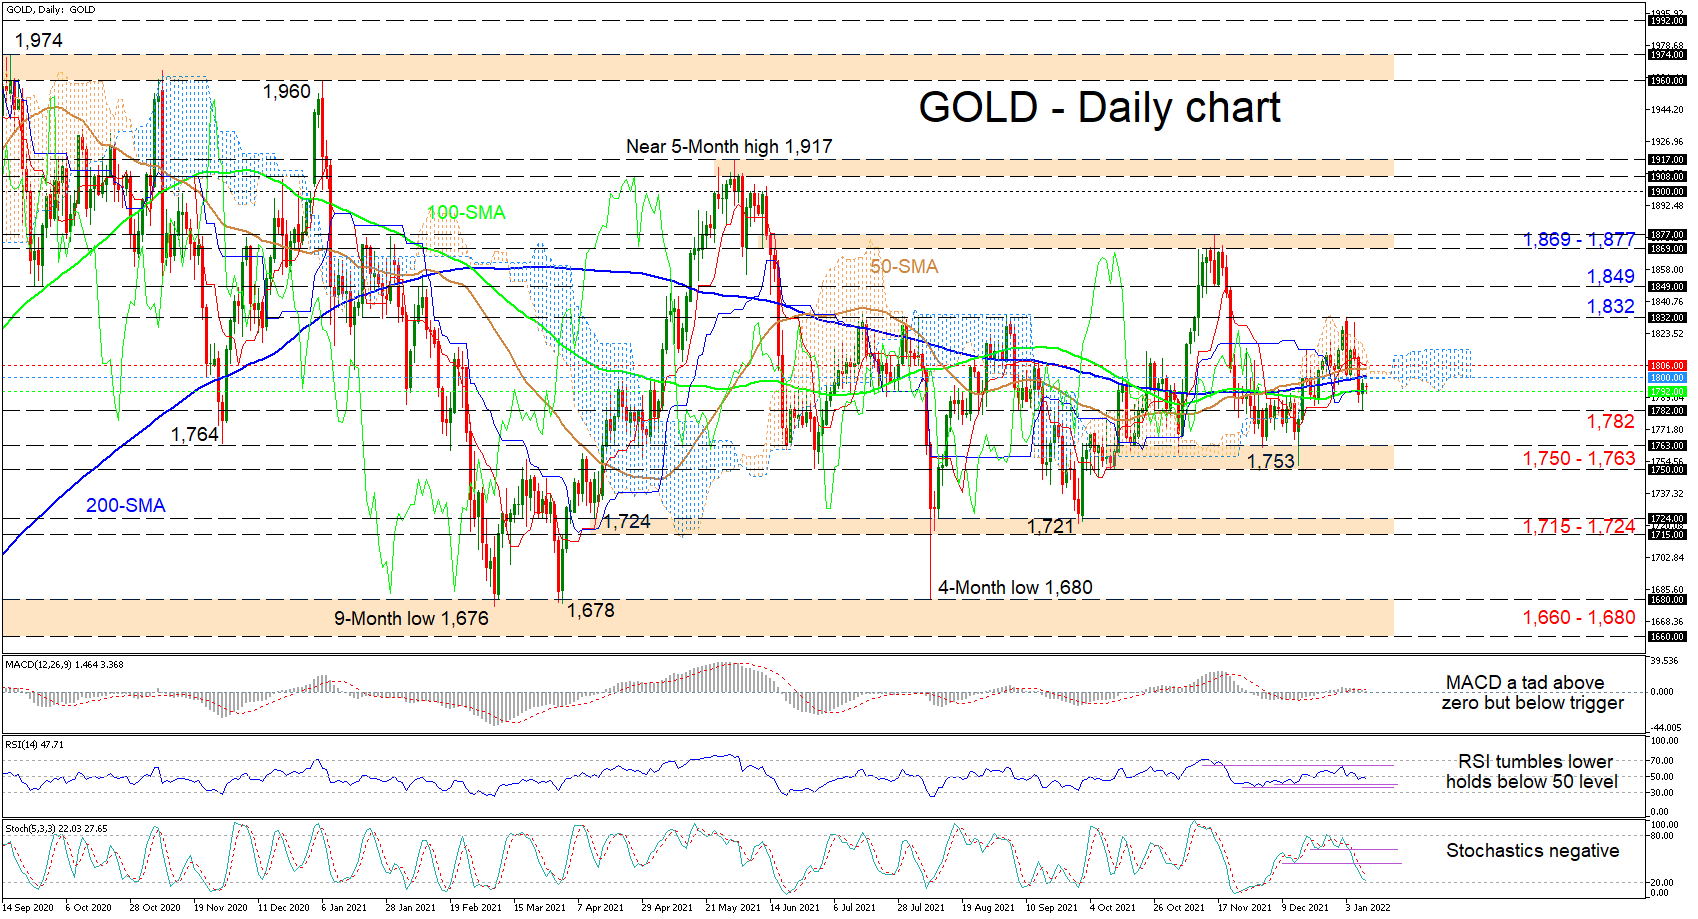
Gold’s downside forces have paused a tad beneath the 1,800 mark with the price resting on the 100-period simple moving average (SMA). A more neutral trajectory is being endorsed by the lack of trend in the SMAs.
The Ichimoku lines are not indicating a clear price direction especially after the price gains from the 1,753 trough, which have been relatively offset by the pullback in the commodity off the 1,832 recent high. The short-term oscillators are tilting a tad to the downside, but directional momentum remains weak. The MACD and the red trigger line have flatlined marginally above the zero threshold, while the RSI is pointing lower, slightly beneath the 50 level. The negatively charged stochastic oscillator is promoting further negative moves in the precious metal.
Maintaining the current price path, downward constraints could commence from the 100-day SMA at 1,792 ahead of the 1,782 nearby obstacle. Sliding lower, the bears may then confront the 1,750-1,763 support zone, which has taken shape from November 2021. If selling interest intensifies, the 1,715-1,724 support band could come under fire, while any further price impetus south may turn traders’ attention towards the key 1,660-1,680 barricade, which has defended the broader positive structure from June 2020.
On the other hand, an immediate fortified resistance section from the cloud’s lower band at 1,800 until the red Tenkan-sen line at 1,806 may impede buyers from reaching the 1,832 high. However, if the price successfully overcomes the 1,832 barrier, the bulls may jump towards the 1,849 obstacle before aiming for the 1,869-1,877 resistance border.
Summarizing, gold is oscillating around the 1,800 mark remaining confined between the 1,676 and 1,917 limits of a ten-month trading range.
Inflation and Rising Yields to Guide Investors
Stock investors across the globe are eagerly awaiting the next US inflation report due on Wednesday. Rising bond yields and earlier anticipation of stimulus withdrawal dragged US equities lower last week with the S&P 500 posting its worst start to a year since 2016. Tech stocks were dumped as US 10-year yields climbed 29 basis points in five trading days to reach 1.8% on Friday. Meanwhile, cyclical stocks were the primary beneficiary from rising rates, with the financial sector up more than 5%.
Investors have got used to low bond yields for years, so it's natural to see risk assets, especially those overvalued ones, being hit when rates suddenly climb higher. If US 10-year yields surge by a similar magnitude over the next few days, expect the selloff to worsen as most investors rush for the exit door.
Friday's US non-farm payroll headline number was disappointing. The 199,000 jobs added in December were significantly short of the market's estimate of 450,000, but that won't change the interest rate outlook. The unemployment rate dropped to 3.9%, fast approaching the five-decade low of 3.5%. The decline in unemployment came despite the labor force participation rate holding steady at 61.9%. But it's wages that should be of great concern. Average hourly earnings climbed 0.6% in December and were up 4.7% compared to a year ago. It's good to be paid more when prices increase, but higher wages also suggest that further inflationary pressures need to be controlled sooner rather than later.
The Omicron variant is probably less severe than previous ones, but it could still disrupt supply chains and this has been a significant factor in rising inflation. While these disruptions will eventually ease, prices will take longer to adjust, mainly due to economic behaviour. The longer prices remain elevated, the stickier they become.
Markets are anticipating another 40-year high for US CPI when the figure is released on Wednesday. Consumer prices are expected to have increased 0.4% in December compared to the previous month and 7.1% year-on-year. Another surprise to the upside will possibly put more pressure on bonds, sending yields higher.
Speeches from several Fed speakers this week will also be scrutinised closely for further clues on policy tightening, with Fed Chair Jerome Powell's hearing tomorrow under the spotlight.
A correction of 10% or more in stocks from the peak may occur anytime soon but given there's still a lot of cash on the sidelines and earnings are likely to remain robust, these factors will continue to lead equities higher in the medium term. However, investors need to be prepared for higher volatility ahead.ame.
EURUSD Indecisive but Some Patience Could be Exercised
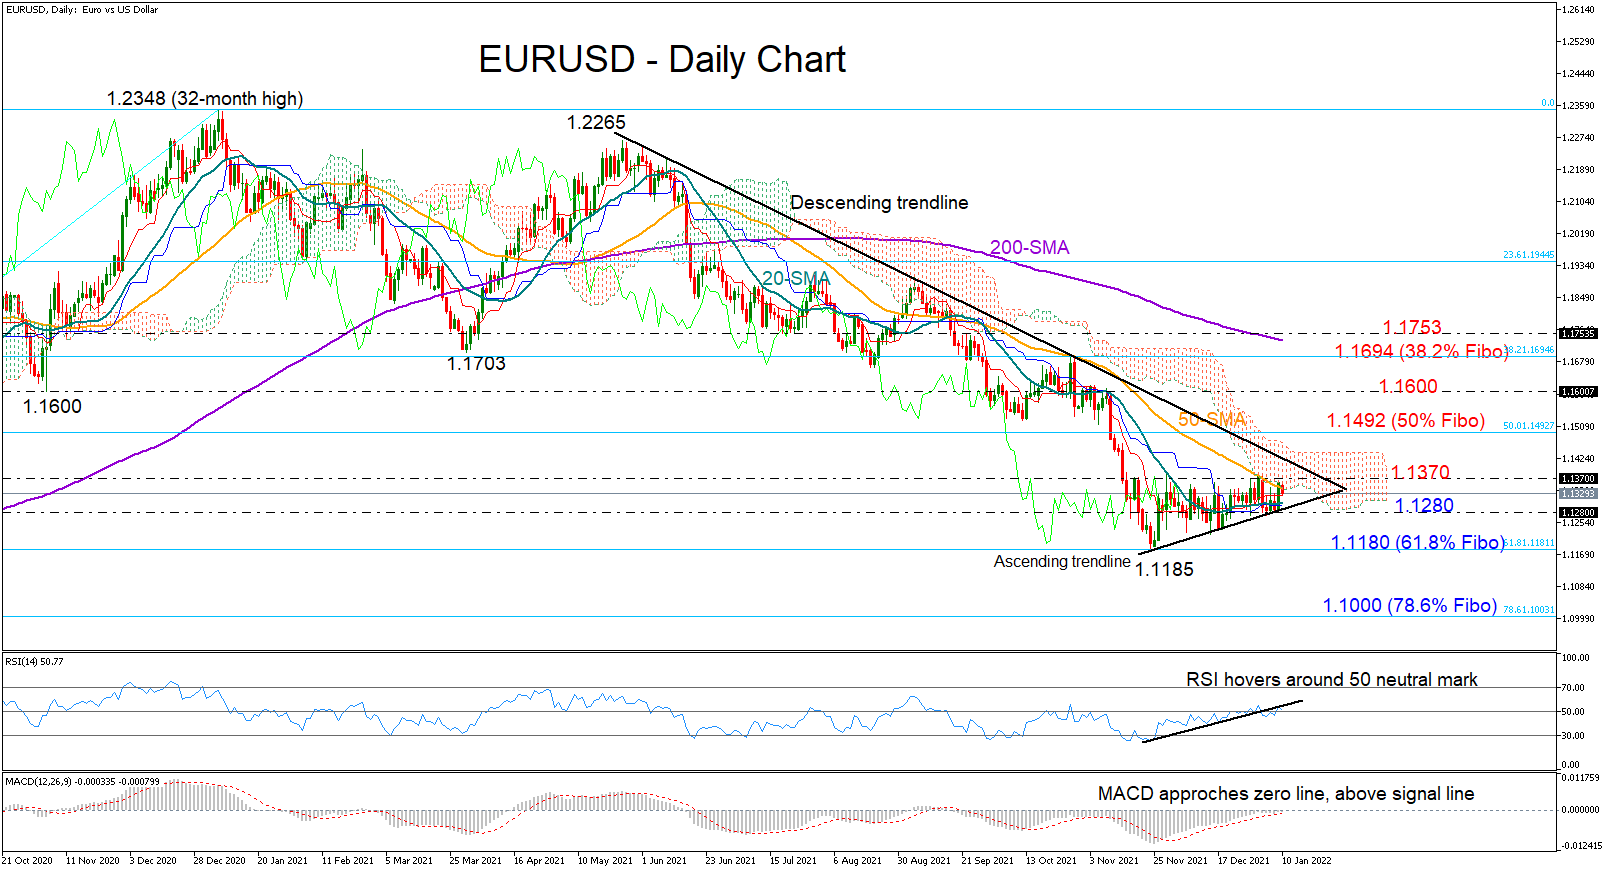
EURUSD resumed its negative momentum during Monday's early European trading hours after barely closing above the restrictive 50-day simple moving average (SMA) on Friday at 1.1359.
As long as the ascending trendline is building the soft upward trajectory in the short-term picture, the focus will remain on the upside. That said, the momentum indicators have not clarified strong bullish signals yet, suggesting that traders could keep behaving carefully for a bit longer. Particularly, the RSI continues to fluctuate around its 50 neutral mark, recently hitting a wall around the support-turned-resistance trendline, while the MACD is struggling to enter the positive territory.
A decisive close above the key 1.1370 – 1.1400 zone, which contains the tough descending trendline from the 1.2265 high could be the prerequisite for driving the price straight up to the 50% Fibonacci retracement of the 2020 rally (1.0636 -1.2348) at 1.1492. A steeper increase could examine the 1.1600 psychological level, a break of which would open the door for the 38.2% Fibonacci of 1.1694 and the 200-day SMA at 1.1753.
Alternatively, a step below the short-term supportive trendline at 1.1280 would dash any hopes for improvement, bringing the 1½-year low of 1.1185 back under the spotlight. Failure to bounce back here could activate fresh selling orders, likely sending the price forcefully towards the 78.6% Fibonacci of 1.1000. If downside pressures persist, the next potential pivot point could develop around the 1.0870 barrier, which has been effective during the end of 2019 to mid-2020.
All in all, although EURUSD is still displaying an unclear technical picture at the moment, the strong footing around the supportive trendline may keep buying interest intact during the coming sessions.
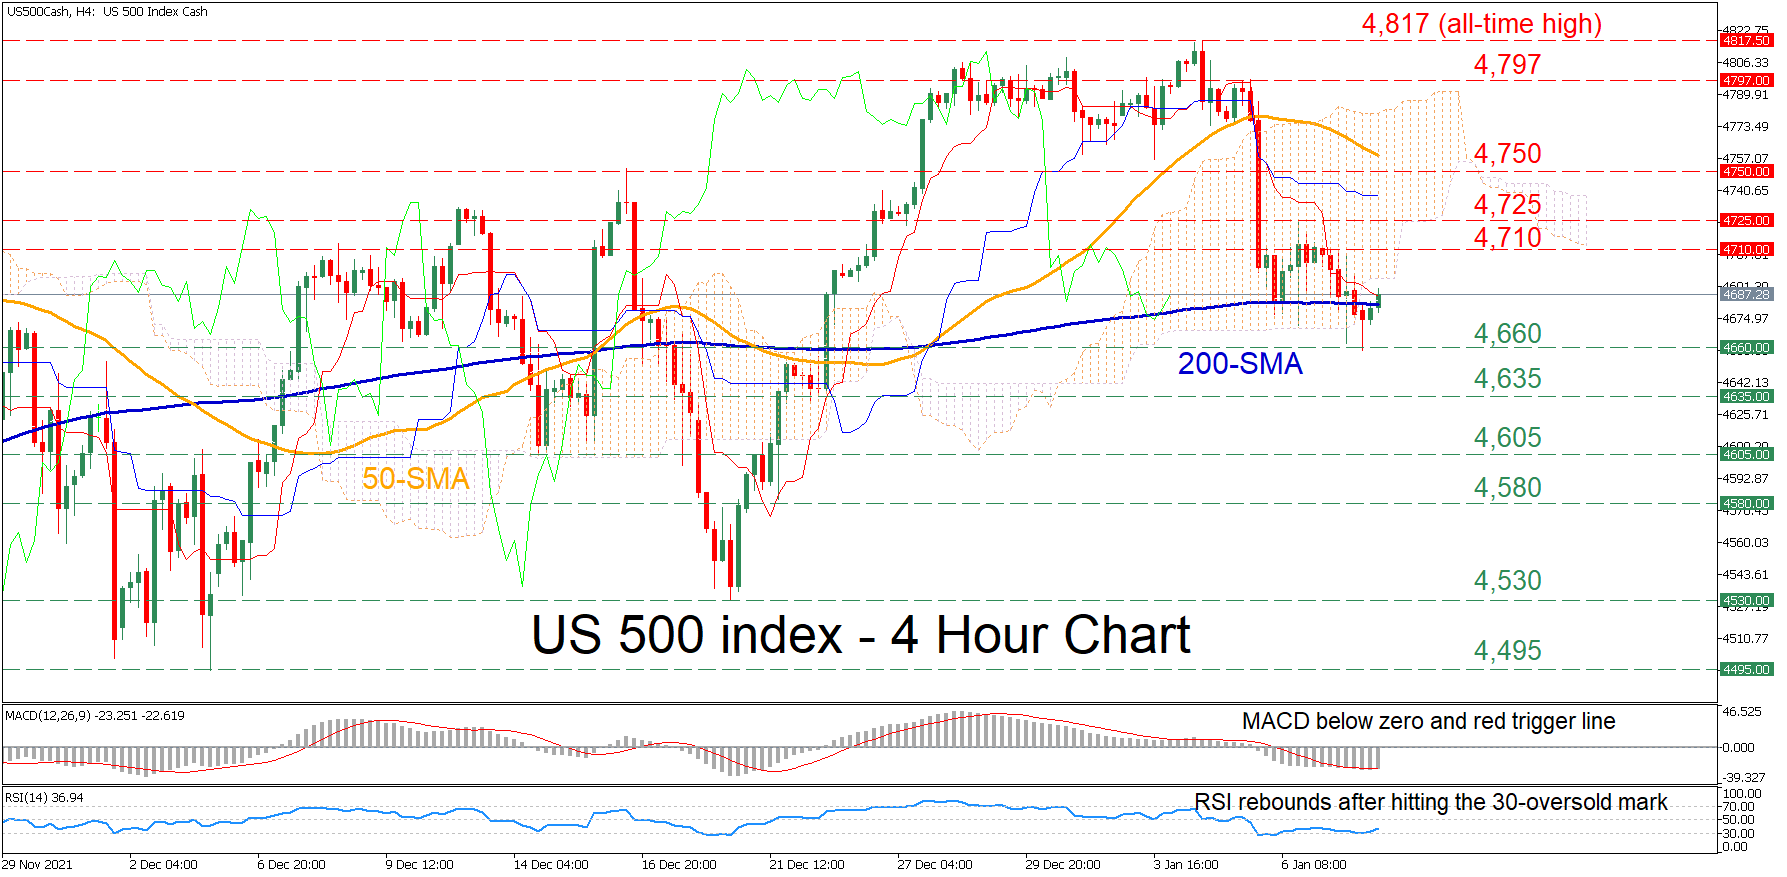
US 500 Index Slips after Posting All-Time High; Bias Bearish
The US 500 stock index (cash) has been plummeting in the four-hour chart since its upside trajectory peaked at the all-time high of 4,817. Moreover, the price crossed beneath both its 50-period simple moving average (SMA) and the Ichimoku cloud, further reinforcing the index’s imminent bearish bias.
The recent pullback is likely to resume as the short-term oscillators indicate that selling forces have taken control. The MACD is found below its red signal line in the negative region, while the RSI is ticking slightly upwards well below its 50-neutral mark.
If the price continues to descend, immediate support might be encountered at the recent low of 4,660. Breaching this barrier, the bears could aim at the 4,635 region before the price dips towards the 4,605 level. Further downside pressure could send the price to test the 4,580 level.
On the flipside, should the dive halt and the price reverses upwards, buyers may meet initial resistance at the recent high of 4,710. Should the bulls conquer this barricade, the spotlight would turn to 4,725 or higher to the 4,750 region. Piercing through these hurdles, the price might charge higher to challenge the 4,797 obstacle.
Overall, the outlook for the US 500 stock index has turned negative in the short term, after the long-term upside move ceased at the record high of 4,817. For that bearish tone to reverse, the price needs to profoundly cross above the 4,797 region.