Sample Category Title
ECB Schnabel: Rising energy prices may require a departure from a looking through policy
ECB Executive Board member Isabel Schnabel warned in a speech on Saturday, "monetary policy, for its part, cannot afford to look through energy price increases if they pose a risk to medium-term price stability."
"This could be the case if prospects of persistently rising energy prices contribute to a deanchoring of inflation expectations, or if underlying price pressures threaten to lift inflation above our 2% target as rising carbon prices and the associated shifts in economic activity boost rather than suppress growth, employment and aggregate demand over the medium term."
AUDUSD Forecasting The Decline After Elliott Wave Double Three Pattern
Hello fellow traders. In this technical blog we’re going to take a quick look at the Elliott Wave charts of AUDUSD Forex Pair published in members area of the Elliottwave-Forecast . As our members know, AUDUSD s is showing lower low sequences in the cycle from the February 25th peak. Recently we got recovery which has unfolded as Elliott Wave Double Three pattern. In further text we’re going to explain the forecast and Elliott Wave Pattern and trading strategy.
Before we take a look at the real market example, let’s explain Elliott Wave Double Three pattern.
Elliott Wave Double Three Pattern
Double three is the common pattern in the market , also known as 7 swing structure. It’s a reliable pattern which is giving us good trading entries with clearly defined invalidation levels.
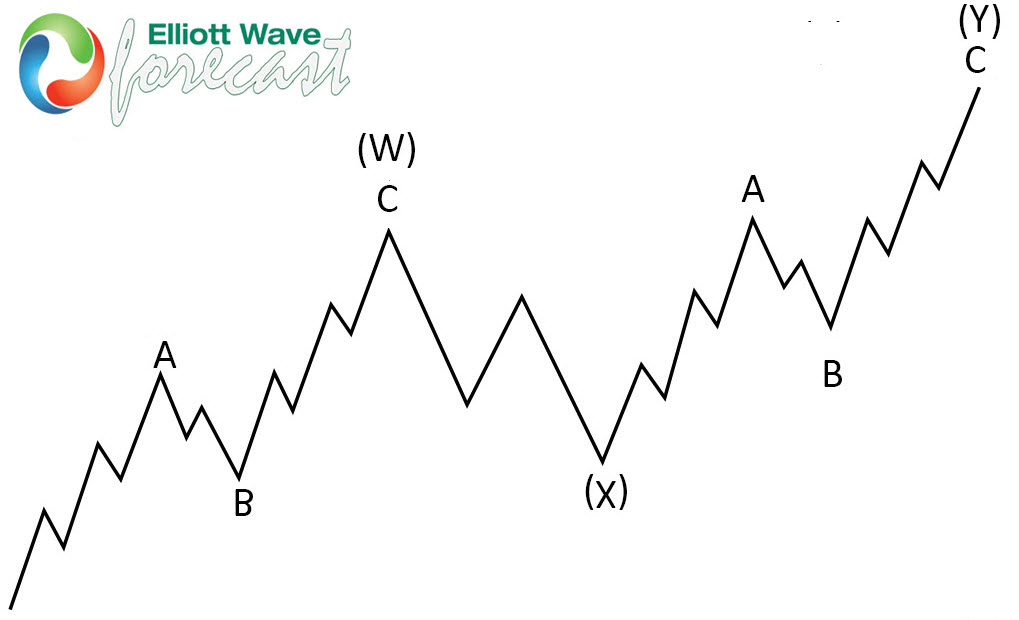
The picture below presents what Elliott Wave Double Three pattern looks like. It has (W),(X),(Y) labeling and 3,3,3 inner structure, which means all of these 3 legs are corrective sequences. Each (W) and (Y) are made of 3 swings , they’re having A,B,C structure in lower degree, or alternatively they can have W,X,Y labeling.
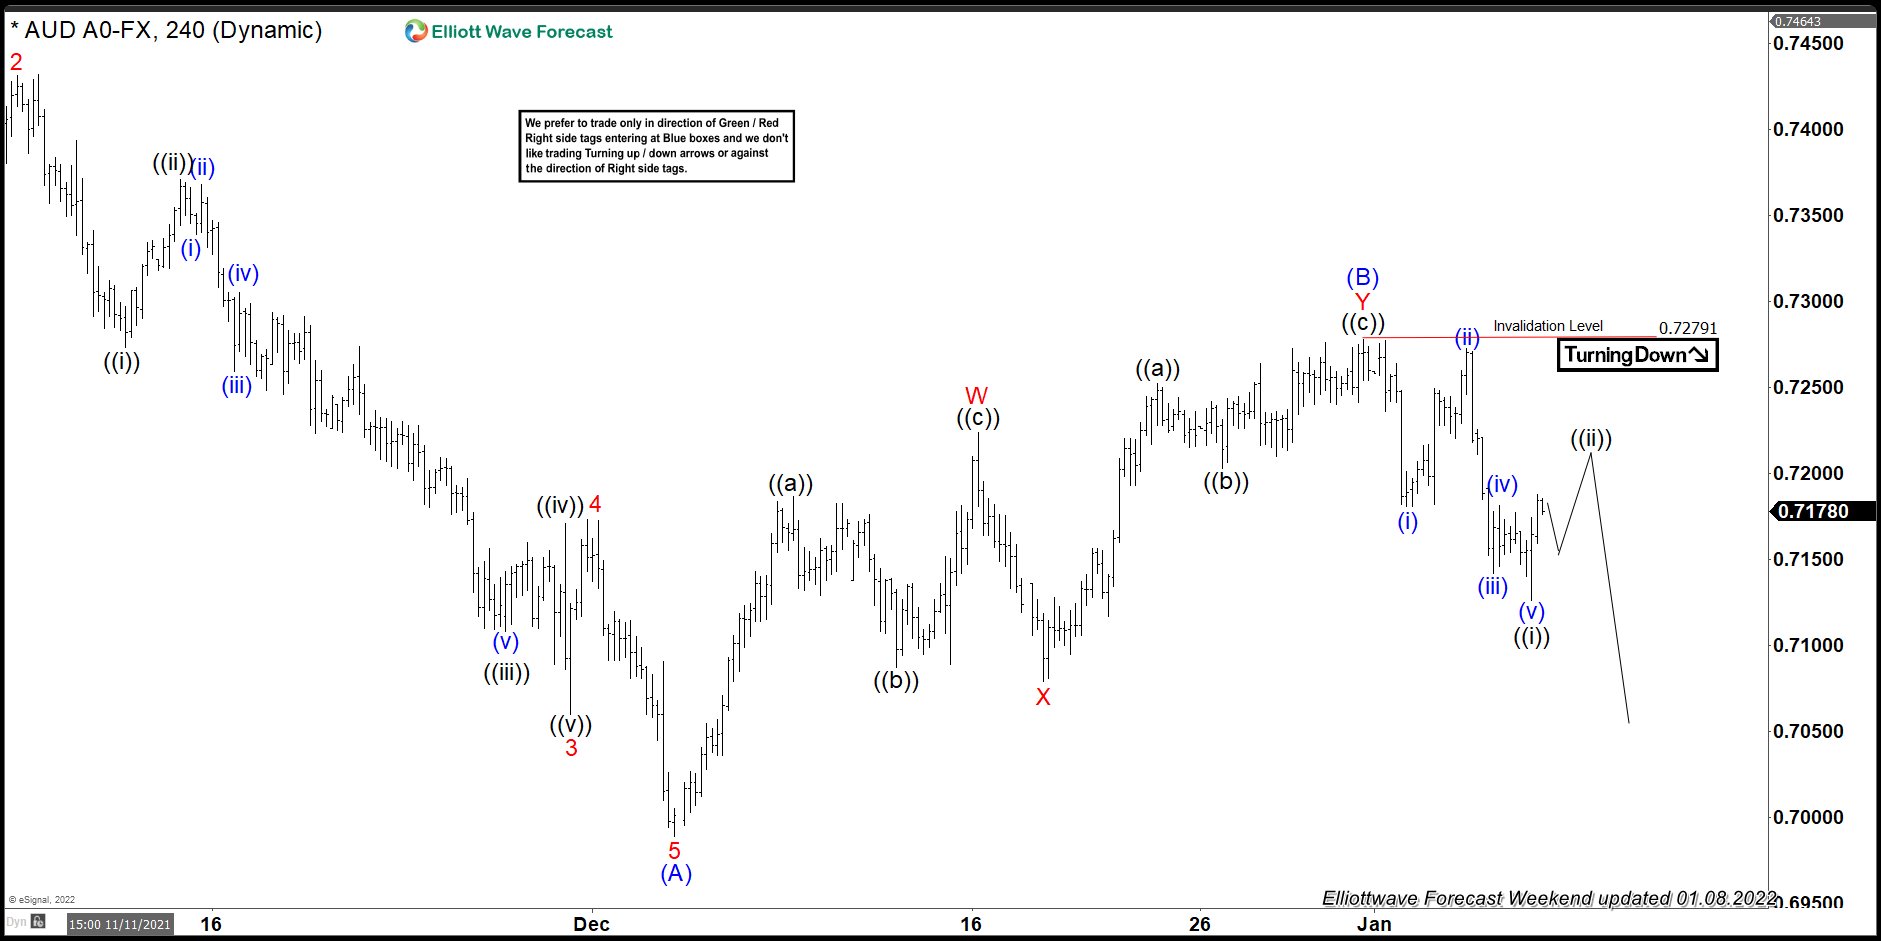
AUDUSD 4 Hour Elliott Wave Analysis 01.02.2022
AUDUSD is giving us (B) blue recovery that is unfolding as Elliott Wave Double Three Pattern. It’s having WXY red inner labeling. The main characteristic of Double Three is that all 3 legs has corrective sequences. First leg Wave W has clear 3 waves structure , Zig Zag ((a))((b))((c)) that ended as trunaction. Then we got 3 waves pull back in ((x)) connector. Currently the pair is doing last leg up Y red h is also unfolding as Zig Zag Pattern. Recovery has already reached extremes at 0.7278 area , and turn can happen any moment. incomplete at the moment. We recommend members to avoid buying, while favoring the short side as far as the price holds below 1.618 fib ext 0.7402 level and as far as 0.7559 pivot holds.
AUDUSD 4 Hour Elliott Wave Analysis 01.08.2022
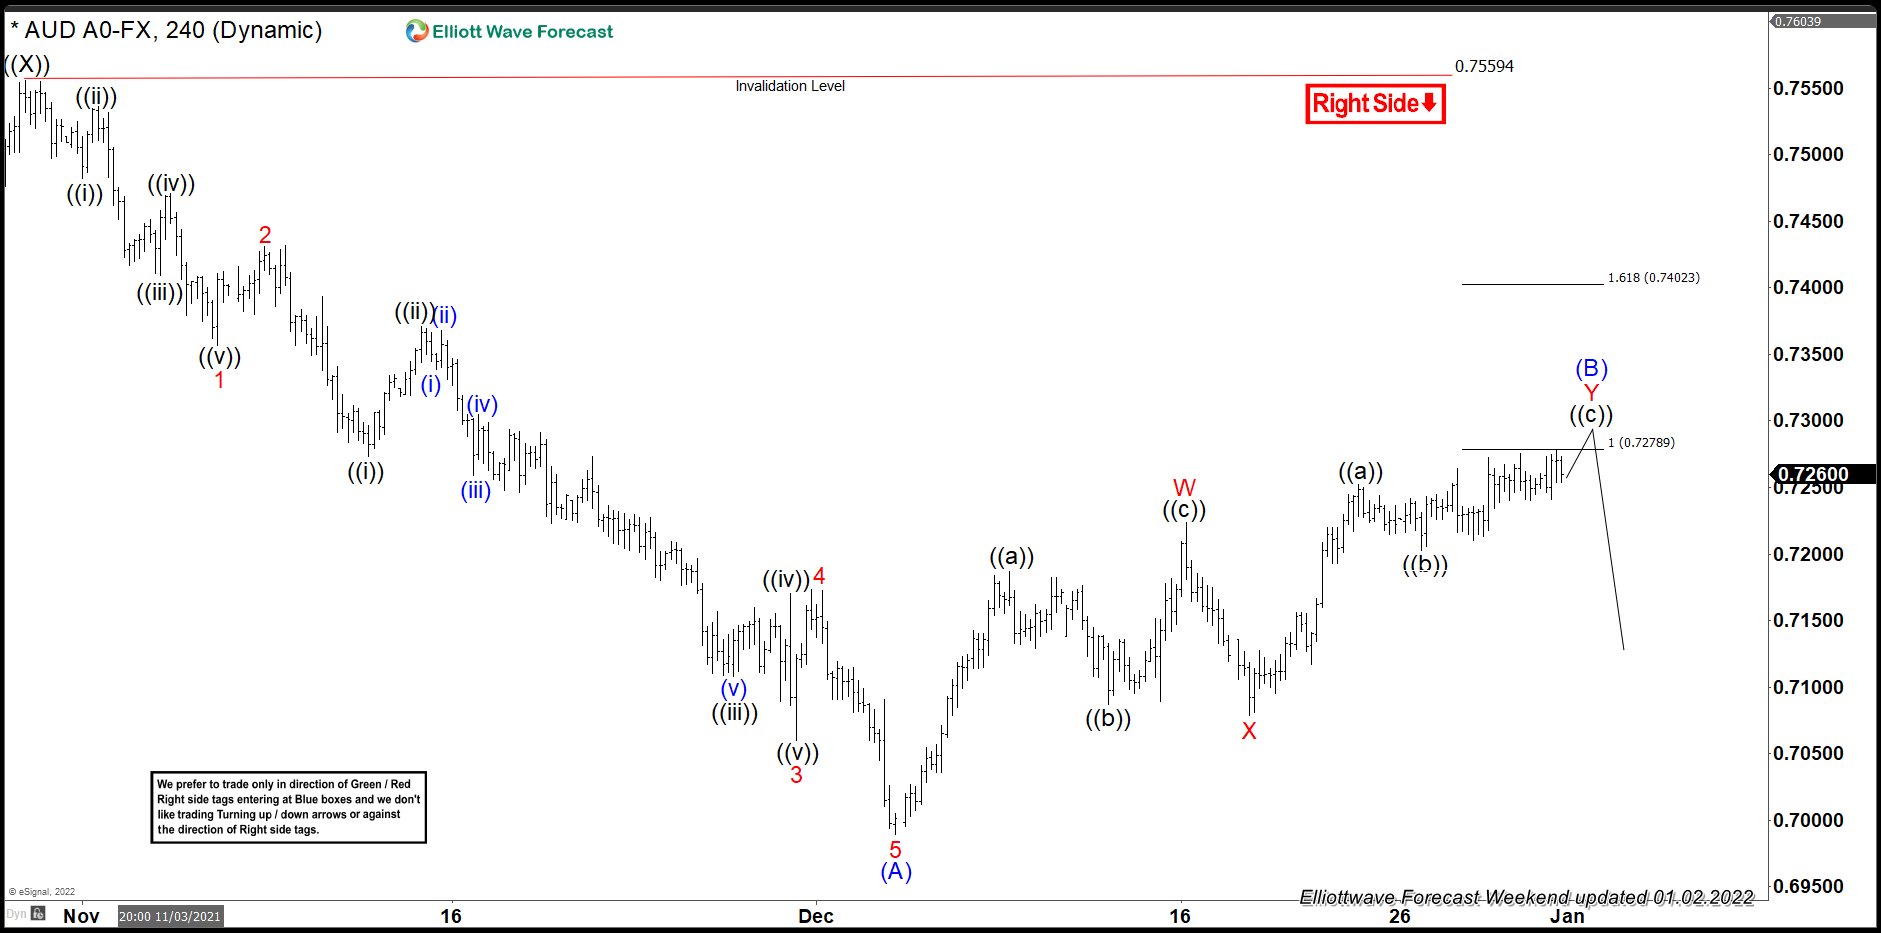
Sellers appeared at the equal legs area 0.72789 and we got good reaction from there. The decline from the blue box reached 50 fibs against the X connector, as a result members who took short positions should be enjoying profits in a Risk Free positions. At the moment we see wave (B) blue recovery completed at 0.7279. Decline from the 0.7279 high looks like 5 waves which increases chances next leg down is in progress. Currently we can be doing 3 waves bounce against the mentioned high. However if pivot at 0.7279 gives up we could see larger recovery.
Keep in mind that market is dynamic and presented view could have changed in the mean time. You can check most recent charts in the membership area of the site. Best instruments to trade are those having incomplete bullish or bearish swings sequences. We put them in Sequence Report and best among them are shown in the Live Trading Room.
Technical Outlook and Review
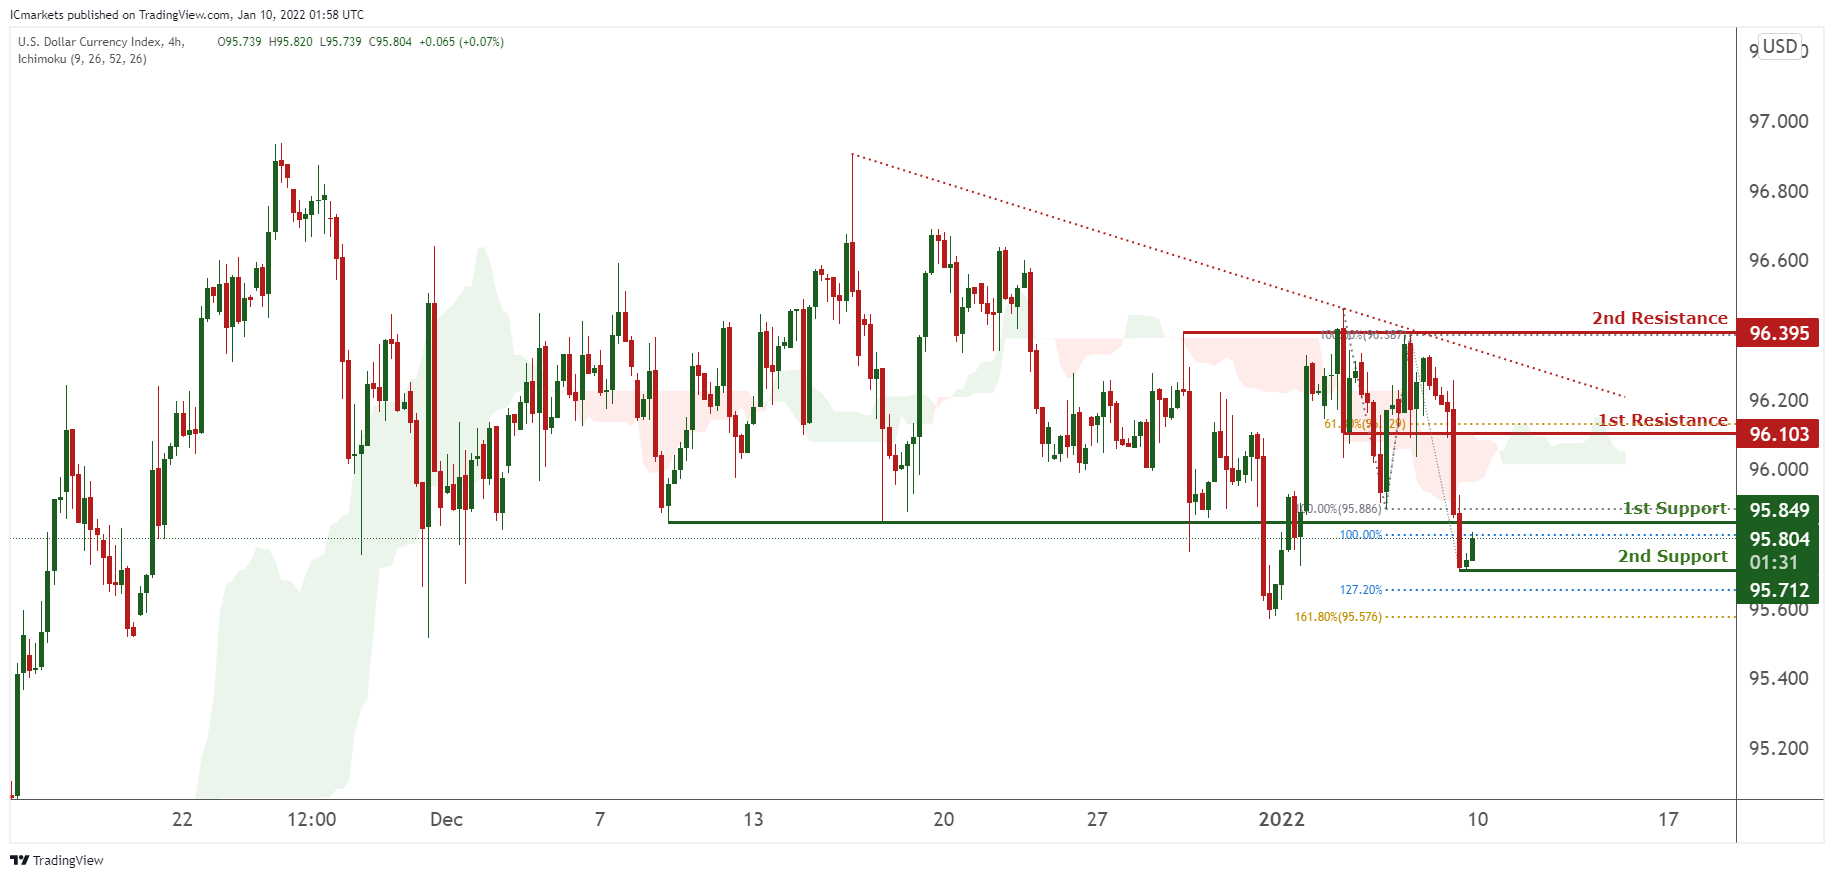
DXY:
On the H4 timeframe, prices are on bearish momentum and abiding to our bearish trendline. We would expect a bounce from our 1st support at 95.804 in line with 100% Fibonacci extension and 100% Fibonacci retracement towards our 1st resistance at 96.103 in line with 61.8% Fibonacci extension. Ichimoku clouds are forecasting a bullish upward movement.
Areas of consideration:
H4 time frame, 1st resistance at 96.103
H4 time frame, 1st support at 95.804
XAU/USD (GOLD):
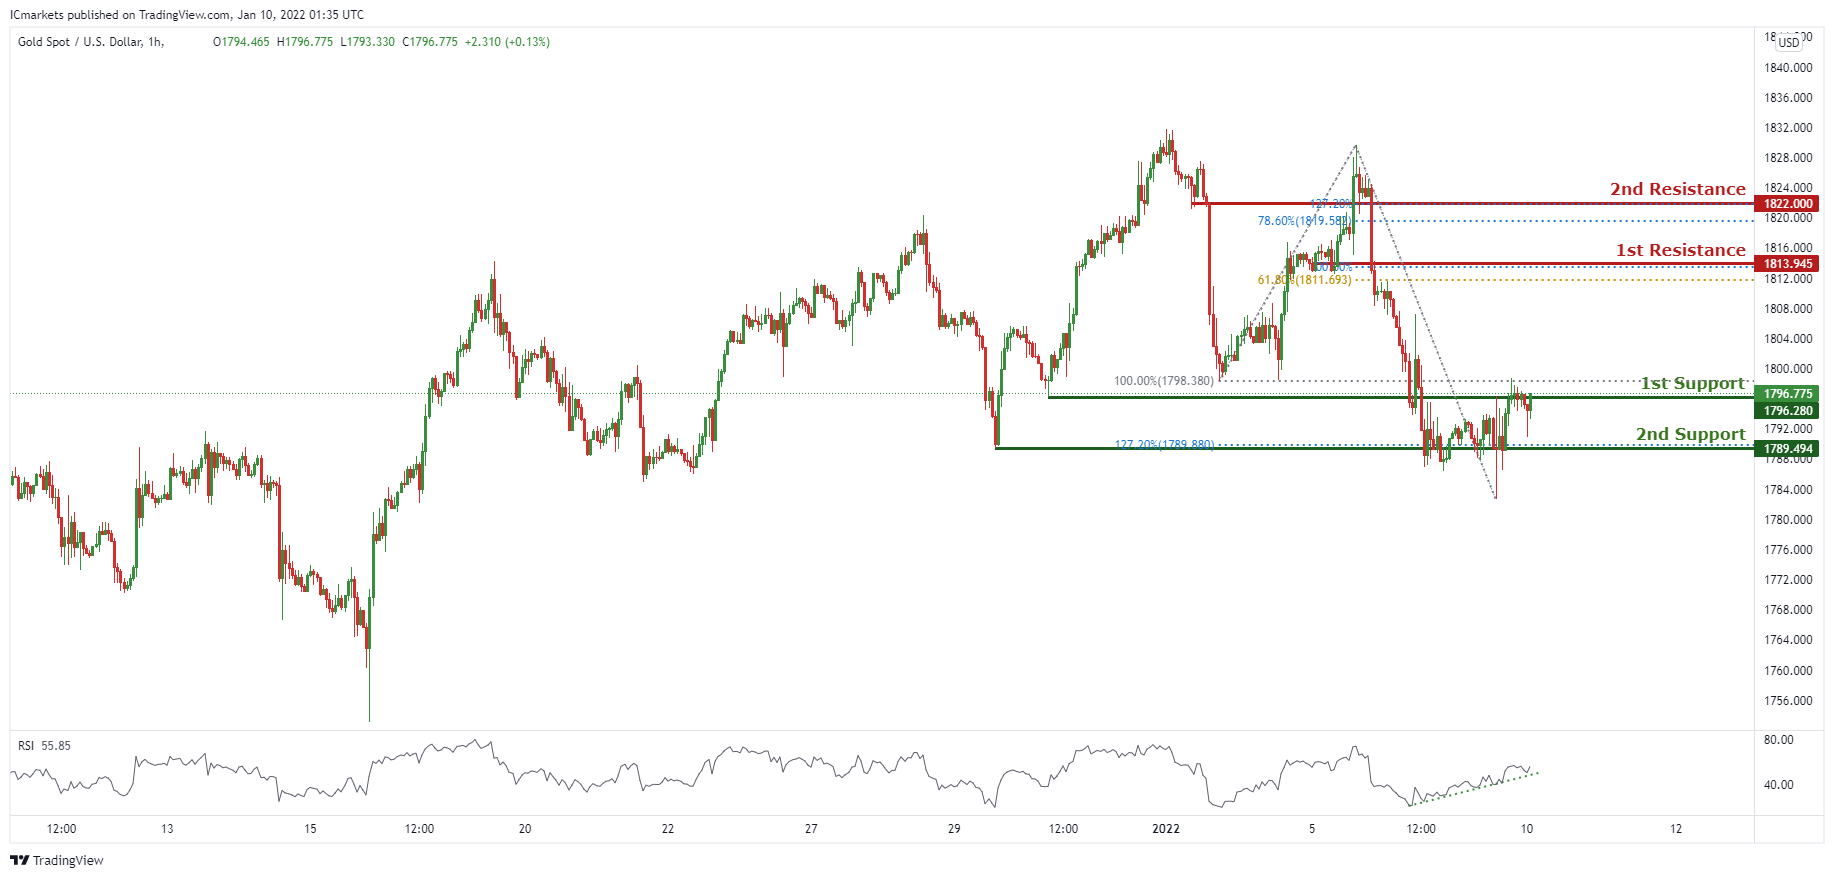
On the H4 chart, prices are consolidating sideways. We see potential for prices to climb from our 1st support at 1796.280 in line with 100% Fibonacci retracement towards our 1st resistance at 1813.945 in line with 100% Fibonacci extension and 61.8% Fibonacci retracement. RSI is also portraying bullish momentum. Alternatively, breaking our 1st support will find prices dipping towards our 2nd support at 1789.494 in line with 127.2% Fibonacci extension.
Areas of consideration:
H4 1st support at 1796.280
H4 1st resistance at 1813.945
GBP/USD
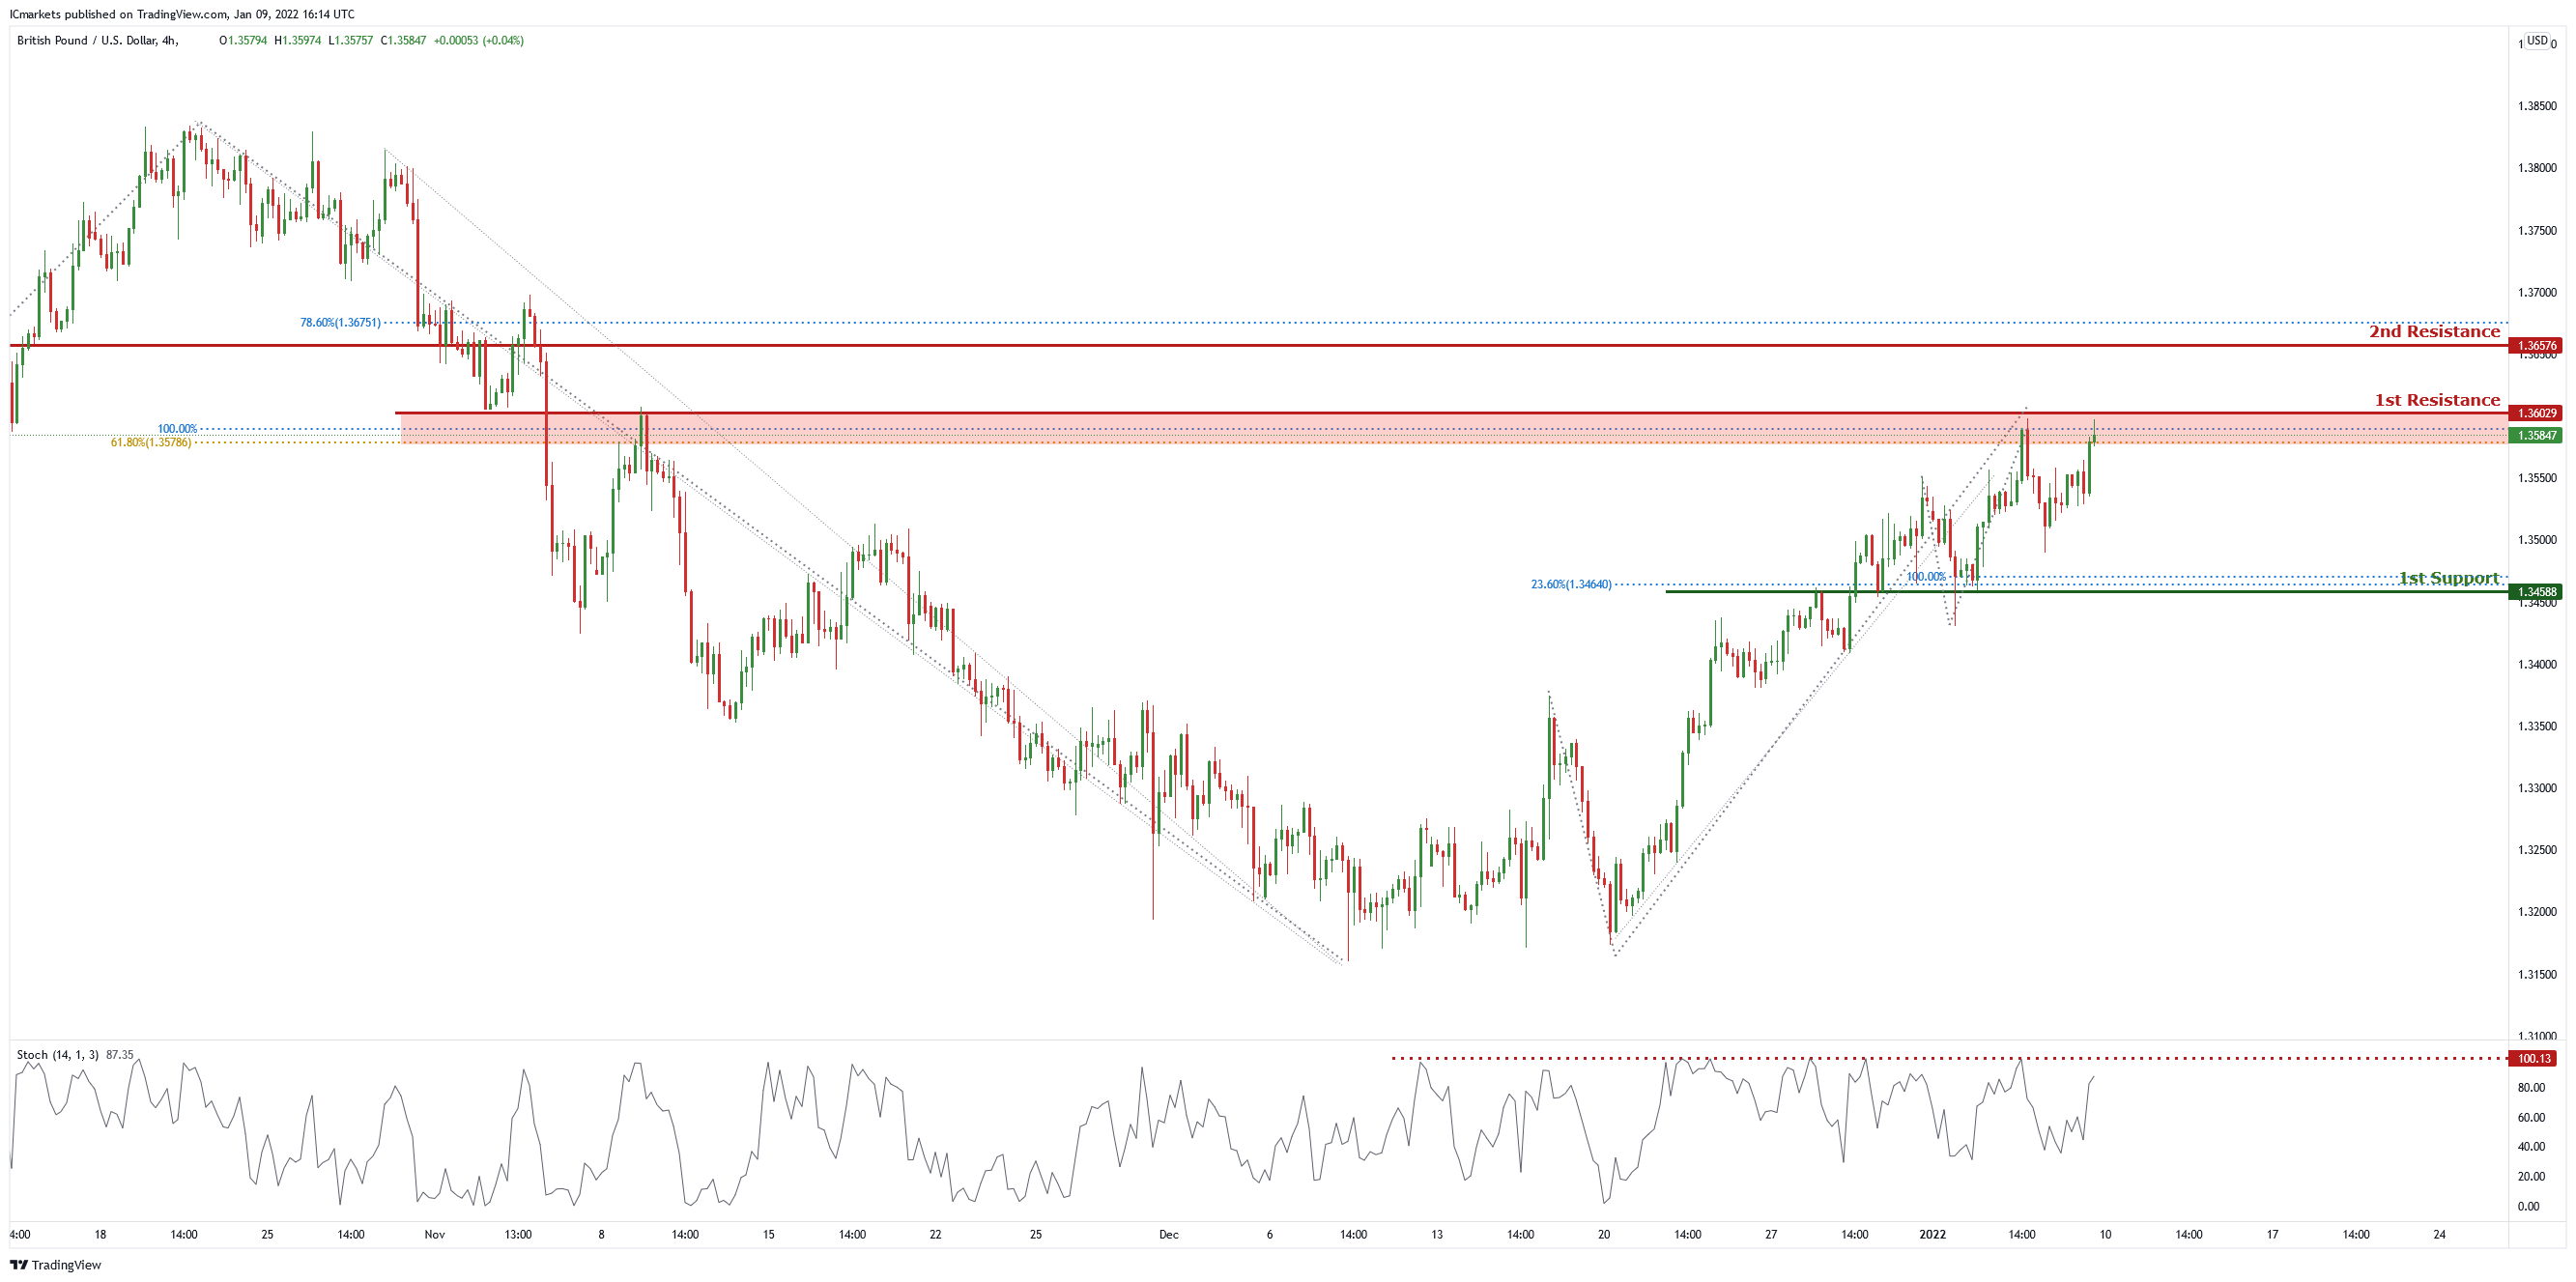
On the H4 chart, price is at the first resistance level of 1.36029 which is also 100% Fibonacci projection and 61.8% Fibonacci retracement. Price can potentially dip to the 1st support level of 1.34588 which is also 23.6% Fibonacci retracement and 100% Fibonacci projection. Our bearish bias is supported by the stochastic indicator as it is near resistance level.
Areas of consideration:
H4 1st resistance at 1.36029
H4 1st support 1.34588
USD/CHF
In reference to last week’s analysis, prices are on bearish momentum and abiding to our descending trendline and price is moving nicely to the 1st Support. .We can expect price to continue to drop from 1st Resistance in line with 38.2% Fibonacci retracement and graphical overlap resistance towards 1st Support in line with 61.8% Fibonacci retracement and 127.2% Fibonacci projection. Our bearish bias is further supported by the stochastic indicator where the %K line is at the resistance level.
Areas of consideration:
Watch 1st Support at 0.91409
Watch 1st Resistance at 0.91966

EUR/USD :
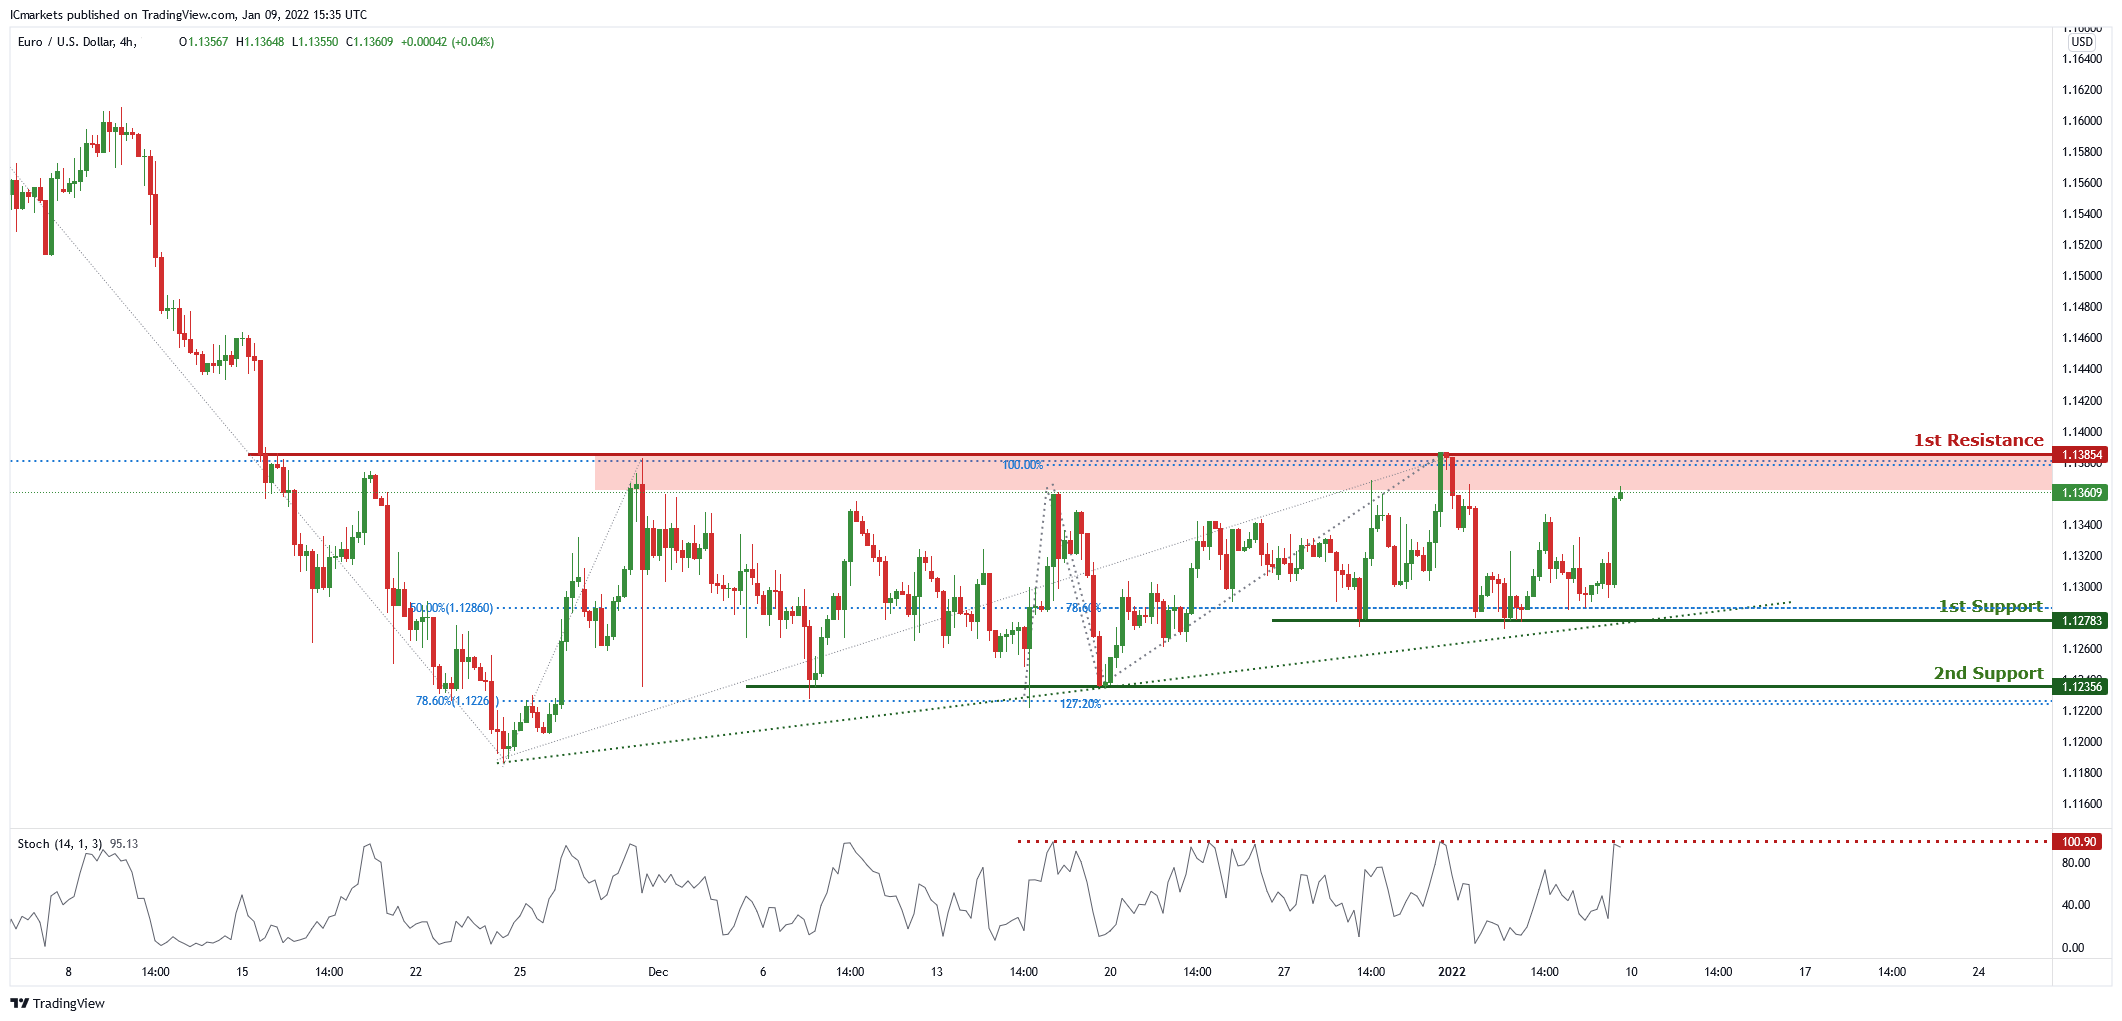
On the H4 chart, price is abiding by an ascending trendline and is near 1st resistance level of 1.13854 which is also 100% Fibonacci projection and 38.2% Fibonacci retracement. Price can potentially dip to the 1st support level of 1.12783 which is also 50% Fibonacci retracement and 78.6% Fibonacci projection. Our bearish bias is supported by the stochastic indicator as it is near resistance level.
Areas of consideration :
H4 1st support at 1.12783
H4 1st resistance at 1.13854
USD/JPY
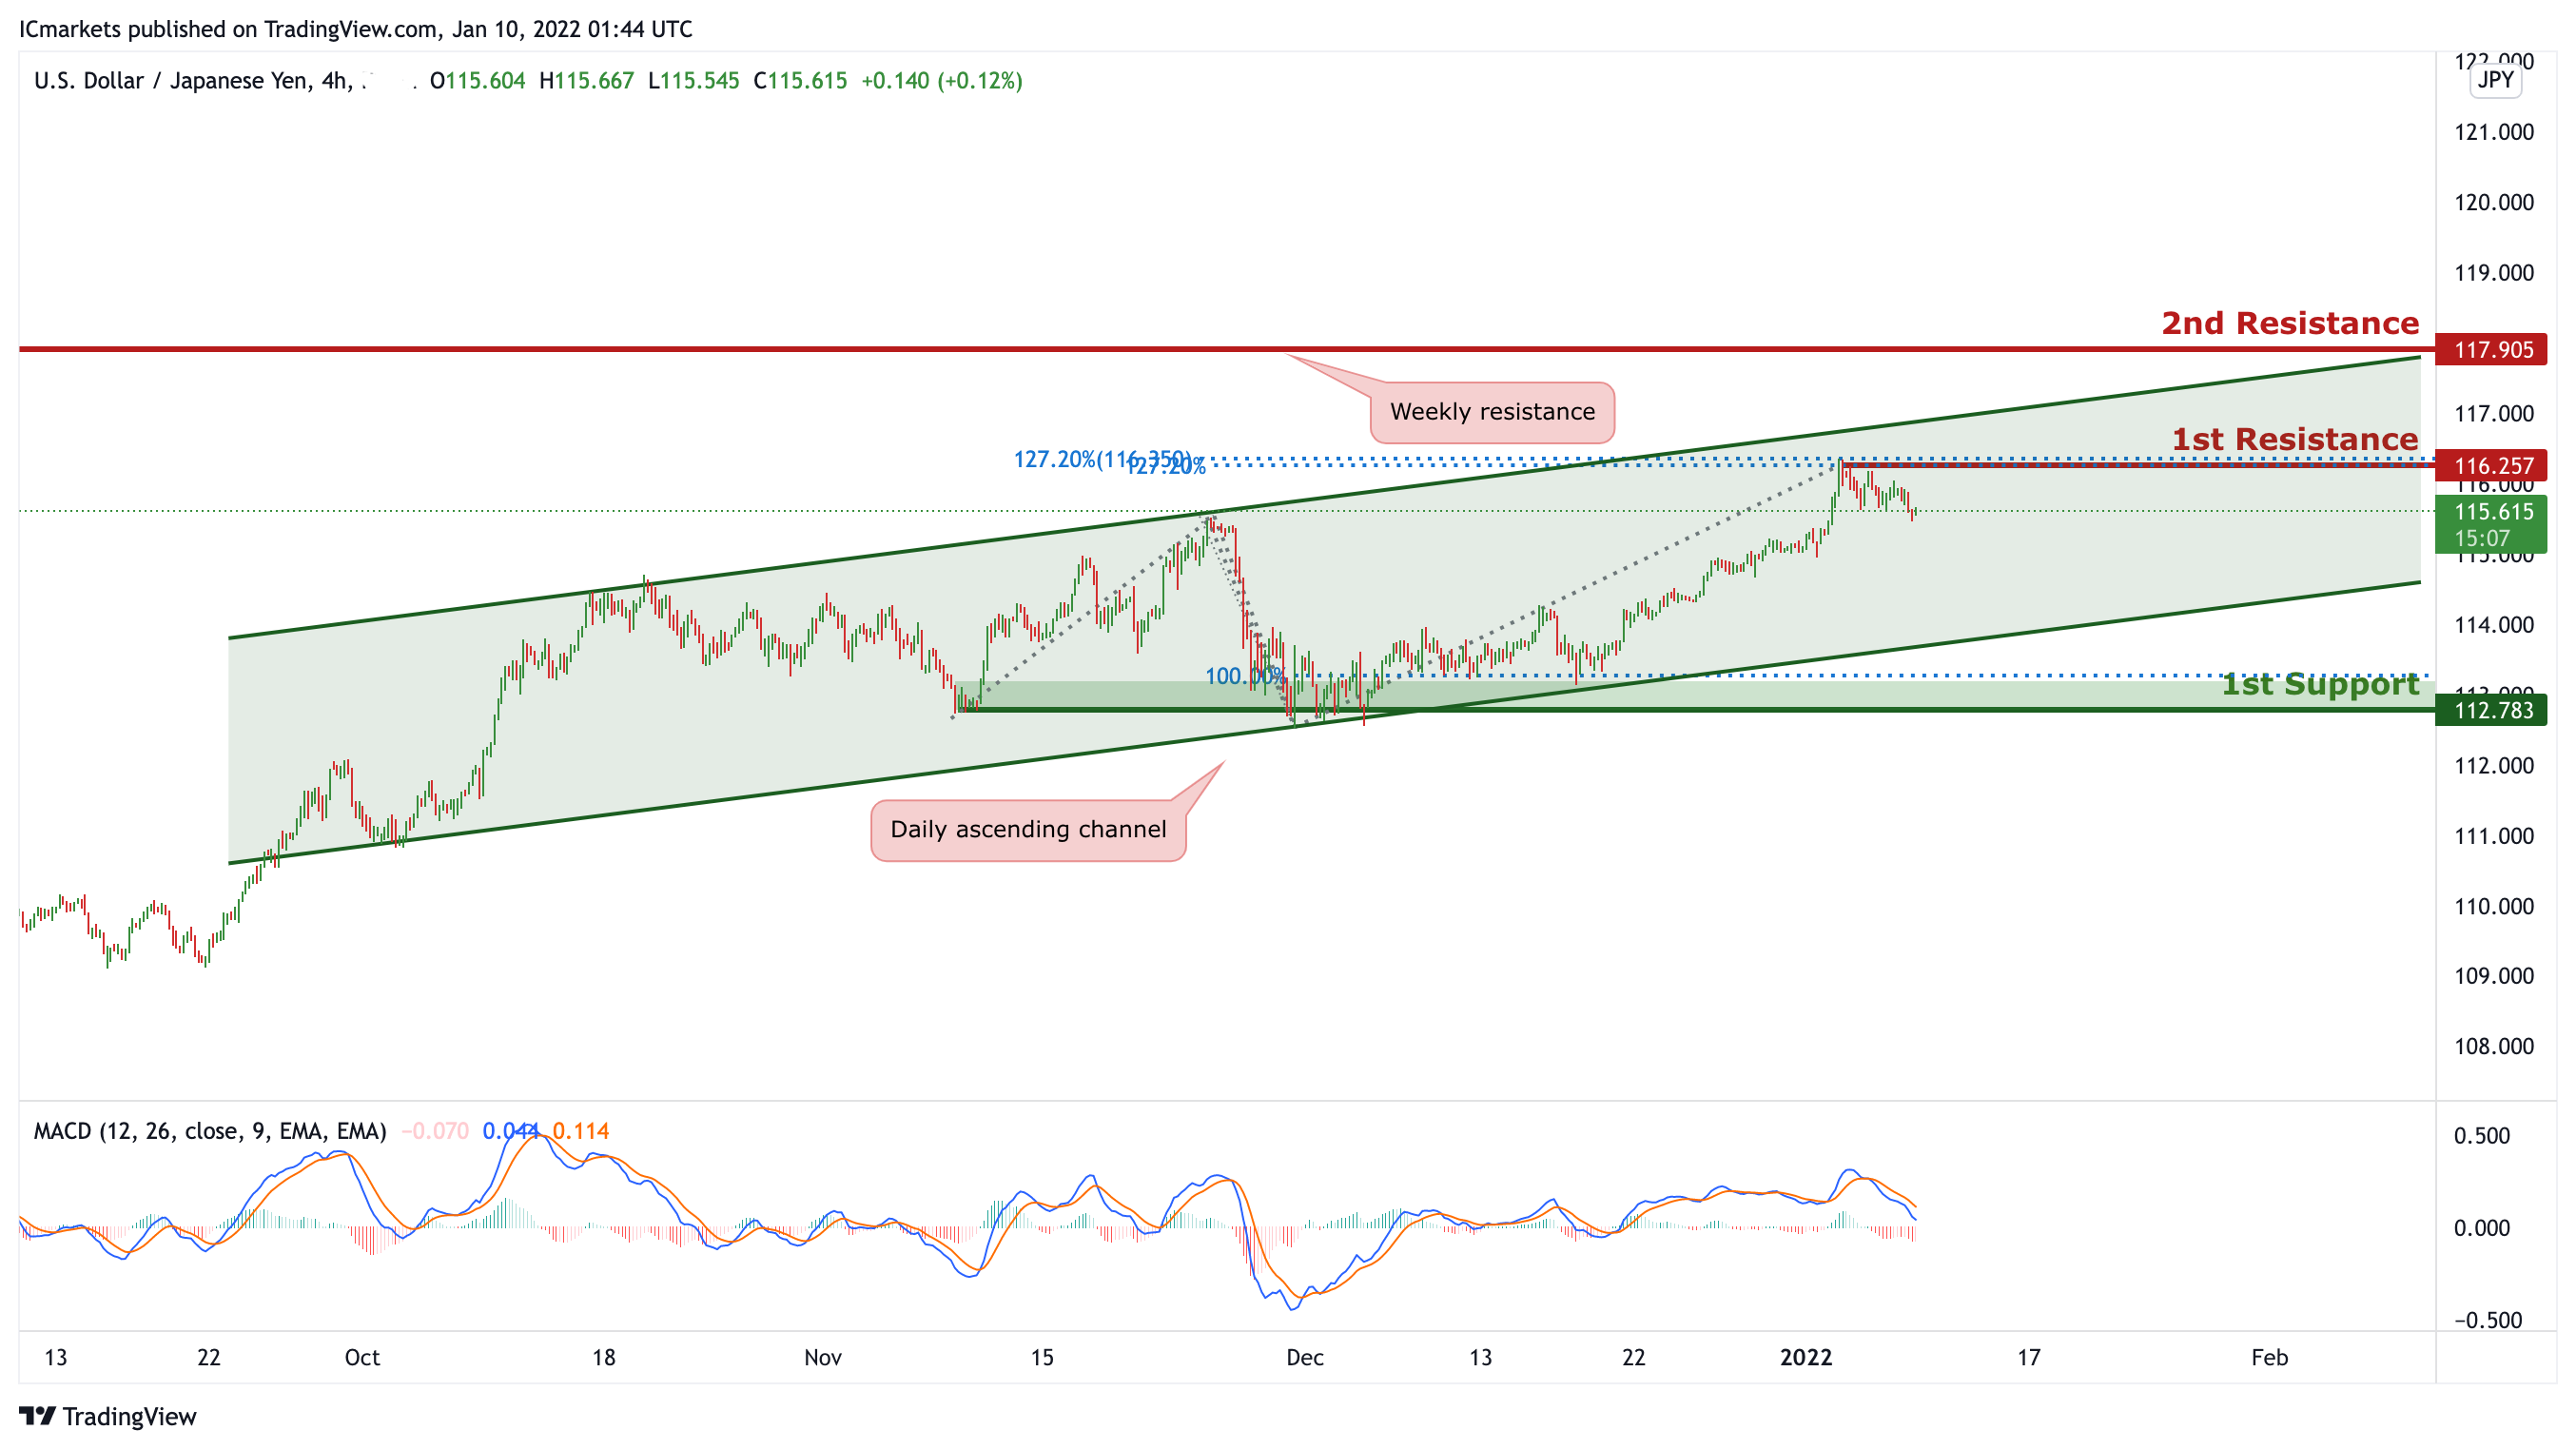
On the H4 timeframe, is abiding to the ascending channel on the daily, signifying an overall bullish momentum. However, we can expect price to make a short-term bearish drop from 1st Resistance in line with 127.2% Fibonacci projection and 127.2% Fibonacci extension towards 1st Support in line with 100% Fibonacci projection. Our short-term bearish bias is further supported by the MACD indicator where the signal line is above the MACD line.
Areas of consideration:
H4 1st resistance level 116.257
H4 1st support level 112.783
AUD/USD:
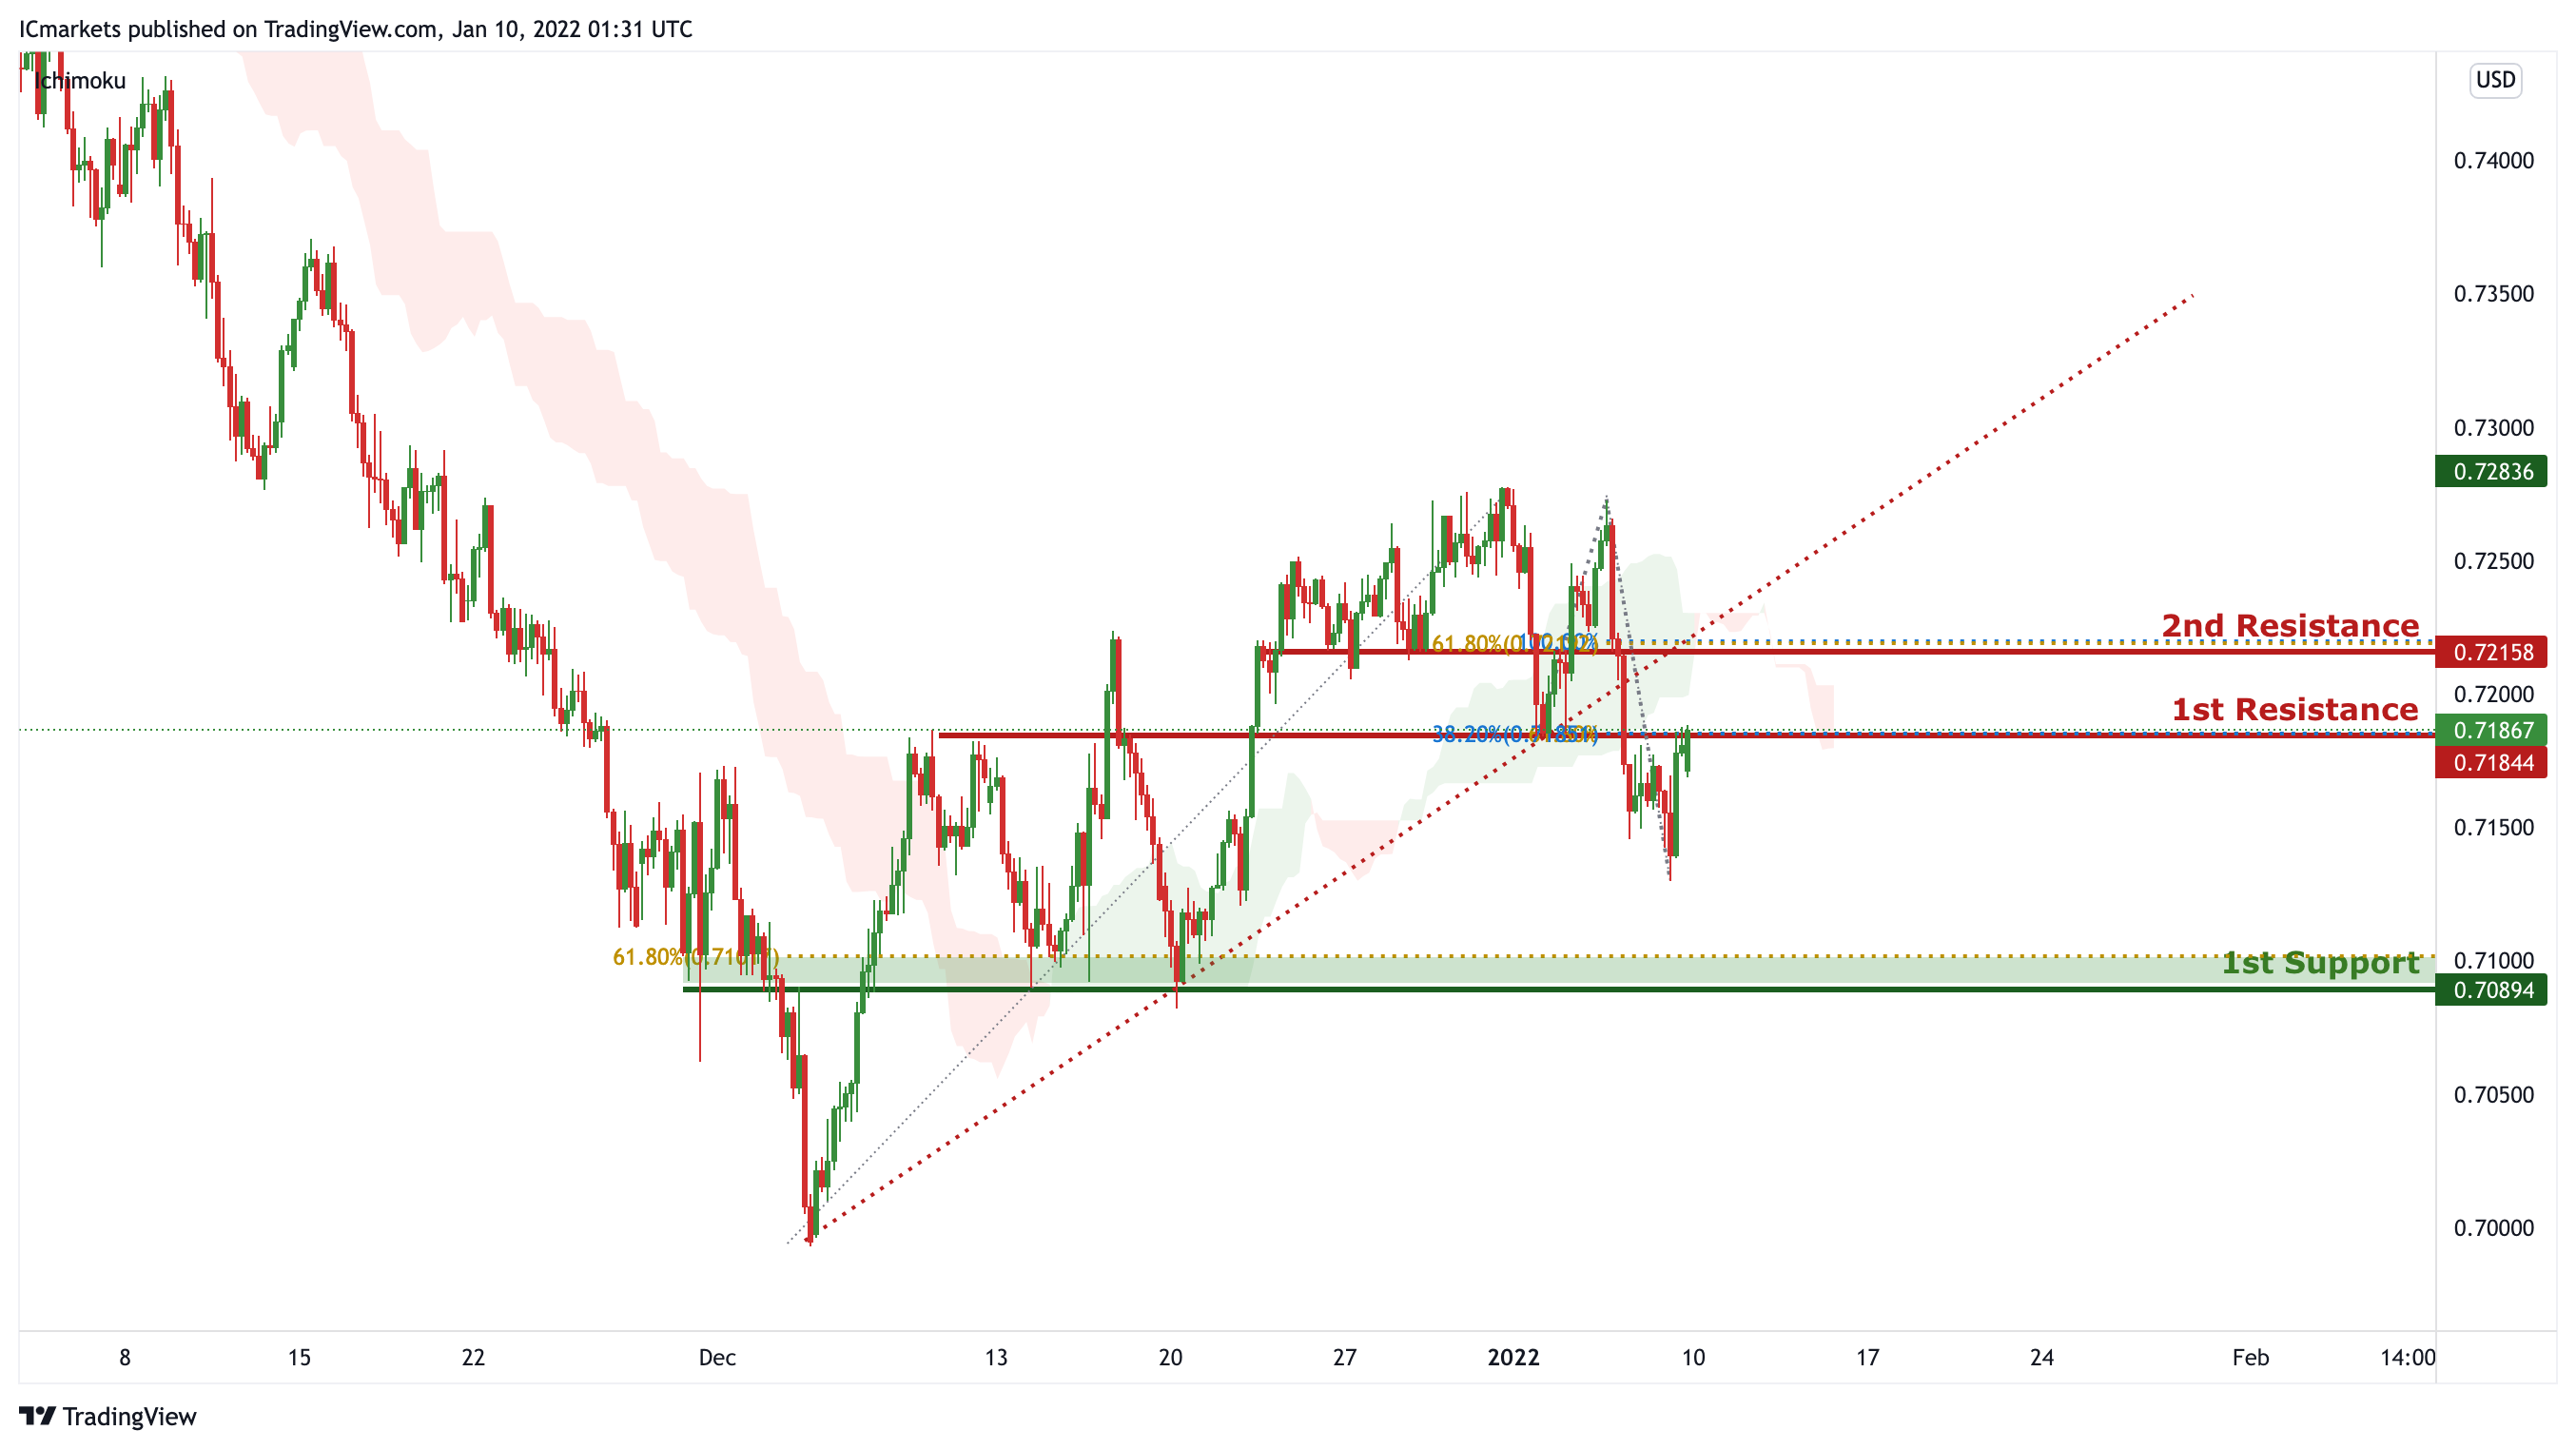
On the H4, orice broke out of the ascending trendline support, signifying a bearish momentum. We can expect price to drop from 1st Resistance in line with 38.2% Fibonacci retracement and 61.8% Fibonacci projection towards 1st Support in line with 61.8% Fibonacci retracement. Our bearish bias is further supported by the price holding below the Ichimoku cloud.
Areas of consideration:
H4 1st Support level 0.70894
H4 1st resistance level 0.71844
NZD/USD:
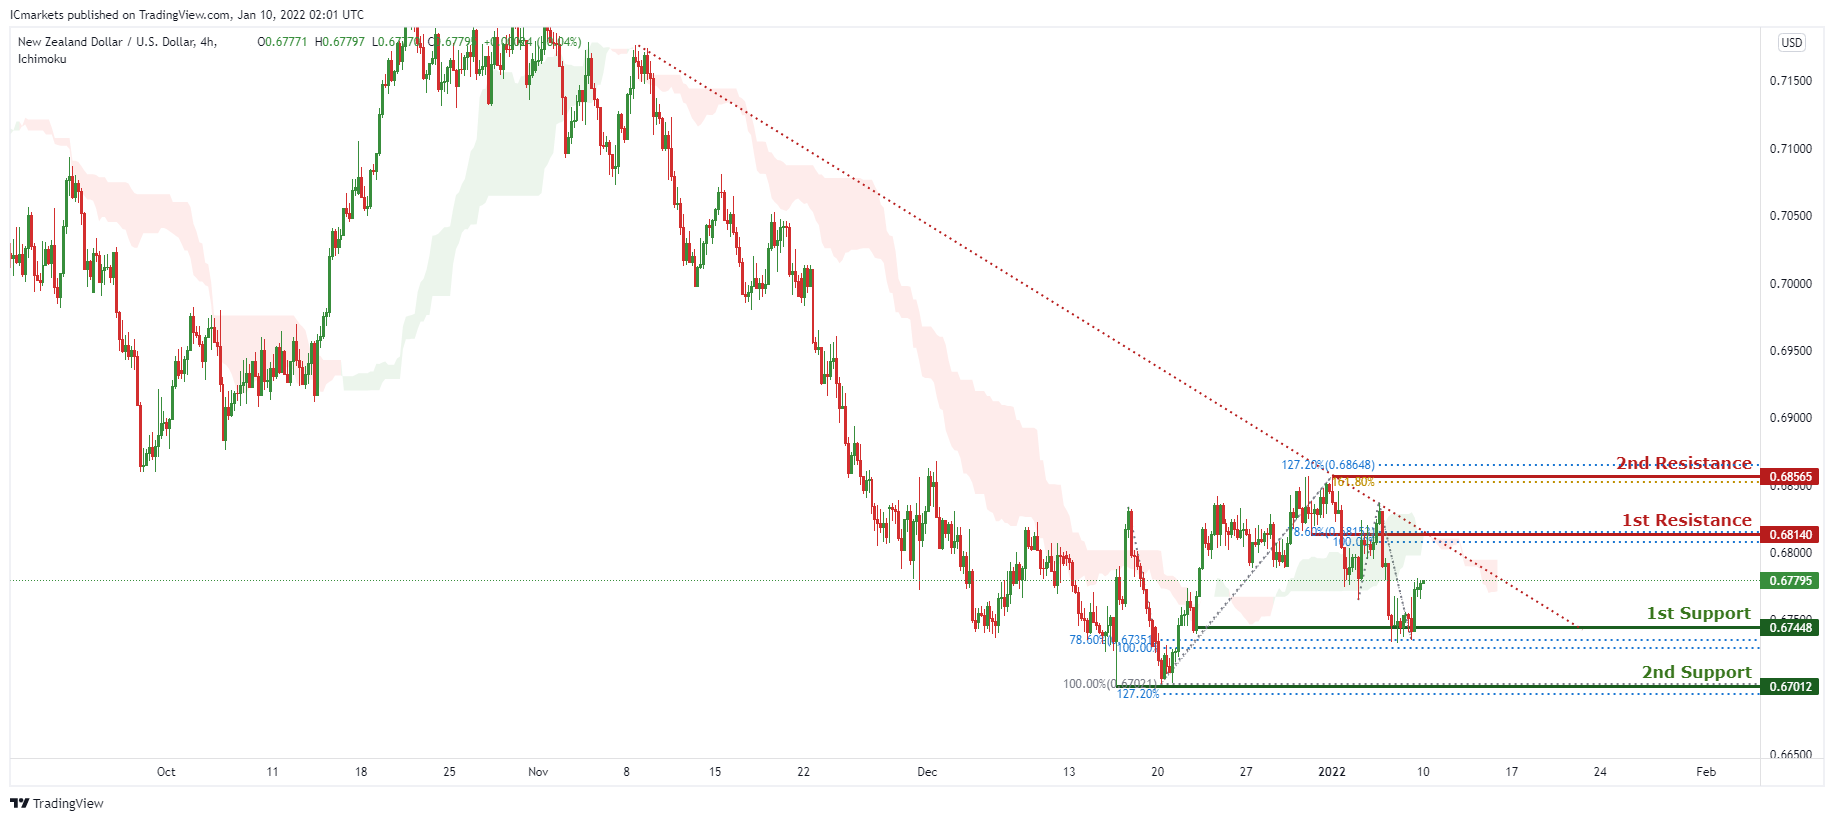
On the H4 timeframe, prices are on bearish momentum and abiding to our bearish trendline. We see potential for prices to bounce from our 1st resistance at 0.68140 in line with 100% Fibonacci extension and 78.6% Fibonacci retracement towards our 1st support at 0.67448 in line with 78.6% Fibonacci retracements and 100% Fibonacci extension. Our bias is further supported by ichimoku clouds forecasting the dip. If prices break our 1st support, prices can potentially dip towards our 2nd support at 0.67012 in line with 127.2% Fibonacci extensions and 100% Fibonacci retracement.
Areas of consideration:
H4 time frame, 1st resistance at 0.68140
H4 time frame, 1st support at 0.6744
USD/CAD:
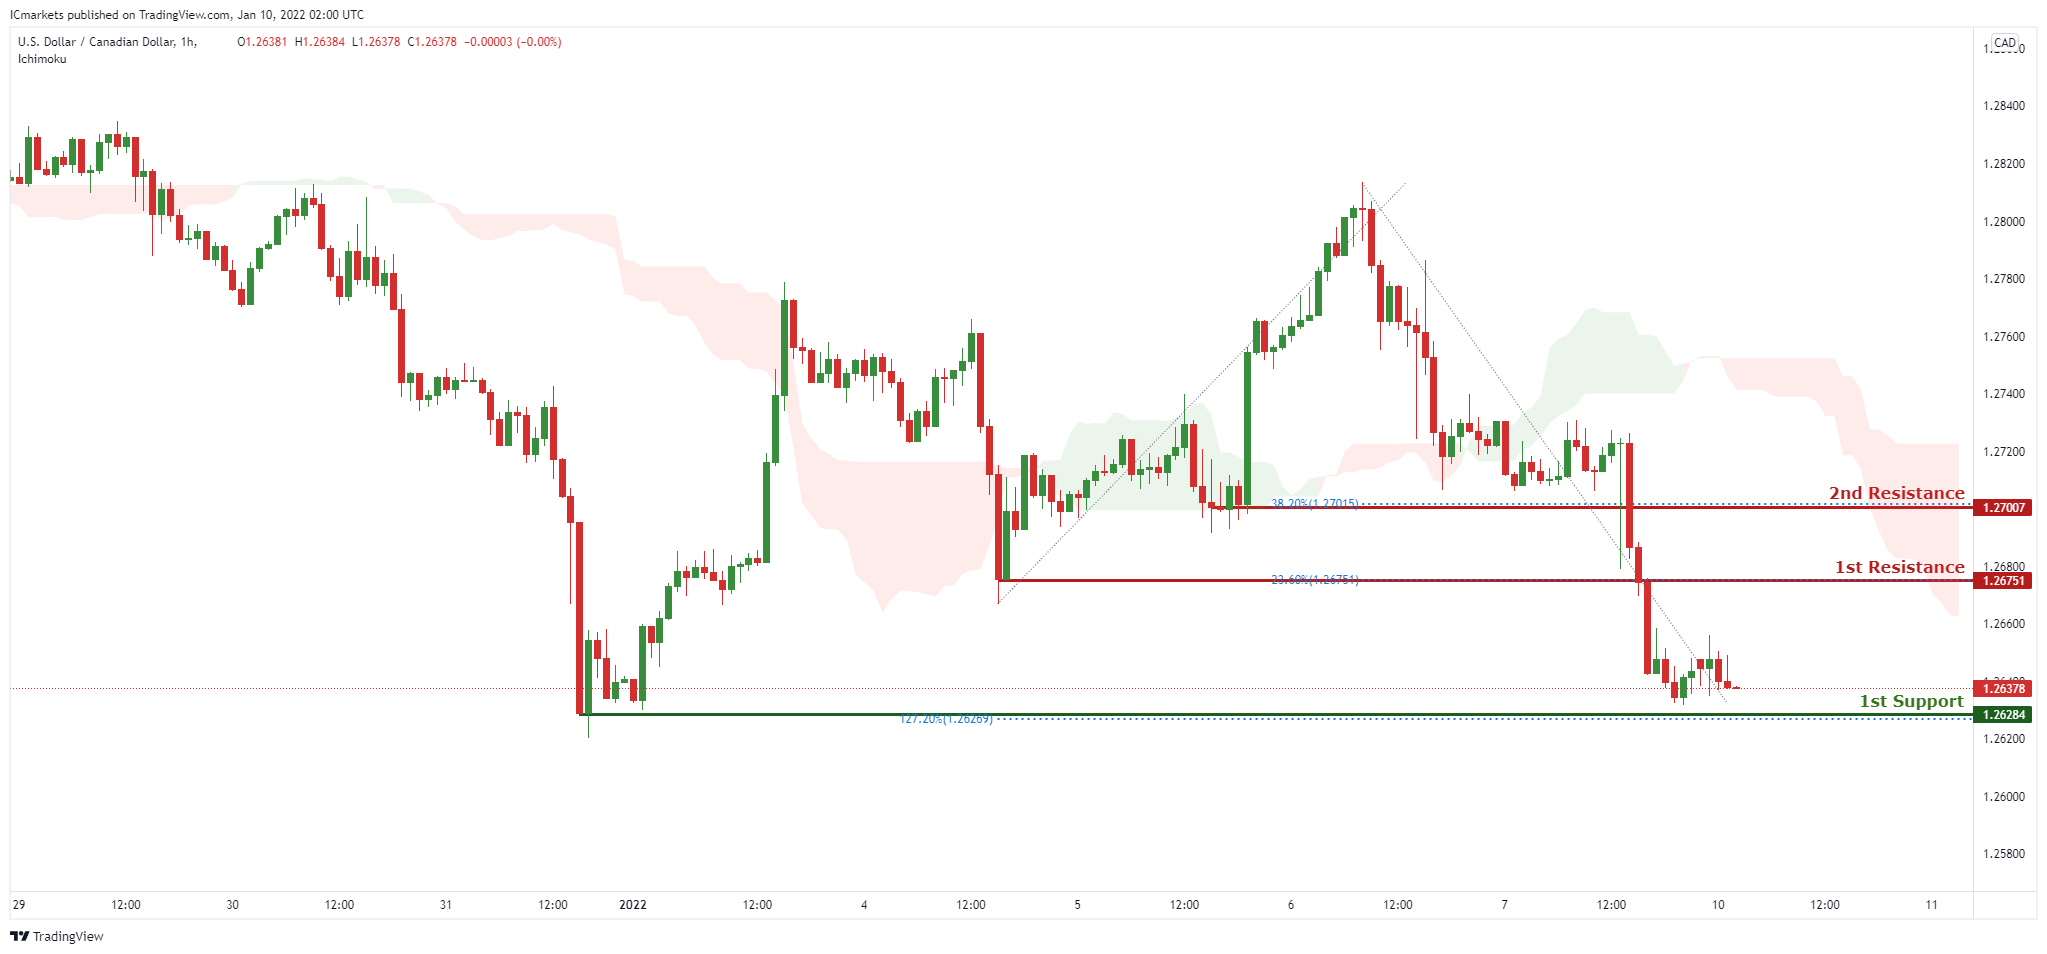
On the H1, with price moving below the ichimoku cloud, we have a bearish bias that price will drop from our 1st resistance at 1.26751 which is in line with horizontal overlap resistance and 23.6% Fibonacci retracement to 1st support at 1.26284, which is in line with horizontal swing low support and 127.2% fibonacci extension. Alternatively, price may break 1st resistance structure and head for 2nd resistance at 1.27007, which coincides with horizontal overlap resistance and 38.2% Fibonacci retracement.
Areas of consideration:
H4 time frame, 1st support at 1.26284
H4 time frame, 1st resistance at 1.26751
OIL:
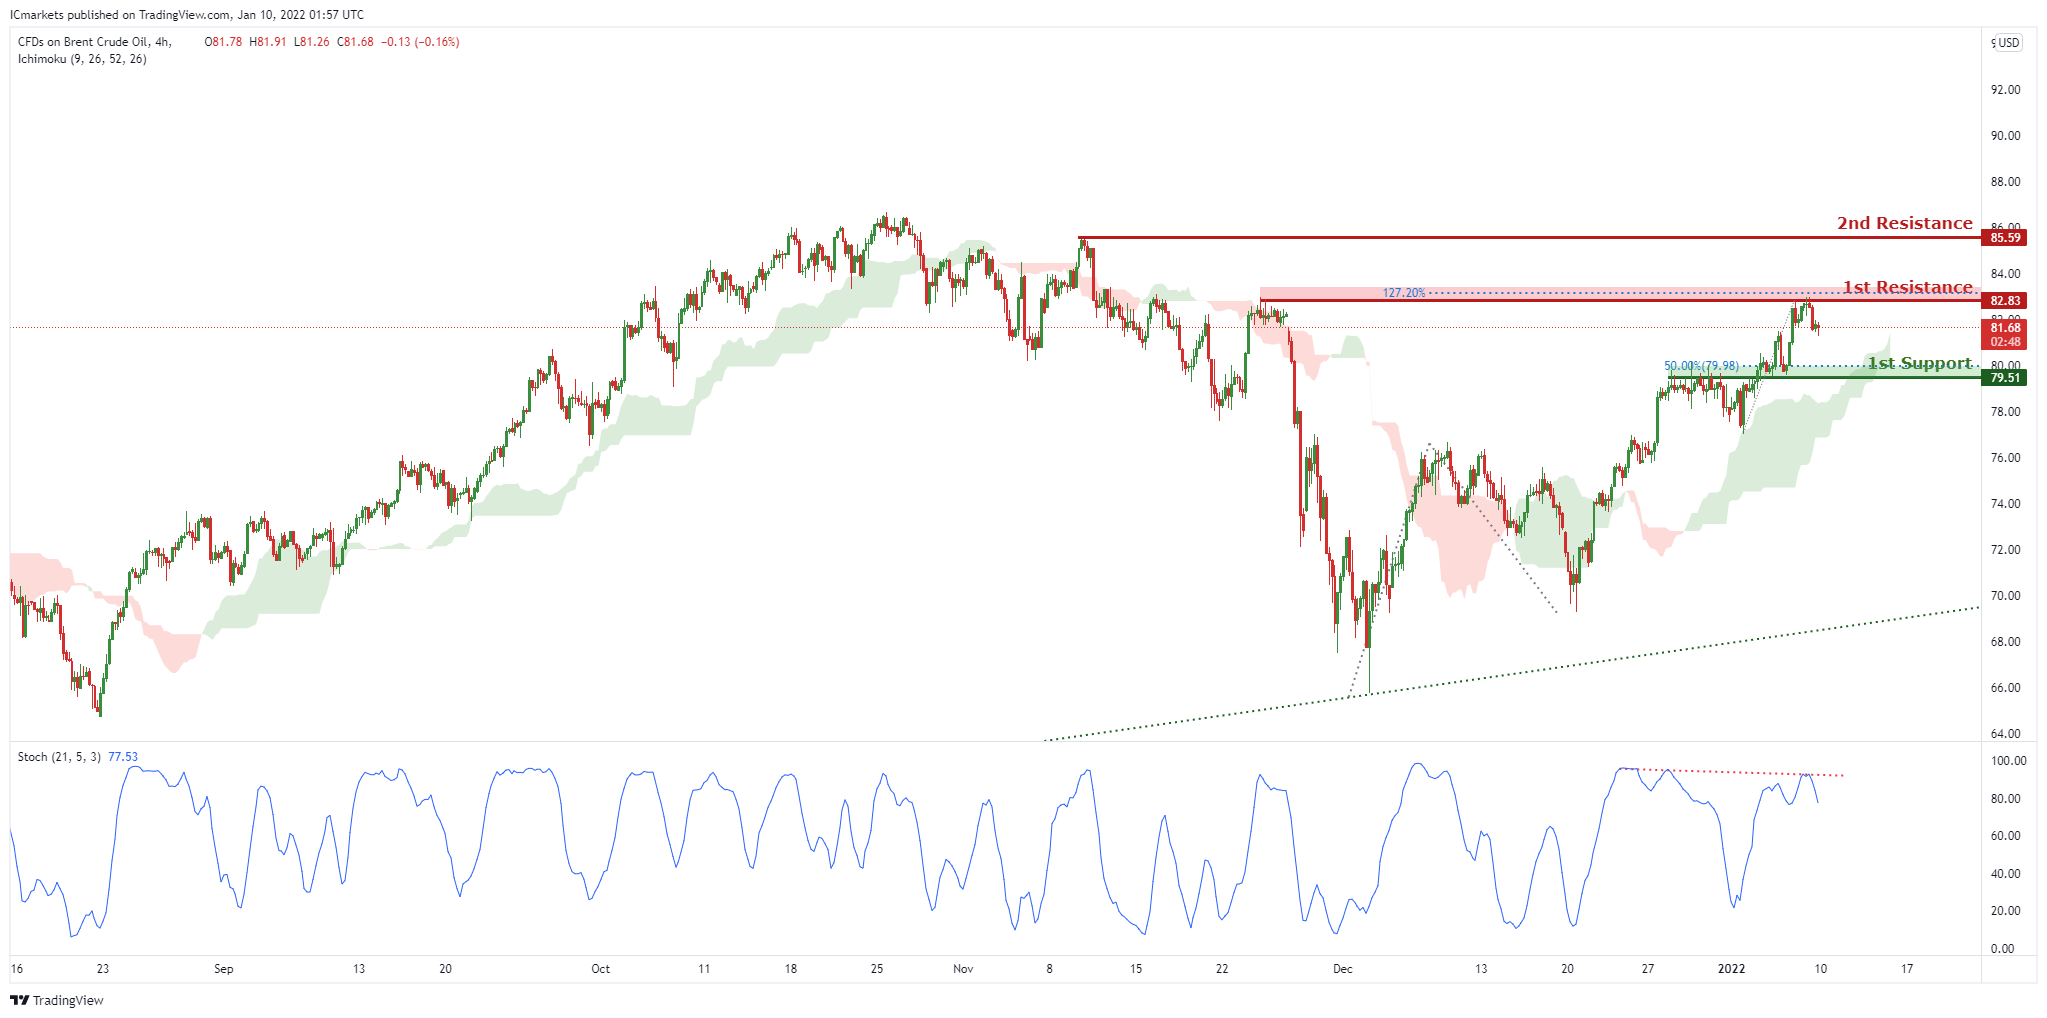
On the H4, with price at the resistance of stochastics, we have a bearish bias that price will drop from our 1st resistance at 82.83 which is in line with horizontal swing high resistance and 127.2% Fibonacci extension to 1st support at 79.51, which is in line with horizontal swing overlap support and 50% fibonacci retracement. This is also where the support of the ichimoku cloud is. Alternatively, price may break 1st resistance structure and head for 2nd resistance at 85.59, which coincides with horizontal swing high resistance.
Areas of consideration:
H4 time frame, 1st resistance of 82.83
H4 time frame, 1st support of 79.51
Dow Jones Industrial Average:
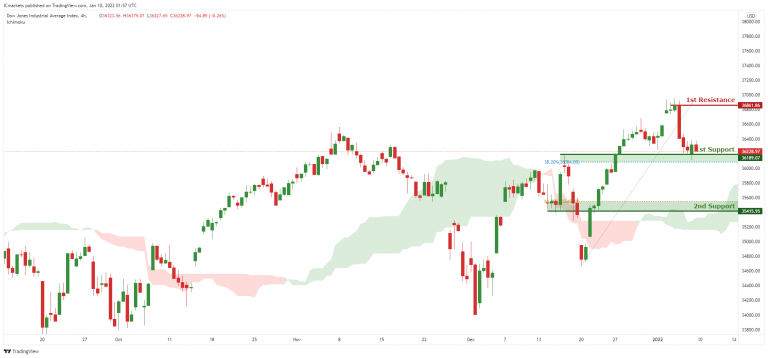
On the H4, with price moving above the ichimoku cloud, we have a bullish bias that price will rise to our 1st resistance at 36861 which is in line with horizontal swing high resistance from 1st support at 36189, which is in line with horizontal overlap support and 32.8% Fibonacci retracement level. Alternatively, price may break 1st support structure and head for 2nd support at 35415, which coincides with horizontal overlap support and 61.8% Fibonacci retracement level .
Area of consideration:
4H resistance at 36861
4H support at 36189
EUR/USD Aims Key Upside Break Above 1.1400
Key Highlights
- EUR/USD seems to be eyeing an upside break above the 1.1380 resistance.
- A key bullish trend line is forming with support near 1.1315 on the 4-hours chart.
- GBP/USD extended increase above the 1.3550 resistance zone.
- Gold price is struggling to stay above the $1,800 zone.
EUR/USD Technical Analysis
This past week, the Euro tried to clear the 1.1380 resistance zone against the US Dollar. However, EUR/USD failed and corrected lower below 1.1350.
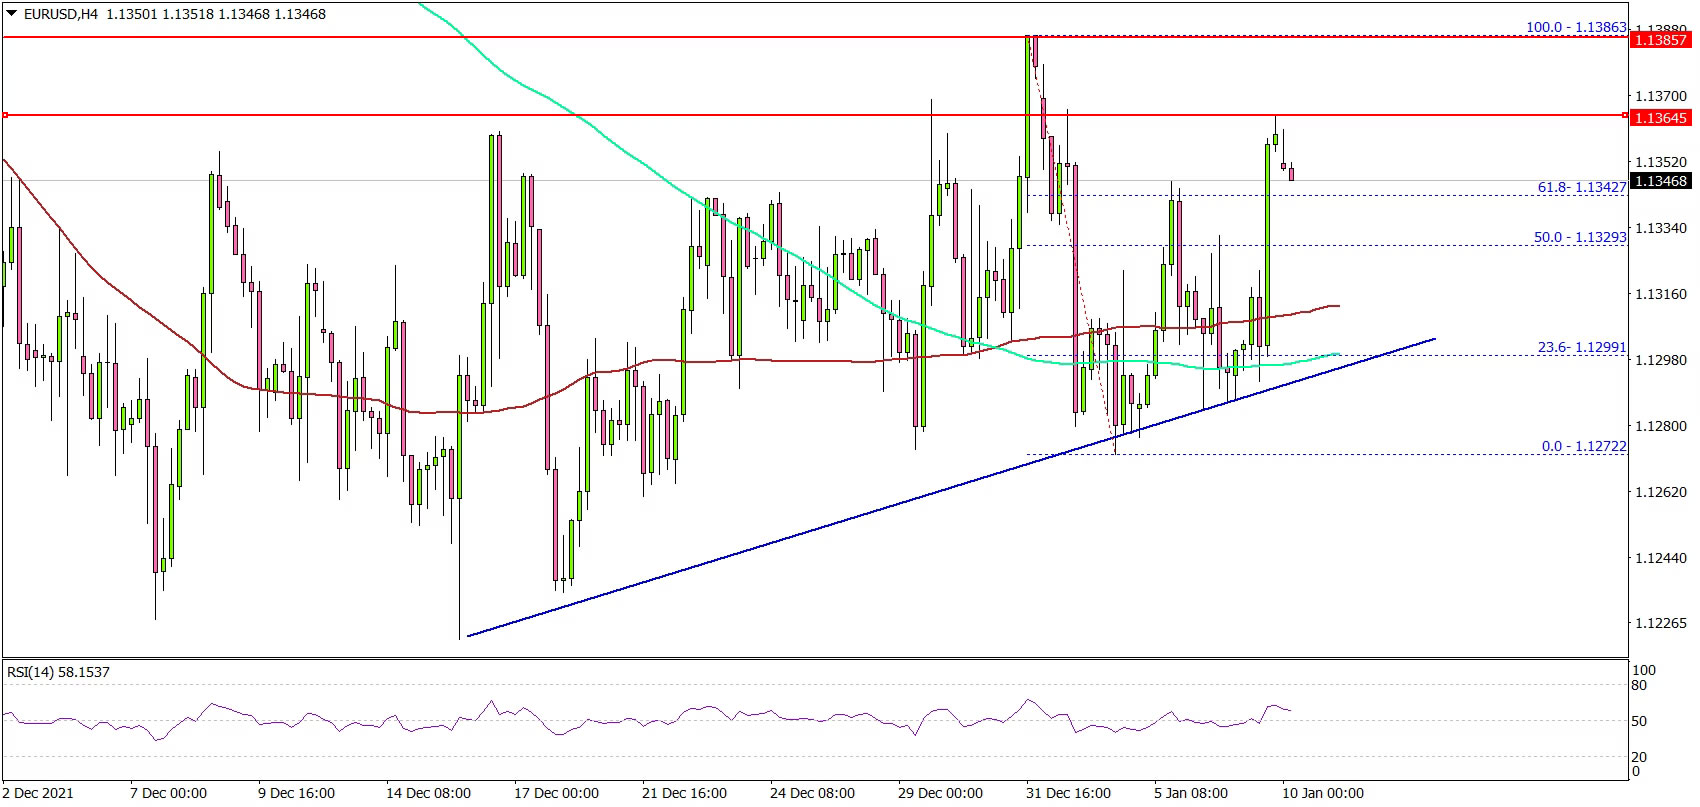
Looking at the 4-hours chart, the pair remained well bid above the 1.1250, the 100 simple moving average (red, 4-hours) and the 200 simple moving average (green, 4-hours).
The pair started a fresh increase above the 1.1300 level. There is also a key bullish trend line forming with support near 1.1315 on the same chart. On the upside, the pair is facing resistance near 1.1380 level.
The next major resistance is near the 1.1400 level. A close above 1.1400 could open the doors for a steady increase. If there is a fresh decline, the bulls might defend the trend line at 1.1315.
The next major support is near the 1.1300 level. Any more losses might send the pair towards the 1.1280 level. A downside break below 1.1280 could lead the pair towards the 1.1250 level.
Looking at GBP/USD, the pair gained pace for a move above the 1.3550 level. If the bulls remain in action, the pair could rise above 1.3620.
Economic Releases
- Euro Zone Sentix Investor Confidence for Jan 2022 - Forecast 12.0, versus 13.5 previous.
- Euro Zone Unemployment Rate for Nov 2021 - Forecast 7.2%, versus 7.3% previous.
Week Ahead Preview: 10 January 2022
It has been a very interesting start to the new year. Omicron concerns have been replaced by tightening fears. Tech stocks are no longer racy. Everyone wants to own value stocks such as banks. Investors are realising that the era of zero interest rate policy is coming to an end, because of inflation and the fact the US and global economies have weathered the storm of Covid. There’s hope that this omicron wave might be the last hurrah of Covid before the pandemic turns into endemic. South African researchers have gone as far as to say Omicron may mark the end of the pandemic.
Investors are now looking ahead in trying to anticipate how the Fed and other central banks might respond if the economy evolves as expected. Every word the Fed says will be examined, like how investors observed the FOMC’s meeting minutes from the December meeting that were released on Wednesday. In a bid to keep the US economy from overheating amid high inflation and near-full employment, the FOMC indicated that the outlook “could warrant a potentially faster pace of policy rate normalization.”
Investors since been bidding up yields, and on Friday the US 5-year and 10-year yields broke above their 2021 highs despite a mixed US jobs report. This triggered further selling of tech stocks, while value pushed higher.
Although headline jobs disappointed yet again with a print just shy of 200K, it didn’t matter in the eyes of investors because hourly earnings beat expectations with a print of +0.6% m/m vs. 0.4% eyed, taking the y/y rate to 4.7%.
It is worth watching the 10-year yields closely as we look forward to the week ahead when more US data including CPI are released (see data highlights below). The dollar rally could accelerate, while value stocks could shine even brighter.
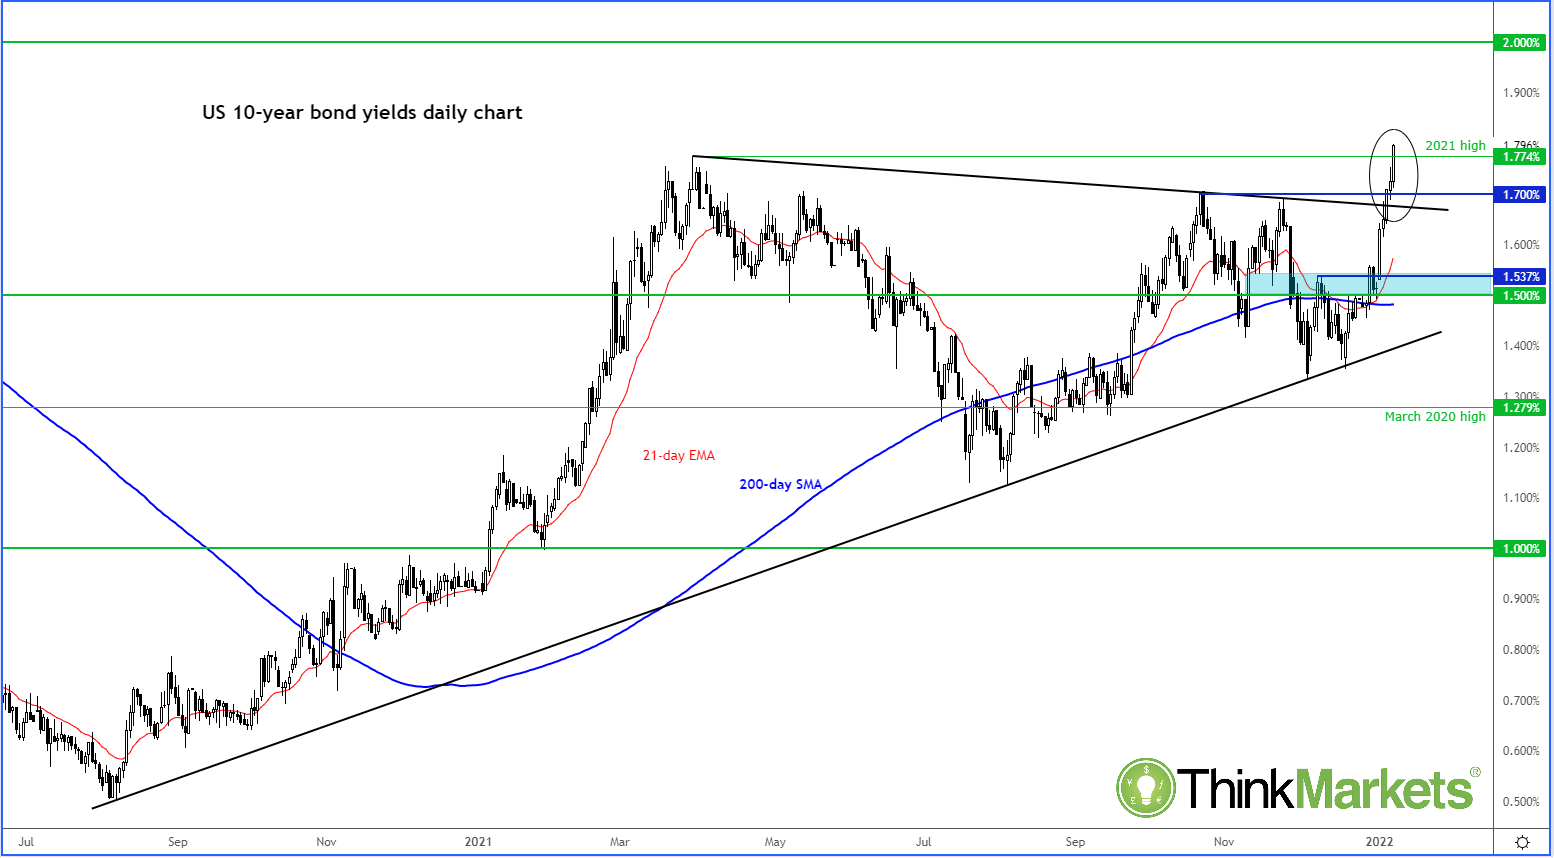
Source: ThinkMarkets and TradingView.com
Macroeconomic highlights
Monday: Eurozone Sentix Investor Confidence
Tuesday: Fed Chair Powell testifies and speeches by Fed’s Mester and George
Wednesday: Eurozone industrial production and US CPI m/m
Thursday: US PPI and Unemployment Claims
Friday
- UK construction output and manufacturing production
- German Prelim GDP
- US Core Retail Sales, Industrial Production, and Prelim UoM Consumer Sentiment and Inflation Expectations
Forex and Cryptocurrency Forecast
EUR/USD: Awaiting the January FOMC Meeting
The EUR/USD pair has been in a sideways trend for seven weeks in a row, moving along the horizon 1.1300 in the 1.1220-1.1385 channel. Even the publication of the protocols could not get it out of this state of the December FOMC (Federal Open Market Committee) meeting of the US Federal Reserve, which confirmed the seriousness of this central bank's intentions to tighten monetary policy and strengthen dollars. Apparently, the regulator is frightened by the rate of inflation in the country. In addition, it did not expect the Omicron coronavirus strain to have a significant negative impact on economic activity in the United States.
To normalize the situation, the Fed decided to finally stop the printing press and move on to raise interest rates. The roadmap for the near future includes three main points: 1) the curtailment of the emergency stimulus program in March; 2) three increases in the key rate in 2022, the first of which may also occur in March, after which 3) the regulator will begin to normalize the balance.
These intentions of the Fed led to a sharp outflow of funds from risky assets. Stock indices and cryptocurrency quotes collapsed, while US Treasury yields and the DXY dollar index went up. Although, it should be noted that the strengthening of the US currency was insignificant: the dollar won back only 45 points against the euro, dropping the EUR/USD pair from 1.1345 to the Pivot Point 1.1300.
The release of data from the US labor market on Friday, January 7th could be another important event of the week. The number of new jobs outside the agricultural sector (NFP) was expected to grow from 249K to 400K. However, it fell to 199K instead. On the other hand, the unemployment rate fell from 4.2% to 3.9% against the forecast of 4.1%. Thus, investors did not receive any clear signals, and the pair completed the weekly session near the upper border of the side corridor, at 1.1360.
According to some experts, the difference in the hawkish attitude of the Fed and the dovish attitude of the ECB should eventually lead to a further strengthening of the dollar and the movement of the EUR/USD pair to the south.
Recall that the European regulator, although it raised the inflation forecast for 2022 at its last meeting in 2021, still considers it a temporary phenomenon, which is why it is not worth it yet to worry. It was announced once again that the refinancing rate will remain at the current level until inflation reaches the target level of 2.0% and will remain there for a long time. Eventually, the "main" result of the December meeting of the ECB was the head of the bank Christine Lagarde's statement that the rate hike in 2022 was "very unlikely".
Strategists of the Dutch banking ING Group (Internationale Nederlanden Groep) have voted for the strengthening of the US currency. They believe that the EUR/USD pair will fall to the 1.1100 zone in Q2 and Q4 of this year, and it will be even lower at 1.1000 in Q4. Analysts of one of the largest financial conglomerates in the world, HSBC (Hongkong and Shanghai Banking Corporation) are in solidarity with ING, predicting a downward trend of this pair as well.
CIBC (Canadian Imperial Bank of Commerce) designated the following route for EUR/USD: Q2 - 1.1100, Q3 - 1.1000, Q4 - 1.1000. The JP Morgan financial holding assessed the pair's prospects more modestly, pointing to the level of 1.1200.
However, there is an opposite opinion among experts. For example, Barclays Bank already considers the dollar to be highly overvalued. Therefore, it is expected to depreciate moderately against the backdrop of rising risk appetites and commodity prices, caused by the recovery of the global world economy and cooling inflation. The Barclays scenario written for EUR/USD looks like this: Q1 - growth to 1.1600, Q2 - 1.1800, Q3 and Q4 - movement in the 1.1900 zone.
Morgan Stanley believes that the Fed's rate hike will proceed fairly smoothly, while other central banks will move from dovish to hawkish politics. This will lead to a convergence in the actions of regulators, put pressure on the dollar and raise the EUR/USD pair to 1.1800. The Goldman Sachs strategists call the same goal.
As for the near term, despite the poor NFP indicators, we can expect that the pair will continue to move along the level of 1.1300 until the January Fed meeting, fluctuating in in the range of 1.1220-1.1385 with the predominance of bearish sentiment. 70% of analysts agree with this forecast. 15% have taken a neutral position and another 15% side with the bulls.
The readings of the indicators on D1 are inconsistent as they are under the influence of a multi-week sideways trend. Among the oscillators, 60% point to the north, but 20% are already signaling that the pair is overbought, 20% point south, and 20% point east. Trend indicators have 55% green and 45% red.
The nearest resistance level is 1.1385, then 1.1435-1.1465 and 1525. The nearest support level is at 1.1275, followed by 1.1220. This is followed by the last November 24 low of 1.1185 and the zone 1.1075-1.1100.
The economic calendar of the coming week is highlighted by the publication on January 12, 13 and 14 of a whole pool of macro-statistics from the USA. It will include consumer price indices and retail sales indices, producer price indices, and retail sales volumes in December 2021.
GBP/USD: BoE Hawks vs Fed Hawks
The fact that, unlike the Fed and the ECB, the Bank of England launched an attack on rising prices in December made a strong impression on the market. After inflation in the UK rose to 5.1%, reaching a 10-year peak, the regulator raised the rate for the first time in three years from 0.1% to 0.25%. The decision was made despite the worsening epidemiological situation due to the new coronavirus strain. According to the head of the Bank of England, Andrew Bailey, the number one task is to curb price pressure on the economy and society.
Of course, the rate hike by 15 basis points cannot be called significant, but, most importantly, the first step has already been taken, and the market expects the second rate hike in February.
Such expectations continue to support the British currency, and the GBP/USD pair updated its eight-week high on January 05, reaching 1.3598. The finish of the five-day period took place slightly lower, at 1.3590.
Strategists at the British investment Barclays Bank believe that the pound is still very undervalued, and that the policy of the US Federal Reserve will eventually lead to a moderate depreciation of the dollar. They do not exclude that due to the new wave of COVID-19 and difficulties in relations with the EU due to Brexit, the pair may drop to 1.3300 in Q1. However, then it will go up again (Q2 - 1.3700, Q3 - 1.4000) and will return to the 2021 highs by the end of the year (Q4), rising to the level of 1.4200.
Capital Economics, one of the leading independent research centers in the UK, has taken the opposite position. Its specialists, on the contrary, expect the pound to weaken, and refer to a combination of 1) weak economic growth, 2) slowdown in inflation and 3) slowness of the Bank of England. These three factors, in their opinion, may lead to the fact that the UK regulator decides to raise the rate only to 0.5% in the coming months, instead of 1.0%, which will greatly disappoint the markets.
But, in addition to the growth and fall of the British currency, there is a third scenario. ING Group analysts predict that the pound will be somewhere in the middle of a triangle of a stronger US dollar, stable commodity currencies and weaker low-yielding currencies. Therefore, according to their scenario, the GBP/USD pair will move sideways along the horizon of 1.3400.
If we talk about the near future of the pair, 40% of analysts vote for its growth above the level of 1.3600, 50% vote for a fall below 1.3400 and 10% for a sideways trend.
The indicators on D1 have a pretty summery mood. Among the oscillators, 100% is colored green, although 25% of them are already in the overbought zone. Among trend indicators, 90% are green and only 10% are red.
The supports are located at 1.3525, 1.3480, 1.3430, 1.3375, the next strong support is 100 points lower. Resistance levels are 1.3600, 1.3735, 1.3835.
Important macro-statistics from the UK will be scarce next week. We can only note the data on the volume of production in the manufacturing industry, which will become known on Tuesday January 11 and Friday January 14.
USD/JPY: Pair at 5-Year High
The color of the indicators for this pair is also predominantly green. However, unlike GBP/USD, this does not indicate a weakening of the dollar, but, on the contrary, its strengthening.
We wrote a week ago that Japan needs a weak national currency. Thus, the head of the Bank of Japan, Haruhiko Kuroda, has recently said that a weak yen would rather help the country's economy than harm it. According to the senior official, if the yen falls, it will support exports and corporate profits. And if you look at the USD/JPY chart, his words do not differ from the deeds: the pair updated its high on January 04 and rose to the point where it has not been seen since January 2017, to the height of 116.35.
According to ING Group experts, the growth will not stop there, and we will see the pair at a height of 120.00 by the end of the year. Morgan Stanley also prefers the dollar, expecting growth to 118.00. On the contrary, Goldman Sachs believes that the pair will fall to 111.00 by 2023.
The pair finished last week at 115.55. As already mentioned, despite the slight correction, most of the indicators on D1 point north. Among the oscillators there are 90% of those (10% of them are signaling the pair being overbought), the remaining 10% are colored neutral gray. Among trend indicators, 85% recommend buying, 15% - selling. Experts also agree with the indicators: 80% of them side with the bulls, 0% for the bears, 20% choose neutrality. Support levels are 115.50, 115.00, 114.25, 113.75, 113.20, 112.55 and 112.70. The nearest resistance level is 116.35.
CRYPTOCURRENCIES: A Full Crypto Winter? Or Temporary Freezes?
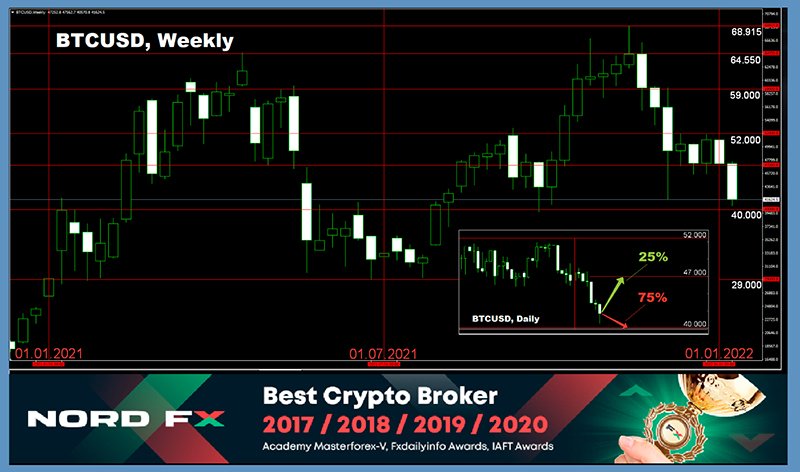
it is the middle of winter in the northern hemisphere of the planet Earth. And the weather on the crypto market is corresponding, below zero. Quotes are falling, and there is not even a hint of warming so far. Another cold wave arose after the news appeared on the night of January 06 that the US Federal Reserve is ready to raise the key interest rate earlier and at a faster pace than was expected. This became clear from the published minutes of the December meeting of the Federal Open Market Committee (FOMC).
Inspired by this news, the bears went on the attack again. Anti-government unrest in Kazakhstan added anxiety to investors. Recall that a part of the miners immigrated there after the ban on mining in China, as a result of which Kazakhstan took the 2nd place in the world in BTC production (TOP-3: USA - 35.4%, Kazakhstan - 18.1%, Russia - 11.23%). The Internet was cut off due to the unrest in Kazakhstan, which led to a significant decrease in the hash rate on the BTC network.
These two events caused the BTC/USD pair to break through support around $46,000, where the 200-day moving average was passing, and fell below $42,000. Bitcoin's Crypto Fear & Greed Index fell to the Extreme Fear zone, hitting 15 points out of 100, indicating panic reigning in the market. The Bitcoin Dominance Index fell to 39.65%, hitting the May 2021 lows. (Recall that it was 95.88% at the maximum in 2013). Naturally, the collapsed bitcoin pulled the entire crypto market along with it. If its total capitalization was $2.439 trillion on December 27, it lost almost 19% by January 7 and fell to $1.980 trillion, breaking through an important psychological level of $2 trillion.
It should be noted that the attack of bears on the eve of the next meeting of the US Federal Reserve on January 26 was predictable. Our weekly crypto news review quoted economist Alex Kruger as saying that "investors should be expected to exit risky assets ahead of the Fed meeting." Which is exactly what happened.
The next line of active defense of the bulls, according to a number of experts, awaits bears in the $39,500- $41,900 zone. It is there, near the low of last April 12, is the range of high liquidity, according to the TradingView publication. It was not withdrawn even before the last wave of the asset's rally, when the price of bitcoin hit an all-time high.
Despite the fact that the crypto market is falling for the eighth week in a row, many experts and investors are hoping for the imminent arrival of the crypto spring. For example, Block.One co-founder, former actor and former US presidential candidate Brock Pierce is confident that bitcoin could reach $200,000 this year. Governments are printing excessive amounts of money, thereby fueling inflation, and this will be the main reason for BTC to take off. "I wouldn't be surprised if bitcoin trades for $100,000. It is quite possible that it can jump over $200,000 for a moment," this influencer said optimistically.
Antoni Trenchev, co-founder and managing partner of Nexo, a major cryptocurrency lender (more than $6 billion), heralds a stellar future for the main digital asset. "I think bitcoin will reach $100,000 this year, perhaps by the middle of this year," he predicts.
The head of the investment company Ava Labs, John Wu, expressed the opinion in an interview with CNBC that the capitalization of the crypto market will exceed $5 trillion in 2022. According to Wu's forecast, digital assets have the potential to at least double their market value in the next year.
According to the head of Ava Labs, cryptocurrencies will be the only asset class that can withstand both the actions of the Fed and the record increase in inflation, which reached its maximum values in the US in almost 40 years in early December 2021. Wu also claims that the share of bitcoin will fall below 30% with the growth of the crypto market, although the price may exceed $75,000 per coin.
An interesting way to assess the prospects of the flagship cryptocurrency was proposed by analyst Benjamin Cowen. In his opinion, bitcoin has already bottomed out, although its decline may continue, somewhere up to $40,000. According to Cowen, it can be more revealing sometimes to value bitcoin not in the BTC/USD pair, but in comparison with other assets. As an example, he suggests looking at BTC paired with the S&P500 index. According to the expert, bitcoin has already reached critical support here, as "it is testing levels that were tested back in September".
The experts of Glassnode are in solidarity with Benjamin Cowen, although they use completely different methods of market analysis. According to their estimates, the BTC market indicators paint a fairly positive picture, since an increasing amount of this asset is becoming illiquid. Glassnode examined the dynamics and the supply performance of bitcoin in its report dated January 03, 2022. The results showed that the growth of illiquid asset supply accelerated last year, which now accounts for 76% of the total. Glassnode defines illiquidity as moving BTC to a wallet with no history of spending. The liquid stock of BTC, which is 24%, is in wallets that regularly spend or trade coins.
The figures indicate that more and more bitcoin is being transferred to storage, which indicates an increase in accumulation. The reduction in highly liquid supply also hints that there is no need to expect a major sell-off or surrender to the bears in the near future.
It will not be long to wait until the Fed meeting on January 26. We will see then whether such estimates are right. In conclusion, we just recall the words of the aforementioned Benjamin Cowen. "Anything is possible in the case of investment," he writes. "All models can be wrong, although some can be useful..."
EUR/USD Weekly Outlook
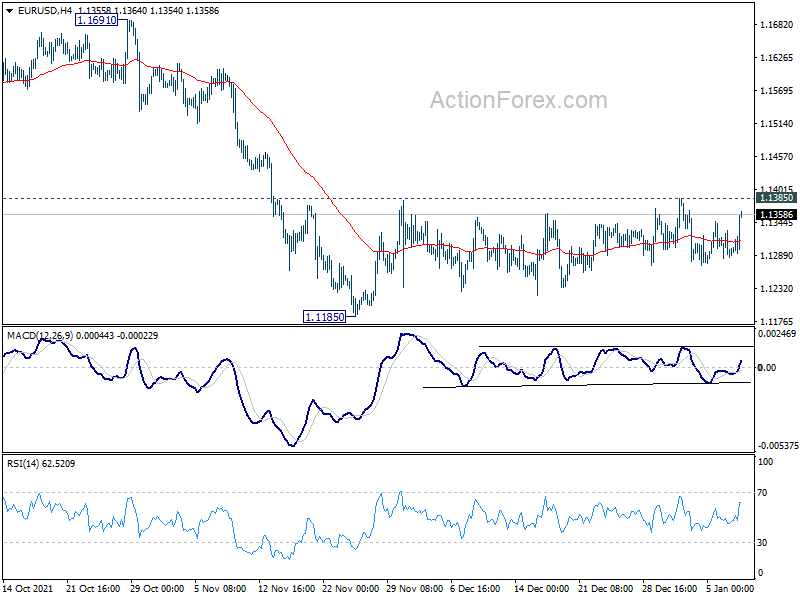
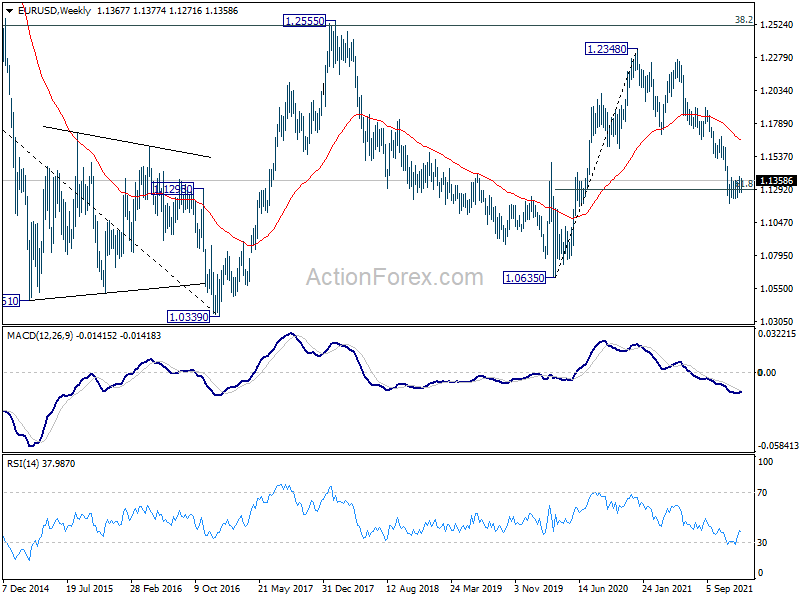
EUR/USD continued to struggle in sideway trading last week and outlook is unchanged. Initial bias remains neutral this week first. On the upside, sustained trading above 55 day EMA (now at 1.1385) will bring stronger rise back to 1.1663 support turned resistance. On the downside, break of 1.1185 will resume larger decline from 1.2348. Next target is 161.8% projection of 1.2265 to 1.1663 from 1.1908 at 1.0934.
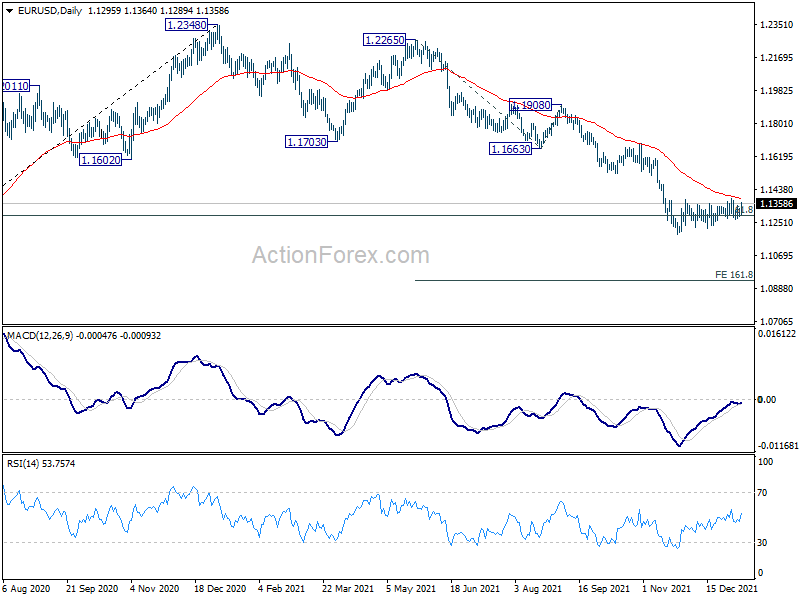
In the bigger picture, there are various ways of interpreting the fall from 1.2348 (2021 high). It could be a correction to rise from 1.0635 (2020 low), the fourth leg of a sideway pattern from 1.0339 (2017 low), or resuming long term down trend. In any case, outlook will now stay bearish as long as 1.1703 support turned resistance holds. Sustained break of 61.8% retracement of 1.0635 to 1.2348 at 1.1289 would pave the way back to 1.0635.
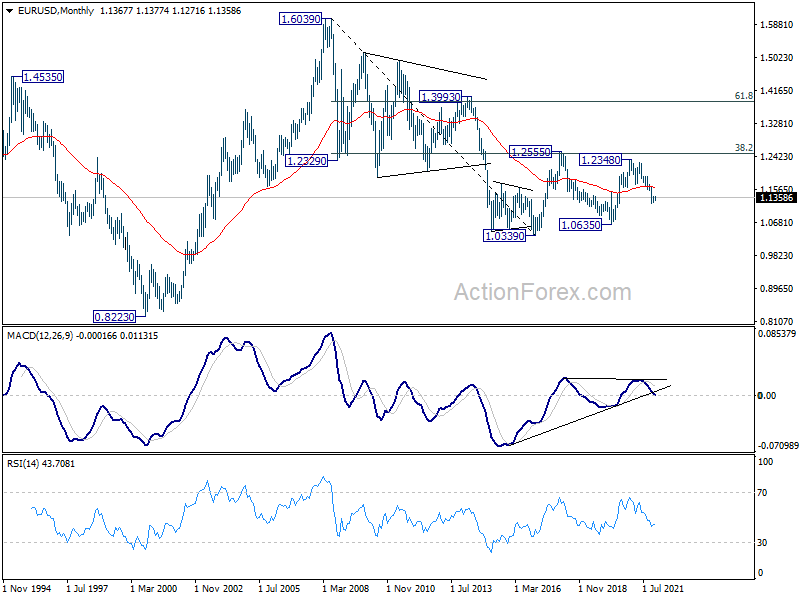
In the long term picture, EUR/USD has possibly failed 1.2555 cluster resistance (38.2% retracement of 1.6039 to 1.0339 at 1.2516) again. Long term outlook will remain neutral as sideway pattern from 1.0339 (2017 low) is extending with another medium term fall. For now, we'd hold back from assessing the chance of downside breakout, and monitor the momentum of the decline from 1.2348 first.
USD/JPY Weekly Outlook
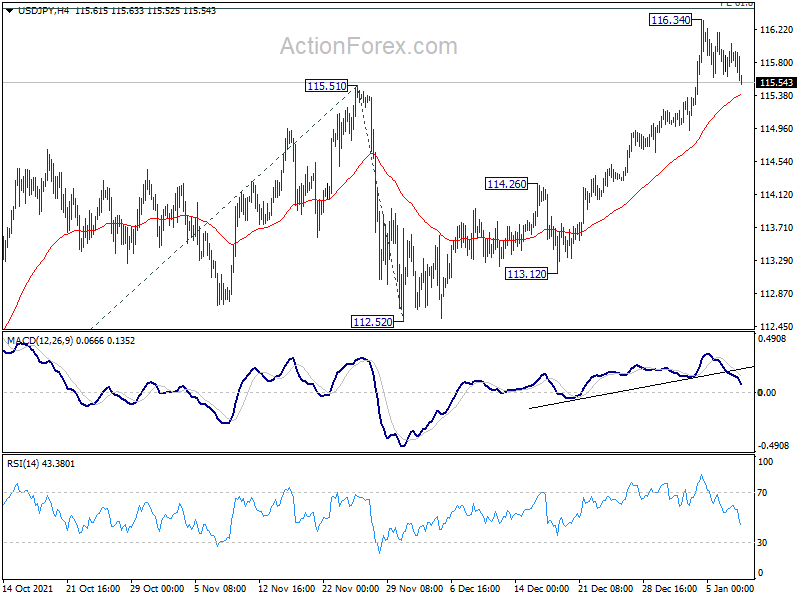
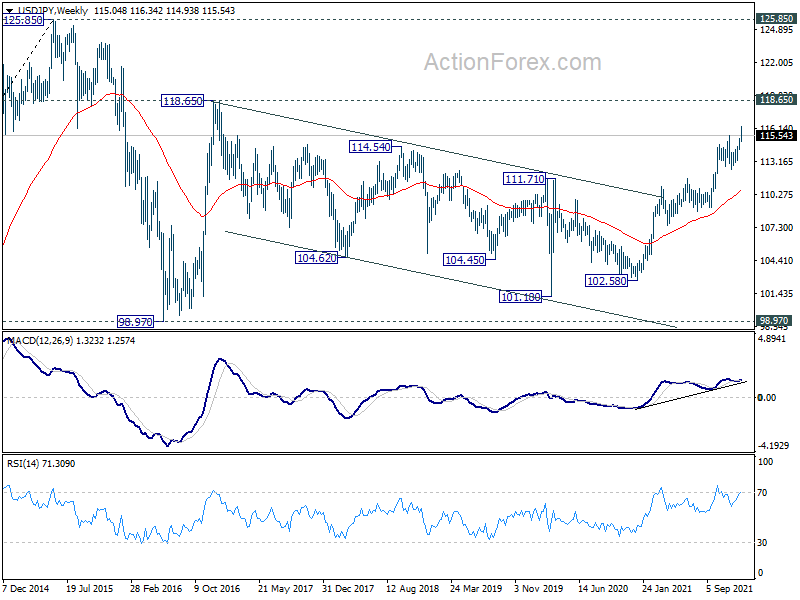
USD/JPY's up trend resumed last week and hit as high as 116.34. But a temporary top was formed ahead of 61.8% projection of 109.11 to 115.51 from 112.52 at 116.47. Initial bias remains neutral this week for some consolidations. Downside should be contained well above 114.26 resistance turned support to bring rally resumption. On the upside, firm break of 116.47 will pave the way to 100% projection at 118.90, which is close to 118.65 long term resistance.
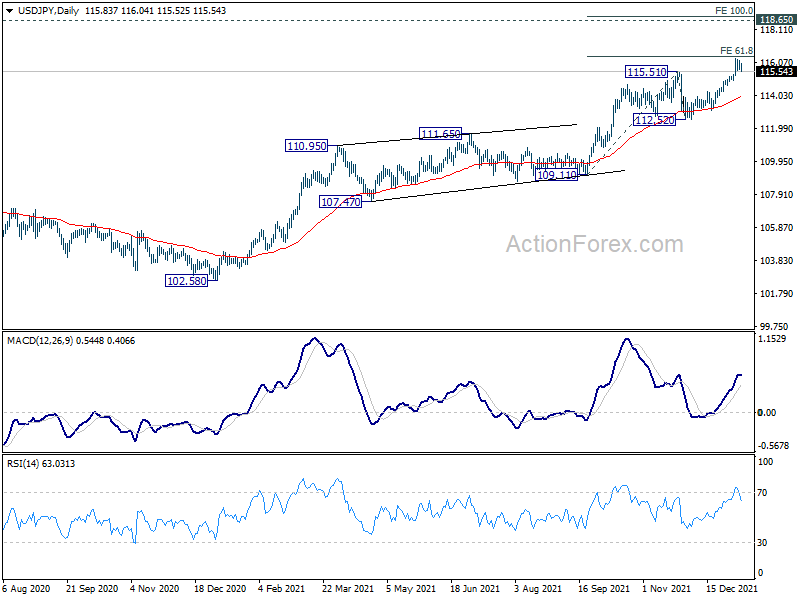
In the bigger picture, no change in the view that rise from 102.58 is the third leg of the up trend from 101.18 (2020 low). Such rally should target a test on 118.65 (2016 high). Sustained break there will pave the way to 120.85 (2015 high) and raise the chance of long term up trend resumption. For now, this will remain the favored case as long as 112.52 support holds, in case of deep pull back.
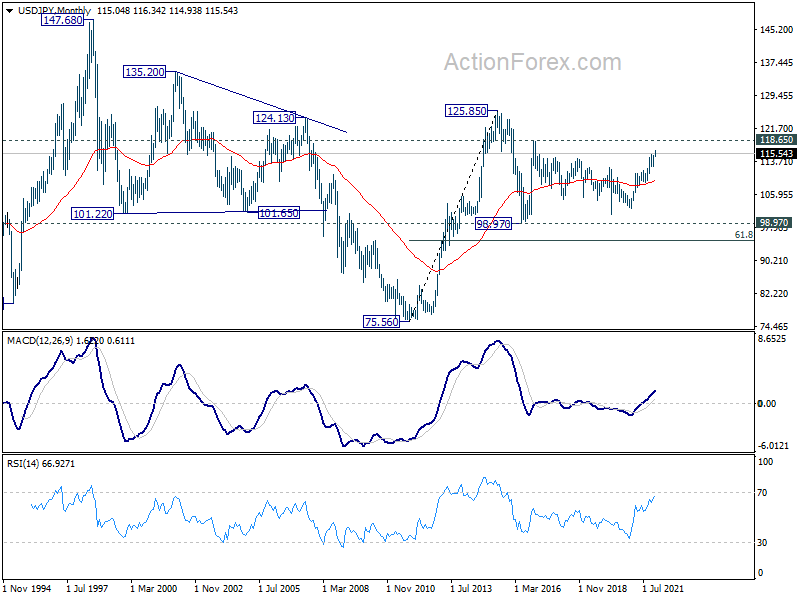
In the long term picture, the rise from 75.56 (2011 low) long term bottom to 125.85 (2015 high) is viewed as an impulsive move, no change in this view. Price actions from 125.85 are seen as a corrective pattern which could still extend. In case of deeper fall, downside should be contained by 61.8% retracement of 75.56 to 125.85 at 94.77. Up trend from 75.56 is expected to resume at a later stage for above 135.20/147.68 resistance zone.
GBP/USD Weekly Outlook
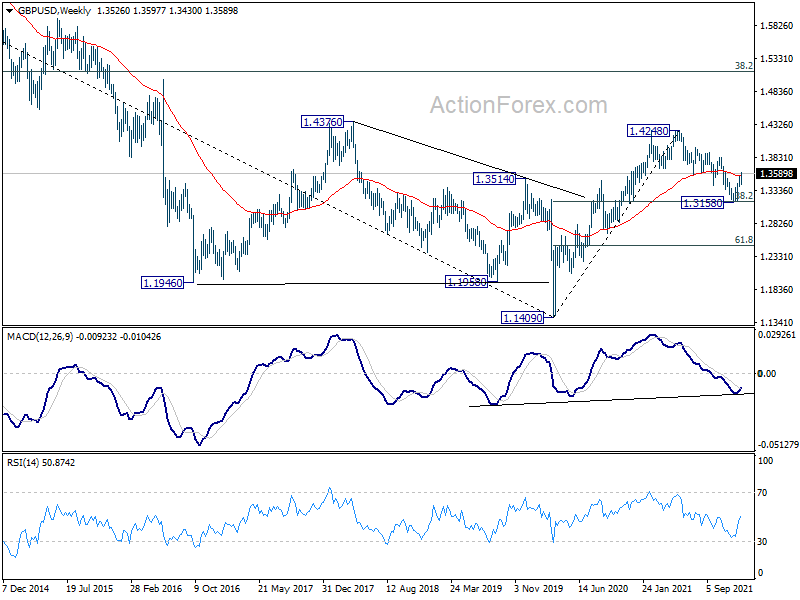
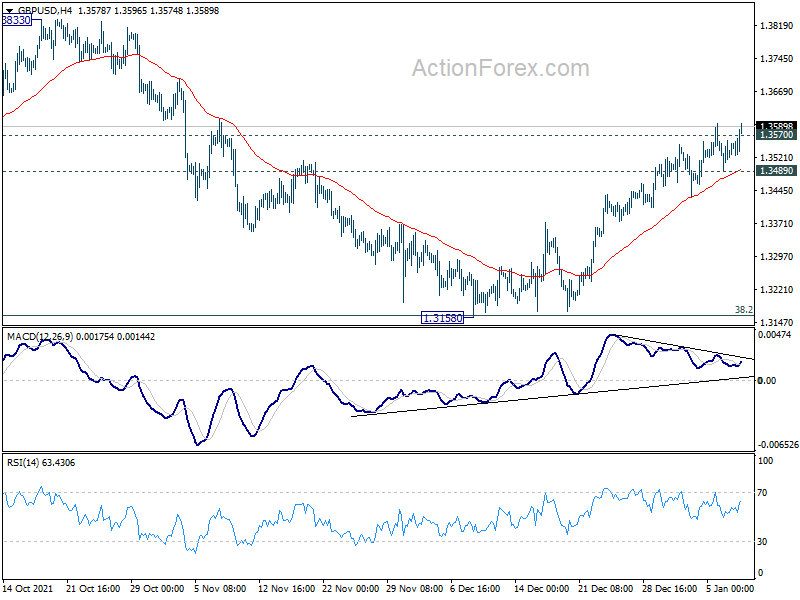
GBP/USD's rebound from 1.3158 extended higher last week and breached 1.3570 support turned resistance. The development affirms the view that corrective fall from 1.4248 as complete with three waves down to 1.3158, after hitting 1.3164 medium term fibonacci level. Sustained trading above 1.3570 will pave the way to 1.3833 resistance next. On the downside, though, break of 1.3489 minor support will mix up the outlook and turn intraday bias neutral first.
In the bigger picture, strong support was seen from 38.2% retracement of 1.1409 to 1.4248 at 1.3164. The development suggests that up trend from 1.1409 (2020 low) is still in progress. On resumption, next target will be 38.2% retracement of 2.1161 to 1.1409 at 1.5134. Nevertheless sustained break of 1.3164 will argue that whole rise from 1.1409 has completed and bring deeper fall to 61.8% retracement at 1.2493.
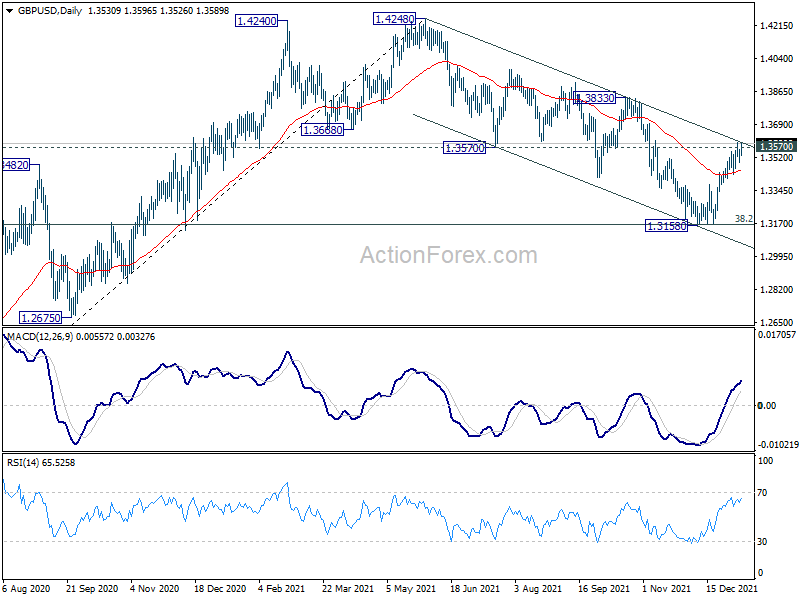
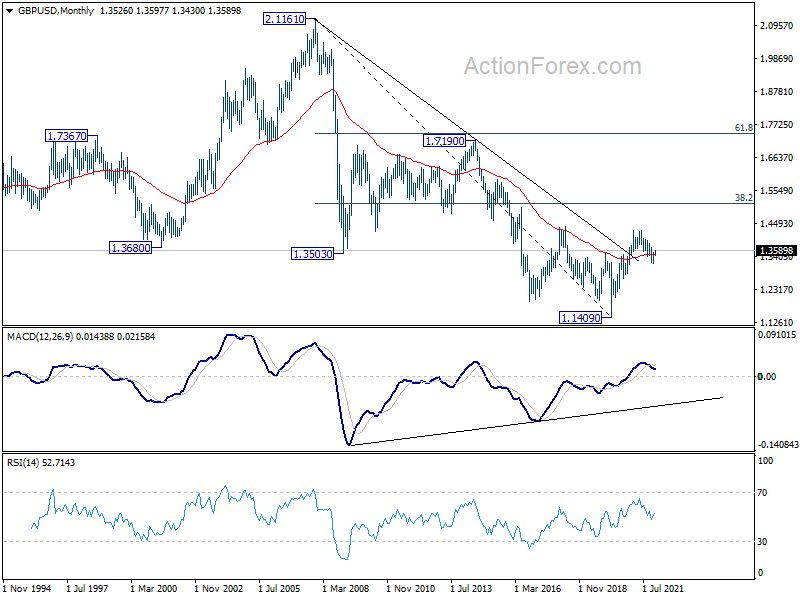
In the longer term picture, a long term bottom should be in place at 1.1409, on bullish convergence condition in monthly MACD. Rise from there would target 38.2% retracement of 2.1161 to 1.1409 at 1.5134. Reaction from there would reveal whether rise from 1.1409 is just a correction, or developing into a long term up trend.