

Sample Category Title
GBP/USD Weekly Outlook
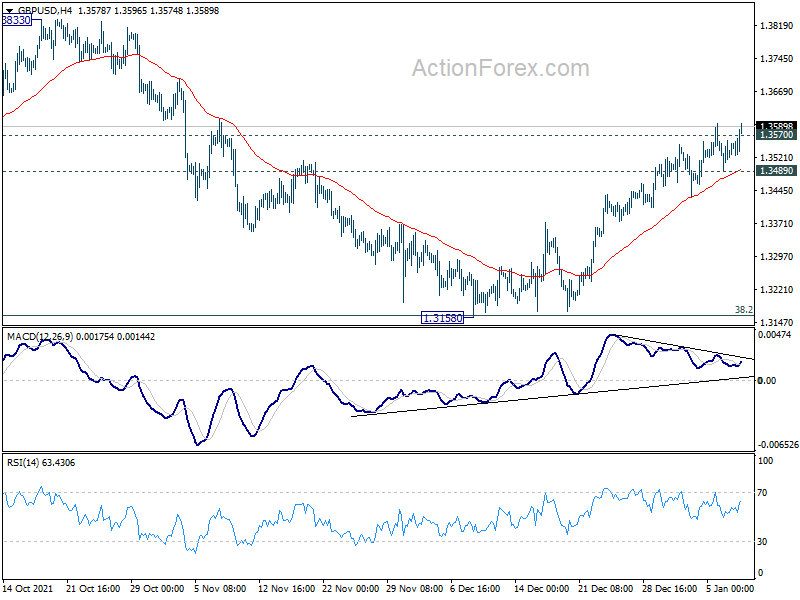
GBP/USD's rebound from 1.3158 extended higher last week and breached 1.3570 support turned resistance. The development affirms the view that corrective fall from 1.4248 as complete with three waves down to 1.3158, after hitting 1.3164 medium term fibonacci level. Sustained trading above 1.3570 will pave the way to 1.3833 resistance next. On the downside, though, break of 1.3489 minor support will mix up the outlook and turn intraday bias neutral first.
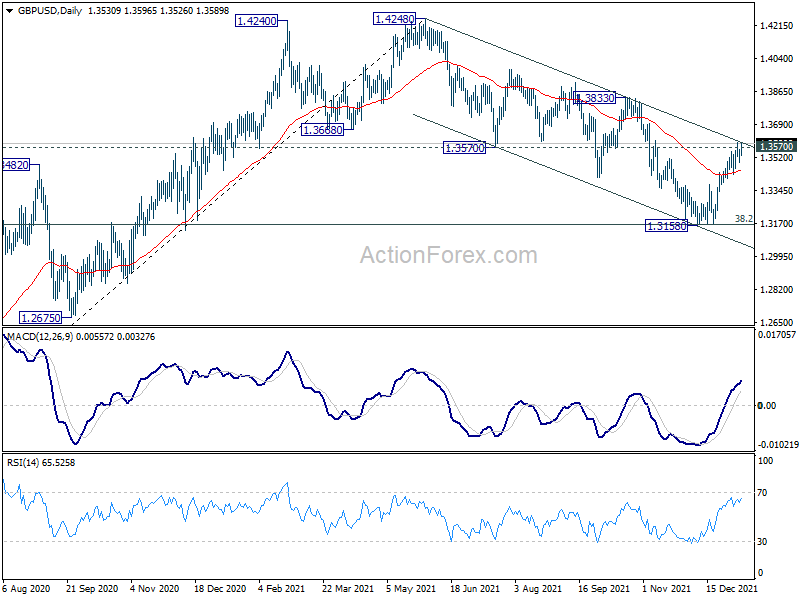
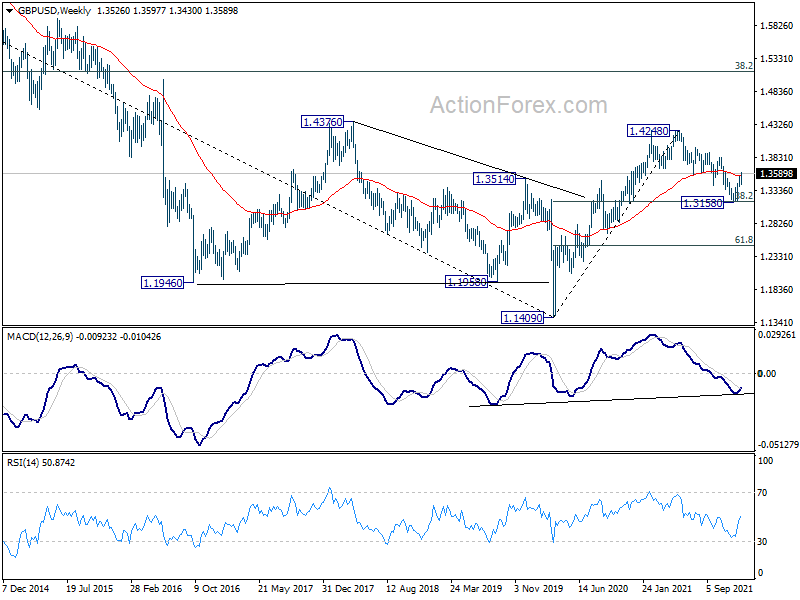
In the bigger picture, strong support was seen from 38.2% retracement of 1.1409 to 1.4248 at 1.3164. The development suggests that up trend from 1.1409 (2020 low) is still in progress. On resumption, next target will be 38.2% retracement of 2.1161 to 1.1409 at 1.5134. Nevertheless sustained break of 1.3164 will argue that whole rise from 1.1409 has completed and bring deeper fall to 61.8% retracement at 1.2493.
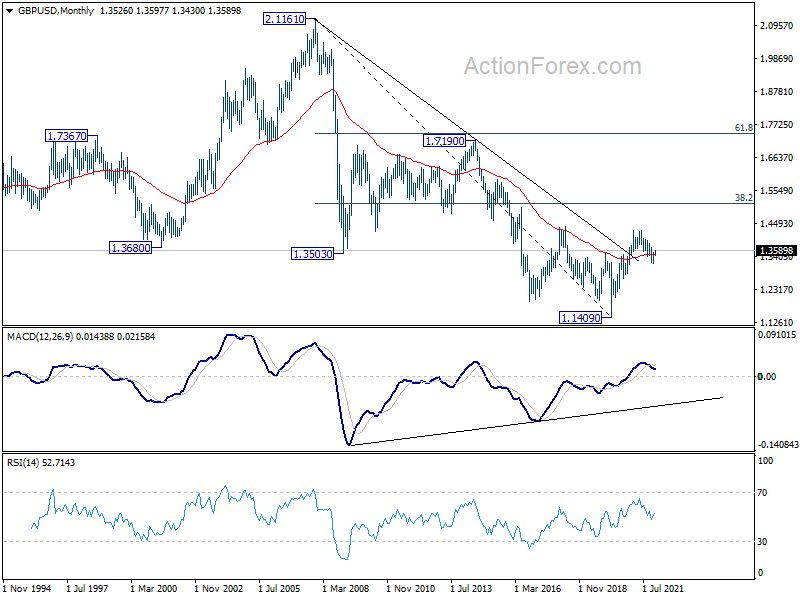
In the longer term picture, a long term bottom should be in place at 1.1409, on bullish convergence condition in monthly MACD. Rise from there would target 38.2% retracement of 2.1161 to 1.1409 at 1.5134. Reaction from there would reveal whether rise from 1.1409 is just a correction, or developing into a long term up trend.
USD/CHF Weekly Outlook
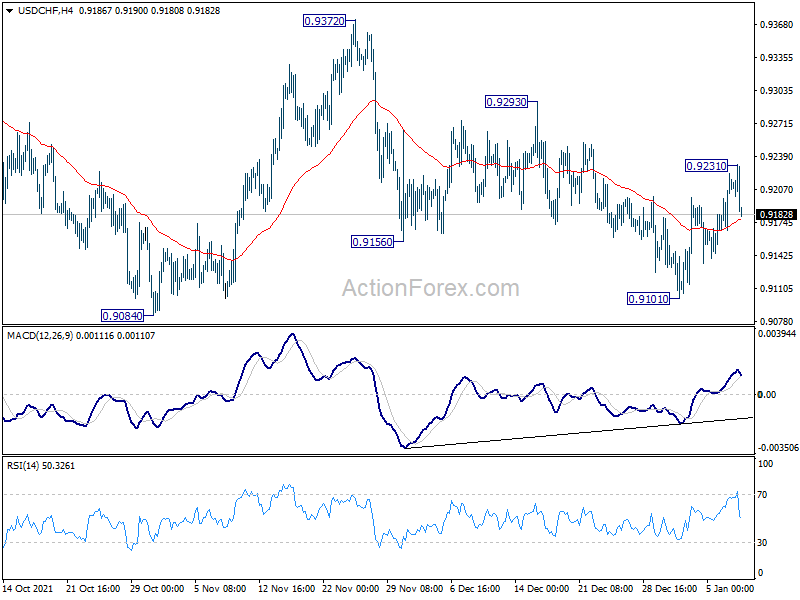
USD/CHF rebounded to 0.9213 last week but retreated since then. Initial bias is neutral this week first. As long as 0.9084 support holds, choppy rise form 0.8925 could still extend higher. Above 0.9213 will target 0.9293 and then 0.9372. However, break of 0.9101 will resume the fall from 0.9372 instead.
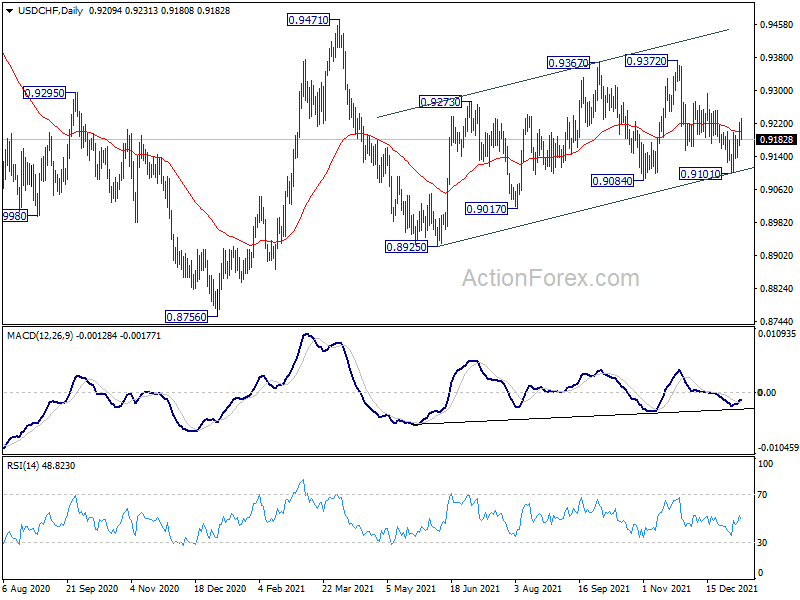
In the bigger picture, the corrective structure of the rebound from 0.8925 argues that fall from 0.9471 is not complete yet. It could either be the second leg of pattern from 0.8756 (2021 low), or resuming larger down trend from 1.0237 (2018 high). We'd pay attention to the downside momentum and assess the odds later. But for now, medium term outlook will be neutral at best as long as 0.9471 resistance holds.
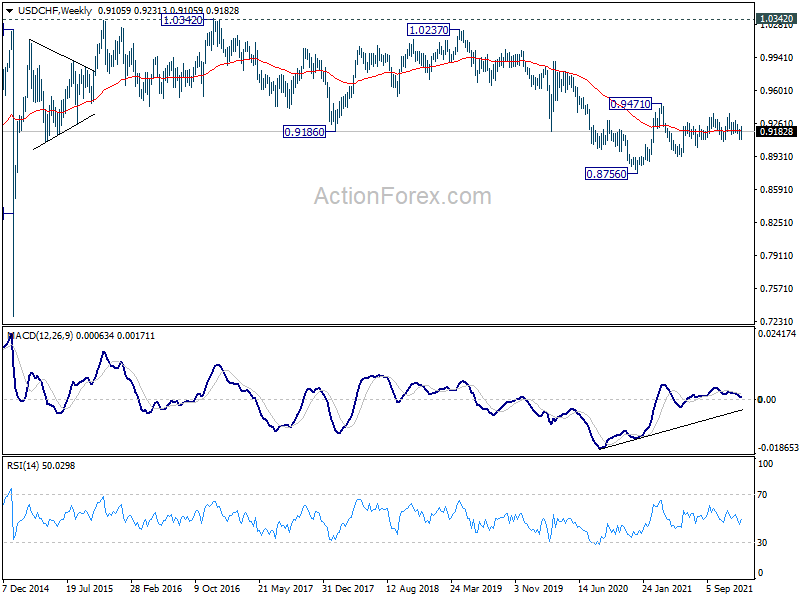
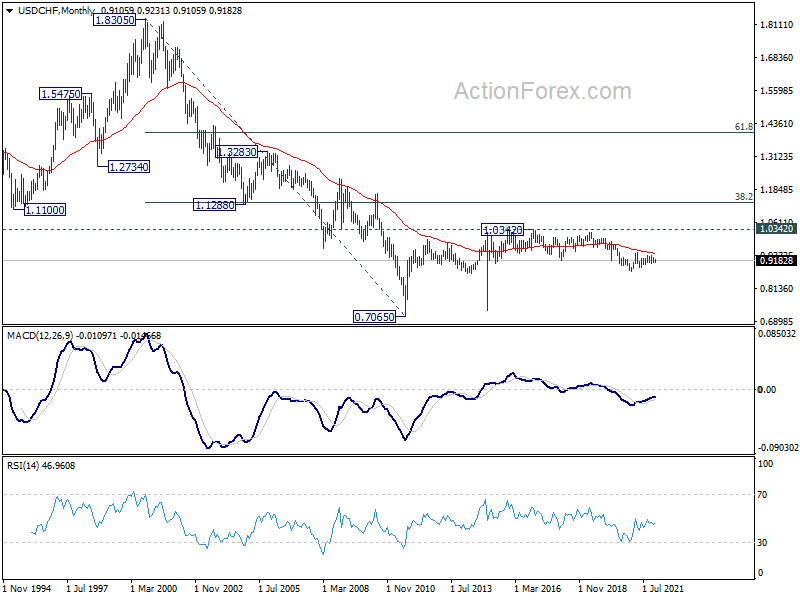
In the long term picture, price actions from 0.7065 (2011 low) are currently seen as developing into a long term corrective pattern, at least until a firm break of 1.0342 resistance.
AUD/USD Weekly Outlook
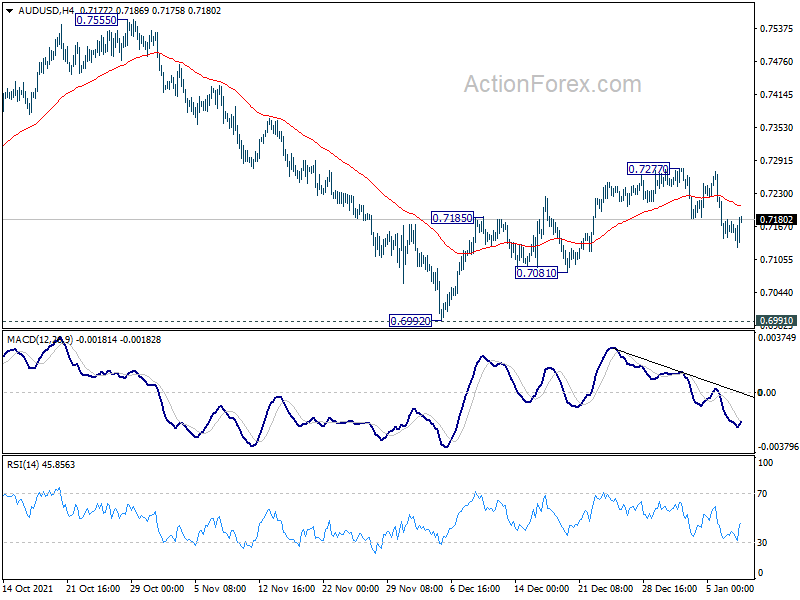
AUD/USD dipped notably last week but stayed above 0.7081 support. Initial bias remains neutral this week first. On the downside, break of 0.7081 support will indicate that corrective rebound from 0.6992 has completed with three waves up to 0.7277, after hitting 55 day EMA. Intraday bias will be back on the downside for retesting 0.6991/2 support zone. Firm break there will resume larger down trend from 0.8006. On the upside, though, break of 0.7277 will turn bias to the upside to resume the rebound.
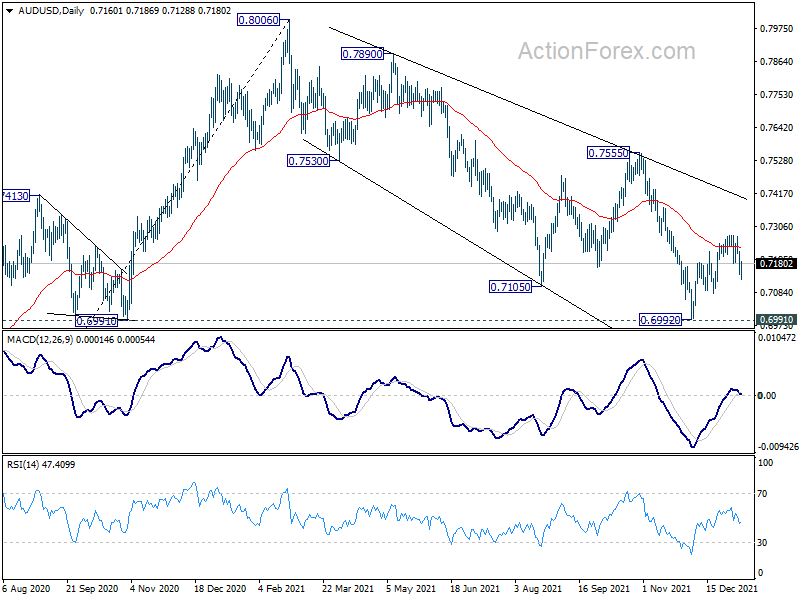
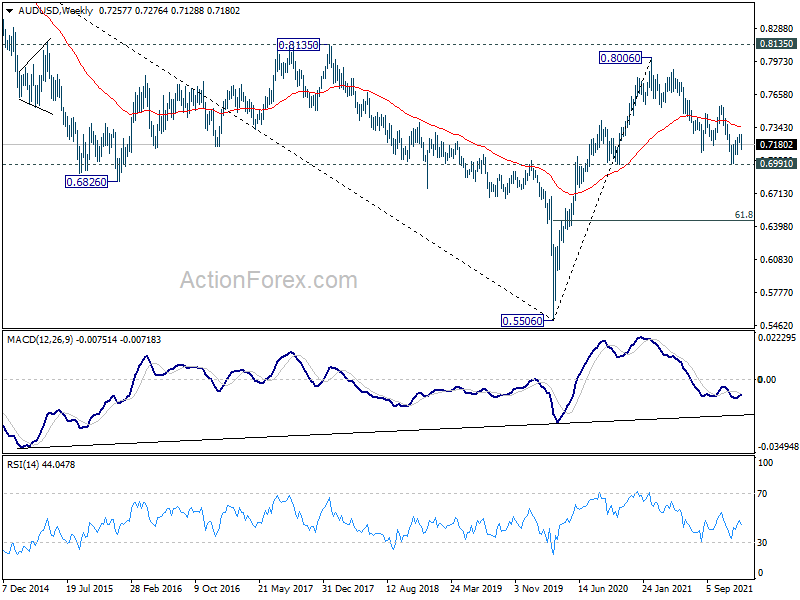
In the bigger picture, strong rebound from 0.6991 key structural support will retain medium term bullishness. That is, whole up trend from 0.5506 is still in progress. Firm break of 0.7555 resistance will target 0.8006 high and above. However, sustained break of 0.6991 will argue that the whole up trend from 0.5506 might be finished at 0.8006, after rejection by 0.8135 long term resistance. Deeper decline would then be seen back to 61.8% retracement of 0.5506 to 0.8006 at 0.6461.
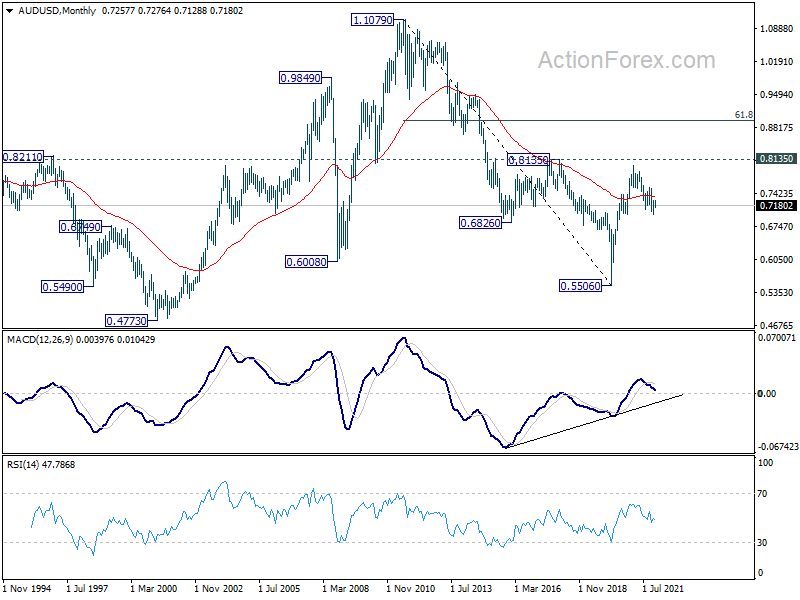
In the longer term picture, focus remains on 0.8135 structural resistance. Decisive break there will argue that rise from 0.5506 is developing into a long term up trend that reverses whole down trend from 1.1079 (2011 high). However, rejection by 0.8135 will keep long term outlook neutral at best.
USD/CAD Weekly Outlook
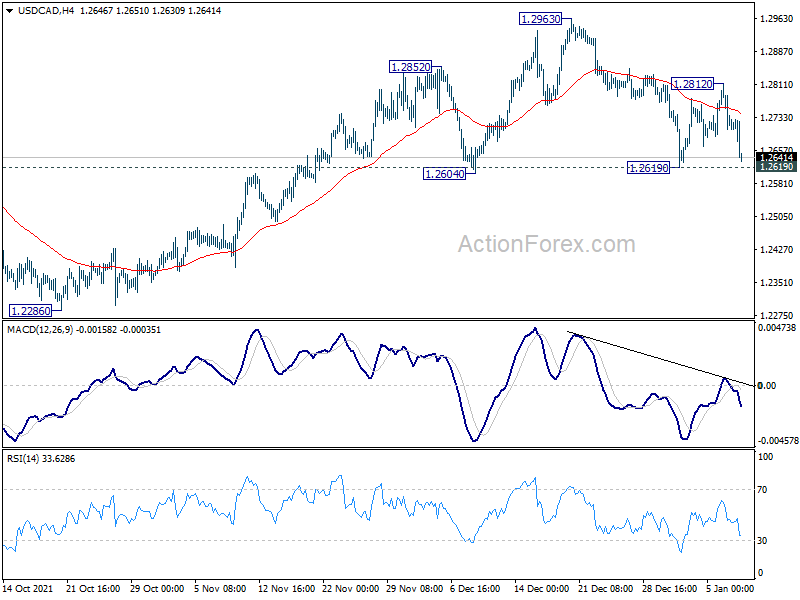
USD/CAD was bounded in range trading last week, between 1.2604/2962. Initial bias stays neutral this week first. On the downside, firm break of 1.2619 support will complete a head and should top pattern (ls: 1.2852, h: 1.2963, rs: 1.2812). That would also argue that whole pattern from 1.2005 has completed with three waves to 1.2963. Intraday bias will be back to the downside for 1.2286 support, and possibly further to 1.2005 low. On the upside, though, above 1.2963 will target 1.3022 key fibonacci resistance.
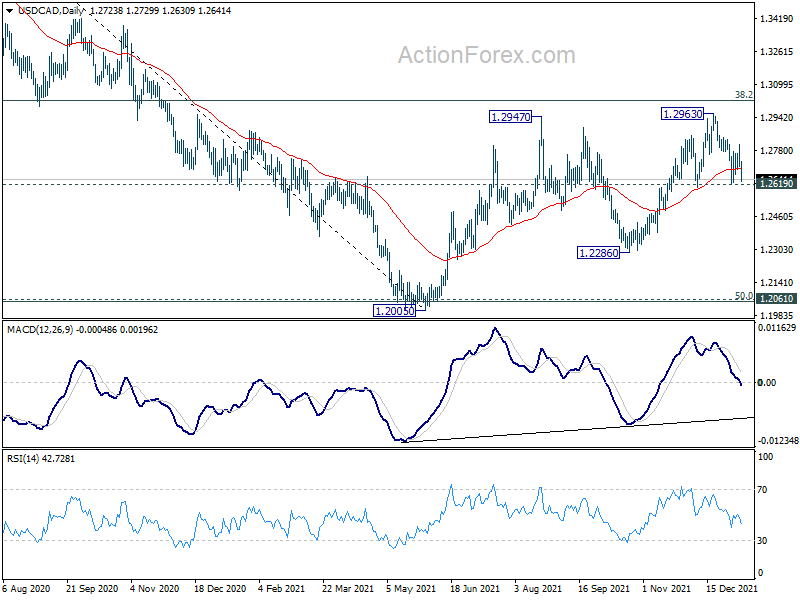
In the bigger picture, focus will be on 38.2% retracement of 1.4667 (2020 high) to 1.2005 (2021 low) at 1.3022. Sustained break there should confirm that the down trend from 1.4667 has completed after defending 1.2061 long term cluster support. Further rise would then be seen towards 61.8% retracement at 1.3650. On the downside, however, break of 1.2286 will turn focus back to 1.2005 low again.
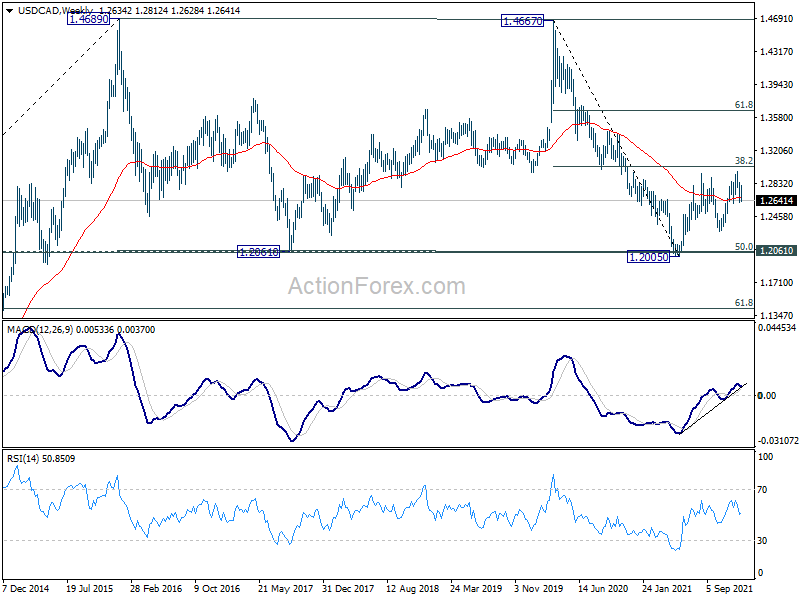
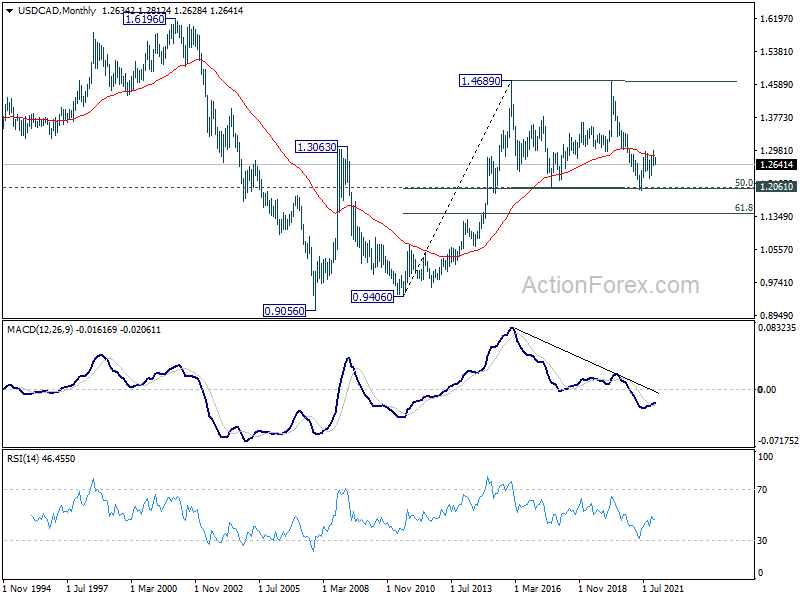
In the longer term picture, we're viewing price actions from 1.4689 as a consolidation pattern. Thus, up trend from 0.9506 (2007 low) is still expected to resume at a later stage. This will remain the favored case as long as 1.2061 support holds, which is close to 50% retracement of 0.9406 to 1.4689 at 1.2048. However, firm break of 1.2061 support will argue that USD/CAD has already started a long term down trend. Next target is 61.8% retracement of 0.9406 to 1.4689 at 1.1424.
GBP/JPY Weekly Outlook
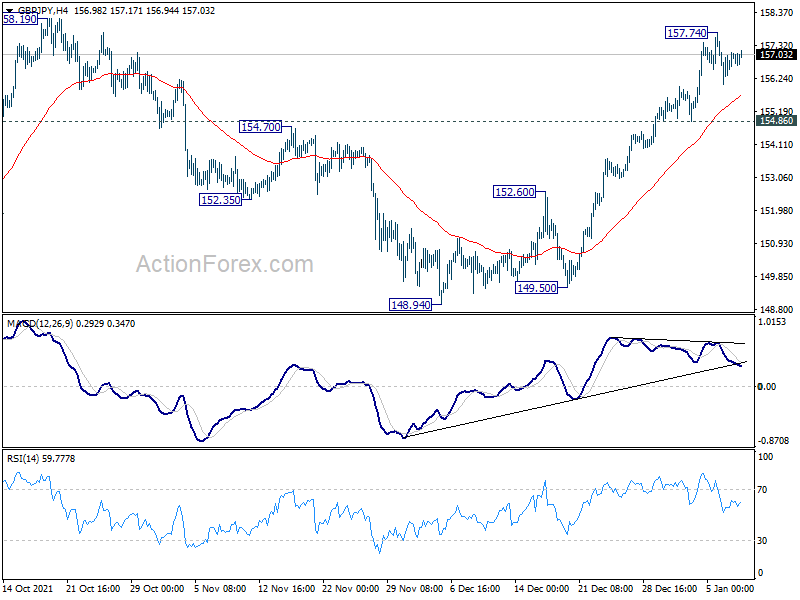
GBP/JPY rose further to 157.74 last week but retreated ahead of 158.19 resistance. Initial bias is neutral this week for some consolidation first. Further rise is expected as long as 154.86 support holds. Decisive break of 158.19 high will resume larger up trend to 167.93 long term fibonacci level. On the downside, below 154.86 minor support will turn intraday bias back to the downside for deeper pull back.
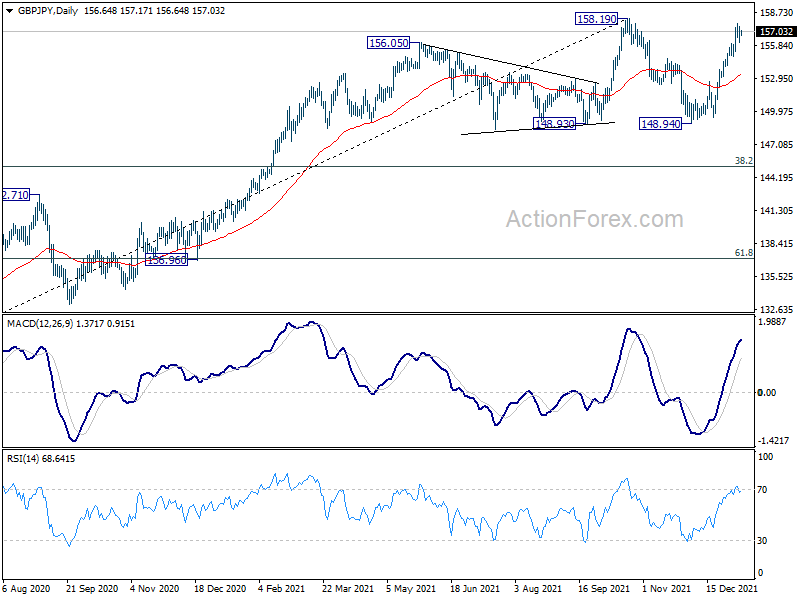
In the bigger picture, strong rebound from 148.93 key structural support retains medium term bullishness. Firm break of 158.19 high will resume whole up trend from 123.94 (2020 low), to 61.8% retracement of 195.86 to 122.75 at 167.93. Nevertheless, firm break of 148.93 will bring deeper correction to 38.2% retracement of 123.94 to 158.19 at 145.10, and possibly further lower, as a correction to up trend from 123.94 at least
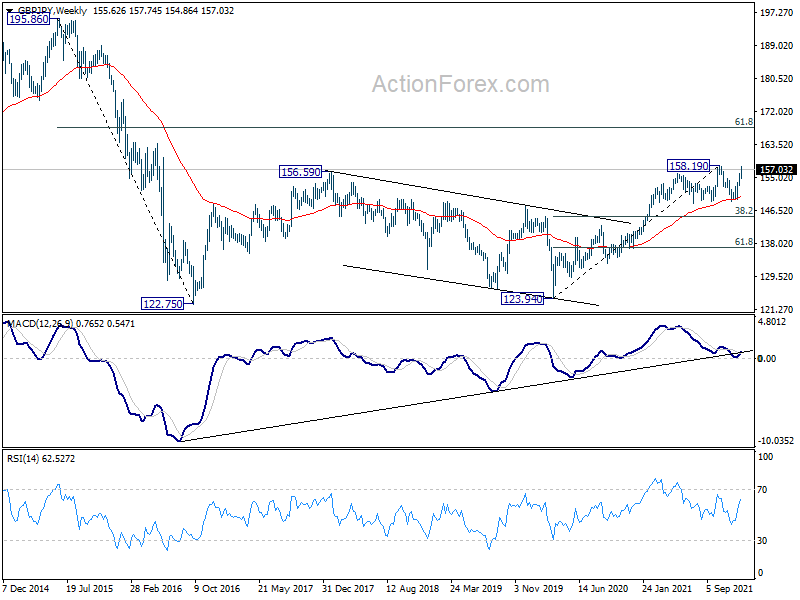
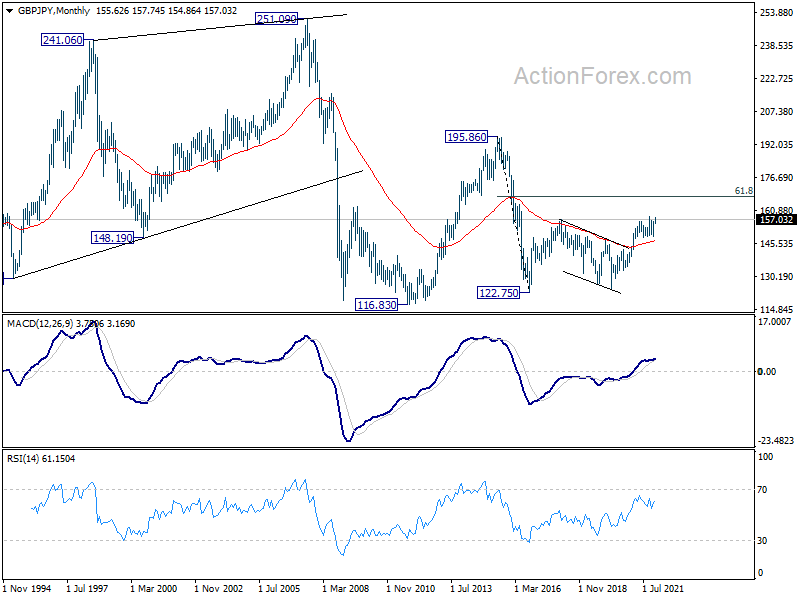
In the longer term picture, as long as 55 month EMA (now at 147.06) holds, we'd still favor more rally to 61.8% retracement of 195.86 to 122.75 at 167.93. But sustained trading below 55 month EMA will at least neutralize medium term bullishness and re-open the chance of revisiting 122.75 low (2016 low).
EUR/JPY Weekly Outlook
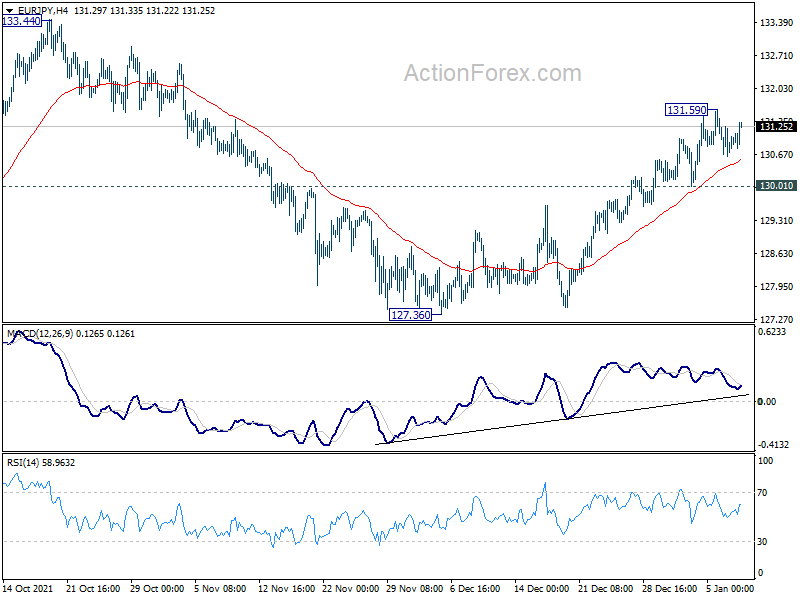
EUR/JPY rose to 131.59 last week but retreated since then. Initial bias stays neutral this week for some consolidations. But further rally is expected as long as 130.01 support holds. Whole consolidation from 134.11 could have completed with three waves down to 127.36, ahead of 126.58 medium term fibonacci level. Break of 131.59 will target a test on 133.44/134.11 resistance zone. On the downside, break of 130.01 minor support will turn bias bias to the downside for retesting 127.36 low instead.
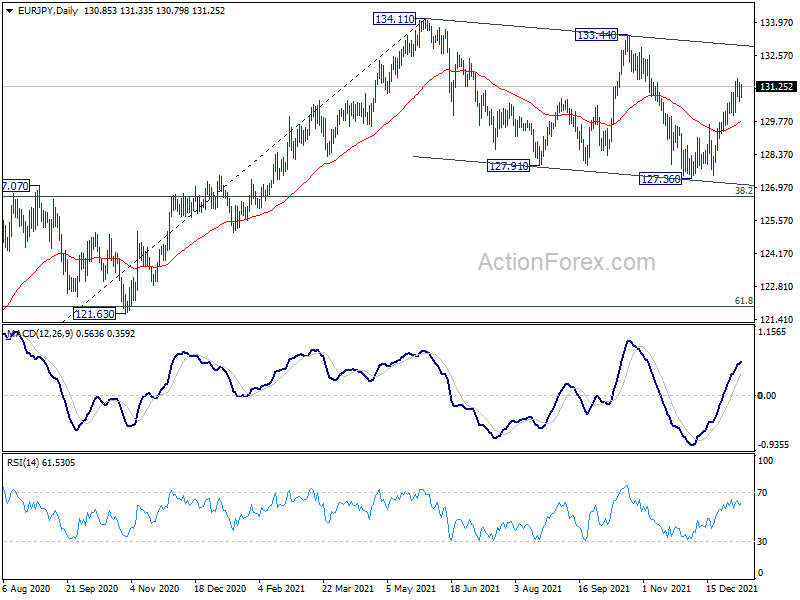
In the bigger picture, as long as 38.2% retracement of 114.42 (2020 low) to 134.11 at 126.58 holds, up trend from 114.42 is still in favor to continue. Break of 134.11 will target long term resistance at 137.49 (2018 high). However, sustained break of 126.58 will raise the chance of medium term bearish reversal. In this case, deeper decline would be seen to 61.8% retracement at 121.94, and possibly below.
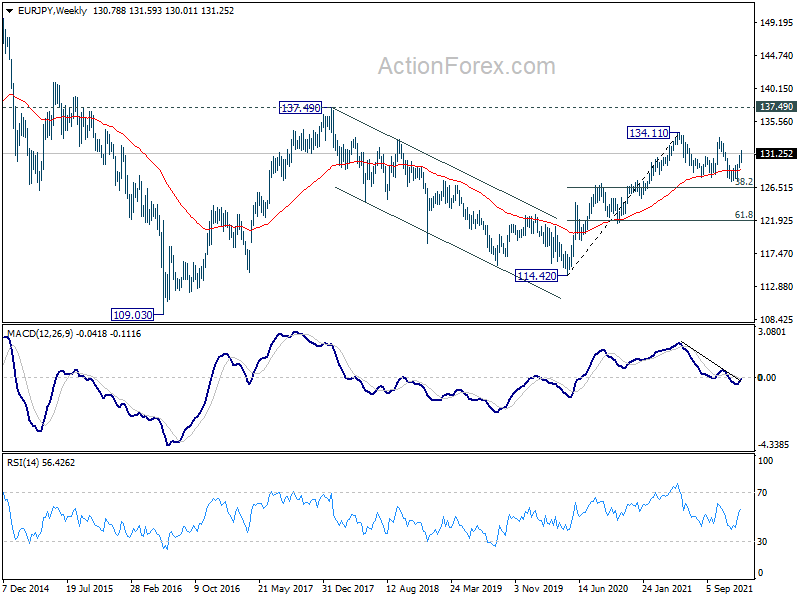
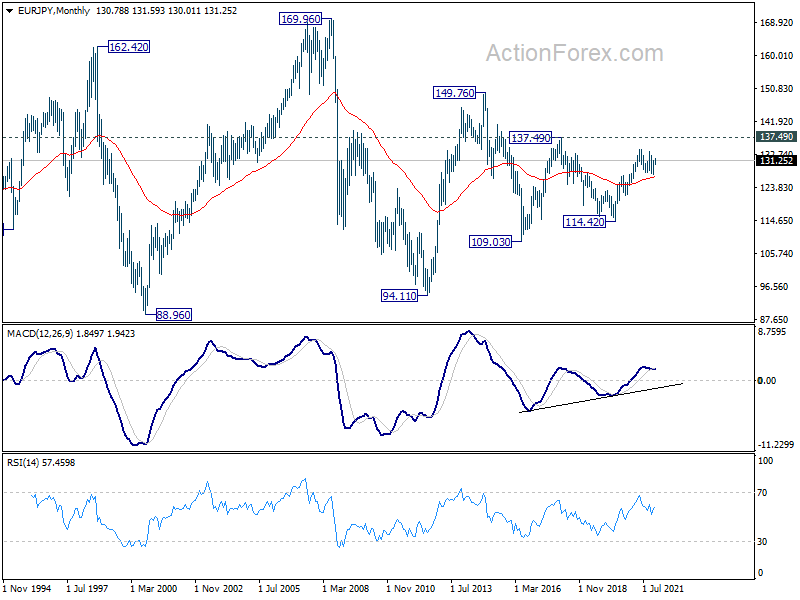
In the long term picture, EUR/JPY is staying in long term sideway pattern, established since 2000. Long term outlook will remain neutral until breakout from the range of 109.03/137.49.
EUR/GBP Weekly Outlook
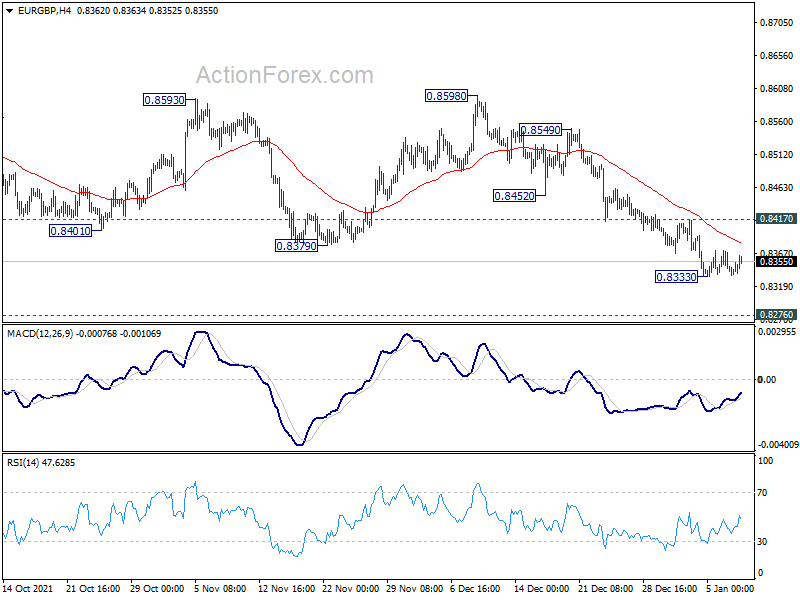
EUR/GBP dropped further to 0.8333 last week but turned sideway since then. Initial bias is neutral this week first for some consolidations. Outlook stays bearish as long as 0.8417 resistance holds. Break of 0.8333 will resume larger down trend for 0.8276 key long term support. On the upside, above 0.8417 minor resistance will turn bias back to the upside for stronger rebound.
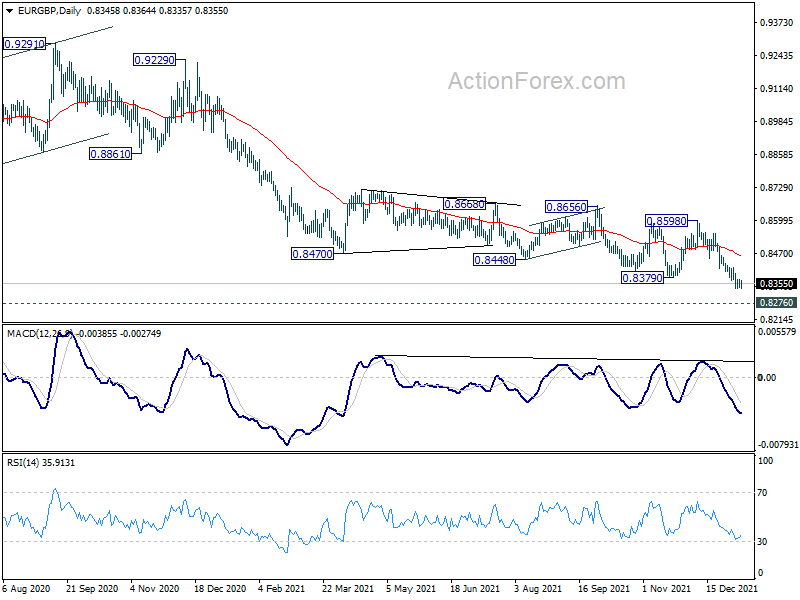
In the bigger picture, price actions from 0.9499 (2020 high) are still seen as developing into a corrective pattern. Deeper fall could be seen as long as 0.8598 resistance holds, towards long term support at 0.8276. We'd look for bottoming signal around there to bring reversal. Meanwhile, firm break of 0.8598 will now be an early sign of medium term bottoming and bring stronger rebound. However, sustained break of 0.8276 will argue that the long term trend has reversed.
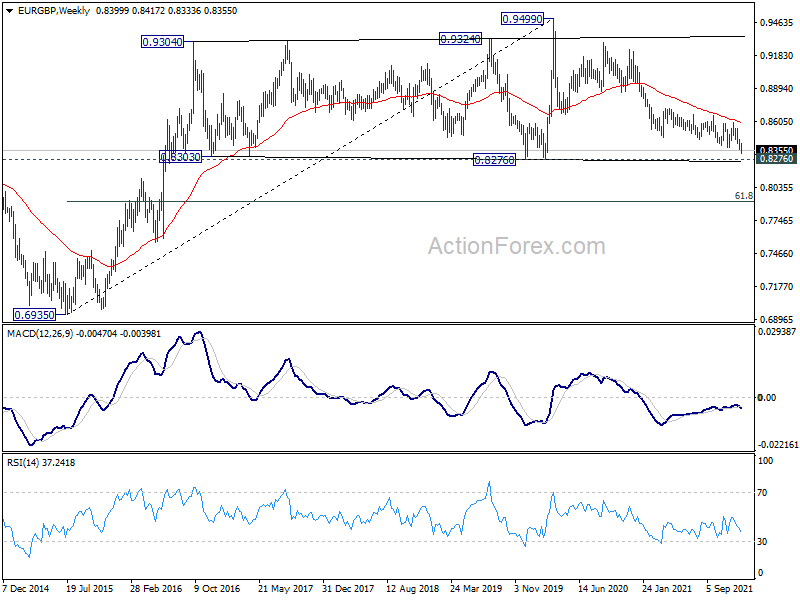
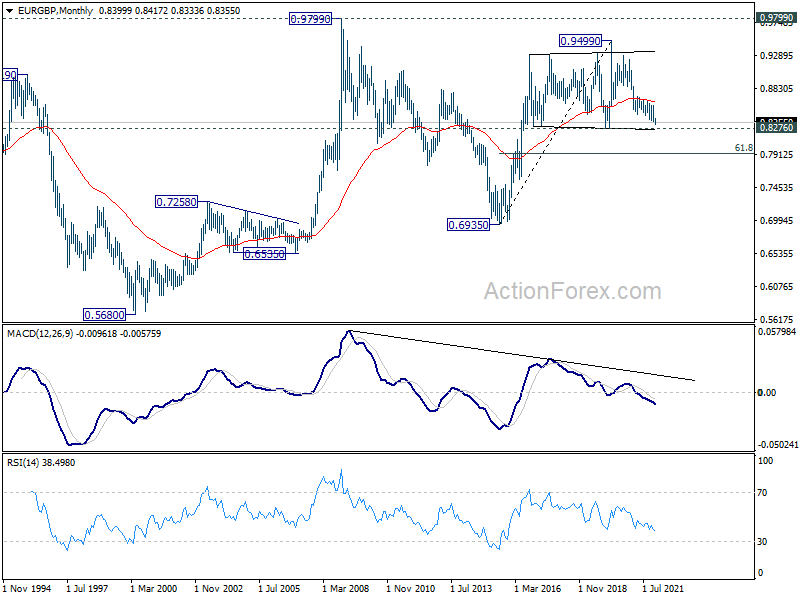
In the long term picture, outlook will stay bullish as long as 0.8276 support holds. Break of 0.9499 is in favor at a later stage, to resume the up trend from 0.6935 (2015 low). However, sustained break of 0.8276 will indicate long term trend reversal, and target 61.8% retracement of 0.6935 to 0.9499 at 0.7917, and possibly below.
EUR/AUD Weekly Outlook
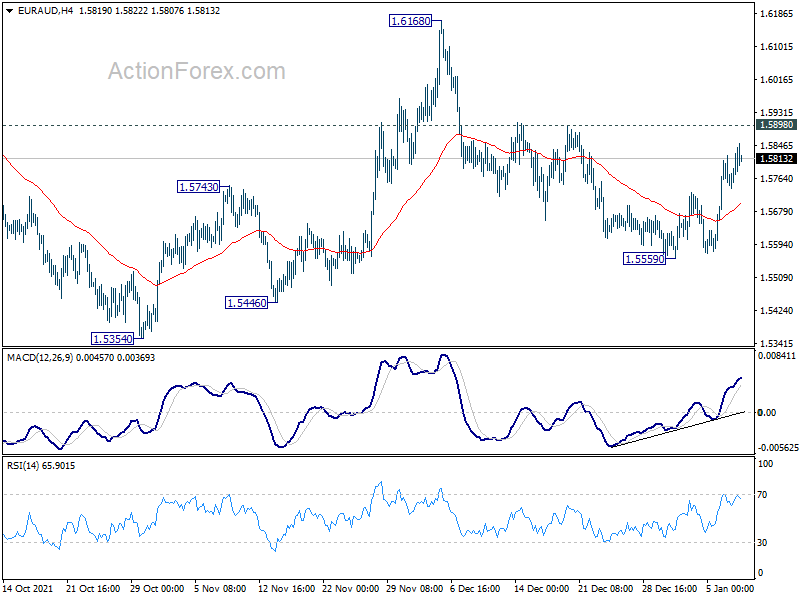
EUR/AUD rebounded notably last week but stayed below 1.5898 resistance. Initial bias remains neutral this week first. On the downside, break of 1.5559 will resume the fall from 1.6168 to retest 1.5250/5354 support zone. On the upside, however, break of 1.5898 will argue that pull back form 1.6168 has completed. Intraday bias will be back to the upside for 1.6168 resistance.
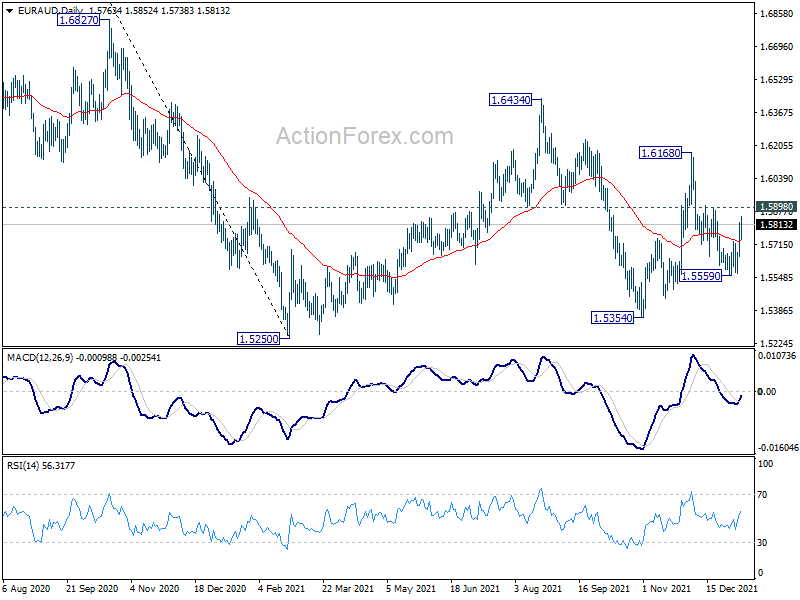
In the bigger picture, rise from 1.5354 is seen as the third leg of the corrective pattern from 1.5250 low. Further rise cannot be ruled out, but even in that case, strong resistance should be seen at 38.2% retracement of 1.9799 to 1.5250 at 1.6988. Larger down trend from 1.9799 is in favor to extend through 1.5250 at a later stage.
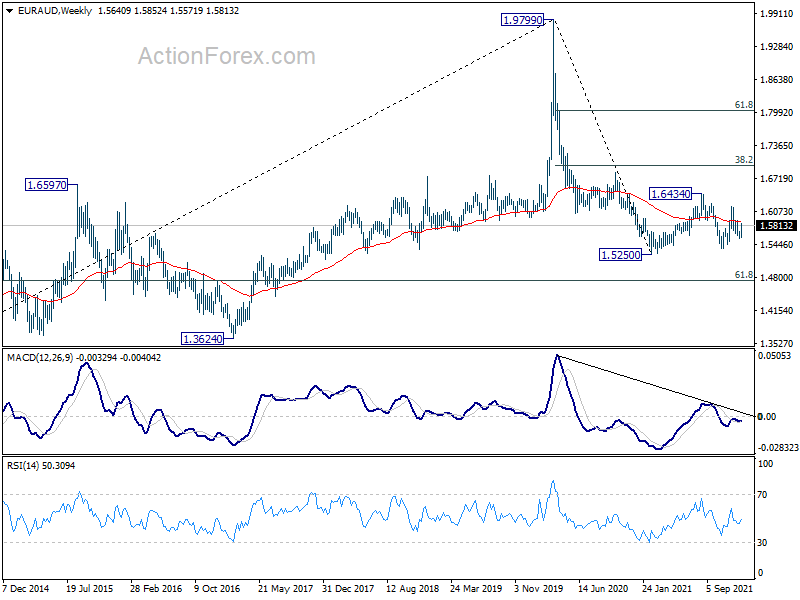
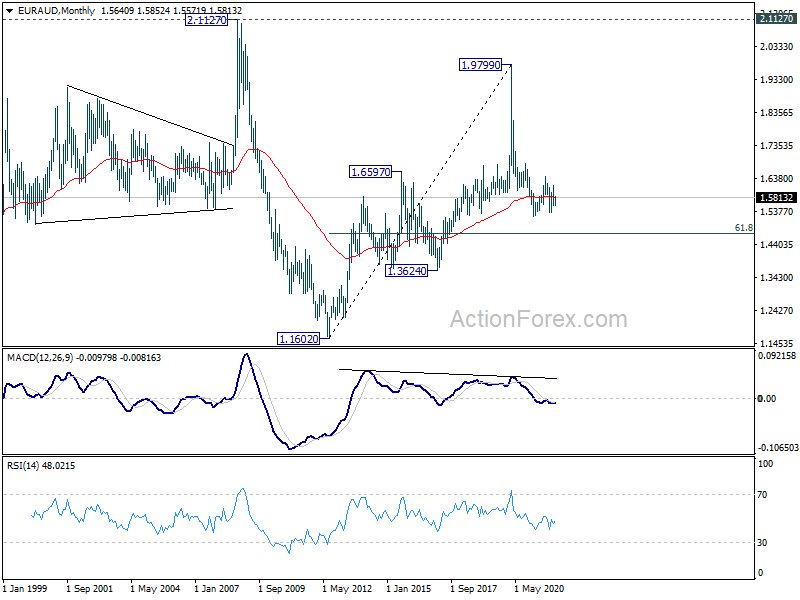
In the longer term picture, fall from 1.9799 (2020 high) is seen as a long term down trend. Further decline will remain in favor as long as 38.2% retracement of 1.9799 to 1.5250 at 1.6988 holds. Break of 1.5250 will target 61.8 retracement of 1.1602 (2012 low) to 1.9799 at 1.4733
EUR/CHF Weekly Outlook
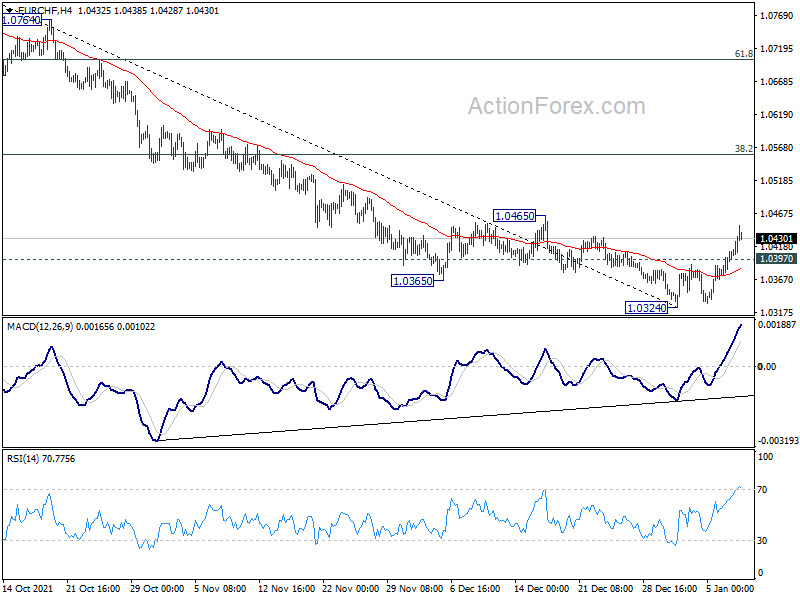
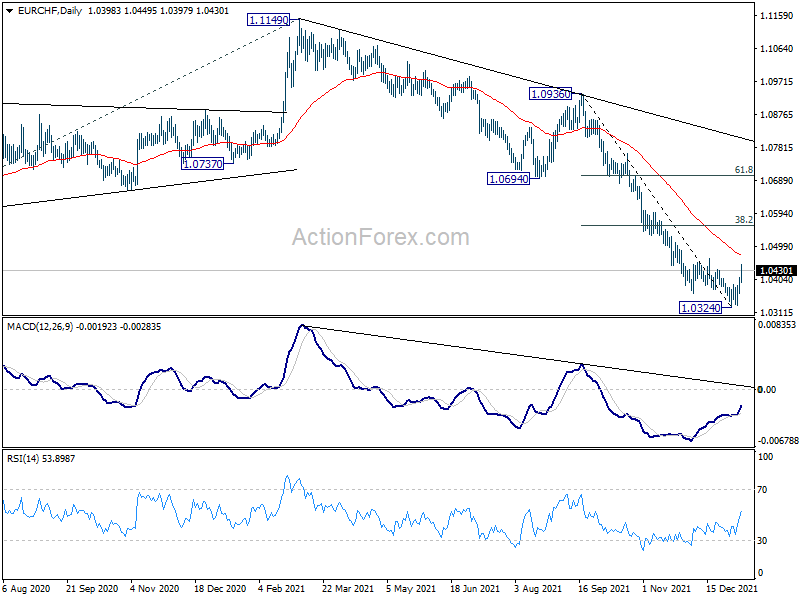
EUR/CHF's strong rebound last week suggests that a short term bottom was already formed at 1.0324, on bullish convergence condition in 4 hour and daily MACD. Initial bias is now on the upside this week for 55 day EMA (now at 1.0474). Sustained break there will target 38.2% retracement of 1.0936 to 1.0324 at 1.0558. On the downside, below 1.0397 minor support will bring retest of 1.0324 low instead.
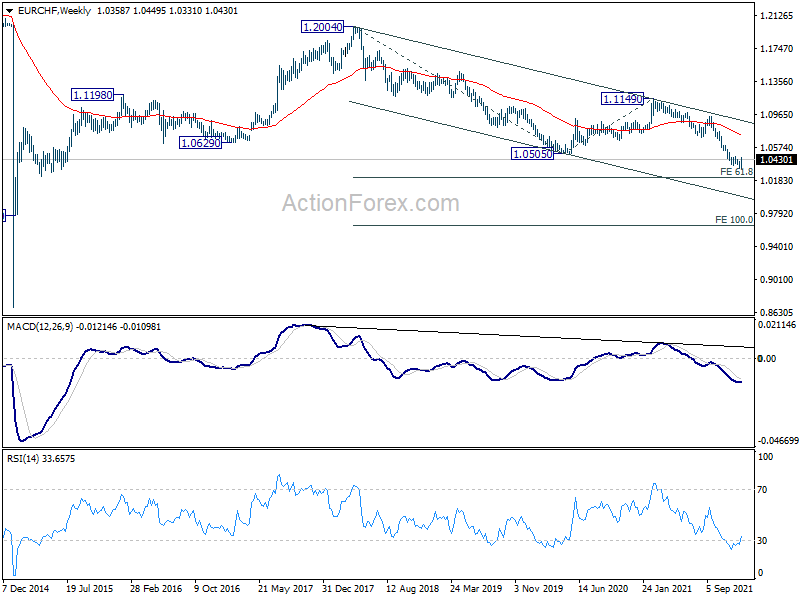
In the bigger picture, long term down trend from 1.2004 (2018 high) is now extending. Next target is 61.8% projection of 1.2004 to 1.0505 to 1.1149 at 1.0223. On the upside, break of 1.0505 support turned resistance is needed to be the first sign of medium term bottoming. Otherwise, outlook will remain bearish even in case of rebound.
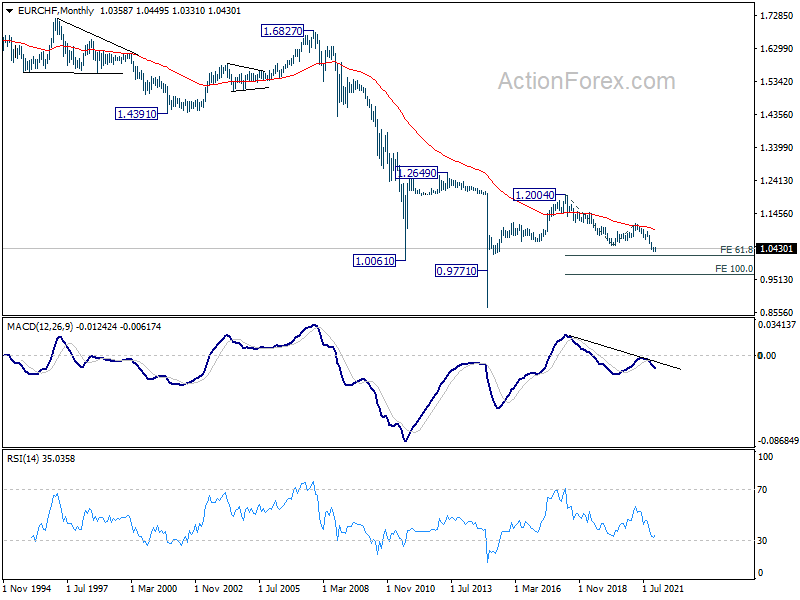
In the long term picture, rejection by 55 month EMA (now at 1.1015) maintains long term bearishness. Down trend from 1.2004 is now in progress for 61.8% projection of 1.2004 to 1.0505 to 1.1149 at 1.0223. Firm break there will target 100% projection at 0.9650.
Dollar Failing to Ride on Hawkish Fed and Surging Yields
It was a roller coaster ride as traders came back for the new year. Markets were in full risk-on mode as worries over Omicron faded. Yet, sentiment turned after more hawkish than expected FOMC minutes. Major stock indexes were than in deep pull back. Major global benchmark treasury yields powered through key resistance level.
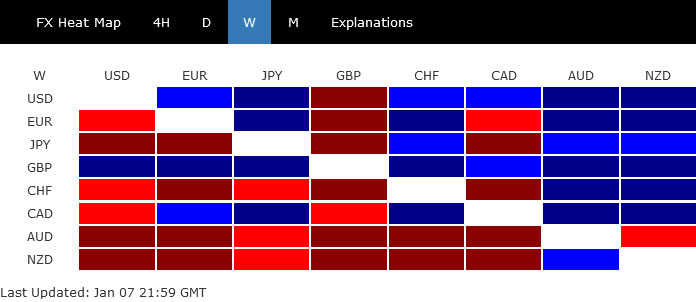
In the currency markets, Sterling was the surprised winner. Dollar, ended as the second strongest, has indeed failed to ride on hawkish Fed and surging yields. The greenback was more mixed than the currency heat map suggested. Yen regained some ground ground after initial selloff. Aussie and Kiwi were the worst performer, and would be guided by overall risk sentiment ahead.
Markets adding more bets to March Fed hike
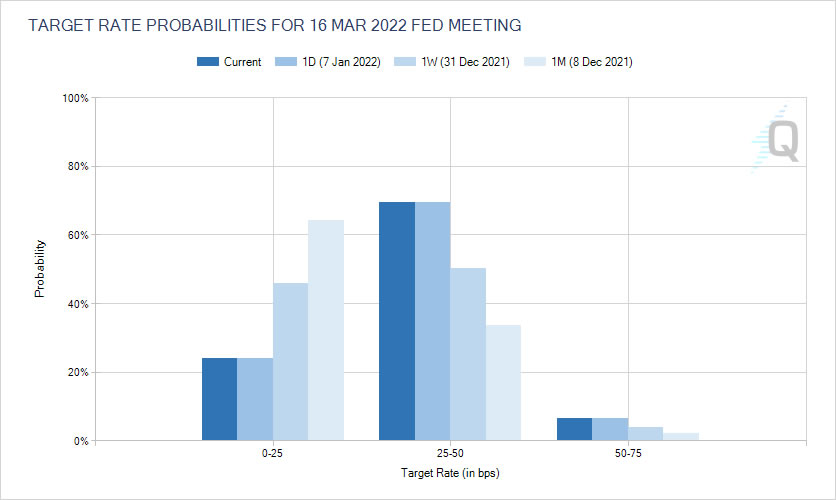
The surprisingly hawkish minutes of December FOMC meeting were the main driver of market volatility last week. Fed is not only seen as ready to raise interest rate as early as in March. It's even starting to thinking about shrinking the balance sheet soon after rate lift off.
The December non-farm payroll report might disappointed the markets with the much weaker than expected job growth. Yet, unemployment is back below 4% at 3.9%. Wage growth accelerated with average hourly earnings gaining an impressive 0.6% mom. The set of data indicated tightness in the labor market which would continue to put upward pressure on wages and thus inflation. Fed should have came out in a stronger position for stimulus remove.
Indeed Fed funds futures are now pricing in nearly 76% of a rate hike in March, comparing to 65% a week ago, and 36% a month ago.
S&P 500 staying in up trend despite deep pull back
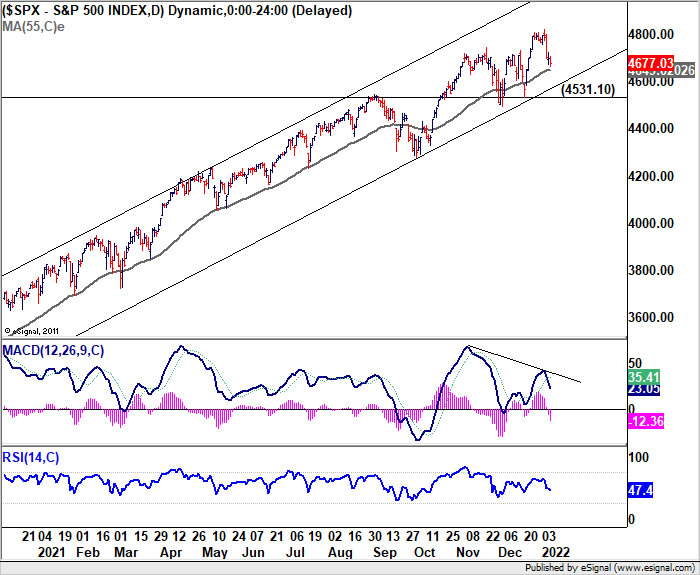
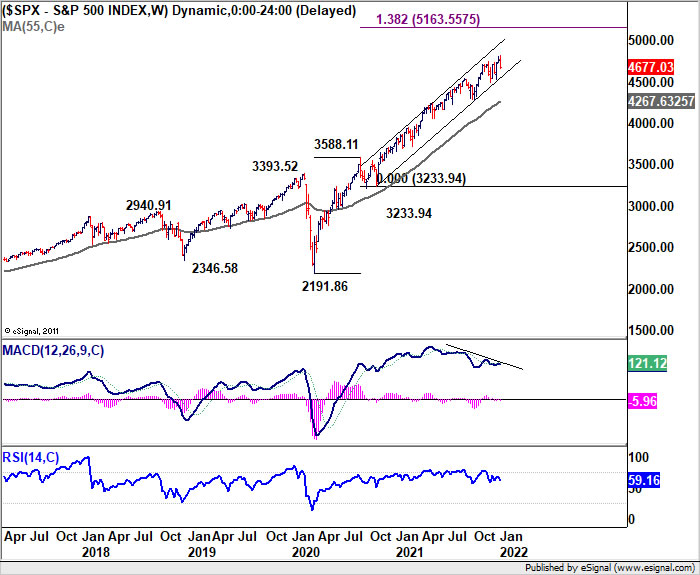
Stocks had a rather deep pull back on hawkish Fed, but there was no disaster. S&P 500 is losing upside momentum as seen in daily MACD. But there is no clear sign of major topping yet, with the index staying above 55 day EMA and well inside the medium term rising channel. Current up trend is still on track to 5000 handle, and even further to 138.2% projection of 2191.86 to 3588.11 from 3233.94 at 5163.55.
Nevertheless sustained trading below 55 day EMA (now at 4649.02) will be the first warning of reversal. Further break of 4531.10 support will indicate the start of a medium term correction.
10-year yield resumes medium term up trend towards 2% and above
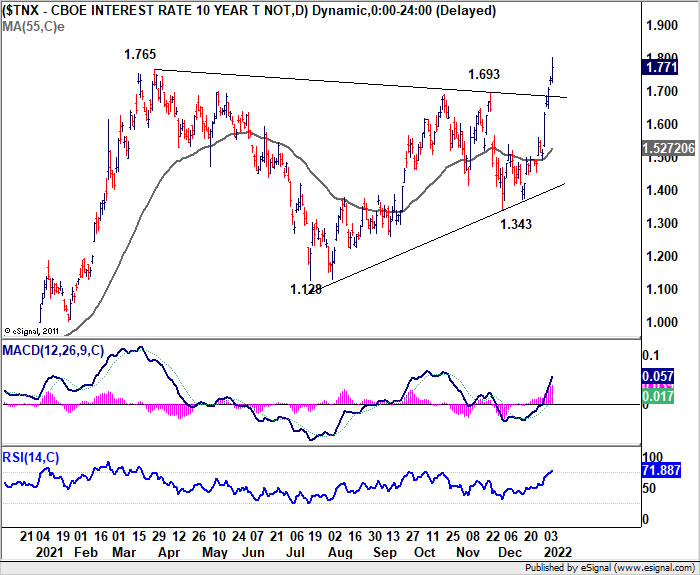
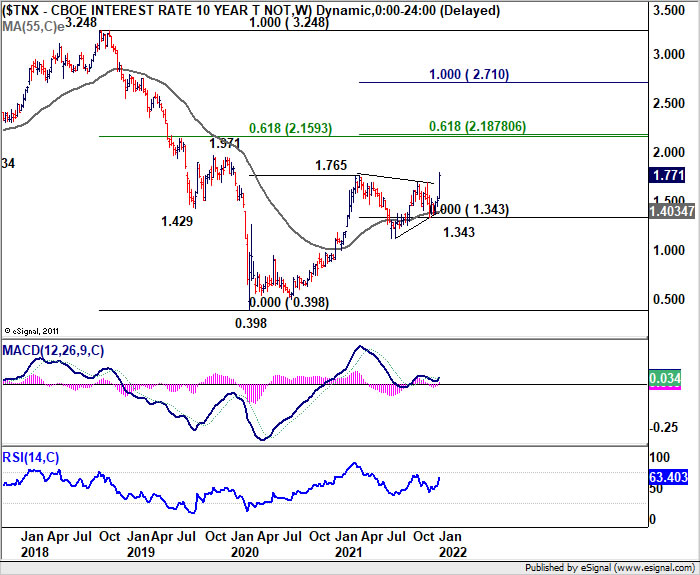
10-year yield surged through 1.765 key resistance to close at 1.771. The development should confirm resumption of whole up trend from 0.398. The strong support from 55 week EMA also affirm medium term bullishness. TNX should target 2% handle, and possibly above.
The next critical zone will be at 61.8% retracement of 3.248 to 0.398 at 2.159, which is close to 61.8% projection from 0.398 to 1.765 from 1.343 at 2.187. Some defining development would need to happen before we see TNX pushing with this resistance zone with conviction.
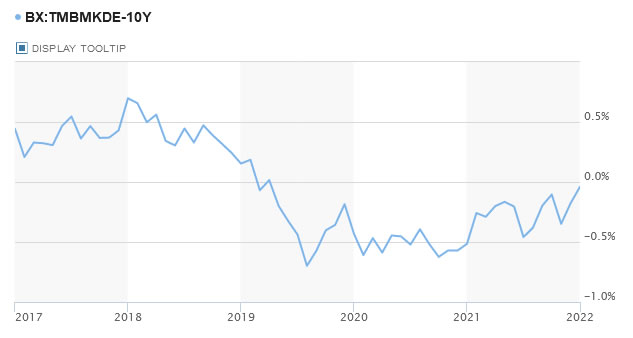
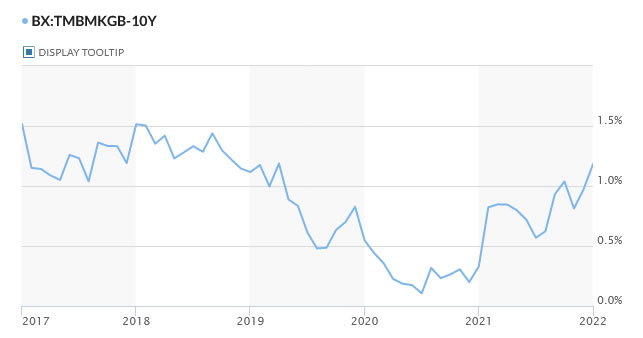
The rally in US treasury yield lost much of the impact on Dollar, as other global benchmark yields were catching up quickly. Germany 10-year bund yield rose to close at -0.04, hitting the highest level since 2019, and looks set to turn positive soon. UK 10-year gilt yield also rose to close at 1.182, highest since 2019. Even Japan 10-year JGB yield surged to 0.135, back above 0.1% handle in nearly a year.
Dollar staying bullish in consolidation... for now
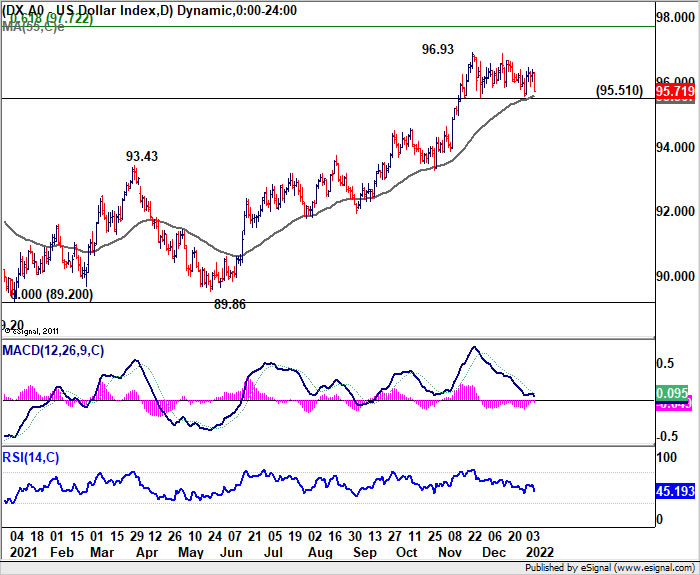
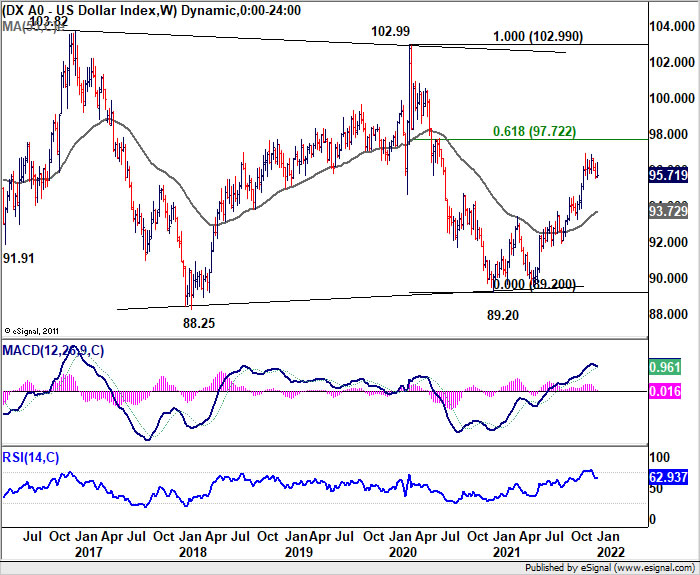
Dollar index stayed in range below 96.93 last week and outlook is unchanged. Further rise is expected as long as 95.51 support holds. The rally from 89.20 should extend to 61.8% retracement of 102.99 to 89.20 next. However, firm break of 96.93 would bring deeper pull back towards 55 week EMA (now at 93.72) instead.
Bitcoin to extend down trend towards 35k
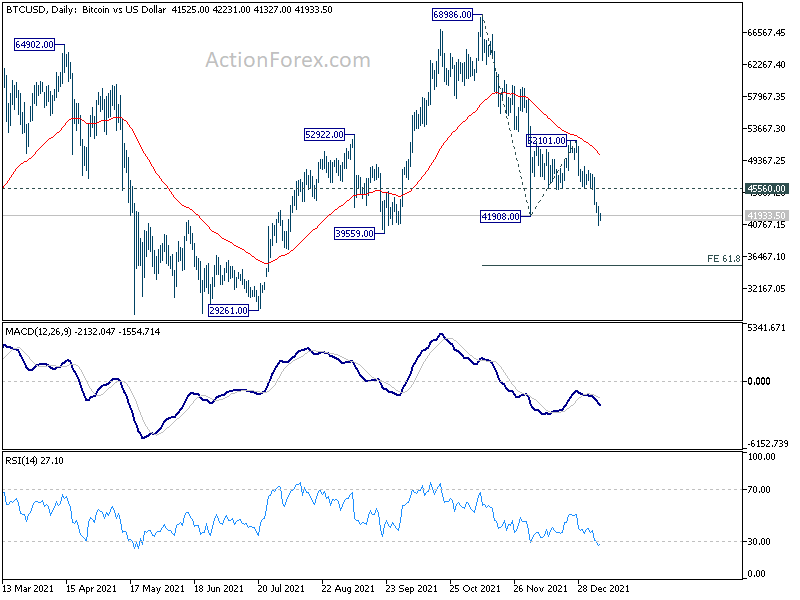
Some other markets seemed to have much more committed response to Fed. For example, Bitcoin dived through 41908 low to resume the decline from 68986. Such fall is seen as at the same degree as the rise from 29161 to 68986. While there might be some support around 39559, which is close to 40k handle, to bring recovery. Upside should be limited by 45560 support turned resistance. Bitcoin should have a take on 61.8% projection of 68986 to 41908 from 52101 at 35366 before forming a bottom.
Gold might have completed recovery, heading back to 1700
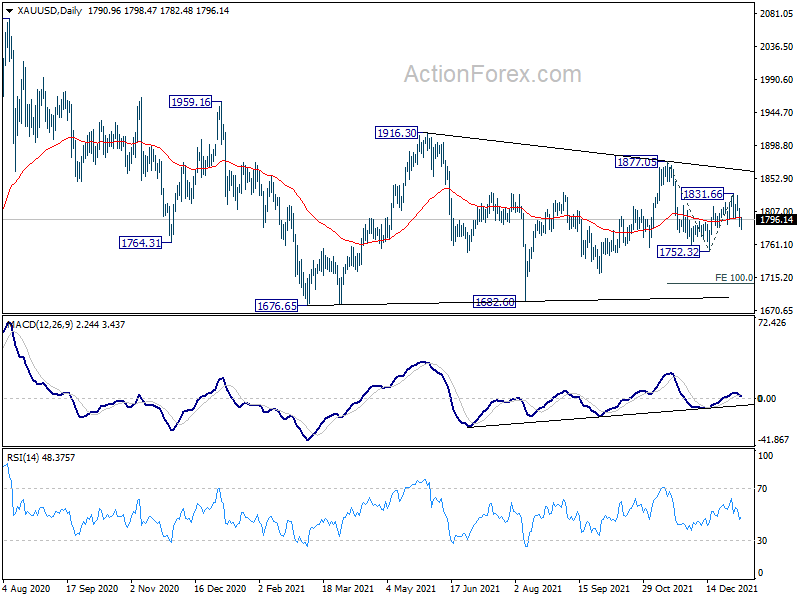
Gold's decline argues that recovery from 172.32 has completed at 1831.66. Fall from 1877.05, as the fourth leg of the pattern from 1676.65, is probably ready to resume. Sustained trading below 55 day EMA (now at 1798.60) will target 1752.32 support. Break will confirm this bearish case and target 100% projection of 1877.05 to 1752.32 from 1831.66 at 1706.93.
GBP/USD Weekly Outlook
GBP/USD's rebound from 1.3158 extended higher last week and breached 1.3570 support turned resistance. The development affirms the view that corrective fall from 1.4248 as complete with three waves down to 1.3158, after hitting 1.3164 medium term fibonacci level. Sustained trading above 1.3570 will pave the way to 1.3833 resistance next. On the downside, though, break of 1.3489 minor support will mix up the outlook and turn intraday bias neutral first.
In the bigger picture, strong support was seen from 38.2% retracement of 1.1409 to 1.4248 at 1.3164. The development suggests that up trend from 1.1409 (2020 low) is still in progress. On resumption, next target will be 38.2% retracement of 2.1161 to 1.1409 at 1.5134. Nevertheless sustained break of 1.3164 will argue that whole rise from 1.1409 has completed and bring deeper fall to 61.8% retracement at 1.2493.
In the longer term picture, a long term bottom should be in place at 1.1409, on bullish convergence condition in monthly MACD. Rise from there would target 38.2% retracement of 2.1161 to 1.1409 at 1.5134. Reaction from there would reveal whether rise from 1.1409 is just a correction, or developing into a long term up trend.