Sample Category Title
NZD/JPY and AUD/JPY breaking down with US stocks
NZD/JPY and AUD/JPY are breaking down, together with US stocks. At the time of writing, DOW is down -1.5%, S&P 500 down -1.78% and NASDAQ even -2.5%.
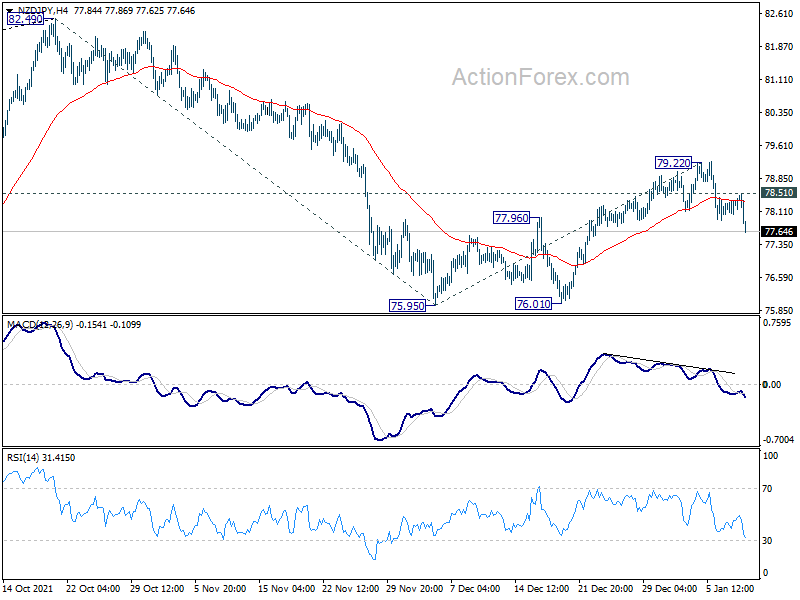
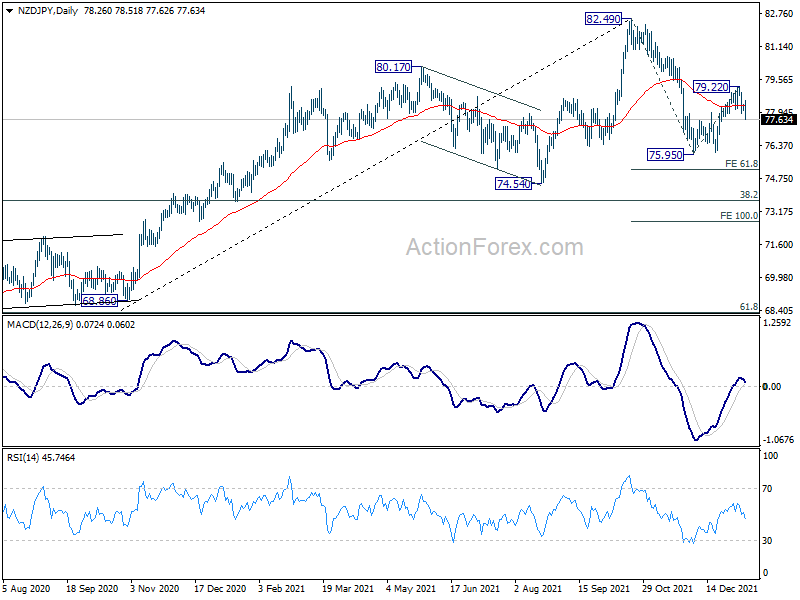
NZD/JPY's strong break of 77.96 resistance turned support should confirm that corrective pattern from 75.95 has completed with three waves up to 79.22. Deeper fall should now be seen through 75.95, to resume the whole decline from 82.49 to 61.8% projection of 82.49 to 75.95 from 79.22 at 75.17 next. On the upside, above 78.51 minor resistance will delay the bearish case.
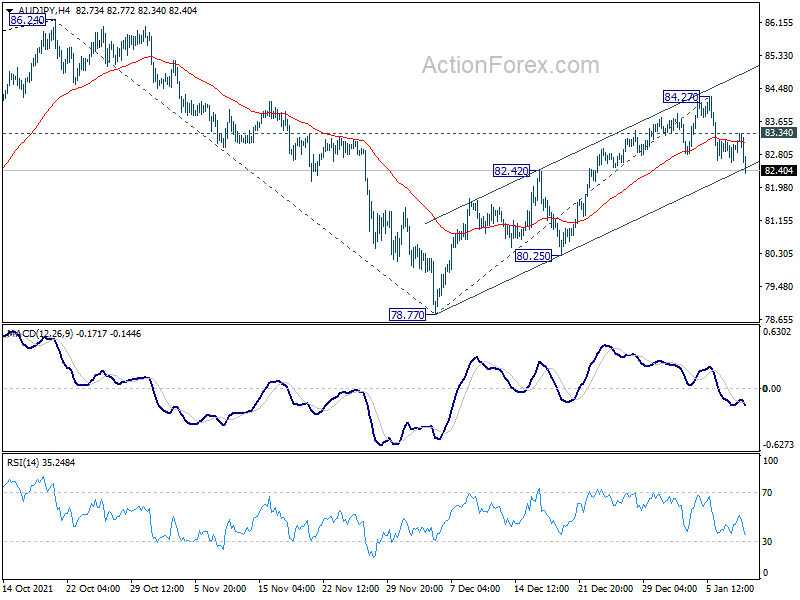
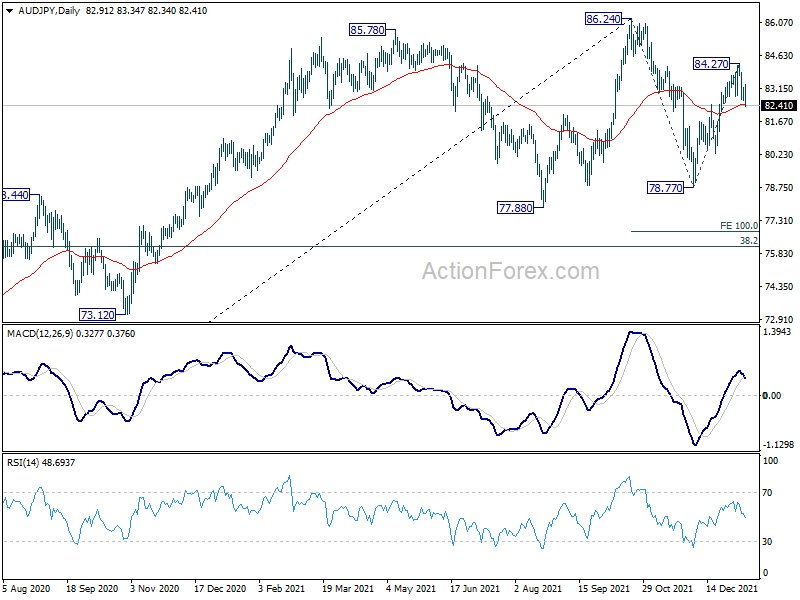
AUD/JPY also follow and breaches 82.42 support turned resistance. Further downside acceleration will confirm the corrective rebound from 78.77 has completed with three waves up to 84.27. In this case, deeper fall would likely be seen through 78.77, to resume the pattern from 86.24 to 100% projection of 86.24 to 78.77 from 84.27 at 76.80. Meanwhile, above 83.34 minor resistance will mix up the outlook.
Gold Analysis: Recovers to Trade above 1,800.00
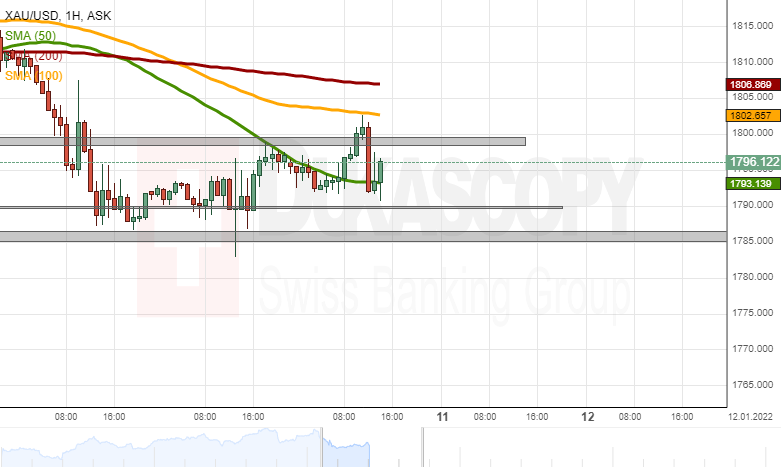
At mid-day on Monday, the price for gold broke the resistance of the 1,800.00 mark and shortly traded above this level. However, the surge was stopped and reversed by the 100-hour simple moving average at 1,802.65.
If the price for gold continues to decline, it could look for support in the 1,790.00 mark. Further below, the 1,785.00 level and the zone above it, might stop depreciation of the price.
Meanwhile, a surge of the pair would most likely find resistance at the 1,800.00 level and the 100 and 200-hour simple moving averages near 1,802.65 and 1,806.85.
Sunset Market Commentary
Markets
It’s testament to current market sentiment that Friday’s comments by the ranking number two in Frankfurt, ECB chief economist Lane, barely caught attention whereas weekend comments by ECB governing council member Schnabel are today’s talk of town. The notoriously dovish Lane stuck to the ECB’s December inflation forecasts and view of fading inflation over the policy horizon after transitory factors disappear. Schnabel addressed the risk that higher energy prices could nevertheless warrant a policy reaction. Tackling climate change could come at a more permanent energy cost, she argues, and filter into higher inflation expectations from economic agents and even in a wage/price spiral. Climate measures like carbon taxes or compensation measures add to upside inflation risks. Using elevated energy prices as a reason to accelerate policy normalization rather than sticking to an accommodative policy would mark a complete ECB U-turn. We haven’t arrived at that point yet, but closely monitor the issue. Markets are also thinking it that same direction. Whereas the ECB stressed at its December policy meeting that net asset purchases will be conducted at least until the end of the year and continue to have an open-ended character, markets started adding rate hike bets for end 2022/early 2023 in spite of forward guidance stating a lengthy pause between ending net asset purchases and the rate lift-off. Since the eve of the December 15 ECB meeting, the December 2022 3 month Euribor contract trades at -0.31%, up from -0.365. The yield on the December 2023 contract increased from -0.07% to +0.115%, suggesting a positive ECB deposit rate by end 2023 compared to -0.50% currently. The European swap rate curve bear steepened over that same period with yields rising by 7 bps (2-yr) to 29 bps (30-yr). Real yields move away from rock-bottom levels. Technically, the EU 10y swap rate moved beyond the previous 0.33% recovery high, to currently test 0.4% resistance. That’s 50% retracement on the decline during 2018-2019. A break higher suggests further upward potential towards the 0.6% area.
Today’s intraday market dynamics didn’t really differ from the start of the year. Core bonds remain near/at sell-off lows. US yields add 2.3 bps (2-yr) to 4.5 bps (7-yr) with the belly of the curve underperforming the wings. The US 10-yr yield trades above the previous recovery top (1.8% vs 1.77%) going into this week’s CPÏ print (Wednesday; 7% Y/Y expected) and supply operation. Especially 10y and 30y Note/Bond sales on Wednesday/Thursday will be closely monitored. German yields rise 0.5 bps (2-yr) to 2 bps (30-yr) today in a bear steepening move. The German 10-yr yield has the psychologic 0% mark within reach. 10-yr yield spread changes vs Germany are broadly unchanged with Italy (--3 bps) outperforming in an unwinding move after last week’s syndicated supply. The Kingdom of Spain joins the frontloading efforts by announcing a new 10y benchmark. The deal will normally happen tomorrow. Rising core yields, and especially their real rate component, pull European stock indices up to 1% lower. EUR/USD remains within the established trading range, with the dollar today being the intraday beneficiary. The pair changes hands at 1.1293. EUR/GBP tested the 0.8335 sell-off low, but a break didn’t occur for now. News Headlines
Norwegian inflation sprinted to 5.3% in December, compared to the expected status quo at 5.1% the month before. It’s the highest reading since 2008. Soaring electricity prices explained much of the move. However, the underlying gauge also rose from 1.3% y/y to 1.8% (1.4% expected). The data support the Norges Bank’s case to further normalize monetary policy since it started raising rates in September last year. Back in December and after hiking rates for a second time (to 0.5%), the central bank hinted it would increase policy rates for a third time in March this year. The Norwegian krone weakens slightly vs the euro today though the move is mainly sentiment-driven. EUR/NOK trades north of 10(.05).
EUR/USD Analysis: Breaks Triangle Pattern
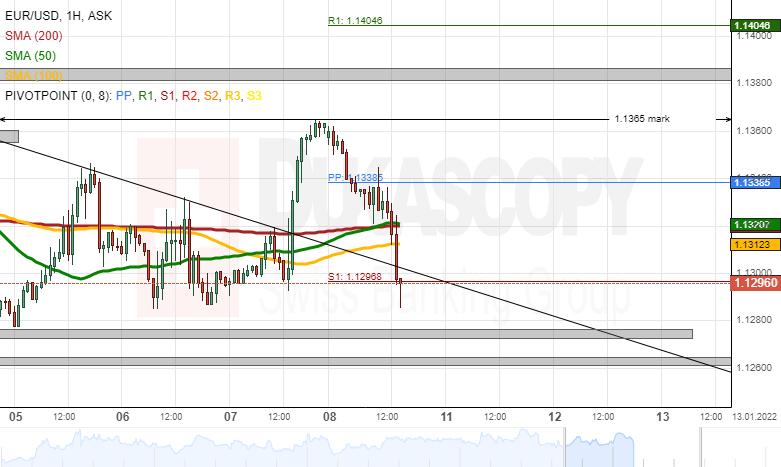
The EUR/USD broke the triangle pattern in a sharp move upwards, as it should have happened in theory of the triangle. The surge ended at the 1.1365 level. From that level the currency exchange rate started a decline. By the middle of Monday's European trading hours, the rate had returned to the 1.1300 mark.
A further decline of the Euro against the US Dollar would need to pass the support of the weekly S1 simple pivot point at 1.1297. Afterwards, the pair could reach for the January low level zone at 1.1272/1.1277. Further below, the December 21 and 22 low levels might act as support at 1.1260/1.1265.
On the other hand, a recovery of the pair might find resistance in the combination of the 50, 100 and 200-hour simple moving averages near 1.1310/1.1320. Higher above, note the weekly simple pivot point at 1.1339.
USD/JPY Analysis: Reveals Channel Pattern
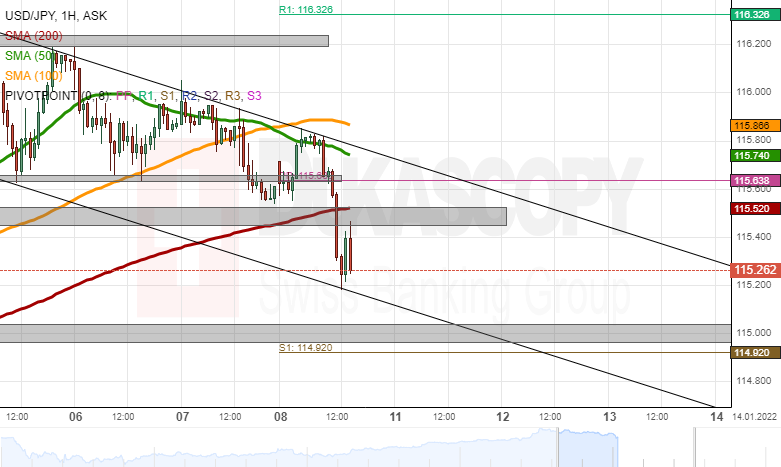
A recovery of the USD/JPY pair from the 115.20 level on Monday revealed the lower border of a channel-down pattern. The pattern has been guiding the rate since January 4. During the second half of Monday's trading, the rate was located between the 115.20 mark and the zone that surrounds the 115.50 level.
If the currency exchange rate declines, the 115.20 mark might act as support. Further below, the 115.00 mark is surrounded by a support zone, which kept the pair up during the end of 2021 trading.
However, a recovery of the US Dollar against the Japanese Yen would have to pass the 115.50 level's resistance. The 115.50 mark acted as resistance at the end of November. In addition, note the 200-hour simple moving average located next to 115.50. Higher above, note the weekly simple pivot point at 115.64.
Ethereum breaches 3000, Bitcoin presses 40k
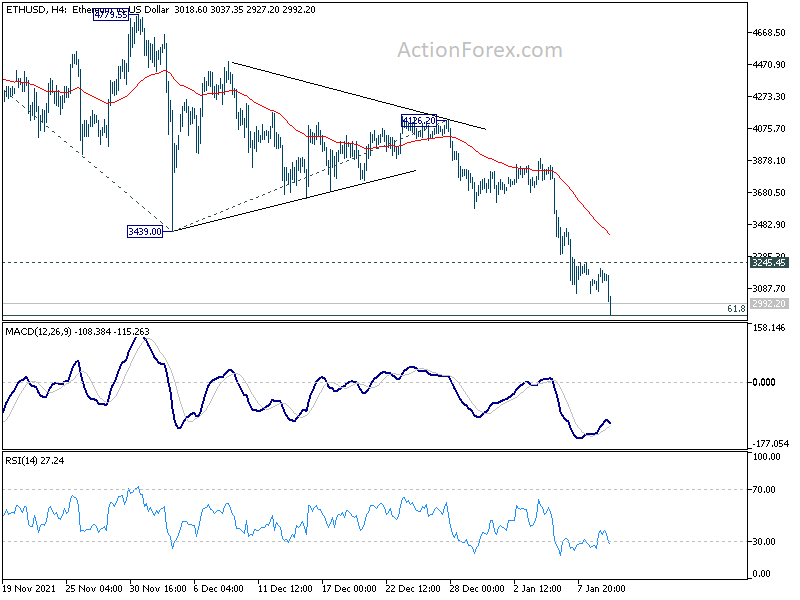
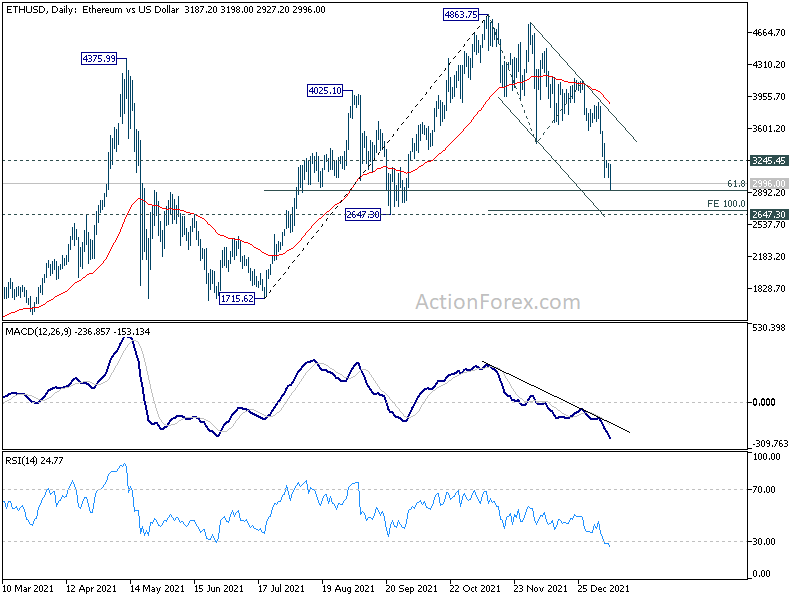
Ethereum extends recent down trend today and hit as low as 2927.20, just ahead of 61.8% retracement of 1715.62 to 4863.75 at 2918.20. Further decline is expected as long as 3245.45 resistance holds. Decline from 4863.75 is seen as in the same degree as the rise from 1715.62 to 4865.75. Deeper decline would be seen to or even further to 100% projection of 4863.75 to 3439.00 from 4126.20 at 2701.45, which is close to 2647.30 support, before forming a bottom.
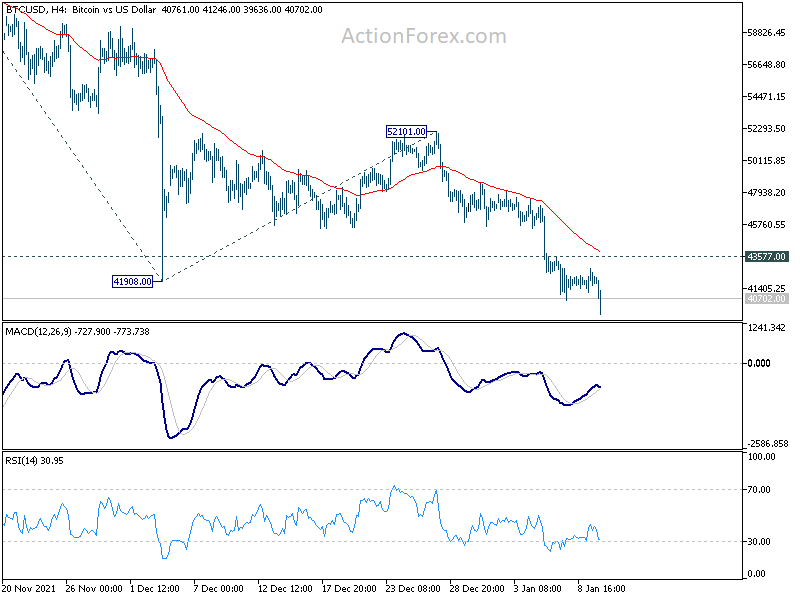
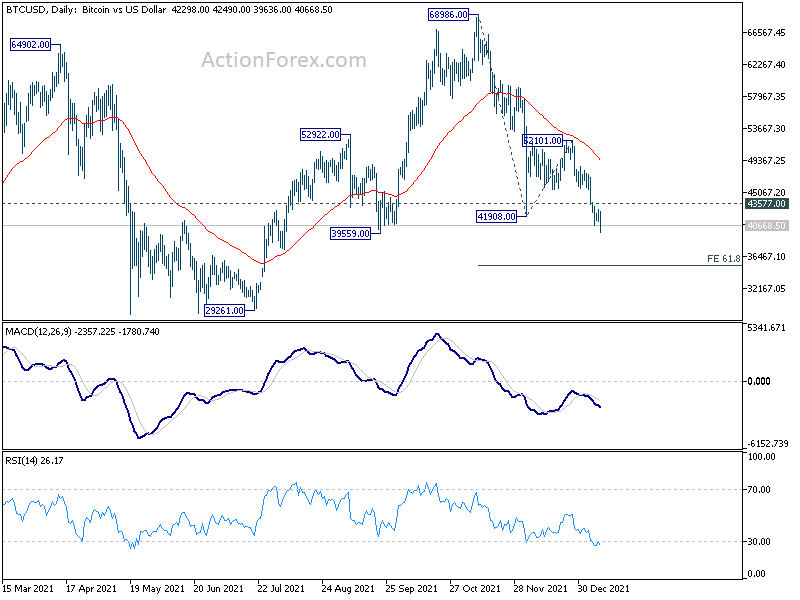
Similarly, Bitcoin is also extending recent fall and hit as low as 39636. Deeper fall is expected as long as 43577 resistance holds. Current fall from 68986 would target 61.8% projection of 68986 to 41908 from 52101 at 35366 before BTC/USD forms a bottom.
Stocks Under Pressure on Faster Stimulus Withdrawal Signals
Global bond yields hit fresh highs; stocks retreat
The Fed’s new message, which sparked fears that inflation could be tough to contain, and hence could require faster-than-expected rate hikes during the year, continued to weigh on market sentiment on Monday, elevating global bond yields to fresh highs.
A couple of Fed policymakers have already urged the need to move towards normalization ahead of Powell’s testimony before the Senate Banking committee on Tuesday, making four rate hikes an increasingly likely scenario this year. As a result, investors withdrew funds from the safe-haven bond markets, sending the 10-year Treasury yield up to 1.80%, the highest in a year.
Global stock markets came under pressure too as the massive liquidity, which has been feeding the record rally the past two years was about to vanish soon, with energy and financials being the only sectors to survive with minimal gains in the pan-European STOXX 600 index. Unlike its other European counterparts, the British FTSE 100 has barely lost ground, hovering around last week’s one-year high.
Wall Street could join the bearish mood later in the day, according to US futures. Note that the Nasdaq 100 has already slid below its 100-day simple moving average (SMA), opening the door for the 15,000 round level. The S&P 500 is also eyeing the key support area at 4,600 following the close below its shorter-term SMAs, whereas the soft decline in the Dow Jones has yet to create any caution.
The Fed has been carefully guiding investors towards monetary tightening since the end of summer. Hence, the removal of stimulus is not something new to investors’ ears. The puzzling part of the story is whether the Fed will manage to contain inflation without raising interest rates above 2.0%. Despite the drop in the unemployment rate in December, the elevated debt levels, the persisting pandemic supply jitters, and inflation pressures could leave the US economy vulnerable to a faster stimulus withdrawal. Hence, fluctuations in growth concerns could make the Fed’s mission a challenging one.
Yen best performer; European currencies, commodities in doldrums
Turning to the FX space, the Japanese yen is the best performer so far in the day, probably on the back of risk aversion, as the BoJ is not expected to abandon its accommodative stance anytime soon. Dollar/yen has erased Friday’s rally, retreating into the 115.45 – 115.25 restrictive region. The Swiss franc could not follow suit as a slight increase in the SNB’s sight deposits raised speculation that the ECB’s muted stance could motivate more intervention from the SNB. Dollar/swissie and euro/swissie are currently in a bull run, trading around three-week highs.
In other major pairs, pound/dollar turned red after touching the 1.3600 psychological mark, while euro/dollar is currently looking for support around the 1.1280 key level after giving up Friday’s pickup around the 50-day MA.
The pullback in the euro helped the dollar index to bounce back above the 96.00 mark.
In commodities, oil futures are trading slightly weaker for the second consecutive session. Gold is capped by the $1,800/once mark.
EUR/USD Mid-Day Outlook
Daily Pivots: (S1) 1.1312; (P) 1.1338; (R1) 1.1387; More...
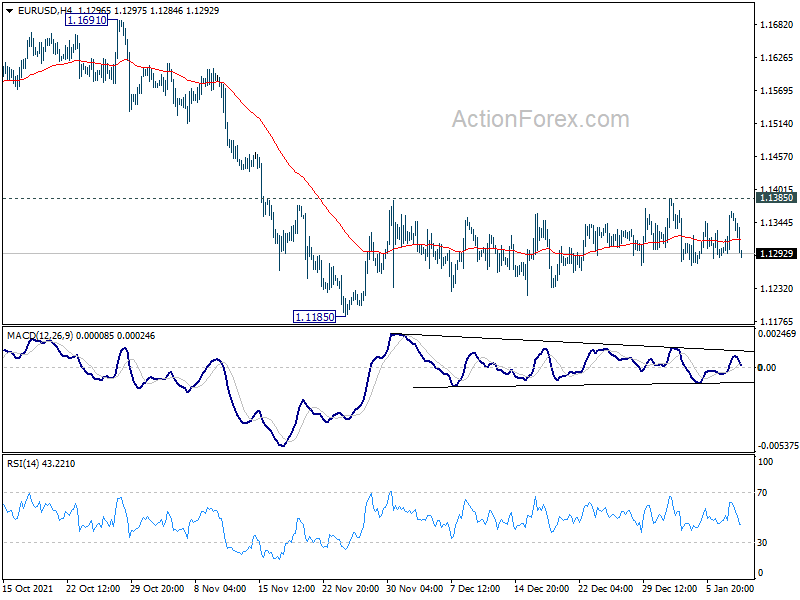
No change in EUR/USD's outlook as range trading continues. On the upside, sustained trading above 55 day EMA (now at 1.1385) will bring stronger rise back to 1.1663 support turned resistance. On the downside, break of 1.1185 will resume larger decline from 1.2348. Next target is 161.8% projection of 1.2265 to 1.1663 from 1.1908 at 1.0934.
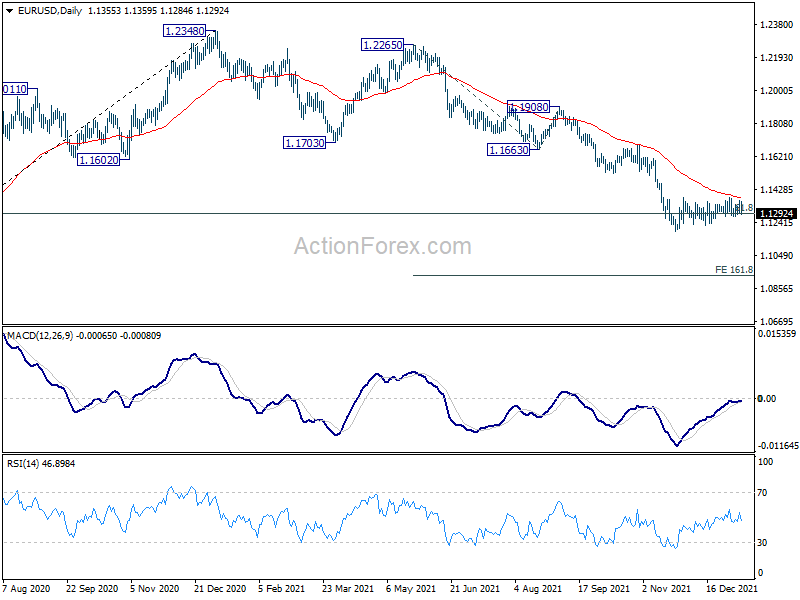
In the bigger picture, there are various ways of interpreting the fall from 1.2348 (2021 high). It could be a correction to rise from 1.0635 (2020 low), the fourth leg of a sideway pattern from 1.0339 (2017 low), or resuming long term down trend. In any case, outlook will now stay bearish as long as 1.1703 support turned resistance holds. Sustained break of 61.8% retracement of 1.0635 to 1.2348 at 1.1289 would pave the way back to 1.0635.
GBP/USD Mid-Day Outlook
Daily Pivots: (S1) 1.3546; (P) 1.3572; (R1) 1.3617; More...
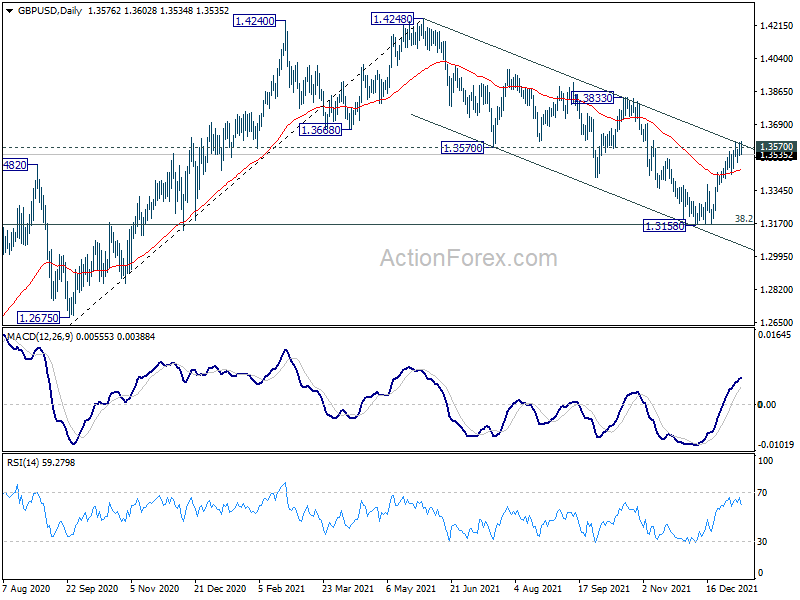
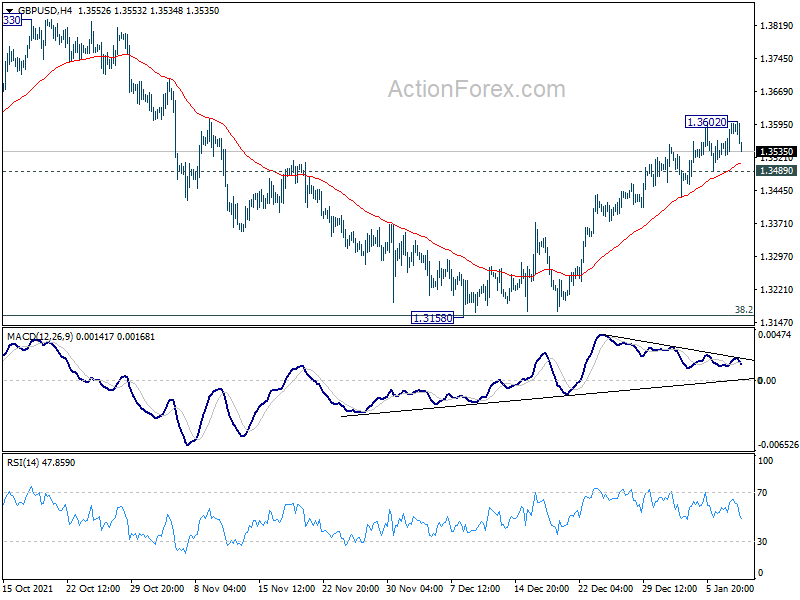
With 1.3489 minor support intact, further rise is still expected in GBP/USD despite some loss of upside momentum. Corrective fall from 1.4248 could have completed with three waves down to 1.3158, after hitting 1.3164 medium term fibonacci level. Sustained trading above 1.3570 will pave the way to 1.3833 resistance next. On the downside, though, break of 1.3489 minor support will mix up the outlook and turn intraday bias neutral first.
In the bigger picture, strong support was seen from 38.2% retracement of 1.1409 to 1.4248 at 1.3164. The development suggests that up trend from 1.1409 (2020 low) is still in progress. On resumption, next target will be 38.2% retracement of 2.1161 to 1.1409 at 1.5134. Nevertheless sustained break of 1.3164 will argue that whole rise from 1.1409 has completed and bring deeper fall to 61.8% retracement at 1.2493.