

Sample Category Title
Markets Steady as NFP Awaited, EUR/USD Still in Range
Markets are generally steady as focus turns to non-farm payroll from US today. For the week so far, Sterling and Dollar are still the strongest ones, as supported by strong rally in benchmark yields and expectation of hawkish central bank actions. Euro is mixed, pressured by the Pound but steady against Dollar. Yen's weakest place was overtaken by Aussie and Kiwi, as risk sentiment turned sour.
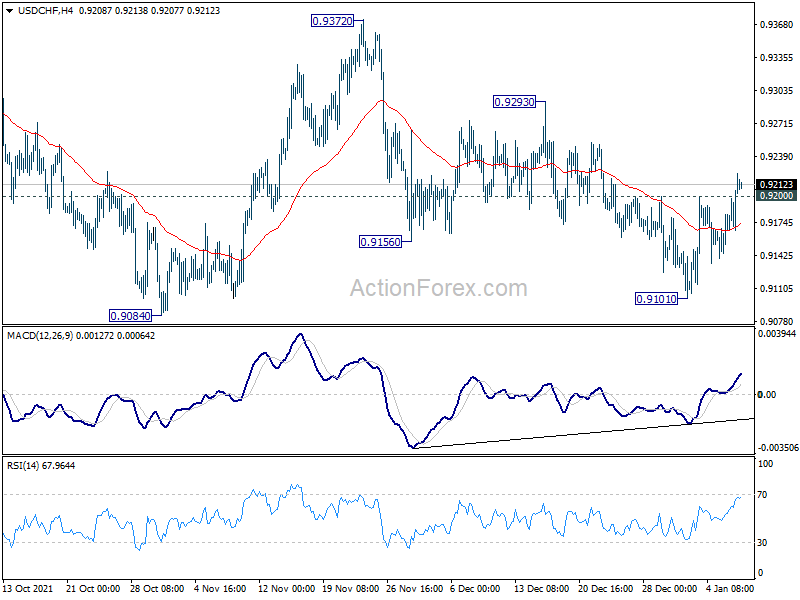
Technically, USD/CHF's break of 0.9200 resistance suggests that fall from 0.9372 has completed with three waves down to 0.9101. Stronger rally is now in favor towards 0.9293 resistance, and possibly further to 0.9372. We'll now see if EUR/USD would follow with more decline back towards 1.1185 low, and possibly a break there on Dollar strength.
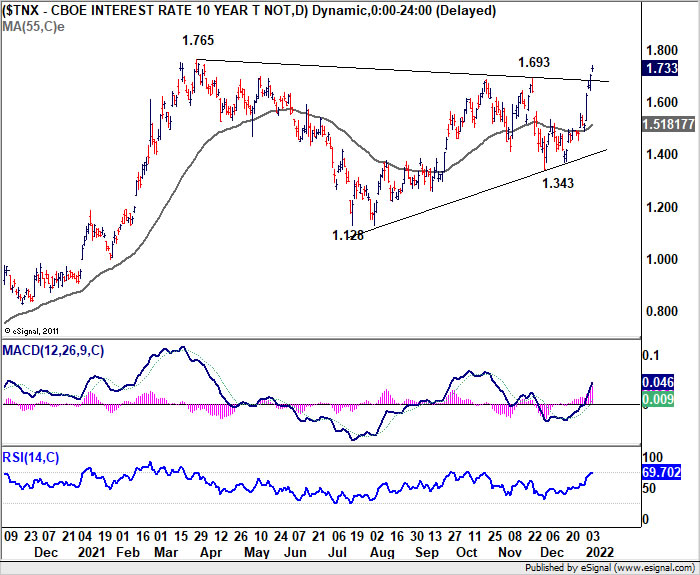
In Asia, at the time of writing, Nikkei is down -0.13%. Hong Kong HSI is up 1.15%. China Shanghai SSE is up 0.35%. Singapore Strait Times is up 0.50%. Japan 10-year JGB yield is up 0.0043 at 0.123. Overnight, DOW dropped -0.47%. S&P 500 dropped -0.10%. NASDAQ dropped -0.13%. 10-year yield rose 0.028 to 1.733.
Fed Bullard: FOMC could hike as early as in March
St. Louis Fed James Bullard said yesterday, "the FOMC could begin increasing the policy rate as early as the March meeting in order to be in a better position to control inflation. Subsequent rate increases during 2022 could be pulled forward or pushed back depending on inflation developments."
"There was a significant unanticipated inflation shock in the U.S. during 2021," he said. "With the real economy strong but inflation well above target, U.S. monetary policy has shifted to more directly combat inflation pressure."
"We could go ahead with balance sheet run off shortly after lifting off the policy rate," Bullard said, and start reducing support for the economy "sooner rather than later."
Fed Daly: We might need to, likely will need to, raise interest rates
San Francisco Fed President Mary Daly said yesterday that "I'm of the mind that we might need to, likely will need to, raise interest rates ... in order to keep the economy in balance." She clarified that "raising them a little bit is not the same as constraining the economy."
But she also urged a data driven, measured approach. "If we act too aggressively to offset the high inflation that's caused by the supply and demand imbalances, we won't actually do very much to solve the supply chain problems, but we will absolutely bridal the economy in a way that will mean less job creation down the road," she said.
10-year yield eyeing key resistance as NFP awaited
US non-farm payroll report is the major focus for today. Markets are expecting 400k job growth in December. Unemployment rate is expected to tick down from 4.2% to 4.1%. Wage growth is expected to continue to be strong, with average hourly earnings up 0.4% mom.
Looking at related data, ADP private employment grew strongly by 807k. ISM manufacturing component rose from 53.3 to 54.2. But ISM services employment dropped from 56.5 to 54.9. Four-week moving average of initial jobless claims dropped notably from 239k to 204.5. The NFP report is more likely a solid one than not.
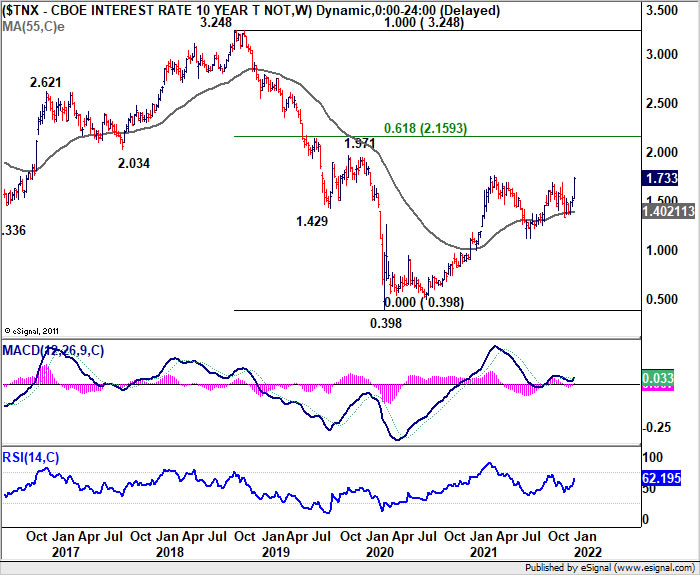
Reactions from treasury yields to the data is worth a watch. 10-year yield is now close to 1.765 key near term resistance. A set of solid job data, in particular wage growth, could push TNX through this 1.765 resistance to resume larger up trend from 0.398. In this case, we could see TNX quickly accelerate through 2.0 handle to 61.8% retracement of 3.248 to 0.398 at 2.159 down the road, even within Q1. Such development would give USD/JPY and push upwards.
On the data front
Japan Tokyo CPI core accelerated to 0.5% yoy in December, up from 0.3% yoy, above expectation of 0.4% yoy. Labor cash earnings rose 0.0% yoy in November, below expectation of 0.5% yoy. Household spending dropped -1.3% yoy, much worse than expectation of 1.6% yoy.
In European session, Swiss will release unemployment rate and retail sales. Germany will release industrial production and trade balance. France will release trade balance, consumer spending and industrial output. UK will release PMI construction. Eurozone will release CPI flash, retail sales and economic sentiment indicator.
Later in the day, US will release non-farm payroll employment. Canada will also release job data and Ivey PMI.
EUR/USD Daily Outlook
Daily Pivots: (S1) 1.1279; (P) 1.1305; (R1) 1.1326; More...
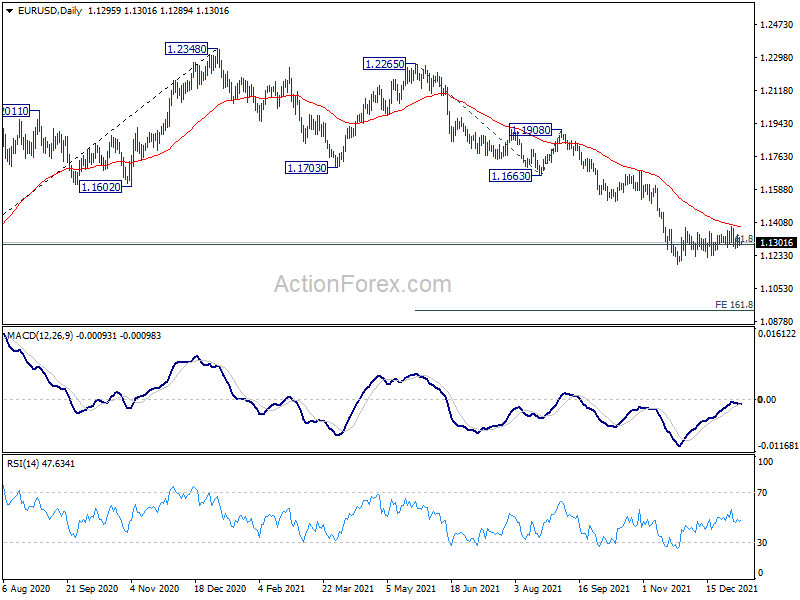
EUR/USD is still staying in sideway consolidation form 1.1185 and intraday bias remains neutral. On the downside, break of 1.1185 will resume larger decline from 1.2348. Next target is 161.8% projection of 1.2265 to 1.1663 from 1.1908 at 1.0934. On the upside, firm break of 1.1385 resistance will resume the rebound from 1.1186. Sustained trading above 55 day EMA (now at 1.1382) will bring stronger rise back to 1.1663 support turned resistance.
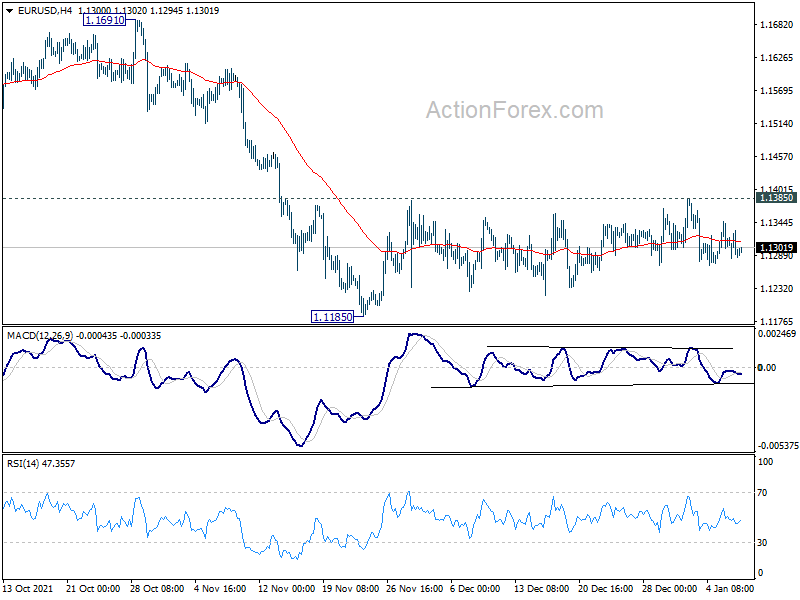
In the bigger picture, there are various ways of interpreting the fall from 1.2348 (2021 high). It could be a correction to rise from 1.0635 (2020 low), the fourth leg of a sideway pattern from 1.0339 (2017 low), or resuming long term down trend. In any case, outlook will now stay bearish as long as 1.1703 support turned resistance holds. Sustained break of 61.8% retracement of 1.0635 to 1.2348 at 1.1289 would pave the way back to 1.0635.
Economic Indicators Update
| GMT | Ccy | Events | Actual | Forecast | Previous | Revised |
|---|---|---|---|---|---|---|
| 23:30 | JPY | Tokyo CPI Core Y/Y Dec | 0.50% | 0.40% | 0.30% | |
| 23:30 | JPY | Labor Cash Earnings Y/Y Nov | 0.00% | 0.50% | 0.20% | |
| 23:30 | JPY | Household Spending Y/Y Nov | -1.30% | 1.60% | -0.60% | |
| 06:45 | CHF | Unemployment Rate Dec | 2.50% | 2.50% | ||
| 07:00 | EUR | Germany Industrial Production M/M Nov | 1.00% | 2.80% | ||
| 07:00 | EUR | Germany Trade Balance (EUR) Nov | 12.7B | 12.5B | ||
| 07:30 | CHF | Real Retail Sales Y/Y Nov | 0.80% | 1.20% | ||
| 07:45 | EUR | France Trade Balance (EUR) Nov | -7.2B | -7.5B | ||
| 07:45 | EUR | France Consumer Spending M/M Nov | 0.50% | -0.40% | ||
| 07:45 | EUR | France Industrial Output M/M Nov | 0.90% | |||
| 09:30 | GBP | Construction PMI Dec | 53.9 | 55.5 | ||
| 10:00 | EUR | Eurozone CPI Y/Y Dec P | 4.70% | 4.90% | ||
| 10:00 | EUR | Eurozone CPI Core Y/Y Dec P | 2.30% | 2.60% | ||
| 10:00 | EUR | Eurozone Economic Sentiment Indicator Dec | 116 | 117.5 | ||
| 10:00 | EUR | Eurozone Services Sentiment Dec | 16.1 | 18.4 | ||
| 10:00 | EUR | Eurozone Industrial Confidence Dec | 14 | 14.1 | ||
| 10:00 | EUR | Eurozone Consumer Confidence Dec F | -8.3 | -8.3 | ||
| 10:00 | EUR | Eurozone Retail Sales M/M Nov | -0.50% | 0.20% | ||
| 13:30 | USD | Nonfarm Payrolls Dec | 400K | 210K | ||
| 13:30 | USD | Unemployment Rate Dec | 4.10% | 4.20% | ||
| 13:30 | USD | Average Hourly Earnings M/M Dec | 0.40% | 0.30% | ||
| 13:30 | CAD | Net Change in Employment Dec | 24.5K | 153.7K | ||
| 13:30 | CAD | Unemployment Rate Dec | 6.00% | 6.00% | ||
| 15:00 | CAD | Ivey Purchasing Managers Index Dec | 64.3 | 61.2 |
10-year yield eyeing key resistance as NFP awaited
US non-farm payroll report is the major focus for today. Markets are expecting 400k job growth in December. Unemployment rate is expected to tick down from 4.2% to 4.1%. Wage growth is expected to continue to be strong, with average hourly earnings up 0.4% mom.
Looking at related data, ADP private employment grew strongly by 807k. ISM manufacturing component rose from 53.3 to 54.2. But ISM services employment dropped from 56.5 to 54.9. Four-week moving average of initial jobless claims dropped notably from 239k to 204.5. The NFP report is more likely a solid one than not.
Reactions from treasury yields to the data is worth a watch. 10-year yield is now close to 1.765 key near term resistance. A set of solid job data, in particular wage growth, could push TNX through this 1.765 resistance to resume larger up trend from 0.398. In this case, we could see TNX quickly accelerate through 2.0 handle to 61.8% retracement of 3.248 to 0.398 at 2.159 down the road, even within Q1. Such development would give USD/JPY and push upwards.
Fed Bullard: FOMC could hike as early as in March
St. Louis Fed James Bullard said yesterday, "the FOMC could begin increasing the policy rate as early as the March meeting in order to be in a better position to control inflation. Subsequent rate increases during 2022 could be pulled forward or pushed back depending on inflation developments."
"There was a significant unanticipated inflation shock in the U.S. during 2021," he said. "With the real economy strong but inflation well above target, U.S. monetary policy has shifted to more directly combat inflation pressure."
"We could go ahead with balance sheet run off shortly after lifting off the policy rate," Bullard said, and start reducing support for the economy "sooner rather than later."
Fed Daly: We might need to, likely will need to, raise interest rates
San Francisco Fed President Mary Daly said yesterday that "I'm of the mind that we might need to, likely will need to, raise interest rates ... in order to keep the economy in balance." She clarified that "raising them a little bit is not the same as constraining the economy."
But she also urged a data driven, measured approach. "If we act too aggressively to offset the high inflation that's caused by the supply and demand imbalances, we won't actually do very much to solve the supply chain problems, but we will absolutely bridal the economy in a way that will mean less job creation down the road," she said.
Elliott Wave View: NZDUSD Looking to Extend Lower
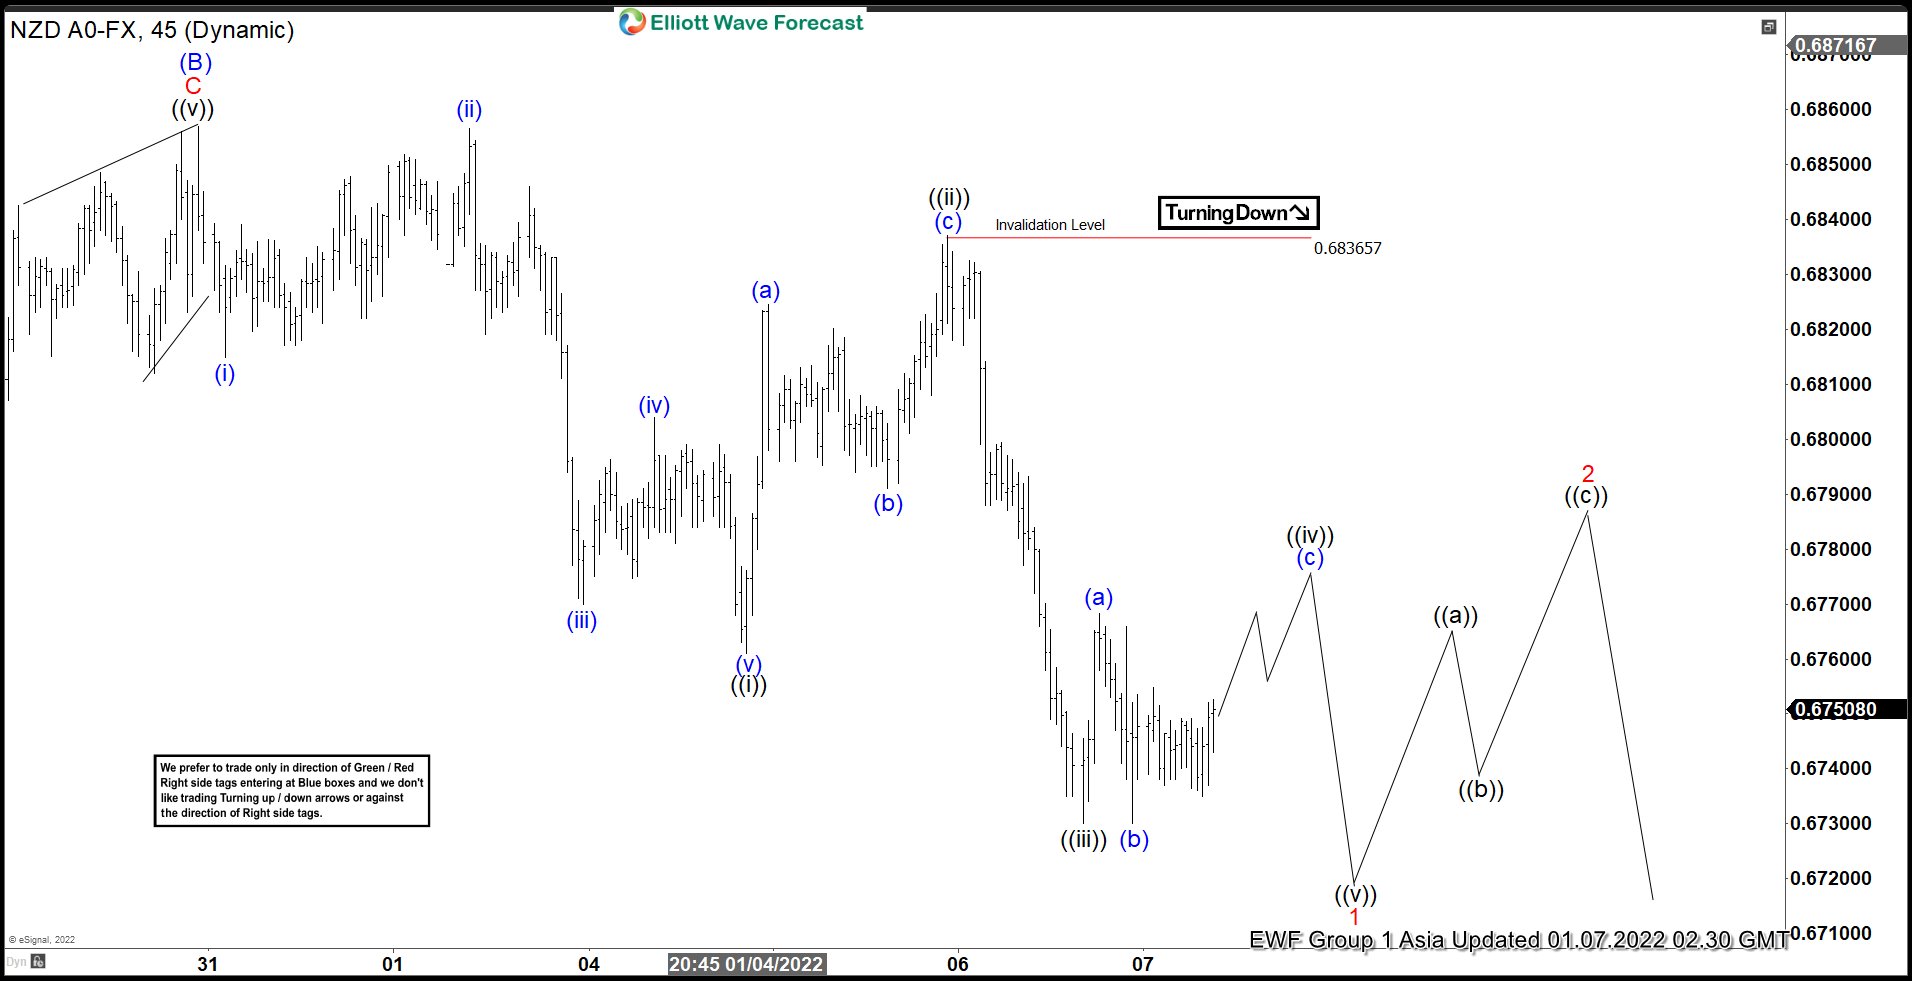
Short Term Elliott Wave View in NZDUSD suggests the decline from October 21, 2021 peak is unfolding as a zigzag Elliott Wave structure. Down from October 21 high, wave (A) ended at 0.67018 and wave (B) rally is proposed complete at 0.6857 as the 45 minutes chart below shows. Pair should still break below wave (A) at 0.67018 to rule out a double correction in wave (B). Wave (C) lower is currently in progress with internal subdivision as a 5 waves impulse.
Down from wave (B), wave ((i)) ended at 0.6761 and rally in wave ((ii)) ended at 0.6836. Pair then resumed lower in wave ((iii)) towards 0.6730. Wave ((iv)) is in progress and as far as rally fails below 0.6836, expect pair to turn lower in wave ((v)) to complete wave 1. Afterwards, pair should rally in wave 2 to correct cycle from December 30, 2021 peak before the decline resumes in wave 3. Potential target lower is 100% – 161.8% Fibonacci extension from October 21, 2021 high which comes at 0.615 – 0.655. Near term, while pivot at 0.6836 high, and more importantly at 0.6857 high stays intact, expect rally to fail in the sequence of 3, 7, 11 swing for more downside.
NZDUSD 45 Minutes Elliott Wave Chart
Technical Outlook and Review
DXY:
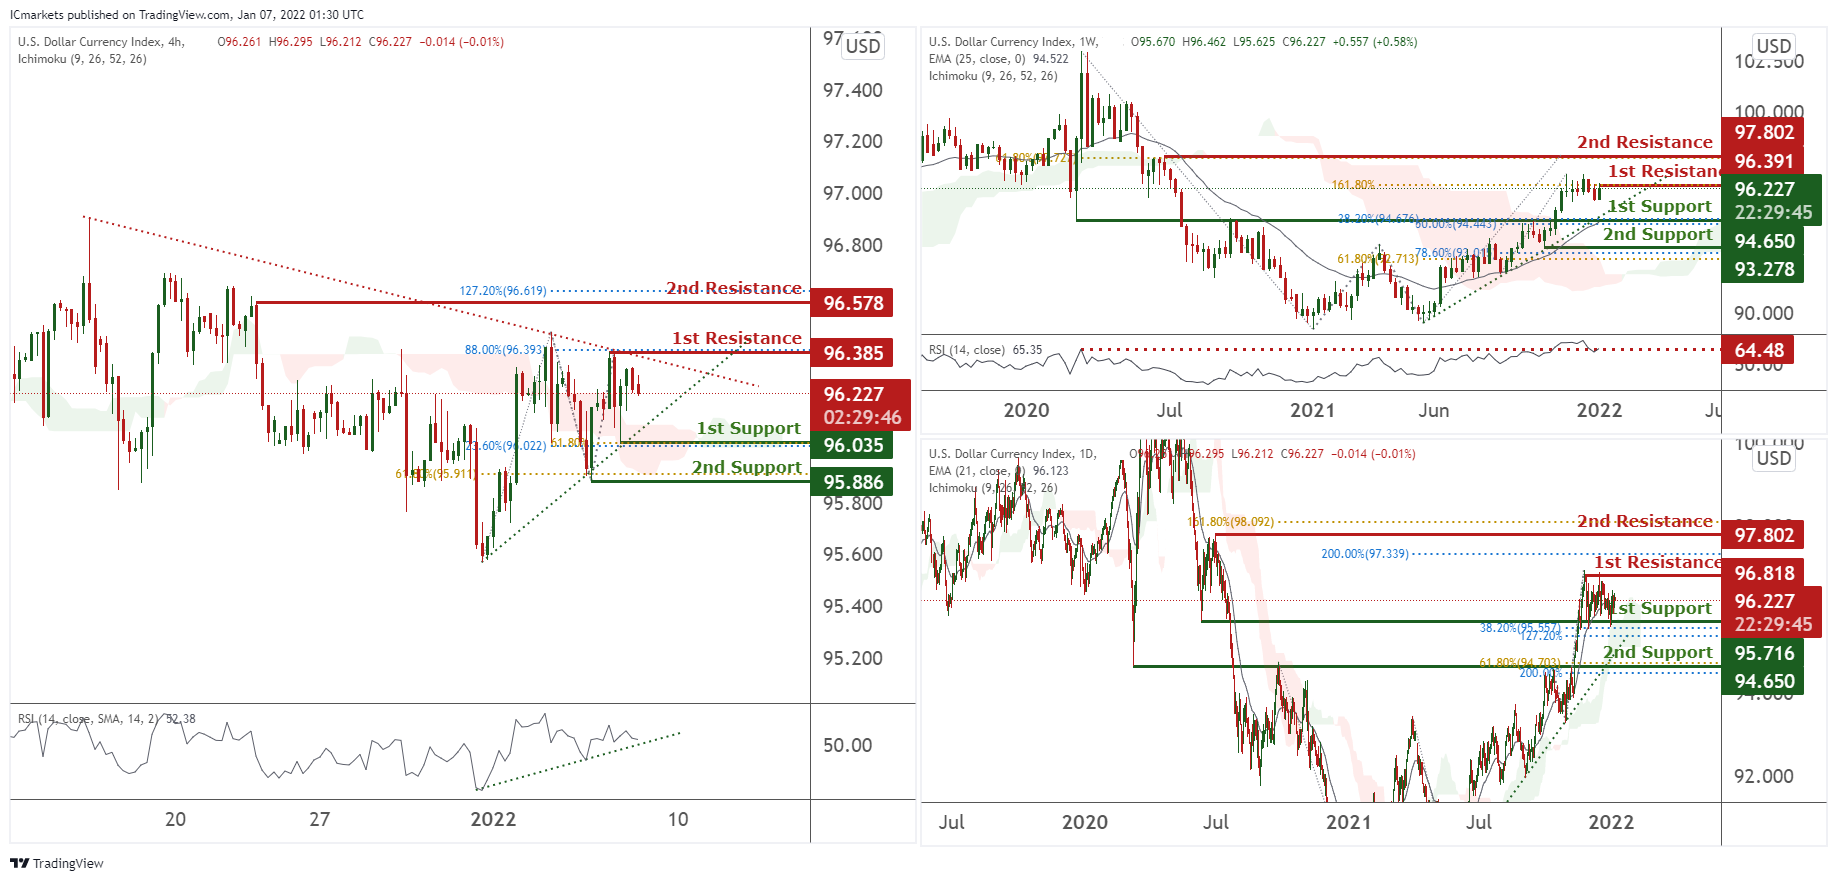
On the weekly, prices are on bullish momentum and abiding to our ascending trendline. We see potential for prices to dip from our 1st resistance at 96.391 in line with 161.8% Fibonacci extension and 161.8% Fibonacci retracement towards our 1st support at 94.650 in line with 38.6% Fibonacci retracement and 50 5 Fibonacci retracement. RSI is at oversold levels.
On the daily, prices are on a bullish momentum and abiding to a bullish trendline. We see potential for prices to bounce from our 1st support at 95.716 in line with 38.2% Fibonacci retracement and 127.2% Fibonacci extension towards our 1st resistance at 96.818 in line with 200% Fibonacci projection. Our EMA 21 and ichimoku clouds are showing bullish momentum.
On the H4 timeframe, prices are consolidating in a triangle pattern. We would expect a bounce from our 1st support at 96.035 in line with 61.8% Fibonacci extension and 23.6% Fibonacci retracement towards our 1st resistance at 96.385 in line with 88% Fibonacci extension. RSI are depicting bullish momentum and also ichimoku clouds are showing bullish momentum.
Areas of consideration:
- H4 time frame, 1st resistance at 96.385
- H4 time frame, 1st support at 96.035
XAU/USD (GOLD):
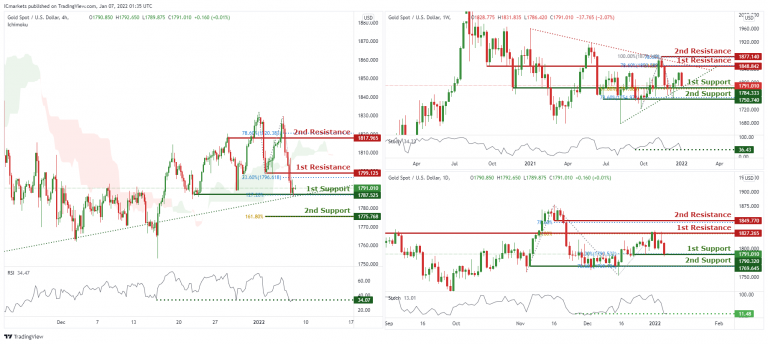
On the weekly, prices have broken out of our triangle and are testing our 1st support at 1784.333 in line with 61.8% Fibonacci extension towards our 1st resistance at 1848.842 which is an area of Fibonacci confluences. RSI are at levels where bounces previously occurred. Alternatively our stop loss will be placed at our 2nd support at 1750.740.
On the daily, prices have approached our pivot. We see potential for a bounce from our 1st support at 1791.010 in line with 50% Fibonacci retracement and 78.6% Fibonacci retracement towards our 1st resistance at 1827.265 in line with 61.8% Fibonacci retracement. Our bias is further supported by Stochastics at levels where bounces previously occurred.
On the H4 chart, prices are abiding to our daily bullish trendline. We see potential for prices to climb from our 1st support at 1787.525 in line with 127.2% Fibonacci extension towards our 1st resistance at 1799.125 in line with 23.6% Fibonacci retracement. RSI is at a level where bounces previously occurred. Alternatively, breaking our 1st support will find prices climbing further towards our 2nd support at 1775.768 in line with 161.8% Fibonacci projection.
Areas of consideration:
- H4 1st support at 1787.525
- H4 1st resistance at 1799.125
GBP/USD
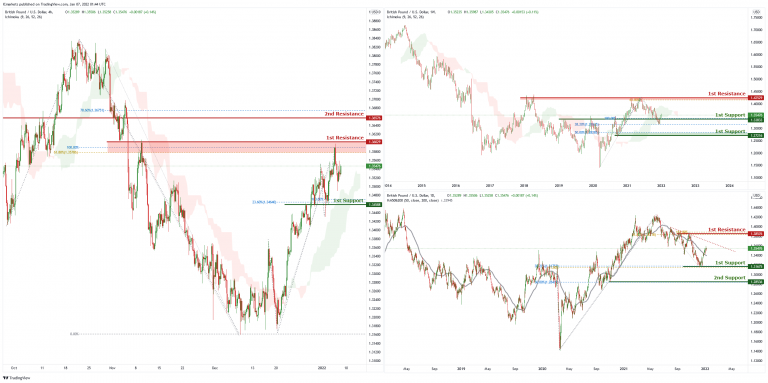
On the weekly chart price is 1st support of 1.33833 which is also 100% Fibonacci projection and 38.2% Fibonacci retracement. Price can potentially go to the 1st resistance level of 1.42529 which is also 61.8% Fibonacci projection and graphical swing high level . Our bullish bias is supported by the ichimoku cloud indicator.
On the daily chart, price is abiding by a descending trendline and has recently reacted off the 1st support level of 1.31675 which is 38.2% Fibonacci retracement and 61.8% Fibonacci projection. Price can potentially go to the 1st resistance level of 1.38576 which is also 61.8% Fibonacci retracement and 61.8% Fibonacci projection. Our bullish bias is supported by the moving average as price is trading above it.
On the H4 chart, price is currently heading towards the first resistance level of 1.36029 which is also 100% Fibonacci projection and 61.8% Fibonacci retracement. Price can potentially dip to the 1st support level of 1.34588 which is also 23.6% Fibonacci retracement and 100% Fibonacci projection. Our bearish bias is supported by the stochastic indicator as it is near resistance level.
Areas of consideration:
- H4 1st resistance at 1.36029
- H4 1st support 1.34588
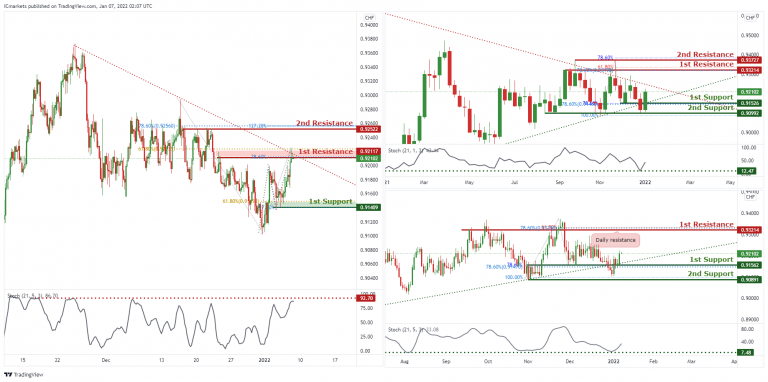
USD/CHF:
On the Weekly timeframe, price is reacting in a triangle pattern. Traders should wait for the price to swing higher or lower before entering. On the Daily timeframe, we can expect an overall bullish momentum. Price could bounce from 1st Support in line with 78.6% Fibonacci retracement and 78.6% FIbonacci projection towards 1st Resistance in line with 78.6% Fibonacci retracement and 61.8% Fibonacci projection. Our bullish bias is further supported by the stochastics indicator where the %D line is at the support level.
In reference to yesterday’s analysis, prices are on bearish momentum and abiding to our descending trendline. We can expect price to drop from 1st Resistance in line with 78.6% Fibonacci projection and 61.8% Fibonacci retracement towards 1st Support in line with 61.8% Fibonacci retracement and 127.2% Fibonacci projection. Our bearish bias is further supported by the stochastic indicator where the %K line is at the resistance level.
Areas of consideration:
- Watch 1st Support at 0.91409
- Watch 1st Resistance at 0.92117
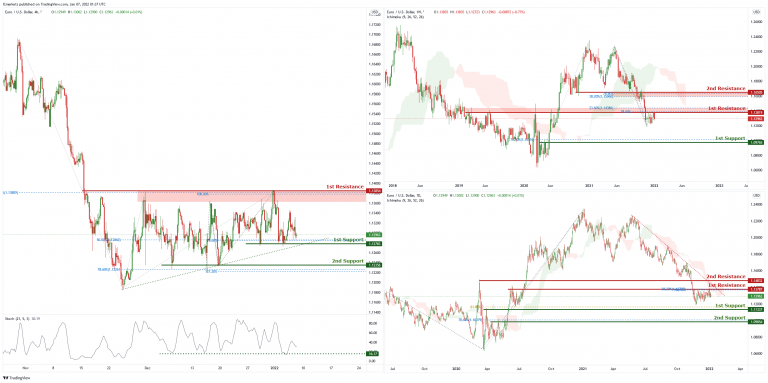
EUR/USD :
On the weekly chart price is near the 1st resistance level of 1.13819 which is also 23.6% Fibonacci retracement and 78.6% Fibonacci projection. Price can potentially dip to the 1st support level of 1.09765 which is 78.6% Fibonacci projection. Our bearish bias is supported by the ichimoku cloud indicator as price is trading below it.
On the daily chart price is abiding by a descending trendline and near 1st resistance level of 1.13787 which is also 38.2% Fibonacci retracement and 100% Fibonacci projection. Price can potentially dip to the 1st support level of 1.11337 which is 61.8% Fibonacci projection. Our bearish bias is supported by the ichimoku cloud indicator as price is trading below it.
On the H4 chart, price is abiding by an ascending trendline and is near 1st support level of 1.12783 which is also 50% Fibonacci retracement and 78.6% Fibonacci projection. Price can potentially go to the 1st resistance of 1.13854 which is also 100% Fibonacci projection and 38.2% Fibonacci retracement. Our bullish bias is supported by the stochastic indicator as it is near the support level.
Areas of consideration :
- H4 1st support at 1.12783
- H4 1st resistance at 1.13854
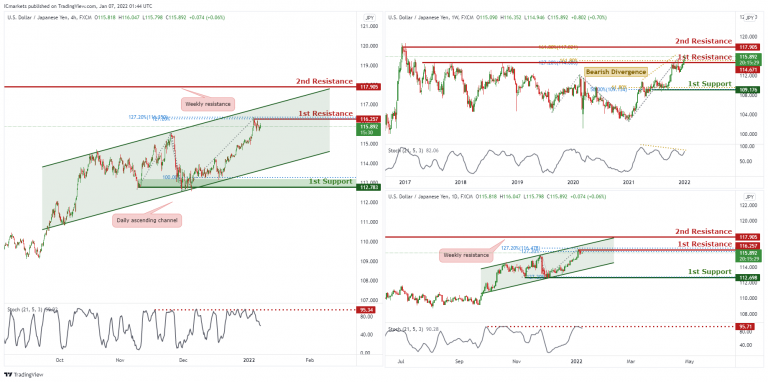
USD/JPY
On the Weekly timeframe, we can see that price touched the 1st resistance in line with horizontal swing highs and 127.2% FIbonacci Retracement and 161.8% Fibonacci Projection. We can expect the price to drop from the 1st Resistance towards the 1st Support in line with 61.8% Fibonacci projection and 50% Fibonacci retracement. Our short-term bearish momentum is further supported by the stochastic %K line holding below the descending trendline resistance and bearish divergence spotted. On the Daily timeframe, we can expect price to drop from 1st Resistance in line with 127.2% Fibonacci projection, 127.2% Fibonacci extension and previous swing high towards 1st Support in line with 127.2% Fibonacci projection and graphical overlap support. Our bearish bias is further supported by the stochastic indicator where the%K line is at the resistance level.
On the H4 timeframe, is abiding to the ascending channel on the daily, signifying an overall bullish momentum. However, we can expect price to make a short-term bearish drop from 1st Resistance in line with 127.2% Fibonacci projection and 127.2% Fibonacci extension towards 1st Support in line with 100% Fibonacci projection. Our short-term bearish bias is further supported by the stochastic indicator where the %K line dropped at resistance level.
Areas of consideration:
- H4 1st resistance level 116.257
- H4 1st support level 112.783
AUD/USD:
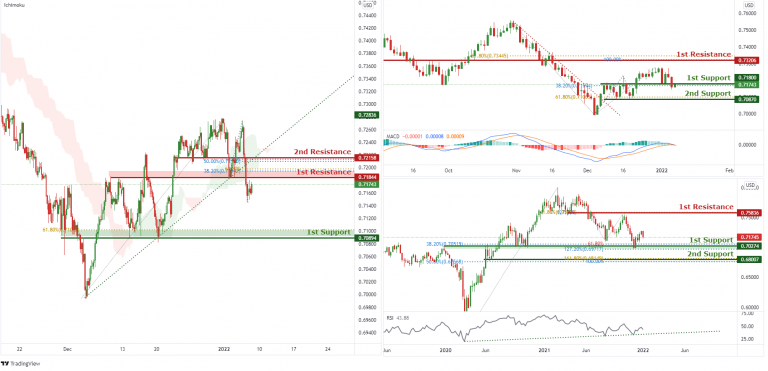
In reference to last week’s analysis, price has bounced nicely on the 1st Support. On the weekly, we can now expect the price to continue to push higher from the 1st Support in line with 61.8% Fibonacci projection, 38.2 % FIbonacci retracement and 127.2% Fibonacci extensions. Our bullish bias is further supported by the RSI indicator abiding to an ascending trendline. Traders should wait for price to swing higher or lower before entering again.
In reference to last week’s analysis price indeed bounced nicely on the 1st Support on the daily timeframe. On the Daily, the price is at the 1st support, we can expect the price to continue to push higher from 1st Support in line with 38.2% Fibonacci retracement towards 1st Resistance in line with 100% Fibonacci projection and 61.8% Fibonacci retracement. Our bullish bias is further supported by the MACD indicator where the MACD line is above the signal line.
On the H4, orice broke out of the ascending trendline support, signifying a bearish momentum. We can expect price to drop from 1st Resistance in line with 38.2% Fibonacci retracement and 61.8% Fibonacci projection towards 1st Support in line with 61.8% Fibonacci retracement. Our bearish bias is further supported by the price holding below the Ichimoku cloud.
Areas of consideration:
- H4 1st Support level 0.70894
- H4 1st resistance level 0.71844
NZD/USD:
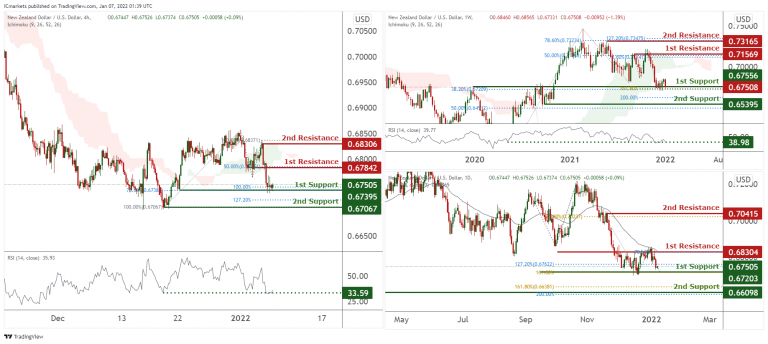
On the weekly, prices are on a bullish momentum. We see potential for a bounce at 1st support at 0.67556 in line with 38.2% Fibonacci retracement and 161.8% Fibonacci Projection towards 1st resistance in line with 50% Fibonacci retracement 78.6% Fibonacci extension. RSI is at levels where bounces happened previously. Alternatively, if prices break our 1st support, we might find it dipping towards our 2nd support at 0.65395 in line with 50% Fibonacci retracement and 200% Fibonacci projection.
On the daily, prices are on bearish momentum. We see potential for prices to dip from our 1st resistance at 0.68166 in line with 23.6% Fibonacci retracement towards our 1st support at 0.67203 in line with 127.2% Fibonacci retracement and 161.8% Fibonacci extension. Ichimoku clouds are forecasting the dips.
On the H4 timeframe, prices are at a Pivot and are experiencing a squeeze. We see potential for prices to bounce from our 1st support at 0.67505 in line with 100% Fibonacci extension and 78.6% Fibonacci retracement towards our 1st resistance at 0.67842 in line with 50% Fibonacci retracements. Our bias is further supported by RSI at a level where dips usually occur. If prices break our 1st support, prices can potentially dip towards our 2nd support at 0.67067 in line with 127.2% Fibonacci extensions and 100% Fibonacci retracement.
Areas of consideration:
- H4 time frame, 1st resistance at 0.67842
- H4 time frame, 1st support at 0.67395
USD/CAD:
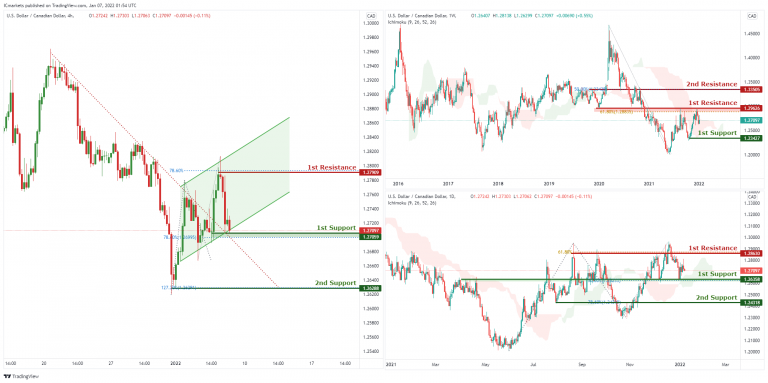
On the weekly, with price at the resistance of the ichimoku cloud, we have a bearish bias that price will drop from our 1st resistance at 1.29626 which is in line with horizontal horizontal resistance and 61.8% Fibonacci retracement to 1st support at 1.23427, which is in line with horizontal swing low support. Alternatively, price may break 1st resistance structure and head for 2nd resistance at 1.33505, which coincides with horizontal swing overlap resistance and the 50% Fibonacci retracement.
On the daily, with price moving above ichimoku cloud, we have a bullish bias that price will rise to our 1st resistance at 1.28630 which is in line with horizontal swing high resistance and 61.8% Fibonacci extension from 1st support at 1.26358, which is in line with horizontal overlap support and 50% Fibonacci retracement level. Alternatively, price may break 1st support structure and head for 2nd support at 1.24318, which coincides with horizontal overlap support and the 78.6% Fibonacci extension.
On the H4, with price moving within the ascending channel, we have a bullish bias that price will rise to our 1st resistance at 1.27909 which is in line with horizontal swing high resistance and 78.6% Fibonacci extension from 1st support at 1.27059, which is in line with horizontal swing low support and 78.6% Fibonacci retracement level. Alternatively, price may break 1st support structure and head for 2nd support at 1.26288, which coincides with horizontal swing low support and the 127.2% Fibonacci extension.
Areas of consideration:
- H4 time frame, 1st support at 1.27059
- H4 time frame, 1st resistance at 1.26288
OIL:
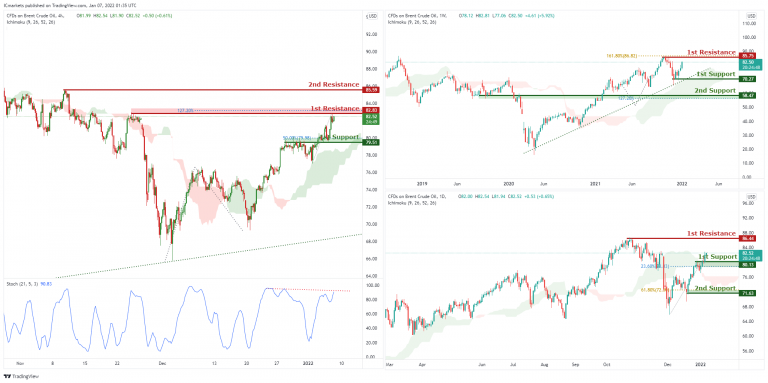
On the weekly, with price moving above the ichimoku cloud, we have a bullish bias that price will rise to our 1st resistance at 85.75 which is in line with horizontal swing high resistance and 161.8% Fibonacci extension from 1st support at 70.27, which is in line with horizontal swing low support. Alternatively, price may break 1st support structure and head for 2nd support at 58.47, which coincides with horizontal overlap support and 127.2% Fibonacci extension level .
On the daily, with price moving above the ichimoku cloud, we have a bullish bias that price will rise to our 1st resistance at 86.44 which is in line with horizontal swing high resistance from 1st support at 80.13, which is in line with horizontal overlap support and 23.6% Fibonacci retracement level. Alternatively, price may break 1st support structure and head for 2nd support at 71.63, which coincides with horizontal overlap support and 61.8% Fibonacci retracement level .
On the H4, with price at the resistance of stochastics, we have a bearish bias that price will drop from our 1st resistance at 82.83 which is in line with horizontal swing high resistance and 127.2% Fibonacci extension to 1st support at 79.51, which is in line with horizontal swing overlap support and 50% fibonacci retracement. This is also where the support of the ichimoku cloud is. Alternatively, price may break 1st resistance structure and head for 2nd resistance at 85.59, which coincides with horizontal swing high resistance.
Areas of consideration:
- H4 time frame, 1st resistance of 82.83
- H4 time frame, 1st support of 79.51
Dow Jones Industrial Average:
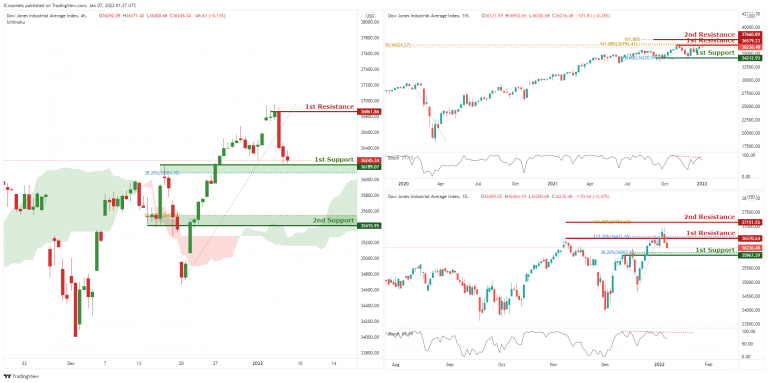
On the weekly, with price rejecting the resistance of stochastics, we have a bearish bias that price will drop from our 1st resistance at 36579 which is in line with horizontal swing high resistance and 161.8% Fibonacci extension to 1st support at 34212, which is in line with horizontal swing overlap support and 78.6% fibonacci retracement. This is also where the support of the ichimoku cloud is. Alternatively, price may break 1st resistance structure and head for 2nd resistance at 37660, which coincides with horizontal swing high resistance and 161.8% Fibonacci extension.
On the daily, with price rejecting the resistance of stochastics, we have a bearish bias that price will drop from our 1st resistance at 36570 which is in line with horizontal swing high resistance and 127.2% Fibonacci extension to 1st support at 35967, which is in line with horizontal swing overlap support and 38.2% fibonacci retracement. This is also where the support of the ichimoku cloud is. Alternatively, price may break 1st resistance structure and head for 2nd resistance at 37151, which coincides with horizontal swing high resistance and 161.8% Fibonacci extension.
On the H4, with price moving above the ichimoku cloud, we have a bullish bias that price will rise to our 1st resistance at 36861 which is in line with horizontal swing high resistance from 1st support at 36189, which is in line with horizontal overlap support and 32.8% Fibonacci retracement level. Alternatively, price may break 1st support structure and head for 2nd support at 35415, which coincides with horizontal overlap support and 61.8% Fibonacci retracement level .
Area of consideration:
- 4H resistance at 36861
- 4H support at 36189
USD/JPY Rally Faces Hurdle, US NFP Next
Key Highlights
- USD/JPY started a fresh increase towards the 116.50 level.
- A major bullish trend line is forming with support near 115.60 on the 4-hours chart.
- EUR/USD is consolidating below the main 1.1380 resistance zone.
- The US nonfarm payrolls could increase 400K in Dec 2021, up from 210K.
USD/JPY Technical Analysis
The US Dollar started a major increase above the 114.50 resistance against the Japanese Yen. USD/JPY even broke the 115.00 level to move into a positive zone.
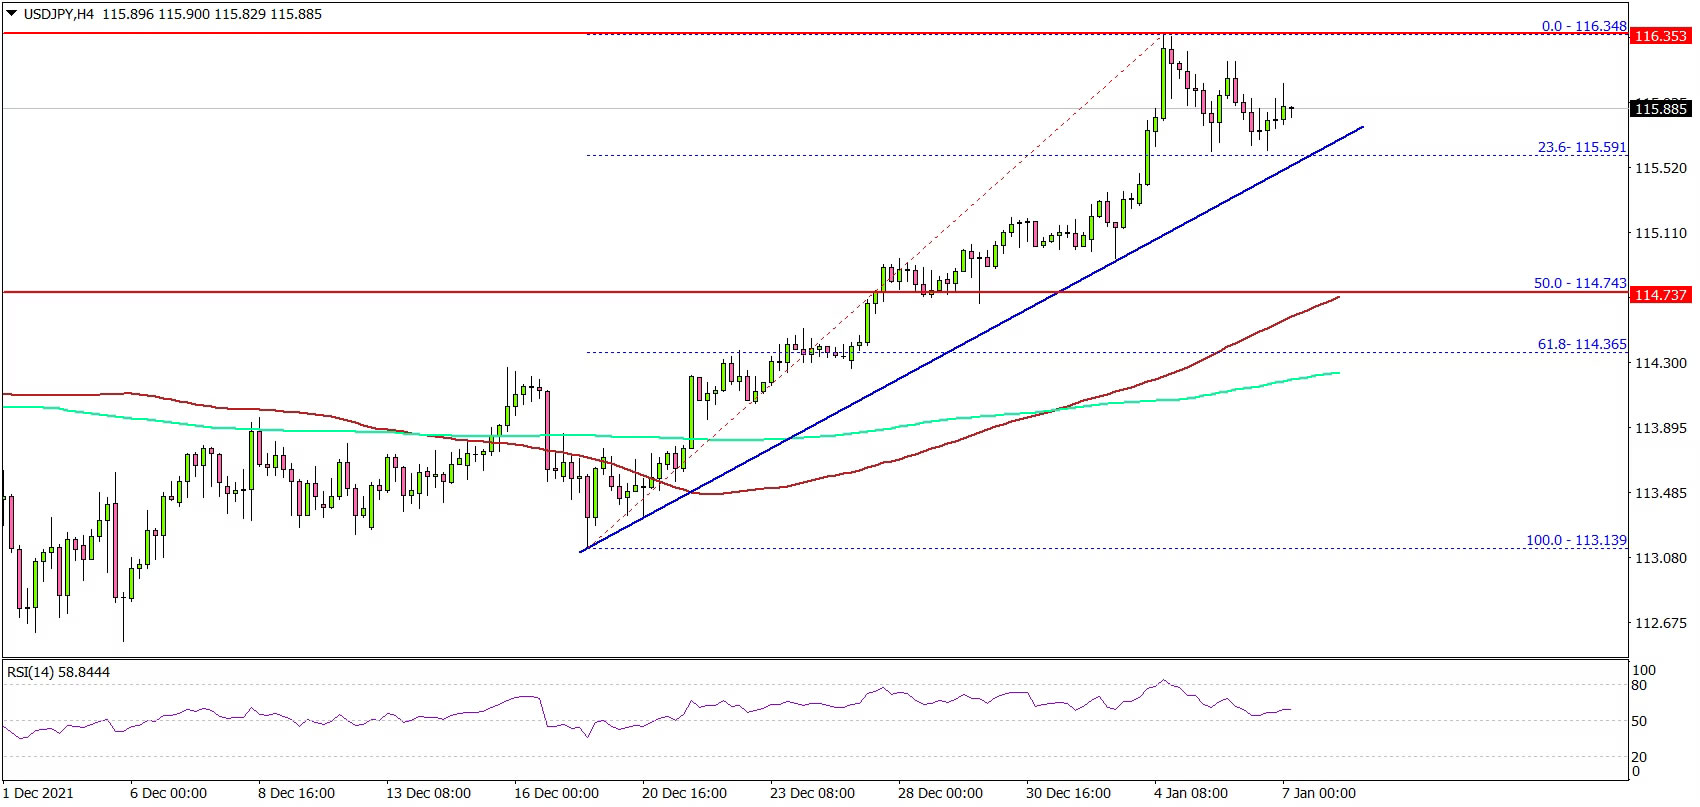
Looking at the 4-hours chart, the pair settled above the 115.00 level, the 100 simple moving average (red, 4-hours) and the 200 simple moving average (green, 4-hours).
The pair even climbed above the 115.50 and 116.00 levels. It traded as high as 116.34 before it started a downside correction. It tested the 23.6% Fib retracement level of the upward move from the 113.13 swing low to 116.34 high.
There is also a major bullish trend line forming with support near 115.60 on the same chart. The next major support is near the 114.75 level.
The 50% Fib retracement level of the upward move from the 113.13 swing low to 116.34 high is near the 114.75 level. Any more losses might send the pair towards the 114.00 level.
On the upside, the pair is facing resistance near 116.40 and 116.50. The next major resistance is near the 1.3620 level. A close above 1.3620 could open the doors for a steady increase.
On the downside, an immediate support is near the 1.3480 level. There is also a key rising channel forming with support near 1.3475 on the same chart.
Looking at EUR/USD, the pair is still consolidating below the 1.1380 resistance zone. Besides, GBP/USD remained well bid near the 1.3500 level.
Economic Releases
- Euro Zone CPI for Dec 2021 (YoY) (Prelim) - Forecast +4.7%, versus +4.9% previous.
- Euro Zone Core CPI for Dec 2021 (YoY) (Prelim) - Forecast +2.5%, versus +2.6% previous.
- US nonfarm payrolls for Dec 2021 – Forecast 400K, versus 210K previous.
- US Unemployment Rate for Dec 2021 - Forecast 4.1%, versus 4.2% previous.
- Canada’s employment Change payrolls for Dec 2021 – Forecast 27.5K, versus 153.7K previous.
- Canada’s Unemployment Rate for Dec 2021 - Forecast 6.0%, versus 6.0% previous.
Gold and Bitcoin Drop to Key Levels on Hawkish Fed
This has been one hell of a start to a new year if you are into volatility. For investors in expensive US technology and small cap stocks, as well as Bitcoin and gold, it has probably not been a happy new year at all.
In a bid to keep the U.S. economy from overheating amid high inflation and near-full employment, the FOMC indicated in their December policy sitting that the outlook “could warrant a potentially faster pace of policy rate normalization,” according to the minutes of that meeting.
So, paradoxically, it is high levels of inflation that has derailed the rally for both gold and Bitcoin. What investors in these assets need to see is a sharp drop in inflation to deter the Fed from tightening too fast. If that doesn’t happen then we may well see further struggles in both assets down the line.
Gold just can’t catch a break. After struggling throughout last year to attract fresh buyers, the start of this year has been equally poor. With the Fed potentially on course to tighten its policy more aggressively, causing renewed strength in bond yields, gold bulls are finding it difficult to justify buying aggressively right now.
The metal was unable to break above that $1830 key resistance level yet again as the sellers stepped in after the FOMC’s hawkish December meeting minutes were released last night. The selling has since gathered pace, causing the metal to dip to low $1790s, before bouncing back a little.
What bullish gold traders need to see is a clean break above $1830 to tip the balance back in their favour. Until that happens, proceed with a bit of caution even if gold is testing a key short-term support here around $1793 to $1800:
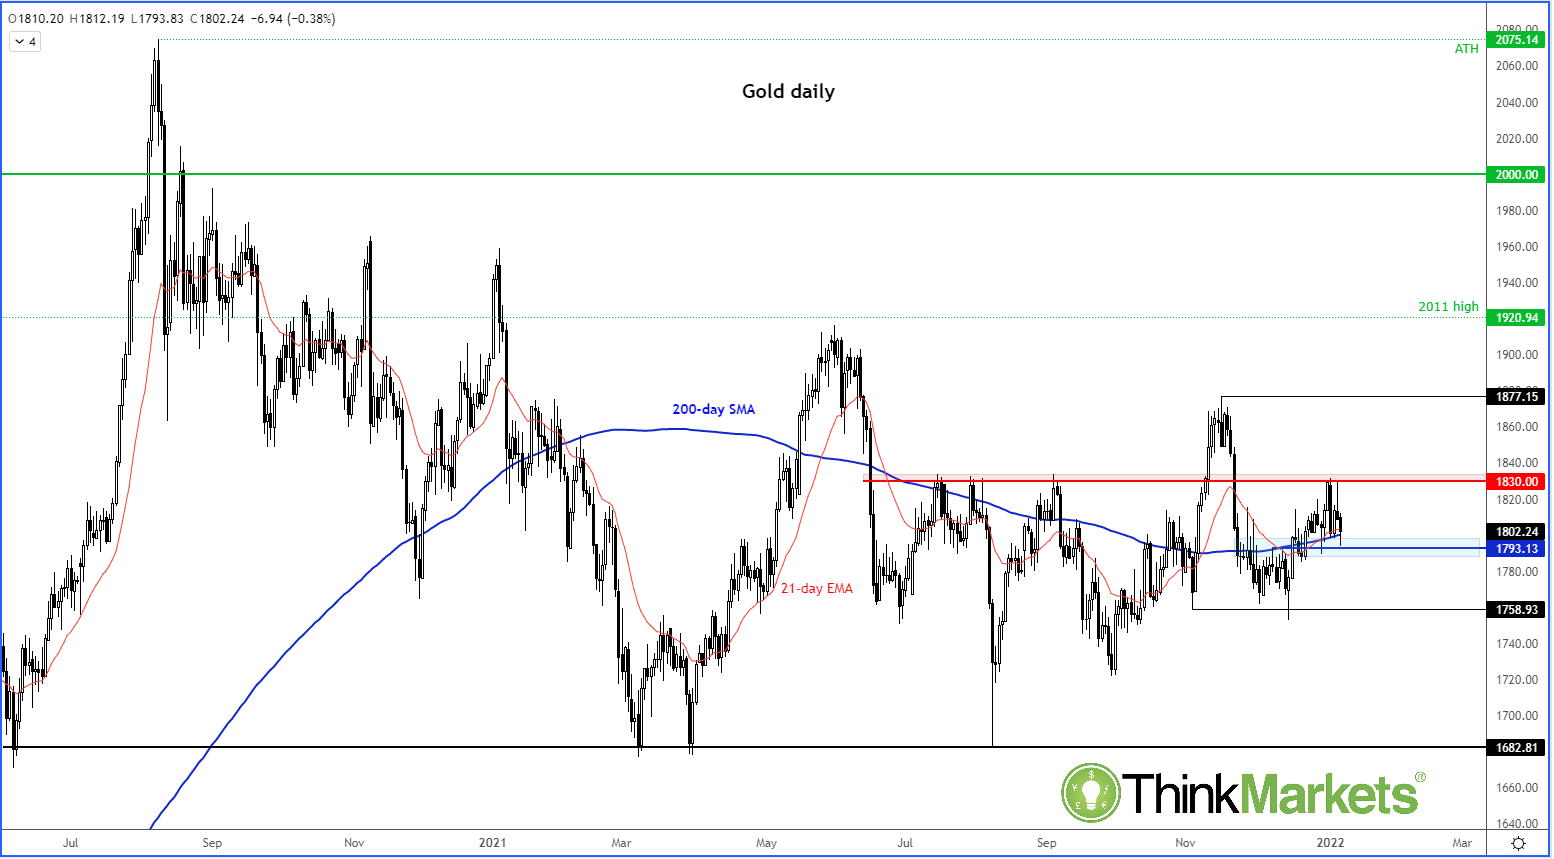
If the above-mentioned support gives way, then I would expect a sharp acceleration in the downtrend in the near-term outlook.
Of course, Bitcoin is a different animal and is less sensitive to traditional macro developments. The ongoing sell-off may attract long term investors to buy the dip as the crypto tests this long-term support zone between $40K to $43K (shaded):
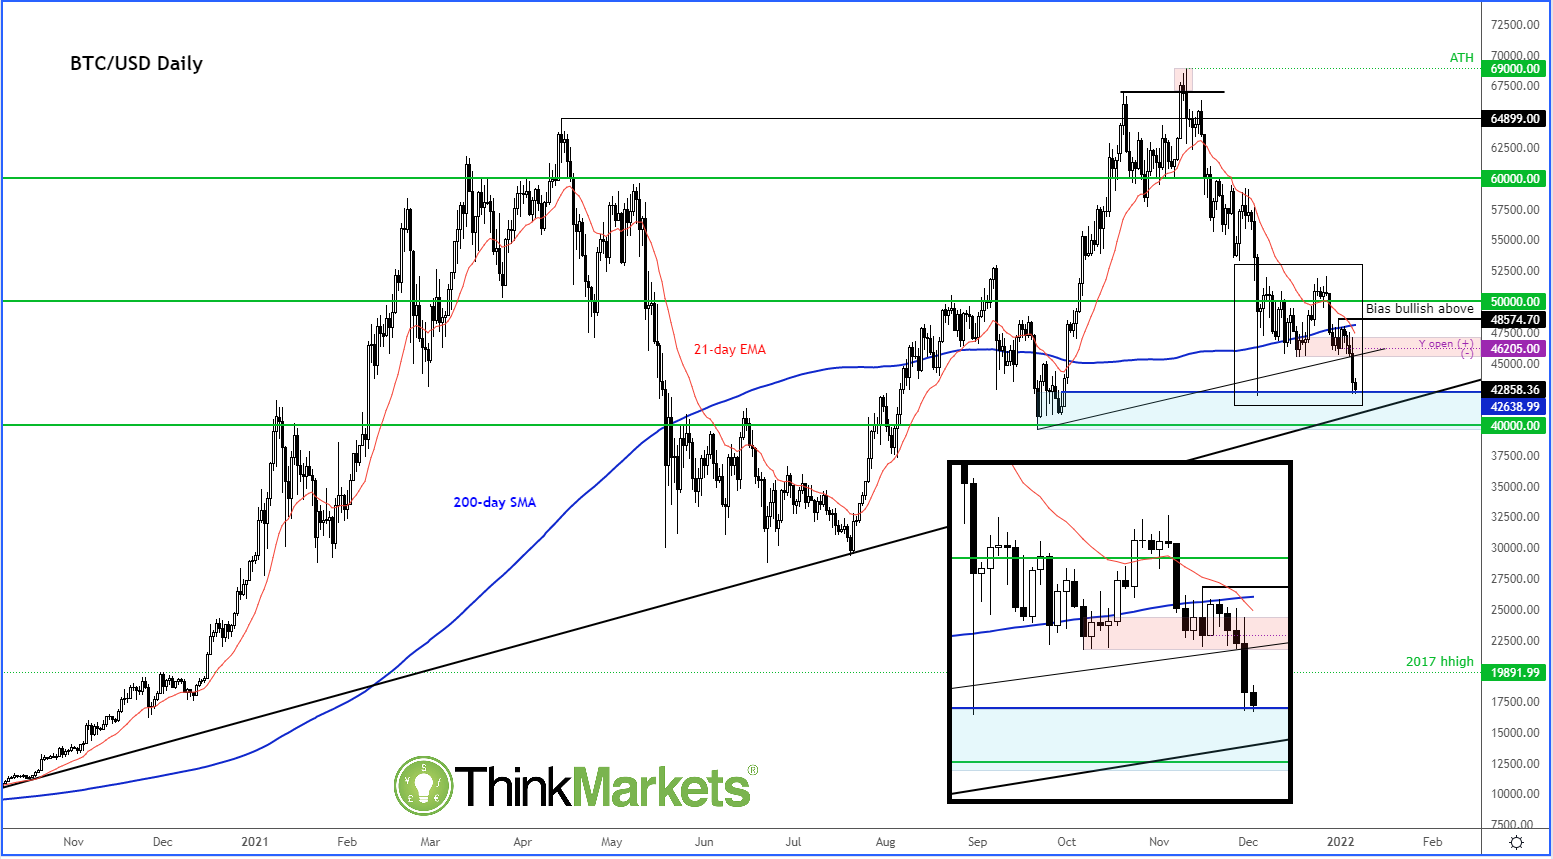
Even so, this could be a challenging year for crypto bulls as the bullish momentum has not there for a couple of months now.
EURAUD Wave Analysis
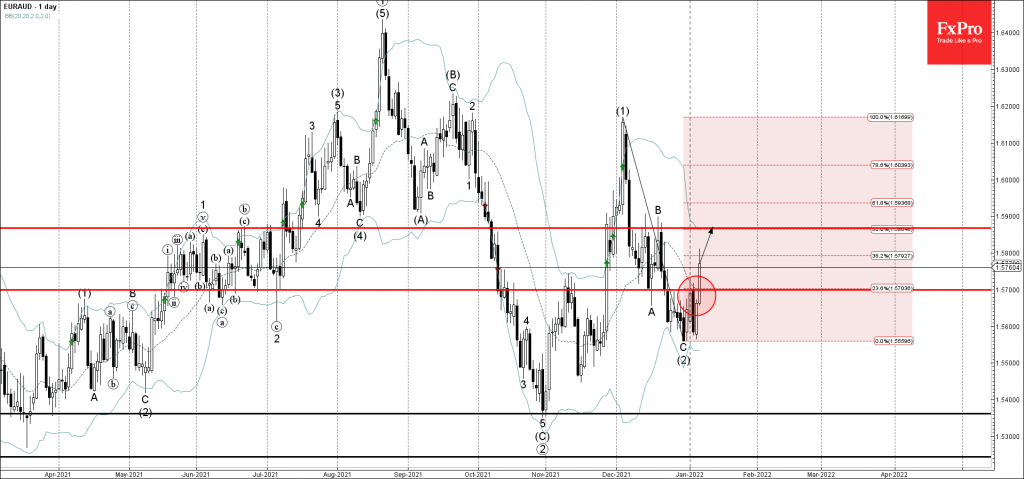
- EURAUD broke key resistance level 1.5700
- Likely to rise to resistance level 1.5865
EURAUD currency pair recently broke key resistance level 1.5700 (which has been reversing the price from December).
The breakout of the resistance level 1.5700 accelerated the active short-term impulse waves 1 and (3).
Given the rising euro bullishness seen today – EURAUD currency pair can be expected to rise further toward the next resistance level 1.5865 (which stopped the previous wave B last month).
Oil Market: Will Prices Remain Elevated?
WTI prices continue to ascend and reach new weekly highs for the third consecutive week. Oil prices have been rising since the start of December possibly signaling some bullish fundamentals are currently unfolding. Through this report we aim to present the key fundamentals currently running the Oil market and how they can affect the commodity’s price. Towards the end we will present a technical analysis that will cover for the recent price action and levels involved.
On the 5th of January the EIA released its weekly Crude Oil Stockpiles figure. The reading is among the top monitored by Oil traders thus its significance is in most cases mirrored with price reaction. Upon release the indicator displayed a drawdown of -2.14M barrels which initially sent WTI prices lower yet the commodity regained ground and stabilized shortly. This was the 6th consecutive weekly drawdown by the EIA a fact that overall could be sending a bullish message to traders. On a similar note on the 4th of January the American Petroleum Institute reported its inventory levels of US crude oil with a large drawdown of -6.43M barrels being released. In the following minutes of the release, WTI’s price gained support as this was the largest among the last 6 consecutive drawdowns. In the US, active Oil rigs continue to be on the rise and are currently at 480 as indicated by the U.S. Baker Hughes Oil Rig Count during the past Friday. In our view active Oil rigs are heading to 500 which can also be used as a bullish sign. Overall the readings for the past days seem to be in line with the upward movement by WTI prices.
Moving to the OPEC front, during the group’s 24th OPEC and non-OPEC Ministerial Meeting the decision to adjust upward the monthly overall production by 0.4 mb/d starting on February 2022, was reconfirmed. The minor increase in supply by the group does not seem to impress traders but seems to motivate some buying interest for the time being. From this decision the OPEC group along with its distinguished partners like Russia seems to be sending some indirect messages that are truly worth mentioning. The current circumstances taking place around the world with the new variant dominating media headlines, is still keeping the OPEC plus group in a rather conservative stance, not willing to allow for excess supply to be inserted in the market. Evidently demand has improved compared to the same time in the past year as this is the reason prices have surged. In the beginning of January 2021 WTI prices were approximately trading at $50 per barrel which is significantly lower than the $77 per barrel valued today. Yet the fact that lockdowns are still a part of the global strategy to overcome the pandemic, the impact on the Oil market can be detrimental. Even currently, Oil demand could be on the back foot as the Omicron variant reels. Thus the OPEC plus group is forced to restrict output.
As we start the New Year Oil traders focus could be shifting to some long term view on the Oil markets that can possibly make it easier for them to form a trading strategy. 2022 may be a year that can possibly focus on other geopolitical matters in the Oil market that remain unresolved like the ongoing Iranian nuclear negotiations likely to be closely monitored by OPEC. In the short term we may continue to see Oil prices remaining at higher levels as demand may remain elevated possibly countering supply which is also expected to rise. Finally please note the higher energy prices observed in the last part of the previous year until the present moment have created many problems around the world. Inflation levels surging globally, energy crunch in China and the current turbulence in Kazakhstan are all related to higher energy prices.
Technical Analysis
WTI daily chart
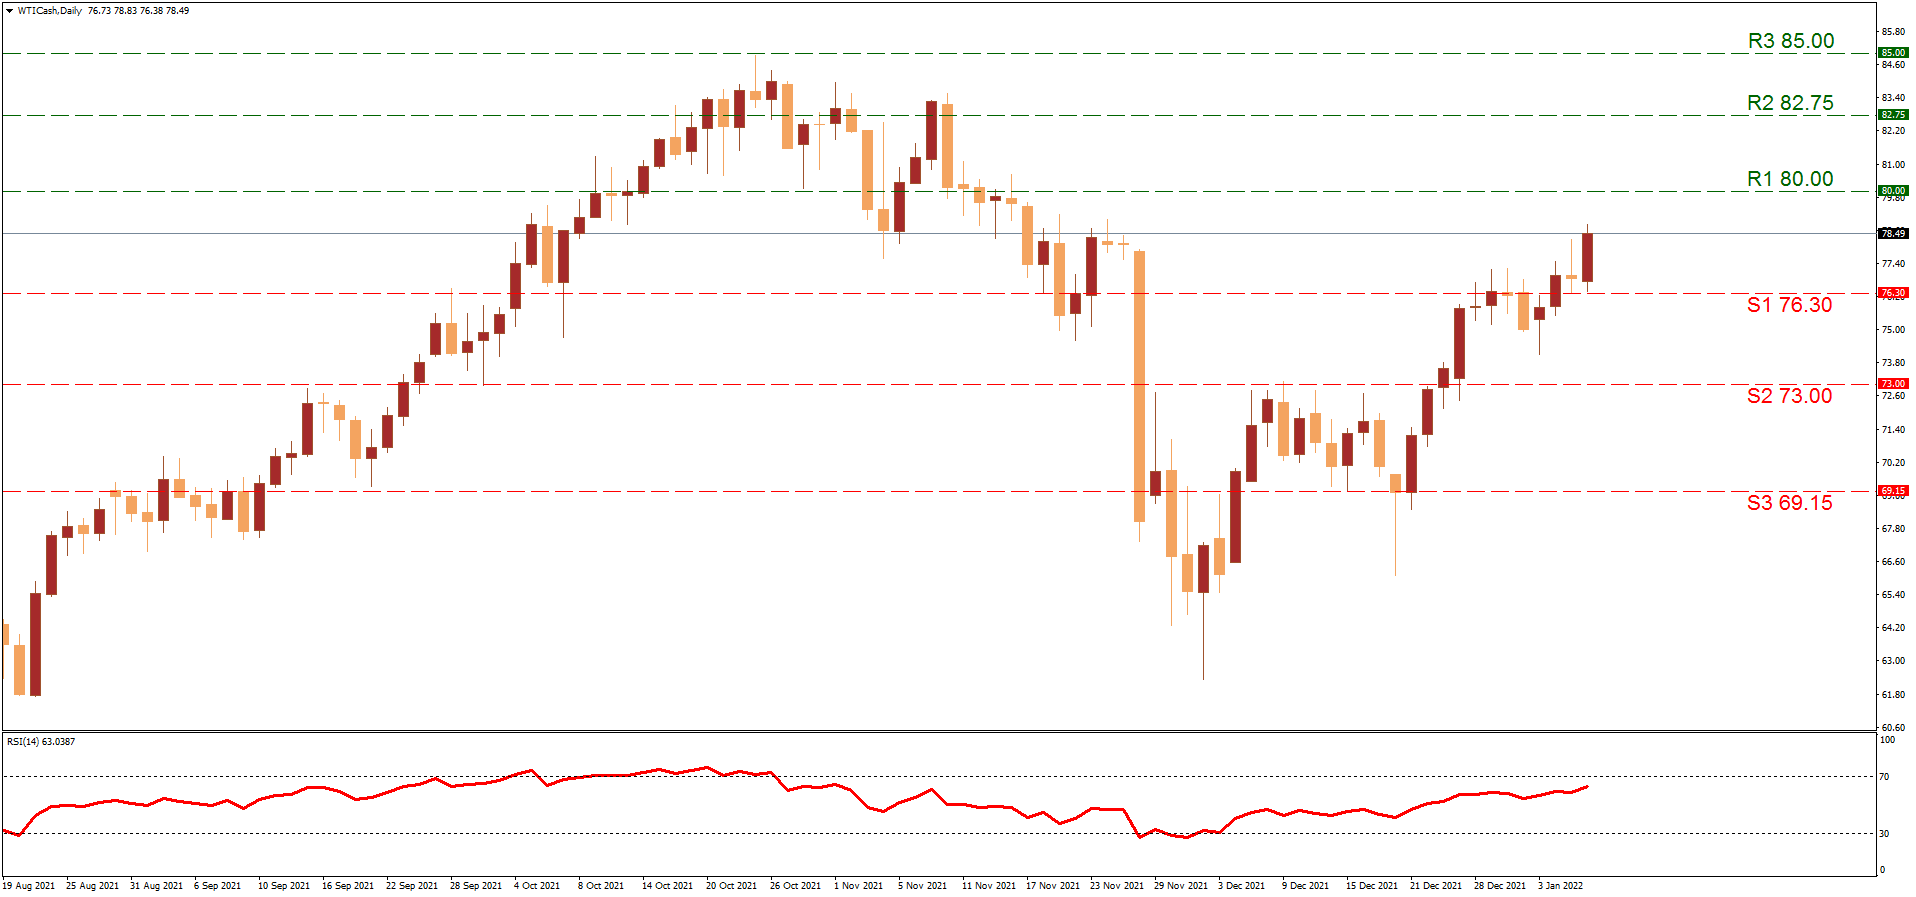
WTI continues to be in an ascending momentum that has commenced on the 2nd of December and remains intact. After stabilization at the (S1) 76.30 support level that was seen as a resistance, the price action has recently broken higher making the case for the (R1) 80.00 line to come into play. Above the (R1) we tend to note the (R2) 82.75 level that was reached for the last time in early November. Even higher the (R3) 85.00 line was briefly approached on the 25th of October and remains the most recent peak for WTI. If the commodity makes a turn downwards then the (S1) 76.30 level can be re tested. The (S2) 73.00 level remains the most possible stop if the selling is to persist further while the (S3) 69.15 level at the end can as be used as a support as it was on the 20th and 21st of December. The RSI indicator below our chart seems to be steadily climbing but has yet to reach the 70 level, This can signal some bearish tendencies in the short term. However, as the trend in our opinion remains upwards, the commodity continues to trade in a larger sideways motion between the (R3) and the (S3).