
Sample Category Title
FOMC Meeting Preview: How FOMC’s December Dot Plot Will Affect the US Dollar (DXY)
The meeting of the Federal Open Market Committee (FOMC) on December 10, 2025, is a highly important final decision of the year that will determine the immediate direction of interest rates and set expectations for next year's monetary policy. This event is unusually difficult to predict because the policymakers are facing conflicting economic reports such as a softening job market versus still-elevated inflation and are significantly divided over what action to take.
In short, it is the year's last major rate decision, and the mixed signals and internal disagreements among the committee members make the outcome exceptionally unpredictable.
Interest Rate Probabilities Ahead of FOMC
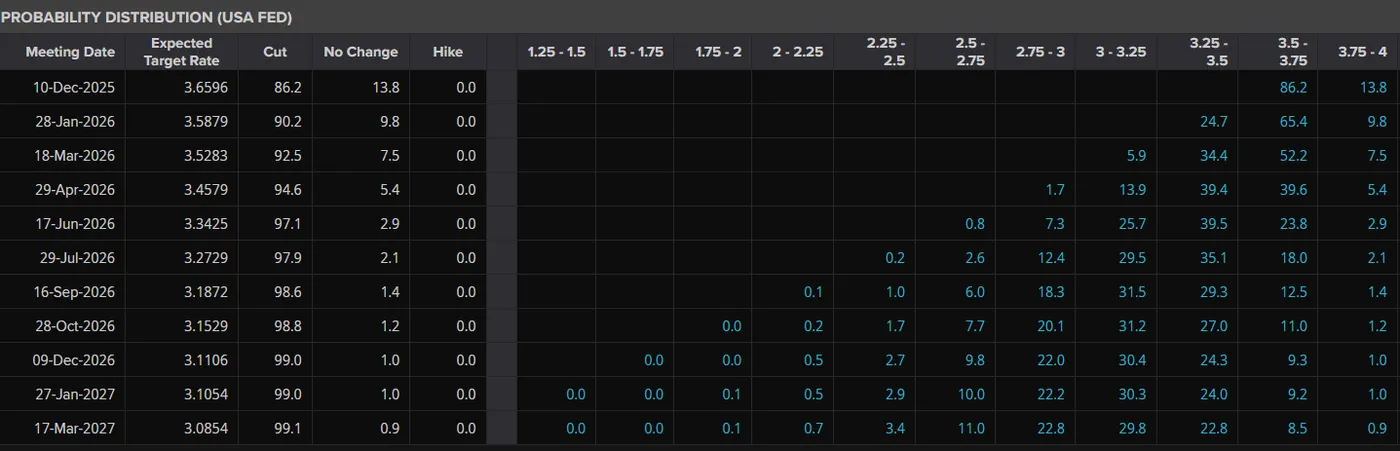
Source: LSEG
Navigating Without a Compass
The importance of the December 2025 decision is made much harder by the fact that the Federal Reserve (the Fed) is essentially flying blind right now. The Fed usually bases its decisions on the latest government data about jobs and inflation, but a recent six-week government shutdown has completely stopped the publication of these key statistics. Because of this, the FOMC is meeting on December 10th without any official government inflation or jobs data since September.
The Fed have been forced to rely on unofficial, "private" reports, like the recent ADP report which showed a worrying loss of 32,000 jobs. If this private data is accurate, the Fed needs to cut rates immediately to avoid a recession, but if the private data is wrong, cutting rates could cause inflation to surge again.
Data Void and Release Dates
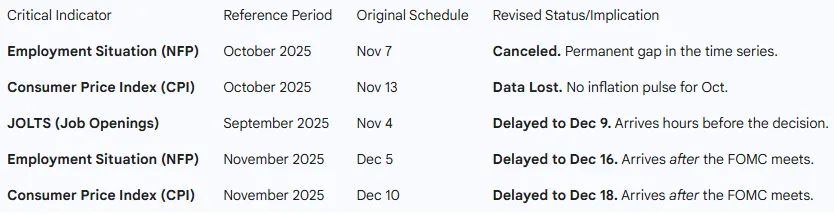
Source: LSEG
This lack of data forces the Fed to confront the two parts of its mission: keeping prices stable (low inflation) and supporting maximum employment (low unemployment) which are now in direct conflict.
On the one hand, the labor market is showing dangerous cracks. While the unemployment rate is currently 4.4%, the speed at which it's rising is setting off a major recession warning signal, known as the "Sahm Rule." This situation argues for an immediate rate cut to prevent a potential "hard landing" recession. On the other hand, the fight against inflation is not over.
Inflation, as measured by the Fed's preferred index, is stuck at 2.8%, which is almost a full percentage point above their 2.0% target. Cutting rates now could cause inflation to rebound, especially with the potential for new government spending and tariffs. Because they lack the recent data to settle this argument, the December meeting has become a battle between policymakers' opposing fears: the "doves" worry more about a recession, while the "hawks" worry more about runaway inflation.
The Decision Matrix: Potential Scenarios
Despite the economic confusion, the majority of market participants expect the FOMC to make a "safety cut" of 25 basis points (a quarter of a percent). The logic is that this small cut is an insurance policy against the job market completely collapsing, but it's not so large that it fully gives up the fight against inflation.
However, this market consensus hides a major disagreement within the Committee itself. Analysts predict a historically high number of dissenting votes (policymakers who vote against the decision), which would signal to investors that Chair Powell has lost control of the policy message and would introduce a lot of uncertainty for the following year.
The "Dot Plot" Battlefield
The real fight isn't just about the current rate cut, but about the communication of future interest rates. This is shown in the "Dot Plot" , a chart that shows where each Fed member expects the interest rate to be in 2026 and beyond. The market is currently expecting the Fed to cut rates roughly four times in 2026, which would send the stock market soaring (the Bull Case). But some forecasters predict the Dot Plot will show a median expectation of only two cuts for 2026. This would be a "hawkish cut" meaning the Fed cuts now but signals they are nearly done which would severely disappoint the market and could lead to a drop in stock prices.
The "Powell Put" vs. The "Trump Call"
The political dimension of this meeting cannot be overstated. With the transition of power looming in January 2026, the Federal Reserve is under intense scrutiny. President-elect Trump has advocated for lower rates to offset his proposed tariff regime. Powell must navigate the optics of appearing politically independent.
If he cuts aggressively, he risks accusations of juicing the economy for the incoming administration or bowing to political pressure.
If he holds, he risks accusations of sabotaging the economic handover. This political shadow suggests Powell will likely opt for the middle path: a 25bps cut (to satisfy the growth mandate) coupled with stern language about data dependence (to satisfy the inflation mandate).
Market Implications: The US Dollar and Global FX
The Dollar's Dilemma
The US Dollar (DXY) is currently caught between cyclical weakness and structural strength. Seasonally, December is a weak month for the Greenback. However, the medium-term outlook is dominated by the concept of divergence.
The Bear Case for USD: The Fed cuts rates, acknowledging a slowing US economy. The yield advantage that the Dollar enjoys over the Euro and Yen erodes. Simultaneously, the uncertainty regarding the next Fed Chair potentially the dovish Kevin Hassett leads markets to price in a "lower for longer" regime. This pushes EUR/USD back toward 1.15.
The Bull Case for USD (The Disappointment Trade): This is the more nuanced risk. The market is pricing in aggressive cuts for 2026. If the Fed's Dot Plot pushes back, signaling "patience," yields at the short end of the US curve (2-year Treasury) will spike. This would catch Dollar bears offside, triggering a short squeeze that rallies the DXY.
Furthermore, if the US economy continues to grow at 2% while the Eurozone stagnates, the "US Exceptionalism" trade remains the dominant force, putting a floor under the Dollar.
US Dollar Index (DXY) Daily Chart, December 8, 2025
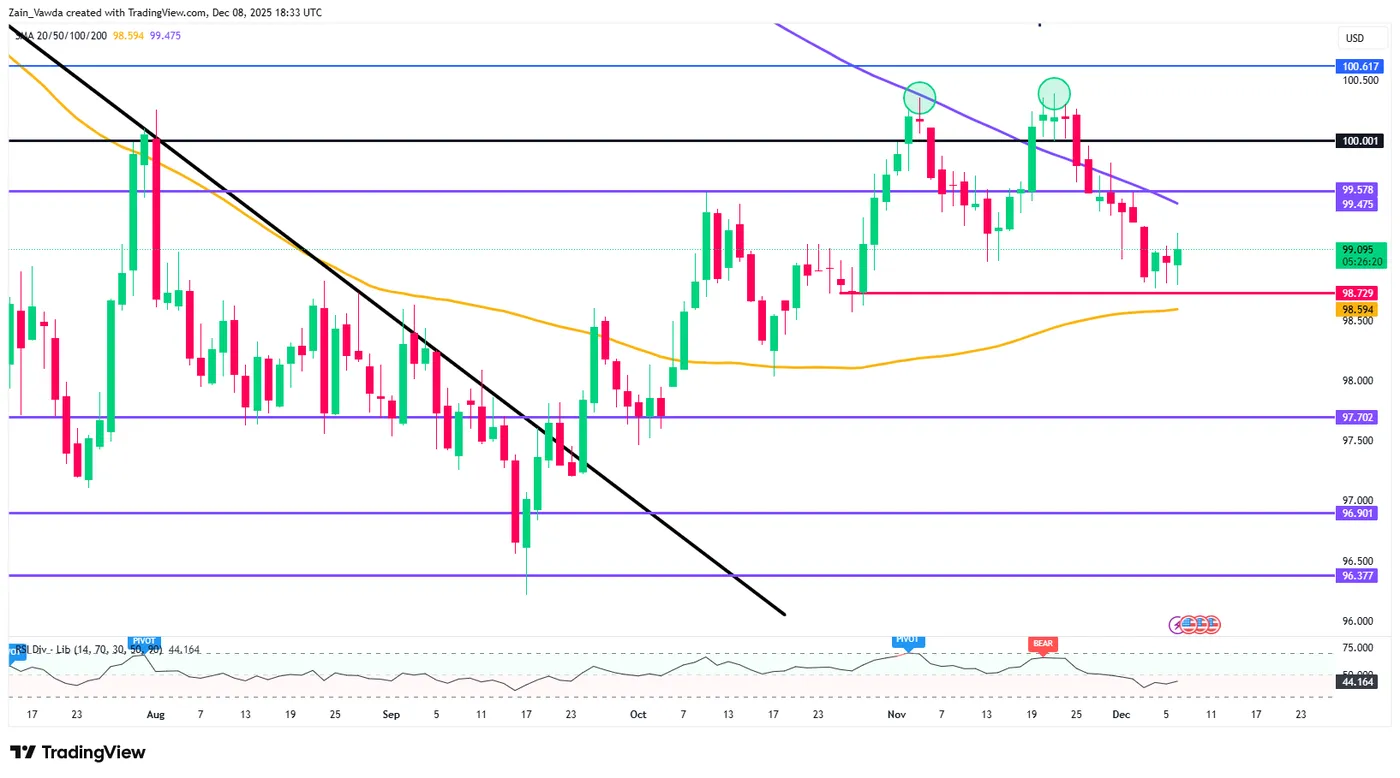
Source: TradingView.Com (click image to enlarge).
Bitcoin Trades Sideways as Market Builds Tension for Next Major Move
Key Highlights
- Bitcoin started a recovery wave above $88,000 and $90,000.
- BTC/USD is trading inside a key contracting triangle with resistance at $93,000 on the 4-hour chart.
- Ethereum also started a decent increase above $3,050.
- XRP price is struggling to settle above the $2.20 resistance.
Bitcoin Price Technical Analysis
Bitcoin price found support near $83,800 and started a recovery wave against the US Dollar. BTC climbed above $88,000 and $90,000 to enter a short-term positive zone.
Looking at the 4-hour chart, the price even surpassed $92,000 before it faced sellers near $94,200. Recently, there was a pullback below $92,000, and the 50% Fib retracement level of the recovery wave from the $83,777 swing low to the $94,175 high.
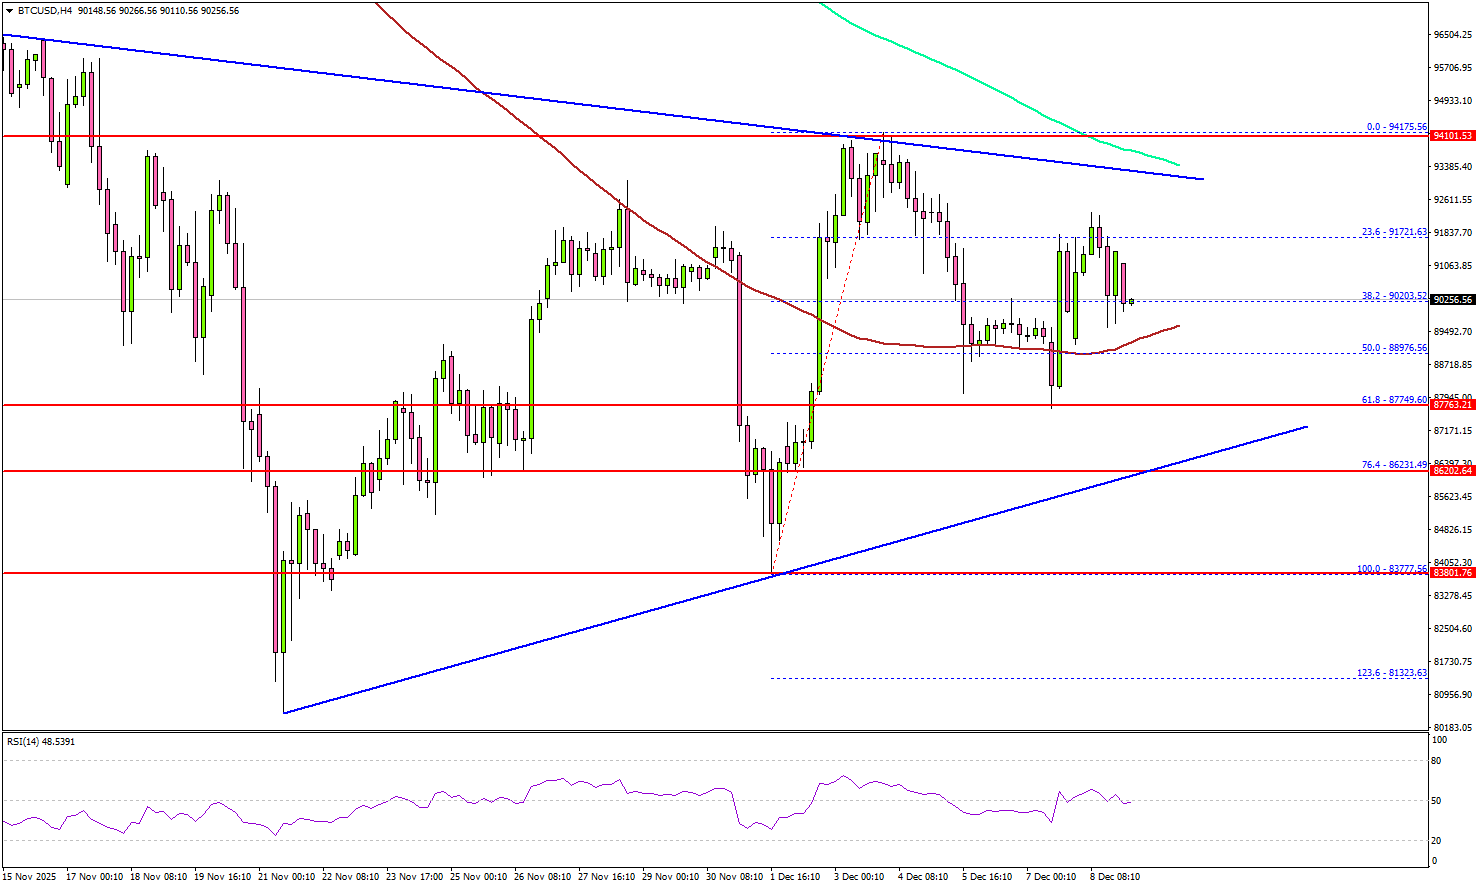
However, the bulls are active near $88,000, the 100 simple moving average (red, 4-hour), and the 61.8% Fib retracement. On the upside, BTC is facing resistance near $93,000 and the 200 simple moving average (green, 4-hour). There is also a key contracting triangle with resistance at $93,000 on the same chart.
A successful close above $93,000 might start another steady increase. In the stated case, the price may perhaps rise toward the $95,500 level. Any more gains might call for a test of $97,000.
Immediate support sits at $90,000. A downside break below $90,000 might start another decline. The next major support is $88,000. Any more losses might call for an extended decline toward the $86,500 support zone.
Looking at Ethereum, the price was able to follow Bitcoin and climbed above the $3,120 resistance region.
Today’s Key Economic Releases
- US ADP Employment Change 4-week average - Forecast 5K, versus -13.5K previous.
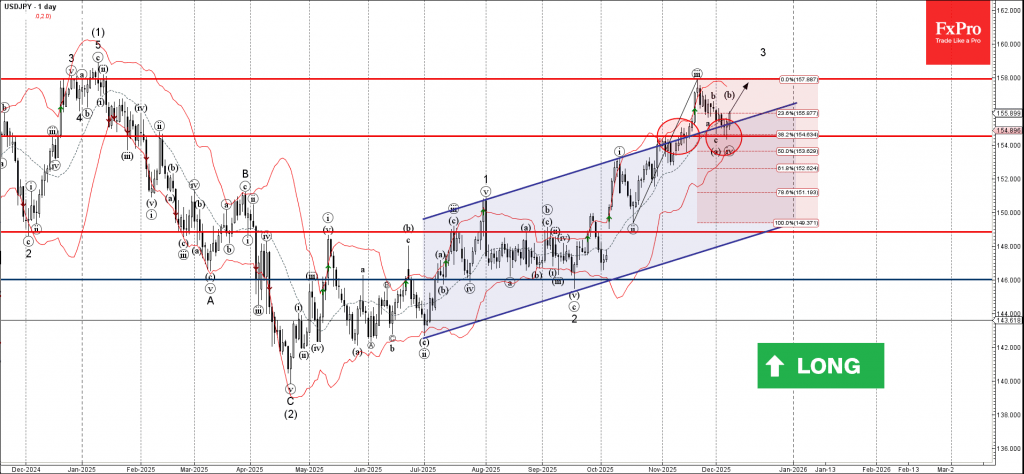
USDJPY Wave Analysis
USDJPY: ⬆️ Buy
- USDJPY reversed from support zone
- Likely to rise to resistance level 158.00
USDJPY currency pair recently reversed up from the support zone between the key support level 154.5 (which reversed the price in October) and the upper trendline of the recently broken up channel from July.
The upward reversal from this support zone stopped the previous minor ABC correction ii of the impulse wave 3 from September.
Given the clear daily uptrend and the bearish US dollar sentiment seen across the FX markets, USDJPY currency pair can be expected to rise to the next resistance level 158.00 (top of the previous impulse wave iii).
Sunset Market Commentary
Markets
Core bonds remain on a slippery slope. German Bunds underperformed UK Gilts and US Treasuries with a Bloomberg interview with German ECB board member Schnabel setting things in motion from the start. Schnabel feels rather comfortable with both market and survey participant expectations that the next rate move is going to be a hike, albeit not anytime soon. She’s the first official to put it that bluntly. The market implied probability that the ECB will still have to lower rates first (next year), long the side on which markets erred, is now less than 5%! The probability of a rate hike over the same period is as small, but the market clearly holds a hiking bias from 2027 onwards. Schnabel argues that the decline in core inflation has stalled at a time when the economy is recovering, the output gap is closing and fiscal policy is expanding, all of which tend to be inflationary. Since the December ECB forecasts, which put growth at a 1% low point for next year, the outlook has brightened with actual Q3 GDP pointing at a resilient economy and the degree of global uncertainty receding further. On inflation, she’s not inclined to let the likely delay in the EU’s carbon-pricing system alter her thinking. The ECB can tolerate moderate deviations from target. On the balance sheet, Schnabel says that the currently bond roll-off (QT) is progressing smoothly with stable money market rates pointing at ample liquidity. It’s different to point at which stage the ECB will have to stop like the Fed did last week. She suggests that the ECB uses a time range going from as soon as H2 2026 to “much later”. Daily changes on the German yield curve range between +2.2 bps (30-yr) and +5.7 bps (5-yr). EU swap rates add 1.5 bps (30-yr) to 5.5 bps (5-yr). From a technical point of view, German yields rise to levels last seen at the end of Q1 this year when Chancellor Merz’ budget turn triggered reflationary spirits. The German 30-yr yield trades at 3.45% for the first time since 2011. EU swap rates equally move to highest levels since March at the shorter tenors. The EU 10y & 30y swap rates already breached that technical mark to match levels last seen in respectively July 2024 and October 2023. Current changes on the US curve vary between +1.1 bp (30-yr) and +3.2 bps (5-yr). The euro tried to profit from the interest rate support with EUR/USD initially going from 1.1550 to 1.1570 but the move again lacked steam. The pair is currently back at opening levels awaiting key events tomorrow (vote on French social security bill) and on Wednesday (FOMC meeting). Stock markets started the week very mixed with the EuroStoxx50 and S&P 500 both flat at the moment of writing.
News & Views
In the Bank of International Settlements’ newly published quarterly review, one particular topic attracted the attention of financial media. A box article titled “Bubble conditions in US equities and gold?” states that both asset classes entered what the authors call “explosive territory” the past few quarters. This happening simultaneously is the only time in at least 50 years. “A typical symptom of a developing bubble is the growing influence of retail investors trying to chase price trends”, the BIS said, revealing that it was mostly retail investors who recently poured money into US equities and gold funds. Institutional investors meanwhile took money out of US stocks or maintained flat positions in gold. The BIS said retail investors’ “growing prominence could threaten market stability down the road, given their propensity to engage in herd-like behaviour, amplifying price gyrations should fire sales occur.” The warning, particularly for stock market valuations, is not at all the first. The likes of the IMF, BoE and ECB have all previously identified the matter as a market risk.
China’s annual trade surplus for the first time ever surpassed the $1tn mark in November and thereby already exceeding last year’s 12-month record. Exports grew a strong 5.9%, outpacing the 1.9% import increase. US-bound shipments again plunged, by 29%, following the import levies but were more than compensated by exports to the likes of the EU (+15%) and Africa (+28%). Trade as such remains a key driver for the Chinese economy, despite pledges and efforts to boost the domestic side of the equation. Meanwhile, the huge surplus with the EU triggers frustration. French president Macron last week for example warned “strong measures”, including tariffs, may be needed if China fails to address the trade imbalance.
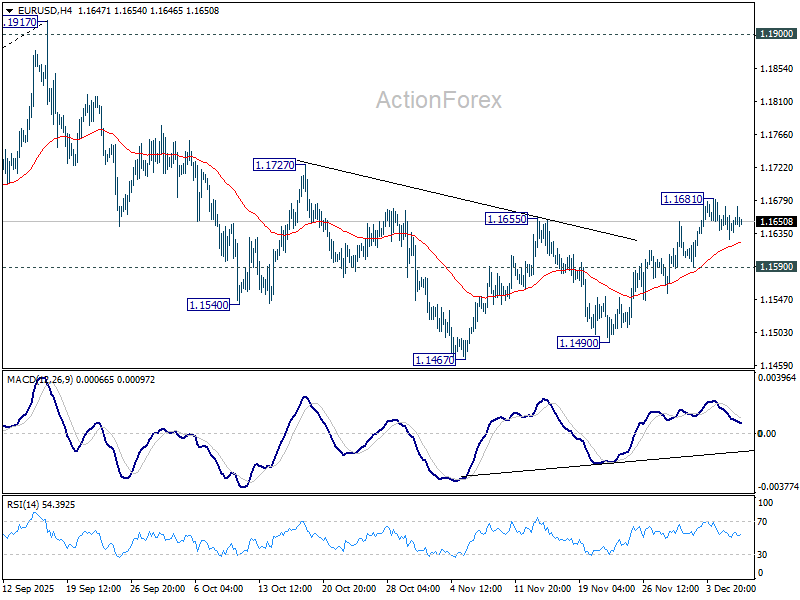
EUR/USD Daily Outlook
Daily Pivots: (S1) 1.1624; (P) 1.1648; (R1) 1.1668; More….
EUR/USD is staying gin consolidations below 1.1681 and intraday bias remains neutral. Further rally is in favor with 1.1590 minor support intact. Corrective fall from 1.1917 could have completed at 1.1467. Above 1.1681 will target 1.1727 resistance first. Firm break there will solidify this case and bring retest of 1.1917 high. However, break of 1.1590 will revive near term bearishness, and bring retest of 1.1467 low.
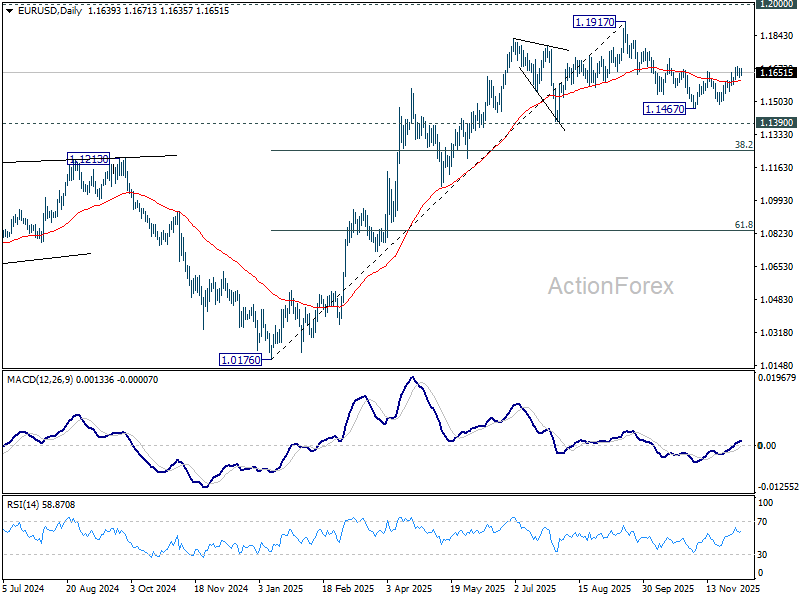
In the bigger picture, as long as 55 W EMA (now at 1.1346) holds, up trend from 0.9534 (2022 low) is still in favor to continue. Decisive break of 1.2 key psychological level will carry larger bullish implication. However, sustained trading below 55 W EMA will argue that rise from 0.9534 has completed as a three wave corrective bounce, and keep long term outlook bearish.
GBP/USD Mid-Day Outlook
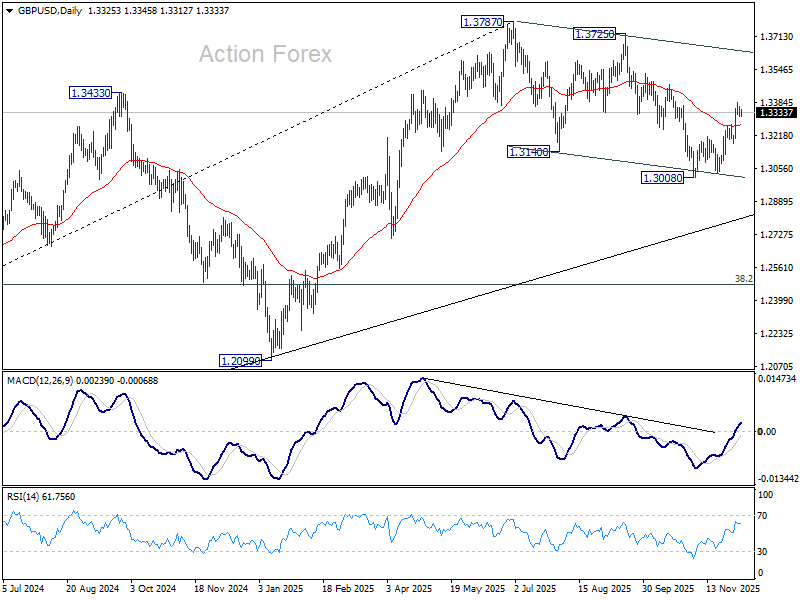
Daily Pivots: (S1) 1.3311; (P) 1.3336; (R1) 1.3357; More...
GBP/USD is staying in consolidations below 1.3384 and intraday bias remains neutral. With 1.3178 support intact, further rally is still expected. As noted before, fall from 1.3787 should have completed as a three-wave correction to 1.3008. On the upside, above 1.3384 will target 1.3470 resistance. Decisive break there will bring retest of 1.3787 high.
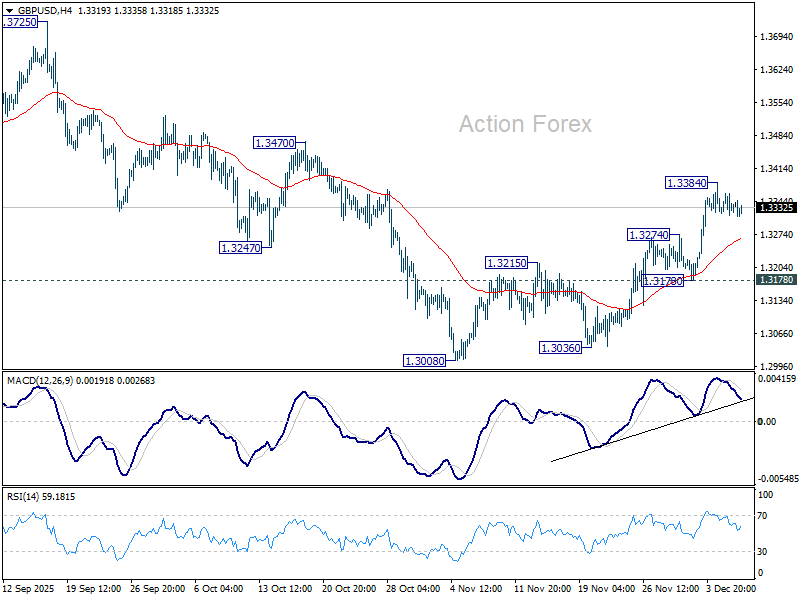
In the bigger picture, current development suggests that fall from 1.3787 is merely a corrective move, and larger rise from 1.0351 (2022 low) is still in progress. Firm break of 1.3787 will target 1.4248 (2021 high) key structural resistance. This will remain the favored case as long as target 38.2% retracement of 1.0351 to 1.3787 at 1.2474 holds, in case of another fall.
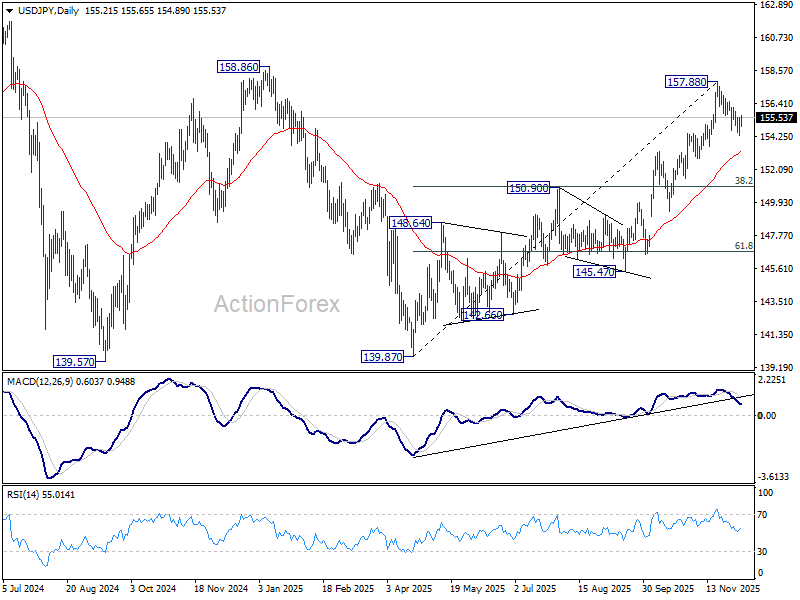
USD/JPY Mid-Day Outlook
Daily Pivots: (S1) 154.66; (P) 155.07; (R1) 155.80; More...
No change in USD/JPY's outlook and intraday bias stays neutral at this point. On the downside, below 154.33 will target 55 D EMA (now at 153.27). Firm break there will extend the fall from 157,88 short term top to 150.90 cluster (38.2% retracement of 139.87 to 157.88 at 151.00). On the upside, though, break of 156.17 resistance will indicate that the pullback has completed and bring retest of 157.88 high.
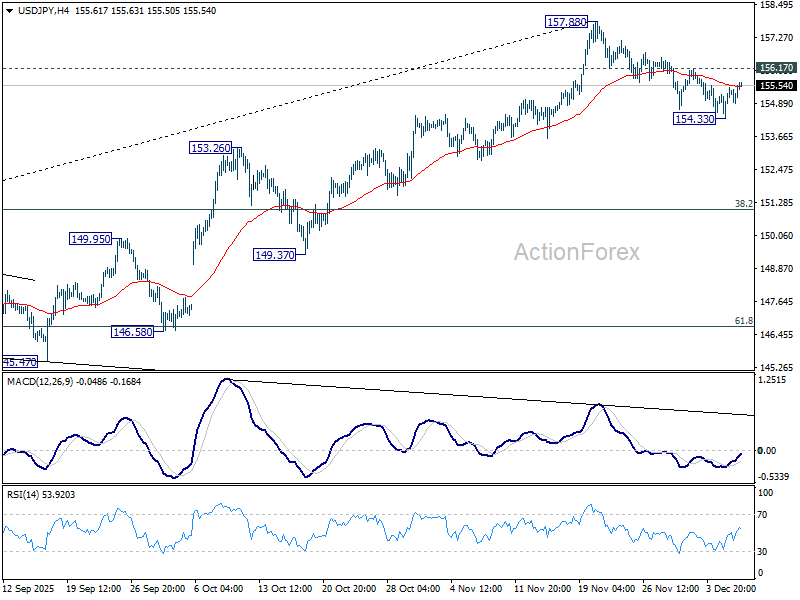
In the bigger picture, corrective pattern from 161.94 (2024 high) could have completed with three waves at 139.87. Larger up trend from 102.58 (2021 low) could be ready to resume through 161.94 high. Decisive break of 158.85 structural resistance will solidify this bullish case and target 161.94 for confirmation. On the downside, break of 150.90 resistance turned support will dampen this bullish view and extend the corrective range pattern with another falling leg.
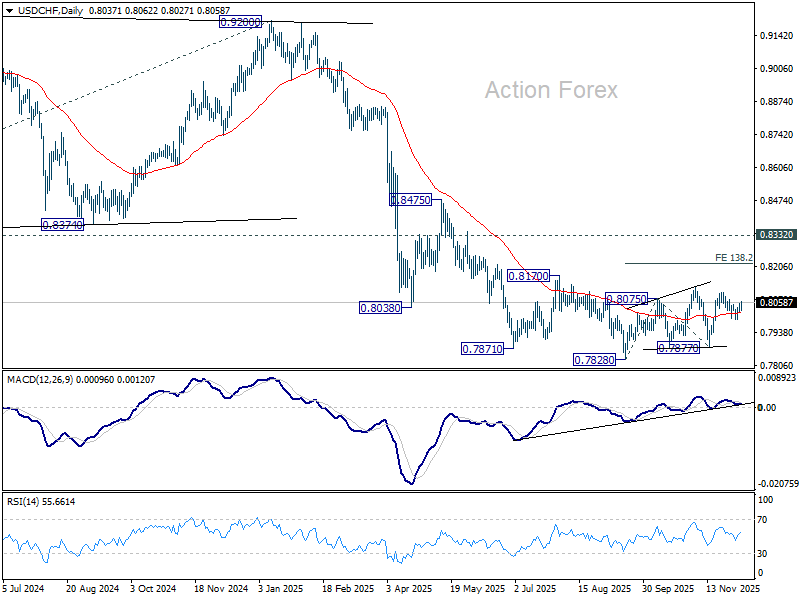
USD/CHF Mid-Day Outlook
Daily Pivots: (S1) 0.8014; (P) 0.8034; (R1) 0.8067; More…
USD/CHF's break of 0.8052 resistance suggests that pullback from 0.8101 has completed at 0.7990. Intraday bias is back on the upside for 0.8101 and then 0.8123. As noted before, price actions from 0.7828 are developing into a corrective pattern. Firm break of 0.8123 will target 138.2% projection of 0.7828 to 0.8075 from 0.7877 at 0.7812. For now, risk will stay on the upside as long as 0.7990 support holds, in case of retreat.
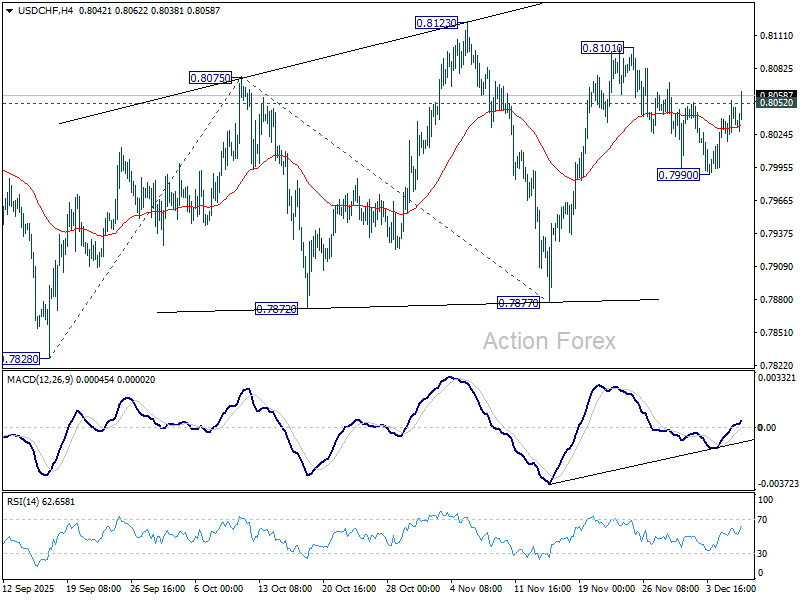
In the bigger picture, outlook will stay bearish as long as 0.8332 support turned resistance holds (2023 low). Long term down trend from 1.0342 (2017 high) is still in progress. Next target is 100% projection of 1.0146 (2022 high) to 0.8332 from 0.9200 at 0.7382.
Markets Drift, Loonie Firms, Swiss Franc Slips, Aussie Awaits RBA
European markets are treading water today, and the same pattern is visible in US futures as investors hold their positions ahead of Wednesday’s FOMC decision. With volatility expected to rise sharply mid-week, traders appear content to let the market consolidate and avoid premature positioning.
Even in this holding pattern, pockets of activity stand out—most notably in the Canadian Dollar. Loonie’s strength extends the momentum from last week’s impressive jobs report, which reinforced expectations that the BoC will keep its policy rate unchanged at 2.25% later this week. The tone from policymakers is expected to confirm that the easing cycle is finished and that the central bank is now in a prolonged pause.
Another tailwind in the background is political. US President Donald Trump signaled openness to restarting trade discussions with Canada after what he described as a “very productive” conversation with Prime Minister Mark Carney during a World Cup draw event. Carney’s office later described the talks as “constructive,” offering a glimmer of optimism.
On the other side of the spectrum, Swiss Franc is under broad pressure today. SNB is widely expected to keep rates unchanged at 0.00% and reiterate that the threshold for returning to negative rates remains high. Yet speculation has emerged that policymakers could tilt toward a more dovish tone, possibly even hinting at negative rates sometime next year.
Some traders appear to be positioning for that scenario, helping drive CHF lower against most major peers. Still, it is far too early to draw definitive conclusions about the policy path for 2026. Any refusal by SNB to entertain dovish speculation this week could spark a swift reversal in the Franc’s performance.
Attention is also turning toward tomorrow's RBA decision. A steady hold at 3.60% is effectively a foregone conclusion, but the focus is on Governor Michele Bullock’s messaging. Markets want to know whether she will explicitly shift the emphasis away from supporting growth and toward the still-unfinished battle against inflation.
While rate cuts are clearly off the table, expectations for a return to tightening in 2026 have grown louder. That said, some analysts caution that such speculation may be premature. Trimmed-mean inflation is only slightly above 3%, job ads have plateaued, and private-sector momentum remains uneven. Public-sector spending is also set to ease, creating additional downside risks.
Bullock’s communication will therefore be scrutinized line by line, particularly for any hint that the RBA is considering a policy pivot next year. For now, markets seem unsure whether she will validate or push back against emerging expectations for future hikes.
As of the latest positioning, Kiwi leads the performance board, followed by Loonie and then Euro. Swiss Franc is the weakest today, trailed by Yen and Sterling. Dollar and Aussie sit in the middle.
In Europe, at the time of writing, FTSE is down -0.02%. DAX is up 0.31%. CAC is down -0.12%. UK 10-year yield is up 0.014 at 4.495. Germany 10-year yield is up 0.042 at 2.844. Earlier in Asia, Nikkei rose 0.18%. Hong Kong HSI fell -1.23%. China Shanghai SSE rose 0.54%. Singapore Strait Times fell -0.54%. Japan 10-year JGB yield rose 0.02 to 1.972.
ECB’s Schnabel signals rates to stay put but next move likely a hike
ECB Executive Board member Isabel Schnabel struck a subtly hawkish tone in a Bloomberg interview, saying she is “rather comfortable” with market expectations that the ECB’s next move will be a rate hike. Still, she stressed that such expectations remain uncertain and that policymakers are “not currently” focused on when the next move might occur.
Schnabel reiterated that interest rates are “in a good place” and likely to remain there absent a major shock. What has changed, however, is the balance of inflation risks—which she said has “shifted to the upside”—a shift that naturally tilts the bias toward future tightening rather than easing.
Also, Schnabel flagged the possibility that the Eurozone’s natural rate of interest may be rising. Structural forces such as AI-driven investment and stepped-up public spending could lift the equilibrium rate over time, meaning the current stance may become increasingly accommodative if not adjusted. If policy drifts into a zone that is “too accommodative,” she said, that would be the moment to consider a further rate move.
Eurozone Sentix confidence edges higher to -6.2 but recovery still elusive
Eurozone Sentix Investor Confidence improved slightly in December, rising from -7.4 to -6.2, a touch better than expectations of -6.3. Both components strengthened, with Current Situation Index climbing from -17.5 to -16.5 and Expectations rising from 3.3 to 4.8. The figures reinforce a theme that has persisted through the past quarter: sentiment is no longer deteriorating, but neither is it showing convincing signs of a rebound.
Sentix noted that the Eurozone economy is “at best” stabilizing, even as global momentum improves across most other major regions. That divergence reflects the bloc’s inability to translate external tailwinds into domestic gains, with survey participants continuing to flag sluggish internal dynamics and weak demand conditions.
Germany remains the key drag heading into year-end. According to Sentix, recessionary forces in the Eurozone’s largest economy are still “having an impact,” and those pressures are filtering through to the wider region. Until German activity finds a firmer footing, the broader recovery narrative will remain tentative at best.
Japan’s wage picture improves but real incomes growth stays negative at -0.7%
Japan’s economic data delivered a familiar combination of improving nominal pay but still-depressed real incomes. Real wages fell -0.7% yoy in October, the 10th consecutive decline, though the rate of contraction moderated for the second month. Officials highlighted that fewer part-time roles and a higher share of full-time employees—who earn more—helped support headline income levels. Yet inflation of 3.4% yoy, driven mainly by food prices, continued to outpace wage gains.
Nominal earnings were considerably stronger, rising 2.6% yoy and beating forecasts for 2.2%. That marks a three-month high and extends the run of increases to 46 straight months, giving policymakers some evidence that wage momentum is holding up. Regular pay also expanded a robust 2.6% yoy, while bonus-driven special payments surged 6.7% yoy, providing a further boost. strain, limiting the lift to consumption.
The bigger disappointment came from growth data. Japan’s Q3 GDP was revised down to -2.3% annualized, from the initial -1.8%, making it the weakest quarter since 2023.
China’s exports rebound sharply by 5.9% yoy, US shipments remain deep in double-digit decline
China’s November trade data delivered a stronger-than-expected rebound, with exports surging 5.9% yoy to USD 330.35B, sharply reversing October’s -1.1% decline. The improvement marks the strongest performance since early 2024.
However, the headline strength masks continued weakness in China–U.S. trade, where shipments plunged -28.6% yoy, extending a run of eight straight months of double-digit declines. Despite the one-year tariff truce, effective levies remain elevated—averaging 47.5% on Chinese goods entering the U.S. and around 32% on American goods entering China—keeping bilateral flows under heavy pressure.
A clear divergence across regions stood out. Exports to ASEAN partners climbed more than 8% yoy, while shipments to the EU jumped nearly 15% y/y, underlining a rotation in China’s export momentum toward other major markets.
Imports, however, rose a softer-than-expected 1.9% yoy, pointing to still-cautious domestic demand despite policy easing efforts. With exports outpacing imports, China’s trade surplus widened to USD 111.68B in November.
USD/CHF Mid-Day Outlook
Daily Pivots: (S1) 0.8014; (P) 0.8034; (R1) 0.8067; More…
USD/CHF's break of 0.8052 resistance suggests that pullback from 0.8101 has completed at 0.7990. Intraday bias is back on the upside for 0.8101 and then 0.8123. As noted before, price actions from 0.7828 are developing into a corrective pattern. Firm break of 0.8123 will target 138.2% projection of 0.7828 to 0.8075 from 0.7877 at 0.7812. For now, risk will stay on the upside as long as 0.7990 support holds, in case of retreat.
In the bigger picture, outlook will stay bearish as long as 0.8332 support turned resistance holds (2023 low). Long term down trend from 1.0342 (2017 high) is still in progress. Next target is 100% projection of 1.0146 (2022 high) to 0.8332 from 0.9200 at 0.7382.