
Sample Category Title
EUR/AUD Daily Outlook
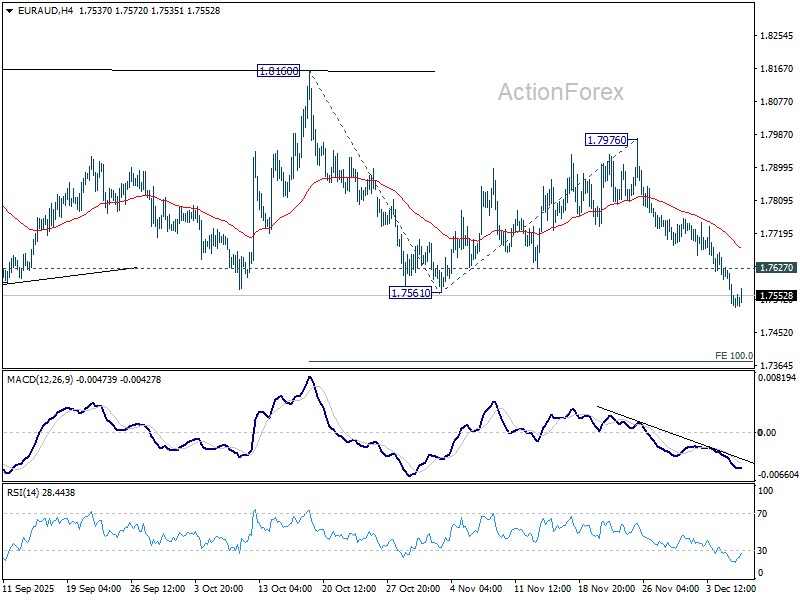
Daily Pivots: (S1) 1.7499; (P) 1.7565; (R1) 1.7599; More...
Intraday bias in EUR/AUD remains on the downside at this point. Fall from 1.8160 is seen as the third leg of the pattern from 1.8554. Deeper decline should be seen to 100% projection of 1.8160 to 1.7561 from 1.7976 at 1.7377. Firm break there will pave the way to 138.2% projection at 17148. On the upside, above 1.7627 minor resistance will turn intraday bias neutral and bring consolidations first, before staging another fall.
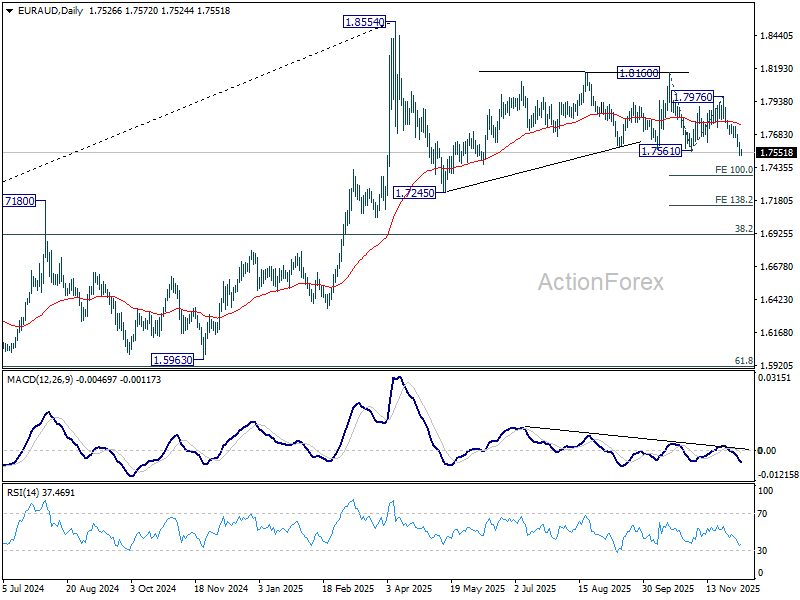
In the bigger picture, as long as 55 W EMA (now at 1.7456) holds, price actions from 1.8554 could still be a correction to rise from 1.5963 only. However, sustained break of the EMA will argue that it's already correcting the whole up trend from 1.4281 (2022 low). In this case, deeper decline would be seen to 38.2% retracement of 1.4281 to 1.8554 at 1.6922.
EUR/CHF Daily Outlook
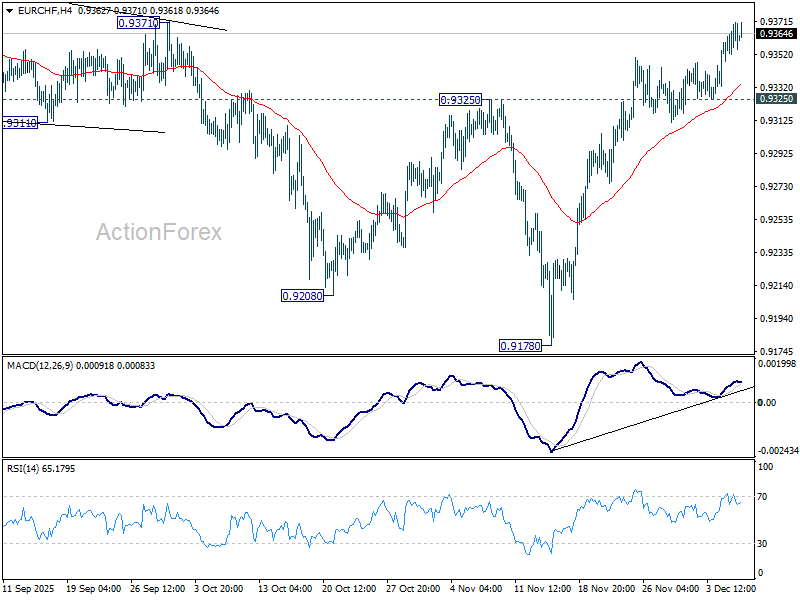
Daily Pivots: (S1) 0.9354; (P) 0.9363; (R1) 0.9378; More....
Intraday bias in EUR/CHF stays on the upside, as rise from 0.9178 is in progress for 0.9452 key structural resistance. Decisive break there will carry larger bullish implications. For now, risk will stay on the upside as long as 0.9325 support holds, in case of retreat.
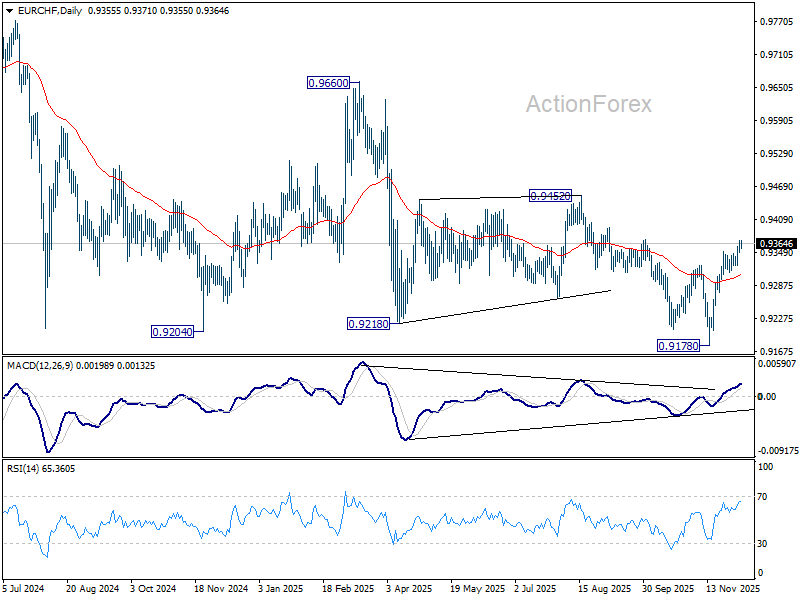
In the bigger picture, EUR/CHF has breached long term falling channel resistance as the rebound from 0.9278 extends. Considering bullish convergence condition in W MACD, sustained trading above 55 W EMA (now at 0.9372) will indicate medium term bottoming, and suggests that it's already in larger scale rebound. Further break of 0.9452 resistance will bring stronger medium term rally towards 0.9228 resistance next. Nevertheless, rejection by 55 W EMA will retain bearishness for another fall through 0.9278 at a later stage.
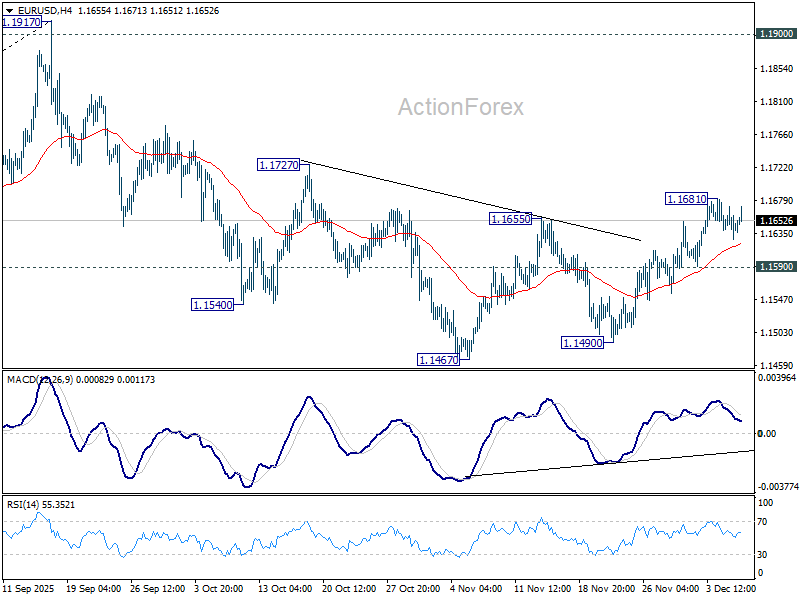
EUR/USD Daily Outlook
Daily Pivots: (S1) 1.1624; (P) 1.1648; (R1) 1.1668; More….
Intraday bias in EUR/USD stays neutral, and further rally is in favor with 1.1590 minor support intact. Corrective fall from 1.1917 could have completed at 1.1467. Above 1.1681 will target 1.1727 resistance first. Firm break there will solidify this case and bring retest of 1.1917 high. However, break of 1.1590 will revive near term bearishness, and bring retest of 1.1467 low.
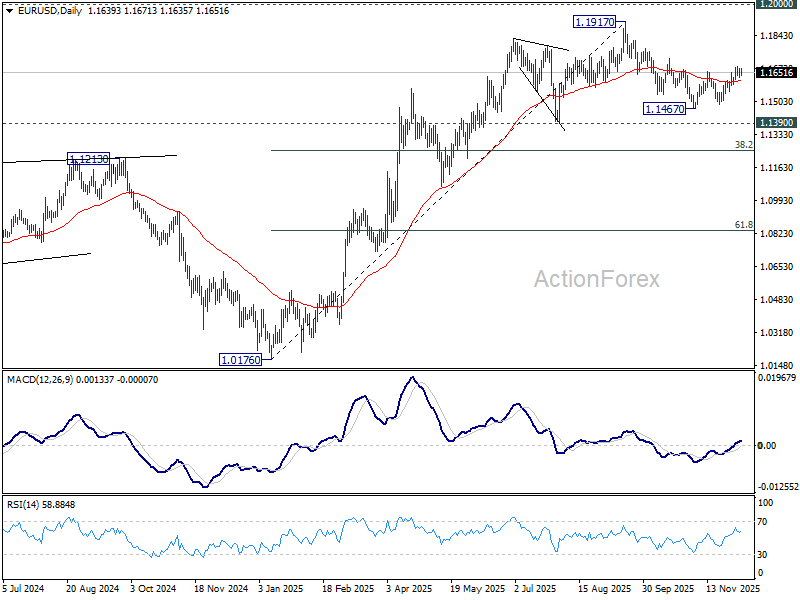
In the bigger picture, as long as 55 W EMA (now at 1.1346) holds, up trend from 0.9534 (2022 low) is still in favor to continue. Decisive break of 1.2 key psychological level will carry larger bullish implication. However, sustained trading below 55 W EMA will argue that rise from 0.9534 has completed as a three wave corrective bounce, and keep long term outlook bearish.
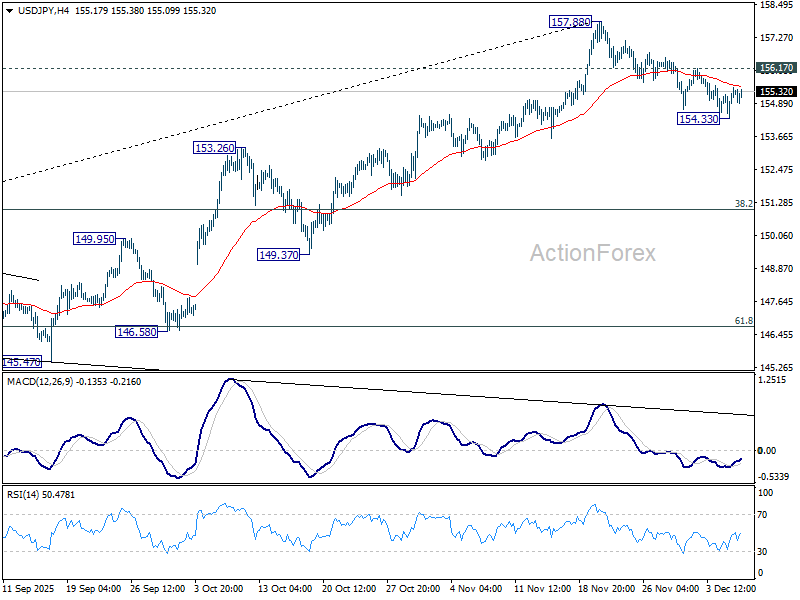
USD/JPY Daily Outlook
Daily Pivots: (S1) 154.66; (P) 155.07; (R1) 155.80; More...
Intraday bias in USD/JPY remains neutral for the moment. On the downside, below 154.33 will target 55 D EMA (now at 153.27). Firm break there will extend the fall from 157,88 short term top to 150.90 cluster (38.2% retracement of 139.87 to 157.88 at 151.00). On the upside, though, break of 156.17 resistance will indicate that the pullback has completed and bring retest of 157.88 high.
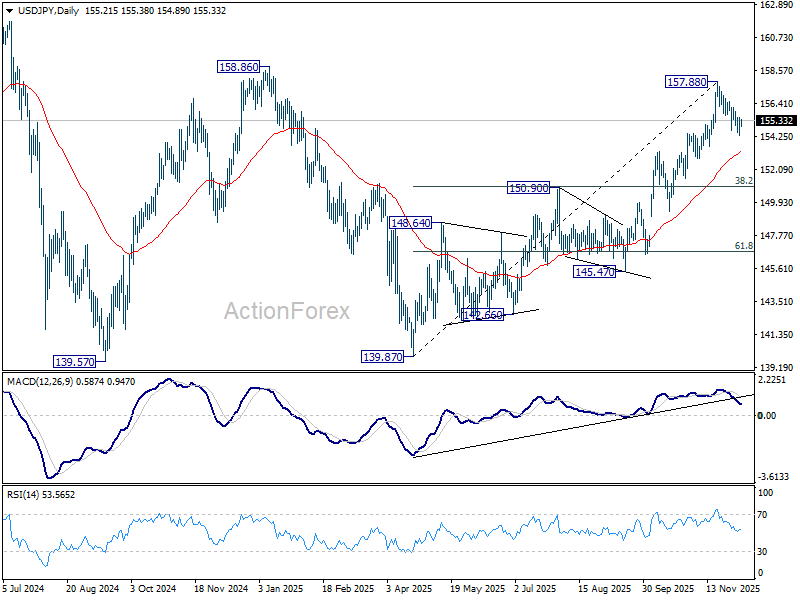
In the bigger picture, corrective pattern from 161.94 (2024 high) could have completed with three waves at 139.87. Larger up trend from 102.58 (2021 low) could be ready to resume through 161.94 high. Decisive break of 158.85 structural resistance will solidify this bullish case and target 161.94 for confirmation. On the downside, break of 150.90 resistance turned support will dampen this bullish view and extend the corrective range pattern with another falling leg.
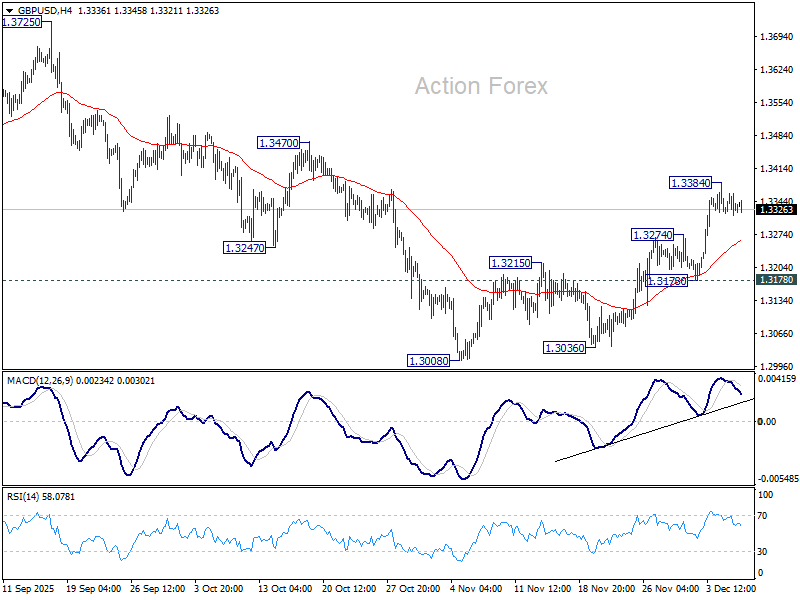
GBP/USD Daily Outlook
Daily Pivots: (S1) 1.3311; (P) 1.3336; (R1) 1.3357; More...
Intraday bias in GBP/USD stays neutral first and further rally is expected with 1.3178 support intact. As noted before, fall from 1.3787 should have completed as a three-wave correction to 1.3008. On the upside, above 1.3384 will target 1.3470 resistance. Decisive break there will bring retest of 1.3787 high.
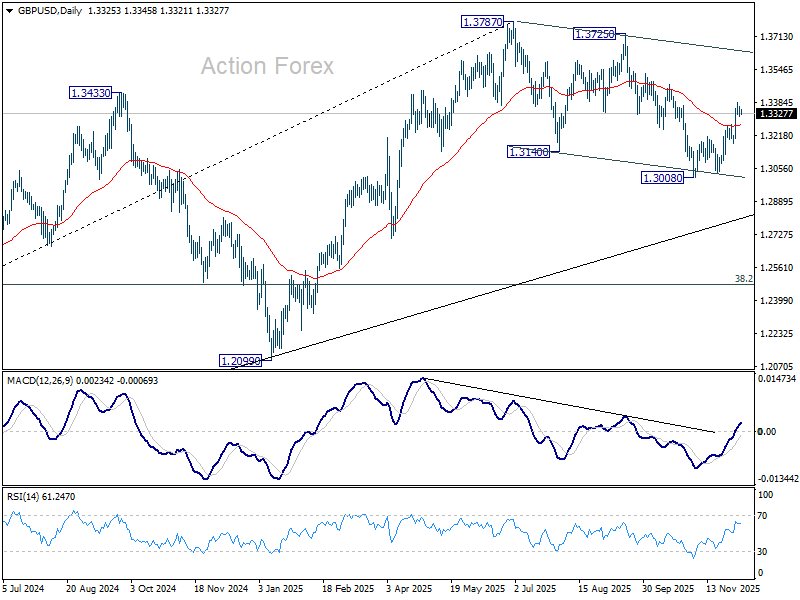
In the bigger picture, current development suggests that fall from 1.3787 is merely a corrective move, and larger rise from 1.0351 (2022 low) is still in progress. Firm break of 1.3787 will target 1.4248 (2021 high) key structural resistance. This will remain the favored case as long as target 38.2% retracement of 1.0351 to 1.3787 at 1.2474 holds, in case of another fall.
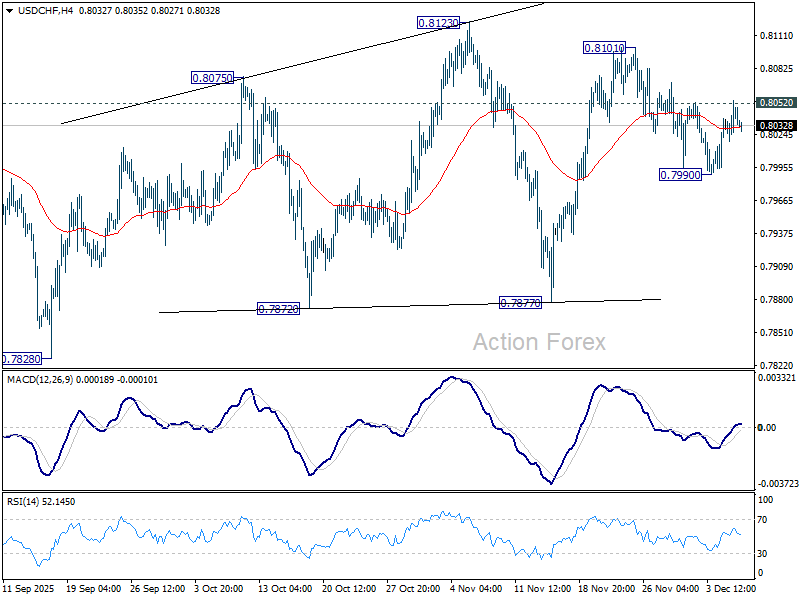
USD/CHF Daily Outlook
Daily Pivots: (S1) 0.8014; (P) 0.8034; (R1) 0.8067; More…
Intraday bias in USD/CHF remains neutral for the moment. Overall outlook is unchanged that price actions from 0.7828 are developing into a corrective pattern. On the upside, break of 0.8052 will bring stronger rise to 0.8101, and then 0.8123 resistance. On the downside, though, break of 0.7990 will extend the fall from 0.8101 towards 0.7877 support instead.
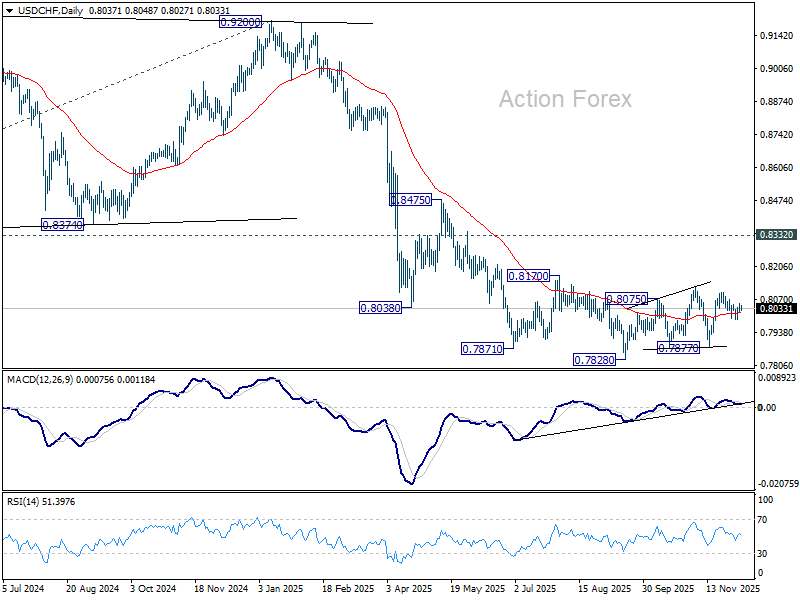
In the bigger picture, long term down trend from 1.0342 (2017 high) is still in progress. Next target is 100% projection of 1.0146 (2022 high) to 0.8332 from 0.9200 at 0.7382. In any case, outlook will stay bearish as long as 0.8332 support turned resistance holds (2023 low).
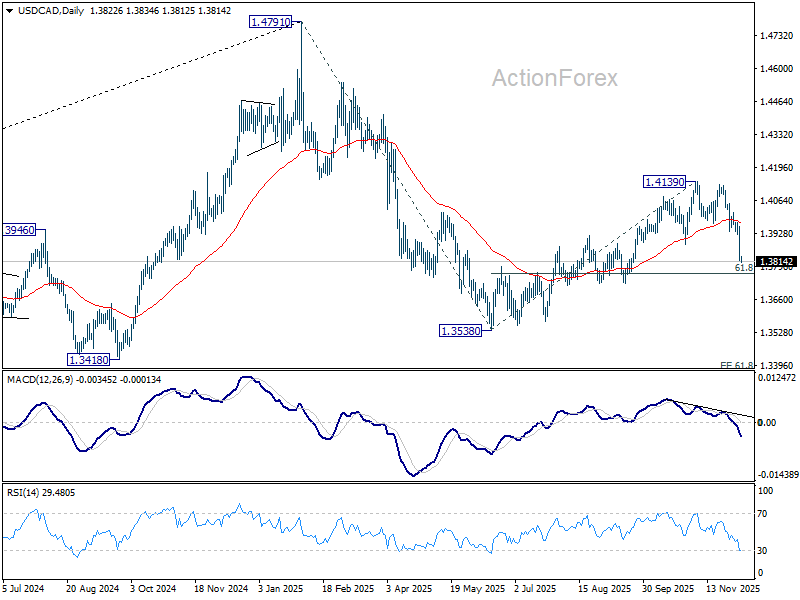
USD/CAD Daily Outlook
Daily Pivots: (S1) 1.3770; (P) 1.3866; (R1) 1.3914; More...
Intraday bias in USD/CAD remains on the downside as fall from 1.4139 is in progress for 61.8% retracement of 1.3538 to 1.4139 at 1.3768. Firm break there will argue that whole decline form 1.4791 might be ready to resume through 1.3538 low. For now, risk will stay on the downside as long as 1.3936 support turned resistance holds, in case of recovery.
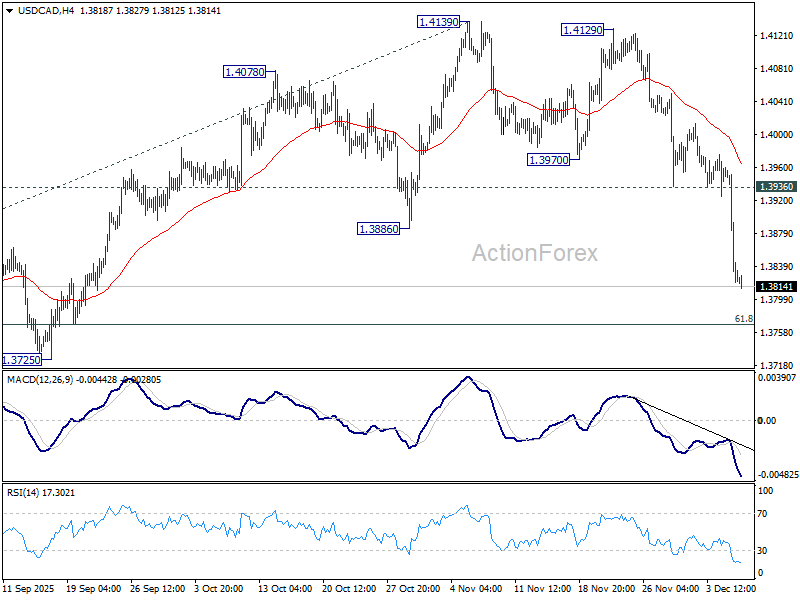
In the bigger picture, current development suggests that price actions from 1.4791 is developing into a deeper, larger scale correction. In the less bearish case, it's just correcting the rise from 1.2005 (2021 low). But even so, break of 1.3538 will pave the way to 61.8% projection of 1.4791 to 1.3538 from 1.4139 at 1.3365. This will remain the favored case as long as 1.4139 resistance holds, in case of rebound.
Gold Price Retreats Modestly, Oil Price Gains Traction
Gold price rallied above $4,250 before correcting lower. Crude oil price is recovering and it could climb further higher toward $62.00.
Important Takeaways for Gold and Oil Prices Analysis Today
- Gold price gained pace for a move above $4,250 and recently corrected lower against the US Dollar.
- A key bullish trend line is forming with support at $4,195 on the hourly chart of gold at FXOpen.
- Crude oil prices are moving higher above the $59.00 resistance zone.
- There is a connecting bullish trend line forming with support at $59.40 on the hourly chart of XTI/USD at FXOpen.
Gold Price Technical Analysis
On the hourly chart of Gold at FXOpen, the price was able to climb above $4,120, as mentioned in the previous analysis. The price even surpassed $4,250 before the bears appeared.
The price traded close to $4,260 before there was a downside correction. There was a move below $4,240 and $4,220. The price settled below the 50-hour simple moving average, and RSI dipped below 50. There was a move below the 50% Fib retracement level of the upward move from the $4,175 swing low to the $4,260 high.
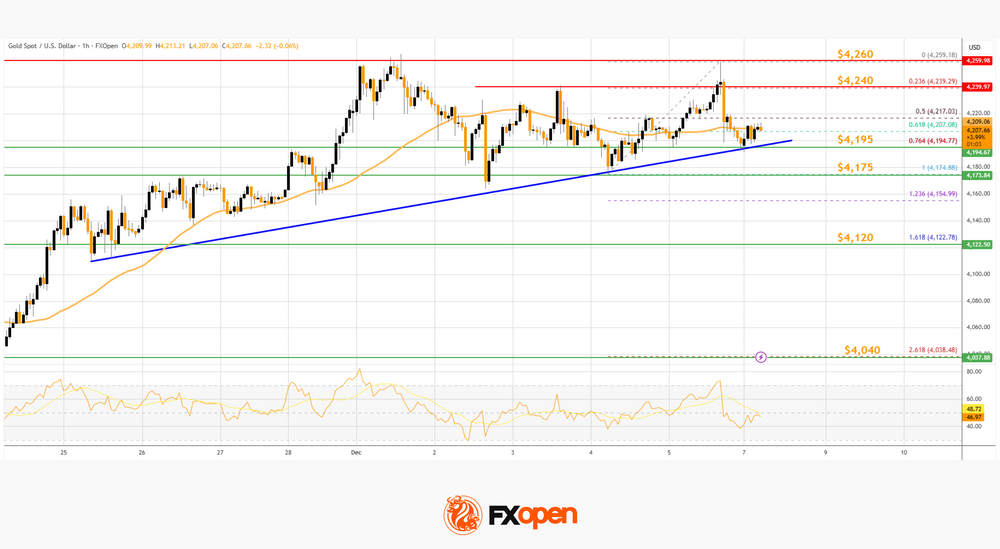
However, the bulls are active above $4,200. There is also a key bullish trend line forming with support at $4,195 and the 76.4% Fib retracement.
Immediate resistance on the upside is $4,240. The next major resistance is $4,260. An upside break above $4,260 could send Gold price toward $4,275. Any more gains may perhaps set the pace for an increase toward $4,290.
If there is no fresh increase, the price could continue to move down. Initial support on the downside is near $4,195 and the trend line. The first key breakdown zone could be $4,175. If there is a downside break below $4,175, the price might decline further. In the stated case, the price might drop to $4,120.
Oil Price Technical Analysis
On the hourly chart of WTI Crude Oil at FXOpen, the price started a decent increase against the US Dollar. The price gained bullish momentum after it settled above $58.20.
The bulls pushed the price above the 50-hour simple moving average, and the RSI climbed toward 70. The price tested the $60.20 zone and is currently consolidating gains. There was a minor pullback below $60.00, and the price tested the 23.6% Fib retracement level of the upward move from the $58.20 swing low to the $60.20 low.
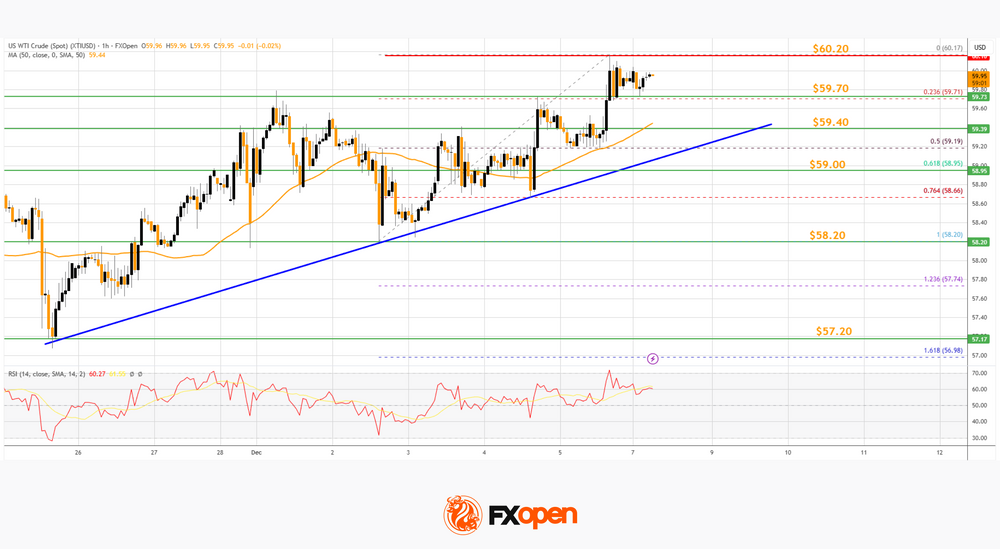
Immediate resistance is near $60.20. If the price climbs further higher, it could face bears near $60.50. The next key area of interest might be $61.20. Any more gains might send the price toward $62.00.
Conversely, the price might correct gains and test $59.40. There is also a connecting bullish trend line forming with support at $59.40 and the 50-hour simple moving average.
The main bid area on the WTI crude oil chart could be $59.00 and the 61.8% Fib retracement. If there is a downside break, the price might decline toward $58.20. Any more losses may perhaps open the doors for a move to $57.20.
Start trading commodity CFDs with tight spreads. Open your trading account now or learn more about trading commodity CFDs with FXOpen.
This article represents the opinion of the Companies operating under the FXOpen brand only. It is not to be construed as an offer, solicitation, or recommendation with respect to products and services provided by the Companies operating under the FXOpen brand, nor is it to be considered financial advice.
The Cut is Certain – The Outlook isn’t
Last week was full of uncertainties and mixed signals, but US indices ultimately ended in the green after the PCE report — the Fed’s preferred inflation gauge — confirmed that inflation remains elevated, near 3%, well above the 2% target, but broadly stable. Core PCE even eased slightly to 2.8% from 2.9%. More importantly for sentiment, both the 1-year and 5-year Michigan inflation expectations fell. December’s survey showed a modest improvement in consumer sentiment — likely helped by the holiday season — but current conditions deteriorated. The softening in recent economic data explains why inflation expectations are easing: the weaker the labour market, the more cautious households become, and the slower price pressures build. That’s not good news for Main Street — but it is good news for Wall Street, where investors are eager for rate cuts as long as corporate earnings hold up.
The good news for them is that a 25bp Fed cut on Wednesday is essentially locked in. The recent weakness in employment data and a stable, up-to-date PCE print support that decision.
But what happens next is the part no one agrees on. The FOMC is divided. Some members worry that tariff-driven inflation could offset disinflationary forces and argue for caution — versus those pushing for quicker cuts, in line with political pressures and public preference. The base case is that politics will dominate and that rates will continue to move lower as the committee rotates toward members more aligned with the incoming administration’s views, starting with a new Federal Reserve (Fed) Chair.
But here is the risk: if the Fed delivers politically driven cuts without economic justification, markets could push back and long-term yields could rise.
Elsewhere, the Reserve Bank of Australia (RBA), the Bank of Canada (BoC) and the Swiss National Bank (SNB) are all expected to keep rates unchanged. In Japan, today’s weak GDP print raised some doubts among Bank of Japan (BoJ) hawks, but 10-year yield continues to climb — now around 1.96% — as wage growth accelerates and keeps inflation concerns alive. The BoJ still looks likely to hike next week.
Meanwhile, tensions between China and Japan are rising, boosting Japanese defence stocks, with Mitsubishi and Kawasaki Heavy Industries each up between 2-3% this morning. Chinese equities, by contrast, are gaining on strong trade data showing a robust jump in exports last month as firms rushed to move inventory ahead of the latest tariff truce with the US.
Oil is also firmer: WTI broke above its 50-day moving average last Friday and closed the week above it, suggesting that further upside is possible, supported by a softer US dollar — which, in theory, should help EM demand — and ongoing AI-related energy needs.
AI earnings: two major AI-linked names report earnings this week. Let’s start with the simpler one: Broadcom, reporting Thursday. Expectations are constructive. Broadcom continues to benefit from Google’s accelerating deployment of TPUs — for internal use and for Google Cloud customers. Broadcom is one of Google’s key partners in producing these chips, handling physical design and components for the latest TPU generations. Rising TPU demand therefore translates into meaningful revenue for Broadcom. The company also recently expanded its client base, including chip supply for Meta. Altogether, the stock remains — for now — relatively resilient to the broader AI-sector volatility.
Oracle, however, is more complicated. The company is now treated as a bellwether of AI-related balance-sheet RISK: it has taken on significant debt to fund its AI and cloud expansion, and carries a lower credit rating than its Big Tech peers. Its 5-year CDS widened sharply last week to a 16-month high.
Analysts expect Oracle to report roughly $16.2bn in revenue and $1.63 EPS. Those figures look solid at first glance but current estimates imply about 9–10% revenue growth and 11–12% EPS growth versus last year. That signals that Wall Street is no longer expecting blowout numbers, but rather a steadier, more incremental climb as Oracle converts its large AI-cloud backlog into realised revenue. Expectations are low — the good news. The bad news is that investors will scrutinise margins and capital efficiency.
Oracle’s massive cloud and AI build-out has required equally massive spending. Capex has surged as the company races to expand data-centre capacity, putting pressure on margins just as scrutiny intensifies. At the same time, Oracle’s elevated debt load remains one of the largest in Big Tech, and the recent CDS widening shows that credit markets are increasingly sensitive to how much leverage is being used to finance its AI push.
The concern is straightforward: if cloud-backlog conversion slows or margins disappoint, heavy spending combined with high debt could squeeze cash flow at the wrong time. The bull case requires very strong execution — because the balance sheet leaves relatively little room for error.
Central Bank Meetings Under the Christmas Tree This Week
In focus today
In the euro area, focus turns to the Sentix investor confidence indicator for December and the German industrial production data for October. The Sentix indicator will give us the first signal of investor confidence in December while German industrial production is the first 'hard data' for Q4. The German PMIs suggest that industrial production in October was little changed compared to September.
Early tomorrow morning, the Reserve Bank of Australia RBA will hold its final monetary policy meeting of the year. We expect no policy changes, in line with consensus and market pricing. Recent solid economic data has driven a hawkish repricing of markets' policy rate expectations, with the next most likely policy change being a rate hike in H2 2026.
The big event this week is the FOMC meeting on Wednesday, preceded by the much-delayed September JOLTS job openings data on Tuesday. Rate decisions from Canada (Wednesday) as well as Switzerland and Turkey (Thursday) will also draw attention. In Scandinavia, notable data releases include final Swedish CPI and growth figures, Norwegian CPI, and Norges Bank's regional network report.
Economic and market news
What happened overnight
In China, November trade data showed exports rising by 5.9% y/y (prior: -1.1%), exceeding expectations due to strong growth in shipments to non-US markets amid elevated US tariffs. Imports rose 1.9% y/y (prior: 1.0%), below forecasts and signalling subdued domestic demand. This marks the first time China's year-to-date trade surplus in goods exceeded USD 1tn. Read more in Research China - A two-speed economy, 8 December.
In Japan, total cash earnings were up 2.6% y/y in October compared to 2.1% in September. This leaves real earnings at -0.7% y/y as wages continue to struggle to compensate for particularly food price surges earlier this year. Q3 GDP growth was revised lower to -0.6% on lower investments and exports. This is considered a temporary setback following several strong quarters, though, and it is not enough to derail a December Bank of Japan-hike. Private spending edged 0.2% higher, reflecting continuous recovering consumer sentiment since the spring.
In Southeast Asia, Thailand launched air strikes on Cambodia, marking the collapse of the Trump-brokered peace deal. Cambodia accused Thailand of the attacks, while Malaysia called for restraint as tensions over historic border disputes escalate.
What happened over the weekend
In the euro area, wage growth in Q3 rose against expectations, with compensation per employee rising to 4.0% y/y from 3.8% y/y in Q2. Compared to the ECB staff projections from September, which estimated Q3 wage growth at 3.2% y/y, the high print is a hawkish surprise for the ECB. With headline inflation averaging 2.1%, consumers experienced significant real wage gains, which is supportive for consumption. While inflation is expected below 2% next year due to temporary factors like energy prices and a stronger euro, strong wage growth indicates persistent domestic price pressures.
GDP growth in Q3 was revised up to 0.3% q/q from 0.2% q/q, driven by rounding adjustments. Private consumption contributed positively but slowed to 0.2% q/q from 0.3% q/q in Q2, reflecting cautious consumer behaviour despite solid real income gains of nearly 2% y/y. Apart from consumption, investments and government consumption were the main growth drivers, while net exports weighed negatively. Read more in Euro Area Macro Monitor - Southern Europe outshines in growth and public finances, 8 December.
In the US, the delayed September PCE inflation landed close to expectations. Core services inflation momentum cooled slightly at 0.2% m/m SA (cons: 0.2%, prior: 0.1981). At the same time, December's flash consumer confidence index from the University of Michigan revealed a decline in consumers' inflation expectations, with 1-year expectations falling to 4.1% (prior: 4.5%) and 5-year expectations dropping to 3.2% (prior: 3.4%), likely reflecting lower gasoline prices. While no major surprises, this on the margin supports the Fed's rate cut anticipated this week.
Also in the US, President Trump unveiled his National Security Strategy, emphasising his 'America First' vision. Key priorities include reinforcing US dominance in the Western Hemisphere via the revived Monroe Doctrine, countering China's influence in Latin America, and deterring conflict in the Indo-Pacific through military strength. The strategy also questions Europe's reliability as an ally, calling on NATO members to assume greater defence responsibilities. Notably, the Kremlin welcomed the strategy, stating its adjustments align with Russia's own global perspective.
In the Russia-Ukraine war, US Special Envoy Keith Kellogg stated that efforts to reach a breakthrough are "really close", with key issues including the Donbas region and Zaporizhzhia nuclear plant. However, the Kremlin has called for radical changes to US proposals, underscoring ongoing challenges in reaching a resolution. Today, Zelensky meets European leaders to discuss next steps, including securing meaningful guarantees.
In Japan-China relations, tensions escalated as Japanese aircraft were targeted by radar from Chinese fighter jets near Okinawa in two incidents Tokyo called "dangerous". PM Takaichi condemned the actions and lodged a protest with Beijing, while Japan vowed to respond calmly to maintain regional stability. The incidents highlight strained ties amid disputes over Taiwan and broader regional security challenges.
Equities: Equities slowed on Friday following strong gains earlier in the week. US and European indices were little changed on Friday but ended the week almost 1% higher. Nordic markets outperformed, with Stockholm and Helsinki locking in almost 2% for the week. The explanation is straightforward: Nordic equities lagged in the initial recovery. Asian markets are continuing higher this morning, while US and European futures are somewhat indecisive.
Although markets appeared calm on the surface on Friday, we note a clear risk-on rotation beneath it, with cyclical sectors rising roughly 1%, financed by declines in defensives. For the week as a whole, global cyclicals outperformed defensives by 2.5 p.p., the strongest relative performance since the earnings season.
FI and FX: Last week ended with slightly higher yields, both in Europe (2bp) and the US (4bp). We start the week at unchanged levels compared to Friday in US-treasuries. EURUSD is hovering around 1.165 and USDJPY at 155.2 as markets will increasingly focus on the widely expected Fed rate cut on Wednesday where markets price -23bp.