Sample Category Title
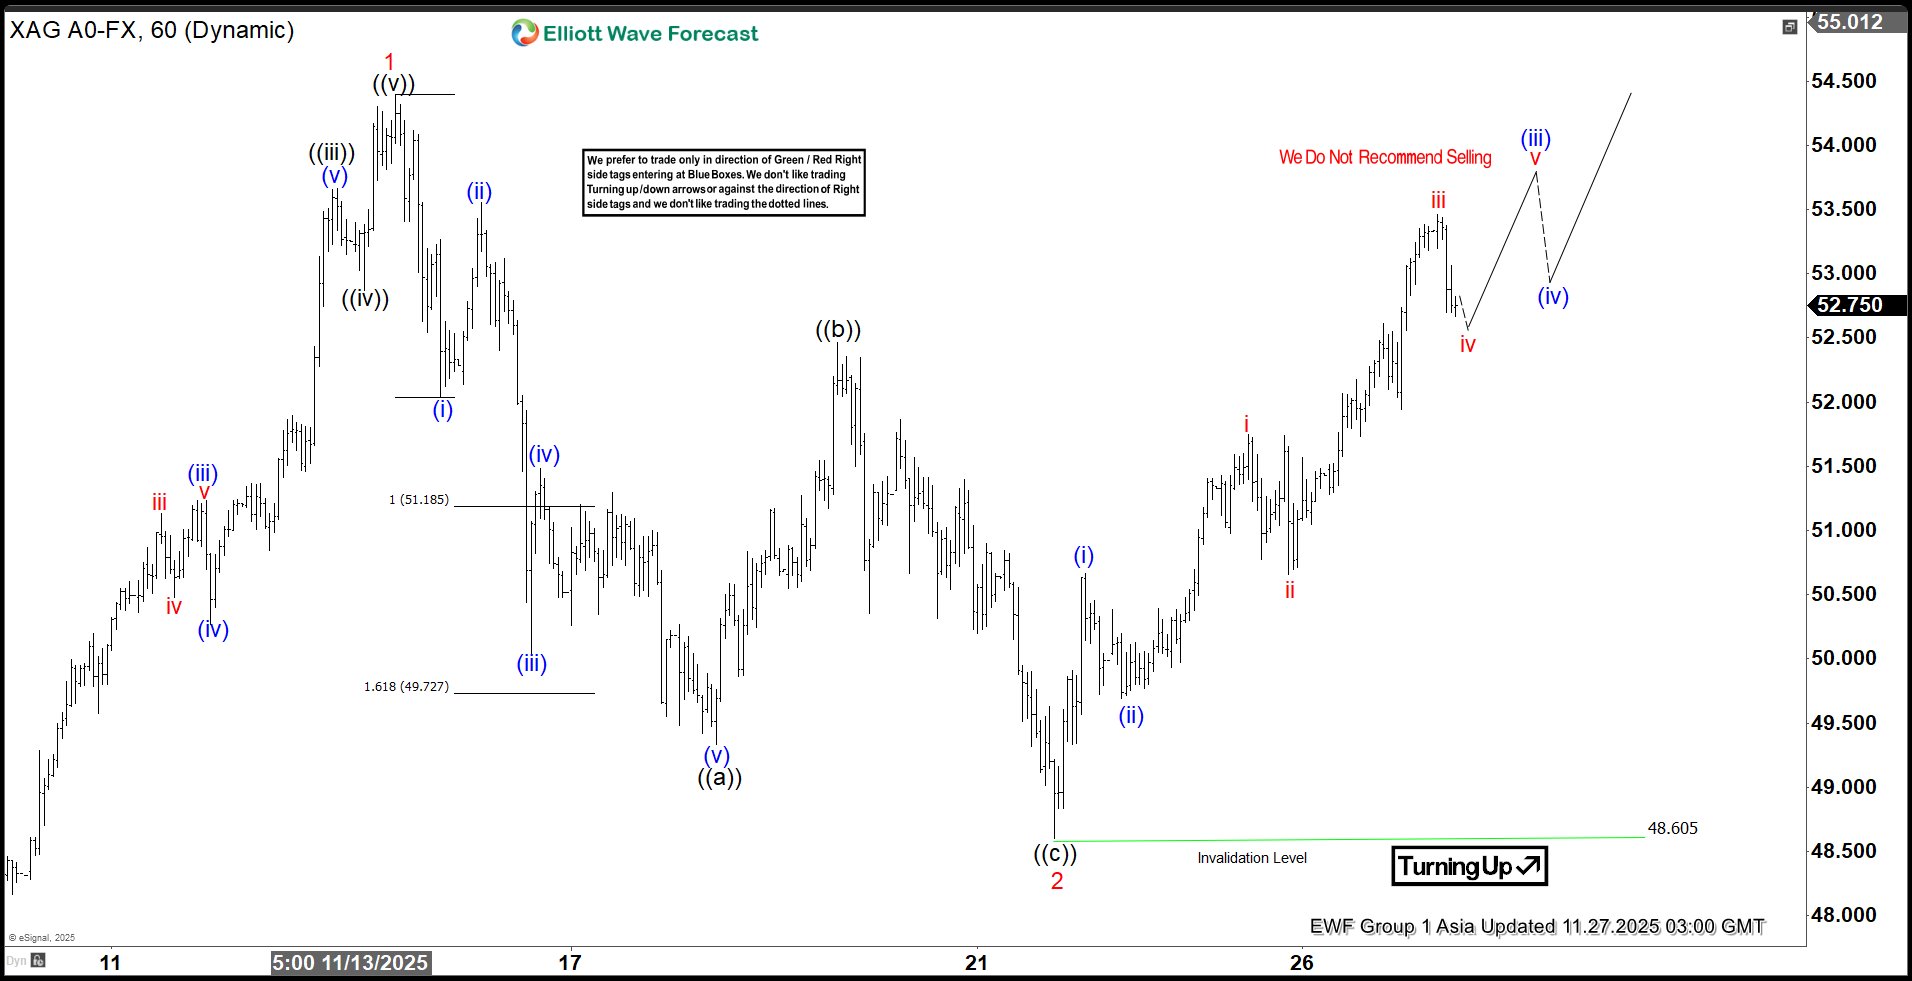
Spot Silver XAGUSD Aiming for All Time High, Targeting $57.4
Spot Silver (XAGUSD) continues to display a constructive technical outlook, suggesting that the metal is preparing to challenge new all‑time highs. The short‑term structure from the 28 October low has unfolded as a five‑wave impulse, reinforcing the bullish trajectory. Wave 1 of this sequence concluded at $54.39, as indicated on the one‑hour chart. Following this peak, the market experienced a corrective pullback in wave 2, which developed into a classic zigzag Elliott Wave formation. Within this correction, wave ((a)) terminated at $49.33. Wave ((b)) rallied to $52.46, and wave ((c)) declined to $48.6 low. Thereby completing wave 2 at a higher degree.
From that low, silver has resumed its upward momentum in wave 3. However, a decisive break above the prior wave 1 high at $54.39 remains necessary to eliminate the possibility of a double correction. Progressing from wave 2, wave (i) ended at $50.66, while the subsequent pullback in wave (ii) found support at $49.69. The current expectation is for the metal to extend higher in wave (iii). After which a modest retracement in wave (iv) should occur before another advance resumes. In the near term, as long as the pivot at $48.6 holds firm, dips are anticipated to attract buyers. Support is likely to emerge in the form of three, seven, or eleven swings, providing the foundation for continued upside potential. This structure underscores the resilience of silver’s bullish cycle and highlights the importance of maintaining key pivots to sustain momentum.
XAGUSD 1-Hour Elliott Wave Chart From 11.27.2025
XAGUSD Elliott Wave Video:
https://www.youtube.com/watch?v=ofTRLD35bUI
Happy Thanksgiving
The calm has returned to the markets before US traders left their desks for the turkey dinner. The US indices added to their gains for the fourth session, as US yields kept falling. The 2-year yield, for example — the part of the curve that captures the December Federal Reserve (Fed) expectations — fell straight to 3.45%. From today’s standpoint, an additional 25bp cut in December is largely priced in, with more than 80% probability attached to it.
Cherry on top: the news that Kevin Hassett could be the next Fed Chair further revived expectations that the Fed may adopt a lower-rate policy moving forward— in line with the White House’s wishes. Hassett is also pro-deregulation and friendly toward crypto, everything the risk markets adore! And with Powell’s term ending in May 2026 — and rumours of a nomination before the end of the year — markets are already picturing a Fed that’s softer on rates, lighter on rules and a bit more welcoming to the digital-asset world. The expectation is that there would be 2–4 more rate cuts in 2026, on top of the one anticipated to land in December.
What could go wrong? When the Fed cuts rates — or even before it does — markets react by pulling yields lower. Lower yields reduce borrowing costs. Cheaper borrowing helps companies finance their projects, boosting growth. And lower yields also lift valuations because the rate at which you discount future revenues falls, making those future revenues worth more today. The lower the yields, the higher the growth expectations and the higher the valuations. This is why Trump wants the Fed to lower yields so badly.
But this transmission mechanism — Fed cuts – lower market yields – easier financing — is not guaranteed. That’s the catch. If the market decides that cutting rates is not the right call — that it could revive inflation and require future hikes — yields can rise even after the Fed cuts. This is exactly what happened in September 2024. Remember: within hours, the Fed expectations suddenly swung toward a 50bp cut... and yields spiked after that decision. The Fed then had to pause cuts for a full year.
So whether the Fed cuts rates in December is only half the question. The other half is whether it’s the right thing to do. And we won’t know, because we don’t have the inflation data — and that data is expected to arrive the week after the Fed decision. So even if the Fed cuts, if inflation surprises to the upside the following week, yields could jump higher and the expectation of those extra 2–4 cuts could evaporate — weighing on risk appetite. Conclusion: Fed expectations should be taken with a pinch of salt.
Good news: if you celebrate Thanksgiving, your turkey dinner will cost around 5% less this year compared to last. Turkey prices are down roughly 16%, enough to offset the increase in vegetables and general groceries.
Anyway, market mood is fine but the risk of a potential policy mistake should remain at the back of your mind as we walk into the Fed decision next month. The US dollar softened below the 200-DMA on the back of easing Fed bets. But the dovish expectations may have run slightly ahead of themselves, and the dollar index could find support near the 98.85/99 range — the major 38.2% Fibonacci retracement and the 50-DMA — before attempting to recover some of this year’s heavy losses. In the medium run, the US dollar outlook remains negative.
Back to the short run: the recent weakness of the dollar was helped by recoveries in the yen and sterling. But for both currencies, gains remain fragile. In Japan, Takaichi’s spending and borrowing plans leave the yen with no other reasonable or natural path than south. And for sterling, the post-Budget rebound will likely be challenged by softer Bank of England (BoE) expectations.
So, diving into the UK economics: yesterday’s Budget announcement went much better than many — including myself — expected. Everyone was braced for drama, volatility and even a few tears to spice it up. But none of it materialised. Apart from the OBR accidentally releasing its forecast an hour early, the measures were largely in line with market expectations and were warmly welcomed by gilt markets.
We heard plenty of tax rises — about £26bn, though most only kick in around the election year. Reeves opted for a softer stance on benefits, but financed by more people paying taxes. She announced a decent fiscal headroom: investors were seduced.
But a bleak setup for productivity and growth means that the UK will increasingly rely on financial markets to finance government operations. And that means investors — not voters — end up determining how much the government can spend and how much pain people in the streets must endure. The only way to break this cycle is to grow as much as you spend. I’d say there’s a better chance of unicorns invading the skyline.
The good news: gilt yields have fallen sharply after what was meant to be the most feared Budget in years, and cable is extending gains above 1.32. But again, the BoE now has the green light to cut rates in December. That will cap sterling’s upside — though only as much as the USD and the Fed bets allow.
Taking Temperature on Euro Area Credit Growth
In focus today
In the euro area, focus turns to data on credit growth for October. Loan growth to non-financial corporations increased to 2.1% y/y in September but the momentum has lowered recently in a signal of a smaller boost to economic activity.
In Denmark, retail sales for October are released. Our Spending Monitor showed a 0.6% m/m decline in real retail spending in October. We expect the figures from Statistics Denmark to reflect the same trend in October.
In Sweden we have the NIER release, where confidence indicators and price plans will be important for evaluating the economic recovery in Sweden. We anticipate a gradual improvement in today's data. Aside from the growth indicators, we will also pay attention to firms' pricing and employment plans.
Half an hour later, the Swedish National Debt Office will present an updated forecast and borrowing plan, where we expect an upward revision of the borrowing requirement by SEK 70-80bn for next year.
Overnight, a big batch of Japanese data is released. We highlight the November Tokyo inflation and October retail sales. Price pressures have increased again recently as inflation hovers around 3%, although for the wrong reasons. High food prices and a weak yen is driving inflation instead of consumer demand.
Economic and market news
What happened overnight
In China, industrial profit growth for October dipped into the red with a reading of -5.5% y/y. The reading followed strong gains in the late summer with +21.6% y/y in September. The decline was due to low domestic demand and exports, which were hit by US tariff threats.
What happened yesterday
In the UK, the Autumn Budget was announced. In a surprise turn of events, the Office for Budget Responsibility (OBR) report was leaked before Chancellor Reeves could present the budget. The budget raised tax rates to post war highs, with the Chancellor asking "ordinary people to pay a little bit more". A GBP22bn fiscal headroom provides a bigger buffer against future excess debt issuance than consensus expectations for GBP15bn and the budget delivered less near-term fiscal tightening than expected. The GBP strengthened on the release. The absence of VAT hikes paves the way for more near-term easing from the BoE, and markets are now pricing above 90% chance of an interest rate cut at the BoE December meeting.
In Norway, mainland GDP up 0.1% q/q in Q3 (cons: 0.2%). The details were mixed after the strong pick-up in H1, with continued solid growth in private consumption and mainland exports. Meanwhile, residential investments were flat, mainland investments were down, oil-investments and public demand were also down. Hence, growth is somewhat lower than Norges Bank's estimate from the September MPR of 0.4%, which in isolation should contribute to a downward adjustment of the rate path at the December meeting. The figures are far from weak enough to trigger a December cut but could open the door for a cut in March.
Equities: Equities rose for a fourth consecutive session on Wednesday. The S&P 500 gained 0.7% and Stoxx 600 advanced 1.1%. This was not a classic "risk-on" session, as gains were evenly distributed across both cyclical and defensive sectors. Instead, it appeared as a broad catch-up session, with most sectors moving higher and an unusual mix of materials, utilities, and technology leading the advance. Within tech, the "Google competition" trade reversed, with recent AI laggards (Nvidia, Oracle) outperforming recent winners (Alphabet).
Implied market volatility has already concluded that the selloff is over, with the VIX sliding again yesterday, approaching its 10-year median. Equity market has a little more to go with S&P 500 roughly 1% below the peak, Nordic markets 2% below while Europe is only decimals away from October highs.
FI and FX: The USD weakened modestly overnight vs rest of G10 with EUR/USD at the 1.16 mark and equities continued their advance, seemingly driven by Fed cut expectations. Fed futures continue to price in a c. 80% probability for a December cut. US10y dropped below 4.0% for the first time since late October. MSCI ACWI rose for the fifth straight session. Tech stocks led the rally in the US where SPX rose 0.7% ahead of Thanksgiving. Asia is in green, and futures indicates a positive opening today. EUR/SEK and EUR/NOK remain stable around 11.00 and 11.80, respectively. Today, the SNDO presents an updated forecast and borrowing plan for 2026-2027.
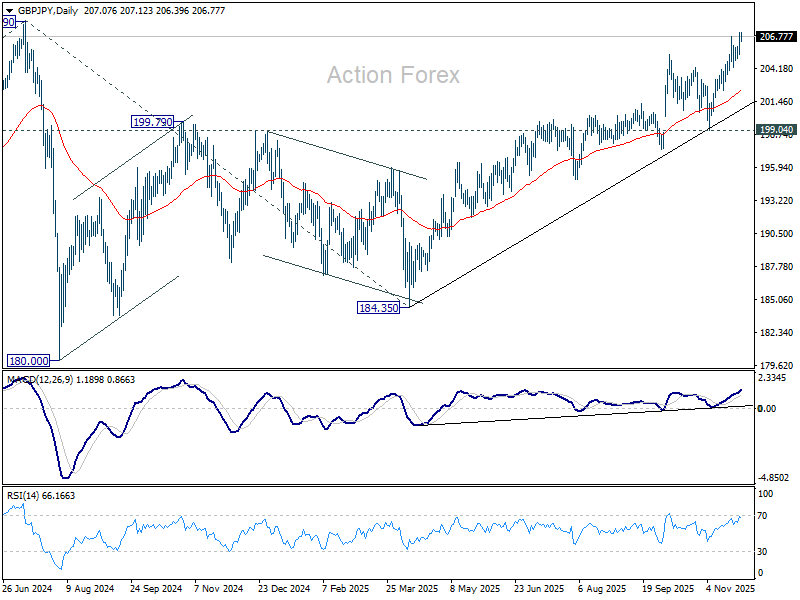
GBP/JPY Daily Outlook
Daily Pivots: (S1) 205.92; (P) 206.56; (R1) 207.85; More...
Intraday bias in GBP/JPY is back on the upside with break of 206.84 temporary top. Current rally from 184.35 should target a retest on 208.09 high. Firm break there will confirm larger up trend resumption. On the downside, below 205.29 minor support will turn bias neutral again.
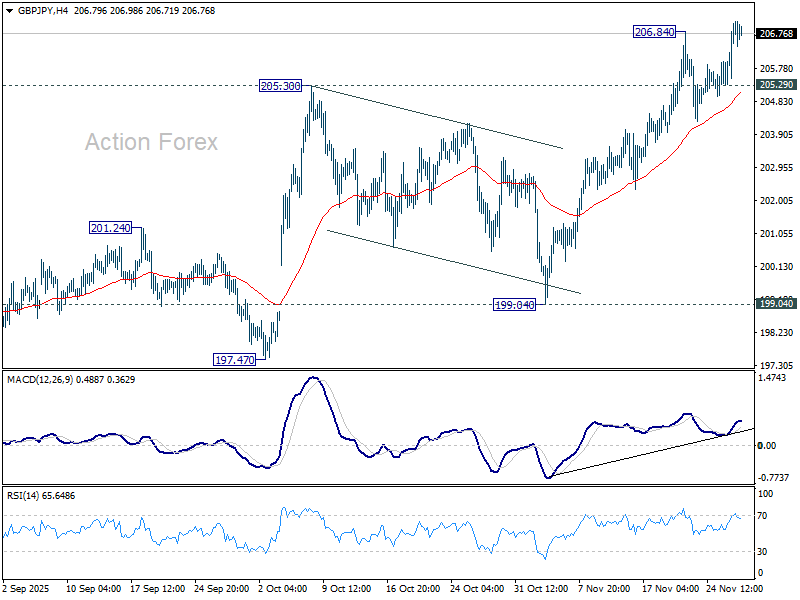
In the bigger picture, price actions from 208.09 (2024 high) are seen as a corrective pattern which might have completed at 184.35. Firm break of 208.09 high will resume the up trend from 123.94 (2020 low). Next target is 61.8% projection of 148.93 to 208.09 from 184.35 at 220.90. However, decisive break of 199.04 support will dampen this view and extend the corrective pattern with another fall.
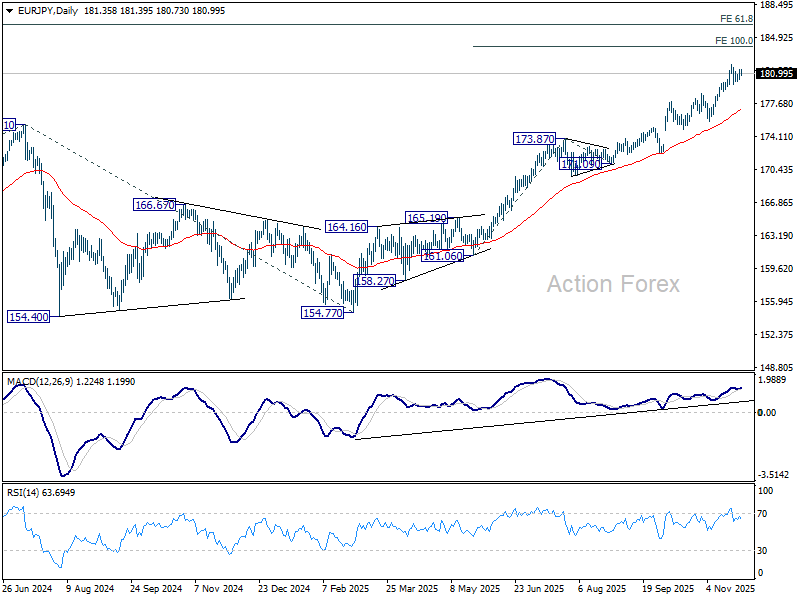
EUR/JPY Daily Outlook
Daily Pivots: (S1) 180.67; (P) 181.07; (R1) 181.84; More...
Intraday bias in EUR/JPY remains neutral and more consolidations could be seen below 181.98. Deeper retreat cannot be ruled out, but downside should be contained by 178.80 resistance turned support to bring another rally. On the upside, break of 181.98 will target 100% projection of 161.06 to 173.87 from 171.09 at 183.90 next. However, firm break of 178.80 will argue that deeper correction is already underway towards 55 D EMA (now at 177.09).
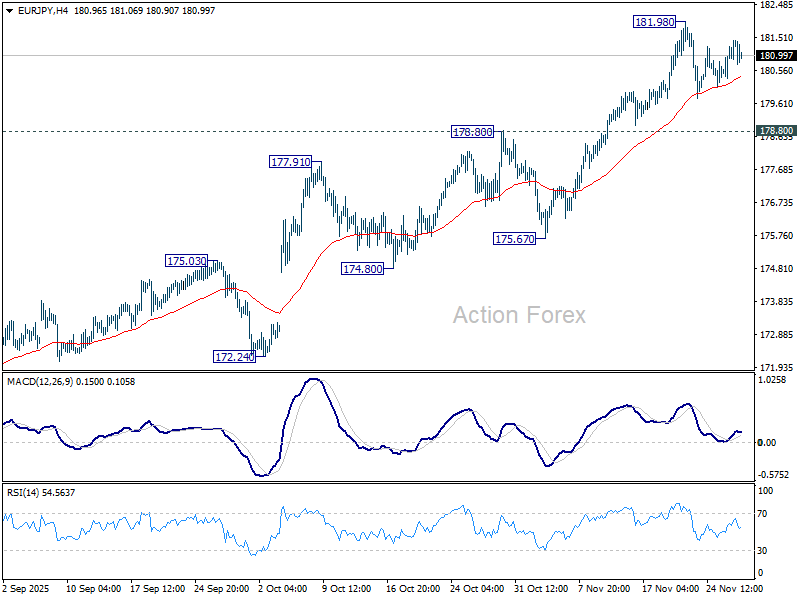
In the bigger picture, up trend from 114.42 (2020 low) is in progress and should target 61.8% projection of 124.37 to 175.41 from 154.77 at 186.31. Outlook will continue to stay bullish as long as 55 W EMA (now at 169.42) holds, even in case of deep pullback.
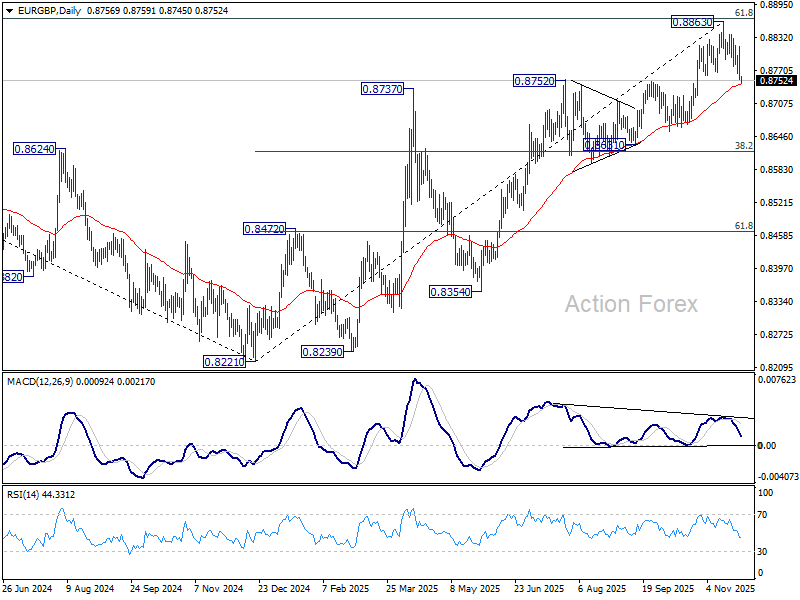
EUR/GBP Daily Outlook
Daily Pivots: (S1) 0.8735; (P) 0.8777; (R1) 0.8798; More…
Intraday bias in EUR/GBP remains on the downside for the moment. Sustained trading below 55 D EMA (now at 0.8743) will be an early sign of bearish trend reversal. Deeper fall should then be seen to 0.8631 cluster (38.2% retracement of 0.8221 to 0.8663 at 0.8618. However, break of 0.8816 minor resistance will bring stronger rebound to retest 0.8863 high instead.
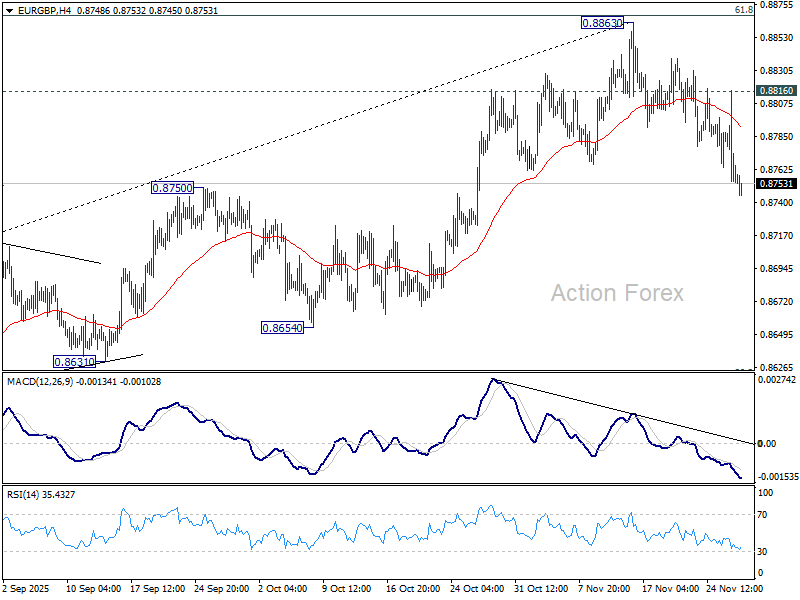
In the bigger picture, rise from 0.8221 medium term bottom is still seen as a corrective move. Upside should be limited by 61.8% retracement of 0.9267 to 0.8221 at 0.8867. Sustained trading below 55 W EMA (now at 0.8588) should confirm that this corrective bounce has completed. However, decisive break of 0.8867 will suggest that EUR/GBP is already reversing whole decline from 0.9267 (2022 high). That should pave the way back to 0.9267.
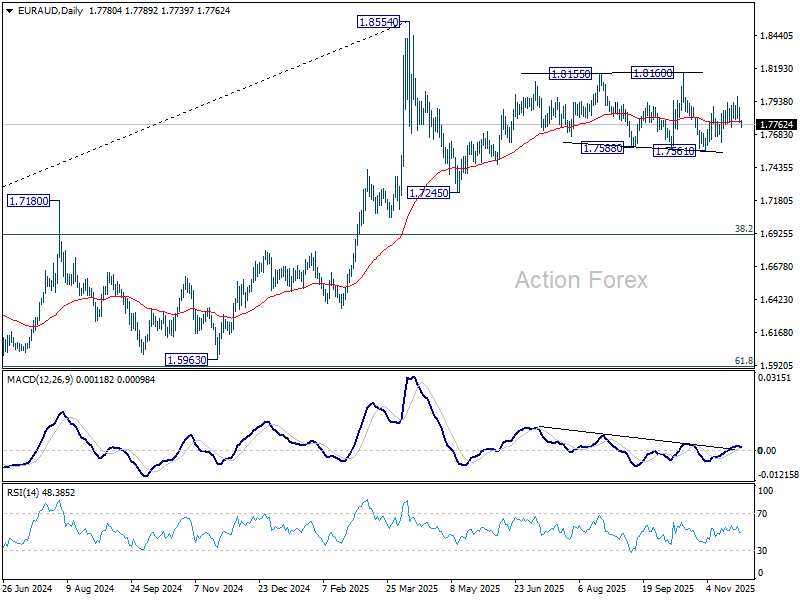
EUR/AUD Daily Outlook
Daily Pivots: (S1) 1.7750; (P) 1.7823; (R1) 1.7864; More...
Intraday bias in EUR/AUD remains neutral for the moment. On the downside, firm break of 1.7739 support will argue that rebound from 1.7561 has completed, and turn bias back to the downside for this support. On the upside, above 0.7976 will resume the rebound towards 0.8160 resistance.
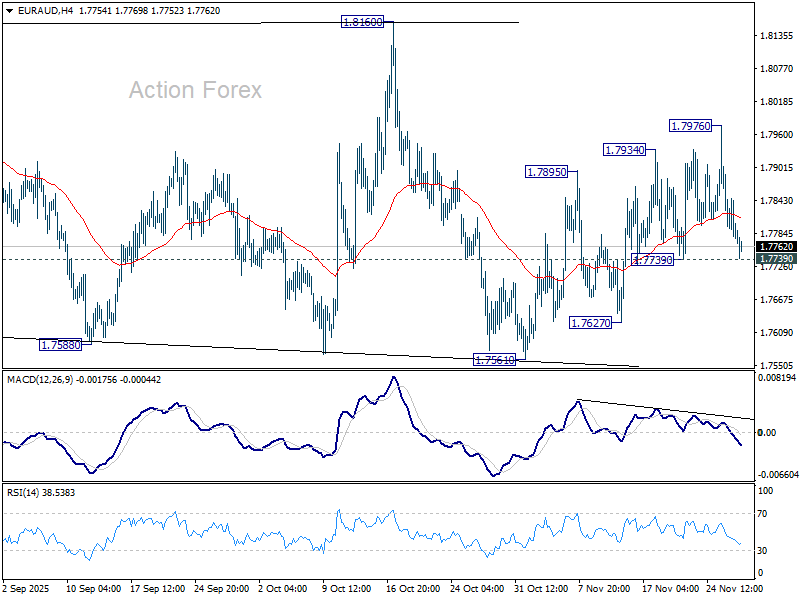
In the bigger picture, price actions from 1.8554 medium term top are seen as a corrective pattern. Sustained break of 55 W EMA (now at 1.7426) will suggest that it's correcting the whole rally from 1.4281 (2022 low). In this case, deeper decline would be seen to 38.2% retracement of 1.4281 to 1.8554 at 1.6922. Nevertheless, strong rebound from 55 W EMA will likely bring resumption of the up trend sooner.
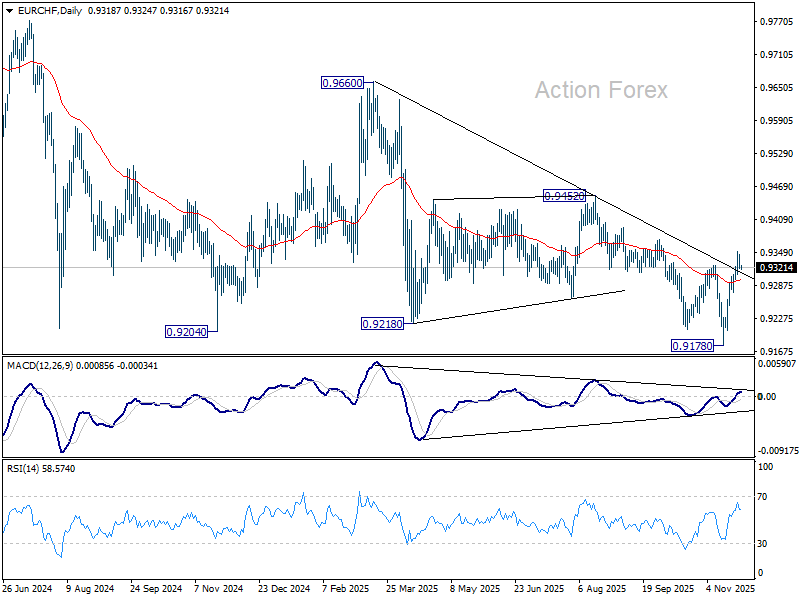
EUR/CHF Daily Outlook
Daily Pivots: (S1) 0.9316; (P) 0.9331; (R1) 0.9342; More....
Intraday bias in EUR/CHF is turned neutral with current retreat, and some consolidations would be seen below 0.9349. Still, fall from 0.9660 could have completed at 0.9178, on bullish convergence condition in D MACD. Above 0.9349 will target 0.9452 resistance next. However, break of 0.9275 will turn bias back to the downside for 0.9178 low instead.
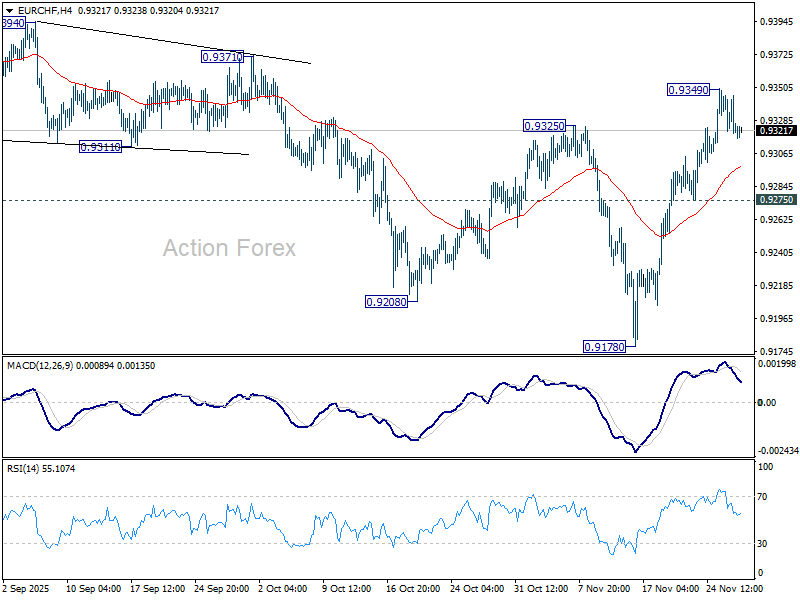
In the bigger picture, outlook remains bearish with EUR/CHF staying well inside long term falling channel after multiple rejection by 55 W EMA (now at 0.9377). Next target is 61.8% projection of 1.1149 to 0.9407 from 0.9928 at 0.8851. Break of 0.9452 resistance is needed to be the first sign of medium term bottoming. Otherwise, outlook will stay bearish in case of strong rebound.
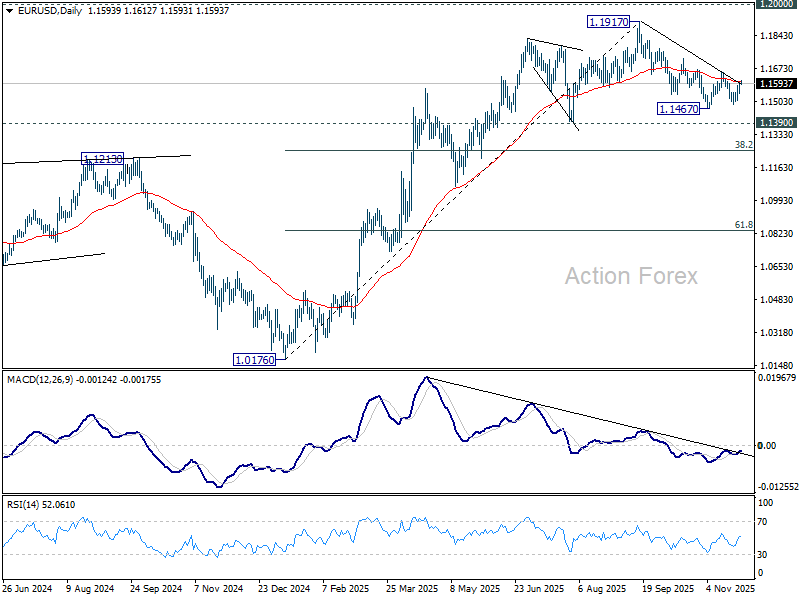
EUR/USD Daily Outlook
Daily Pivots: (S1) 1.1563; (P) 1.1582; (R1) 1.1617; More…
No change in EUR/USD's outlook as sideway trading continues. Intraday bias remains neutral. Further decline is expected with 1.1655 resistance intact. On the downside, below 1.1490 and 1.1467 will resume the whole decline from 1.1917 high. Next targets are 1.1390, and then 38.2% retracement of 1.0176 to 1.1917 at 1.1252.
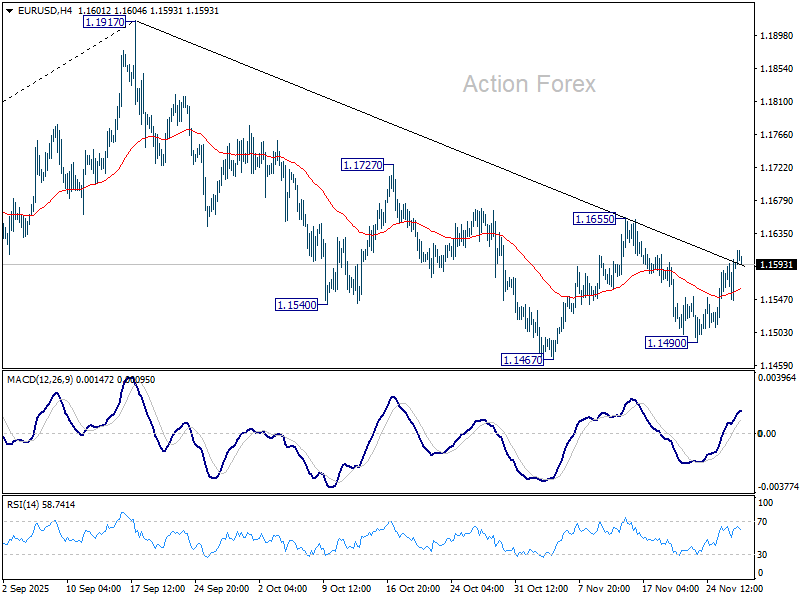
In the bigger picture, considering bearish divergence condition in D MACD, a medium term top is likely in place at 1.1917, just ahead of 1.2 key psychological level. As long as 55 W EMA (now at 1.1328) holds, the up trend from 0.9534 (2022 low) is still in favor to continue. Decisive break of 1.2000 will carry larger bullish implications. However, sustained trading below 55 W EMA will argue that rise from 0.9534 has completed as a three wave corrective bounce, and keep long term outlook bearish.
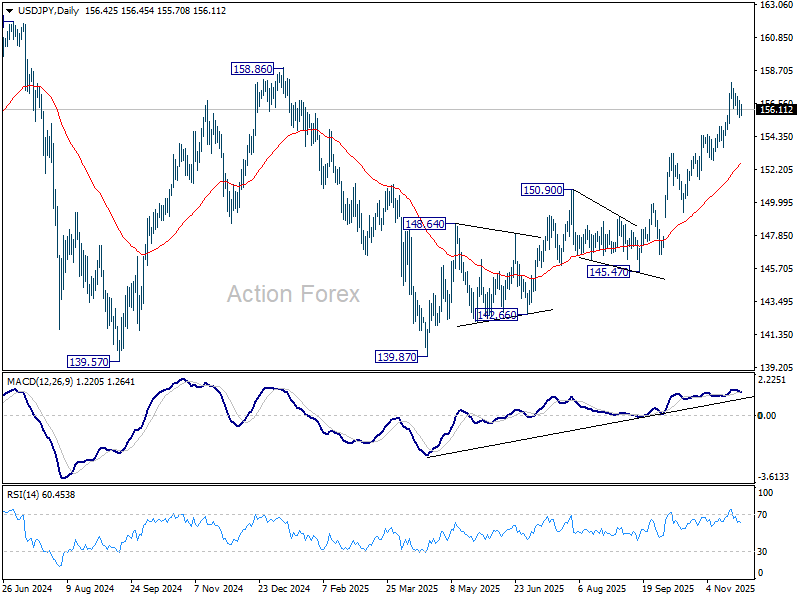
USD/JPY Daily Outlook
Daily Pivots: (S1) 155.82; (P) 156.28; (R1) 156.91; More...
Intraday bias in USD/JPY remains neutral and more consolidations could be seen below 157.88. Downside should be contained by 154.47 resistance turned support. On the upside, break of 157.88 will resume the whole rally from 139.87. Next target is 158.86 structural resistance, and then 161.94 high.
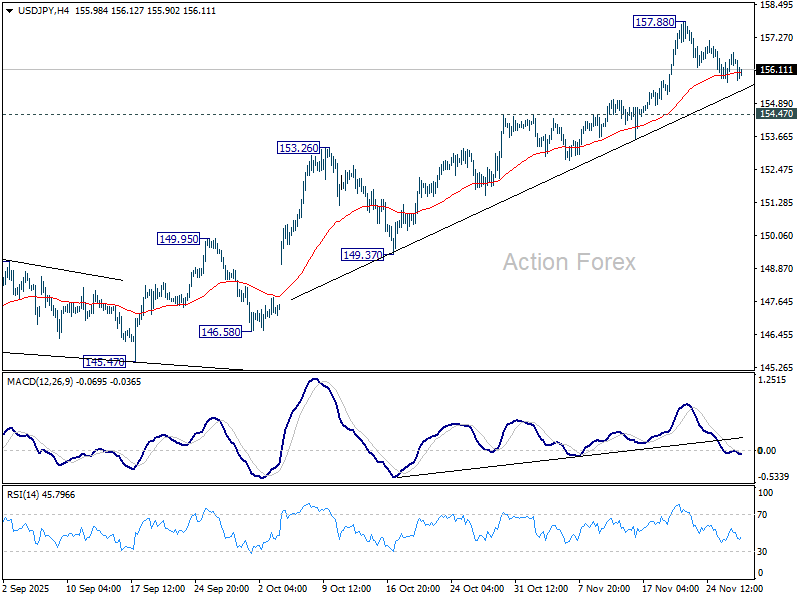
In the bigger picture, current development suggests that corrective pattern from 161.94 (2024 high) has completed with three waves at 139.87. Larger up trend from 102.58 (2021 low) could be ready to resume through 161.94 high. Decisive break of 158.85 structural resistance will solidify this bullish case and target 161.94 for confirmation. On the downside, break of 150.90 resistance turned support will dampen this bullish view and extend the corrective range pattern with another falling leg.