Sample Category Title
ECB’s Lane says more cooling needed in core inflation
ECB chief economist Philip Lane said overnight that while headline inflation has hovered near target for most of the year, the picture is still flattered by energy deflation. Non-energy inflation remains “well above 2%,” and Lane stressed that a further slowdown is required to ensure inflation is sustainably anchored at target. Nevertheless, he added "We're confident that's going to happen because everything we look at tells us wage dynamics are set to decelerate further."
Lane also addressed concerns around U.S. tariffs and Europe’s export exposure. He argued the hit may be smaller than feared, as the AI-driven expansion and high U.S. government spending are supporting American demand. Under these conditions, firms still have room to pass through tariff-related costs to U.S. importers and consumers. While the U.S. is an important partner, Lane underlined that it is “not the predominant driver of the European economy.”
However, he warned that tariffs are reshaping global trade flows in meaningful ways, particularly in Asia. China is exporting more to Southeast Asia, Southeast Asia is exporting more to the U.S., and China is simultaneously increasing its footprint in Europe and other markets. Lane called this a “very big reconfiguration” of the global system, one that intensifies competitive pressure on European firms even at home.
Gold (XAU/USD) Price Up 2.5% for the Week. Is a Break of $4200/oz a Certainty?
Gold prices are currently maintaining a robust uptrend and trading near two-week highs, around the $4150/oz handle. The precious metal is poised to log its fourth consecutive monthly gain, building on a record-setting surge experienced in October that briefly targeted the $4,400 area.
The continuation of the bullish rally could be a sign that the current rally still has deep support. The bullish trend is reinforced by technical indicators that confirm strong underlying momentum, following a selloff that allowed some profit taking.
Foundational Drivers: The Federal Reserve Pivot Proxy
The current rally and supporting Gold’s valuation is the aggressive market expectation of impending monetary policy easing by the US Federal Reserve. Current forecasts indicate an 84% probability of a US interest rate cut in December , with broader market consensus pricing in approximately 90 basis points of easing by the end of 2026.
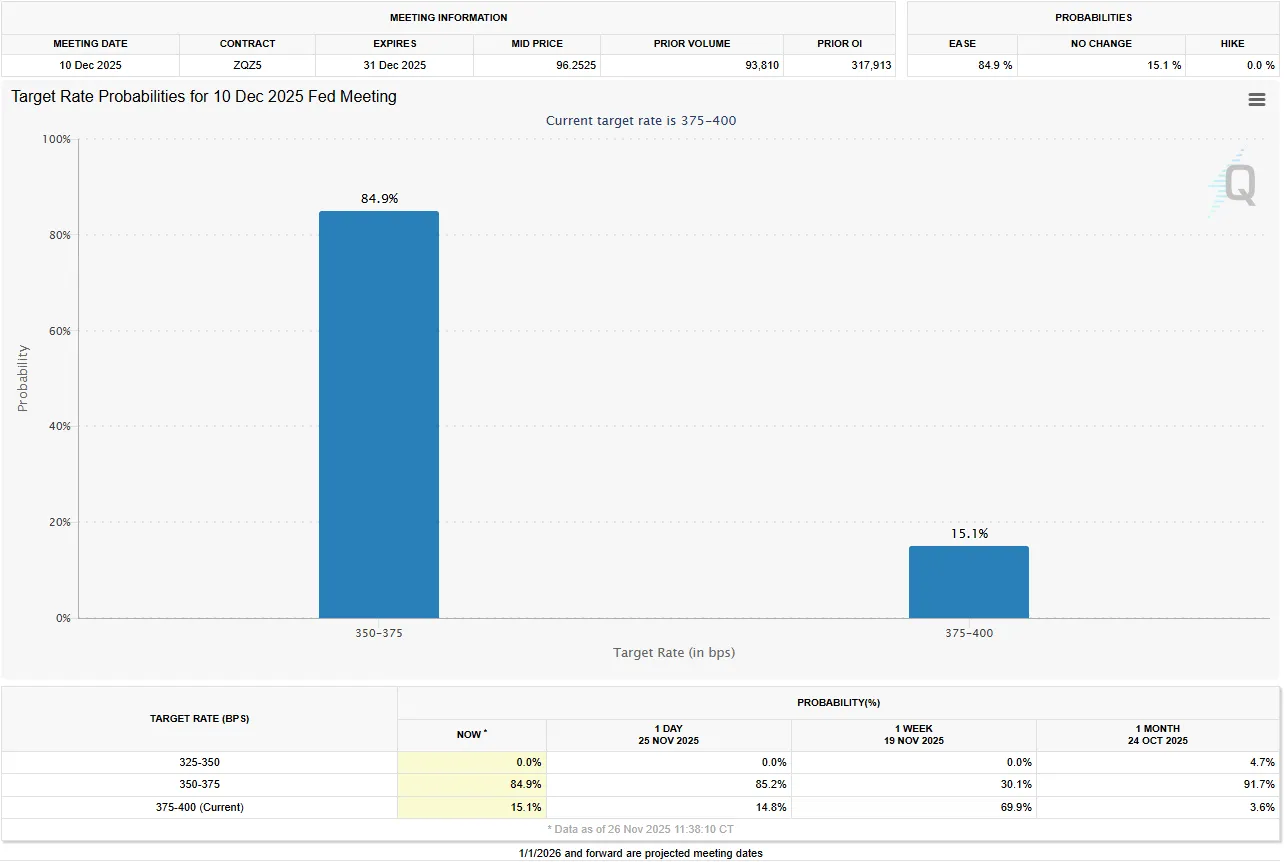
Source: CME FedWatch Tool
Market participants are expecting the FED to start cutting rates despite mixed rhetoric. The expectations do keep the US Dollar (USD) under broad pressure and force US Treasury yields to drift lower. Gold is a beneficiary in this environment as declining real yields reduce the opportunity cost of holding the metal.
These easing expectations are validated by a sequence of disappointing US economic releases, including softer ADP employment numbers, weaker Retail Sales figures, and a notable drop in the Conference Board’s Consumer Confidence reading for November. Market participants are continuing a recent trend by actively front-running the central bank’s mandated reaction function.
Technical Outlook - Gold (XAU/USD)
Looking at the four-hour chart below, the technical picture is strong.
Price action looks favorable with the RSI above 50, a sign of the bullish momentum.
Price continues to trade some way away from both the 50 and 100-day MA. This could lead to a short-term pullback at some stage.
Given the Thanksgiving Holiday in the US tomorrow, markets could see lower levels of liquidity. This could keep Gold prices rangebound as well.
Keep a close watch on Ukraine-Russia developments. Any sign that a deal may be edging close could lead to increased selling pressure on Gold and thus push Gold prices lower.
Gold (XAU/USD) Four-Hour Chart, November 26, 2025
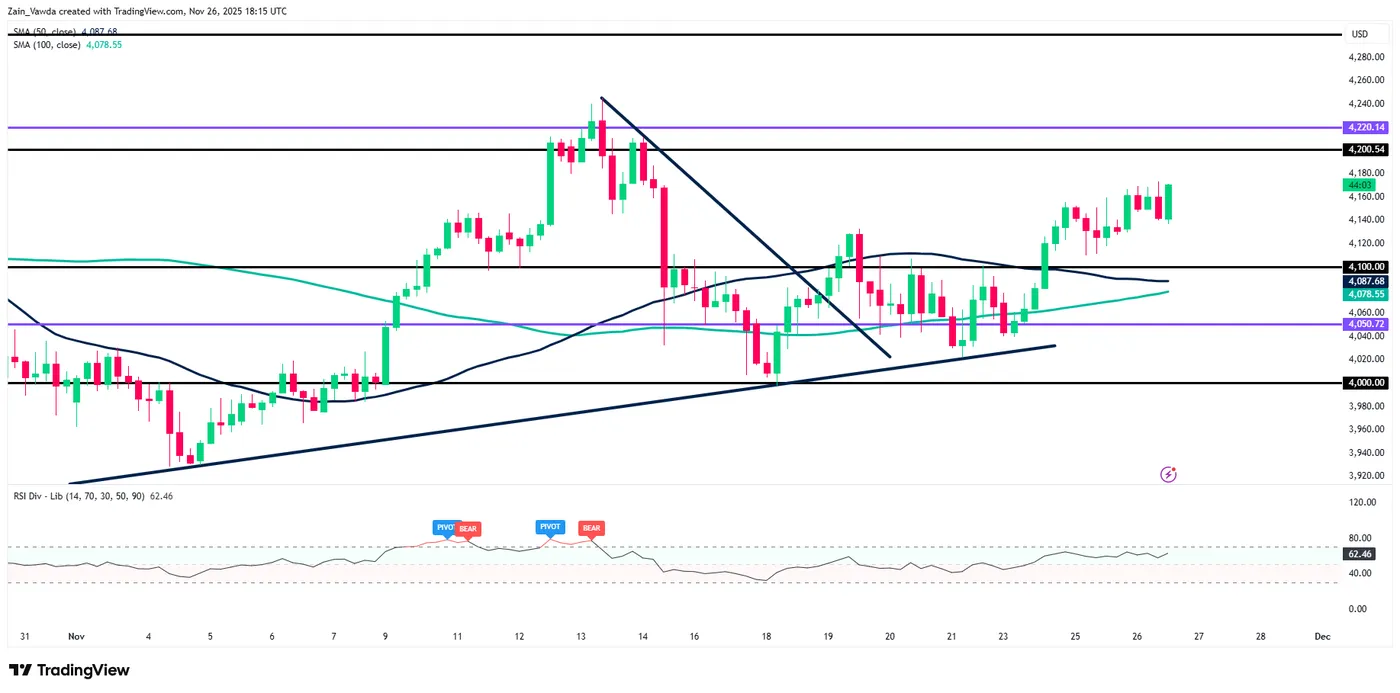
Source: TradingView (click to enlarge)
Gold: Key Near-Term Technical Levels
As mentioned above, bulls may struggle to break beyond the $4200/ounce heading into the weekend as liquidity is expected to be thin. This is not to say it is not a possibility.
Key levels to pay attention to include
- $4,380, All-Time High/Previous Record High (October 17)
- $4,220, Critical Breakout Resistance Key threshold for acceleration
- $4042, Key to Uptrend Integrity
GBP/JPY Nears 15-Month Peak in Rally ; Intervention from Bank of Japan?
GBP/JPY is a very popular pair in Forex trading as it captures both risk-on/risk-off dynamics, geographic trends, and rate differential trends.
The Yen and Sterling have been subject to some strong dynamics over the past month.
In Japan, markets are still concerned with the reckless government spending which the Japanese Prime Minister tried to defend against.
The latest development sees PM Sanae Takaichi and her cabinet approving a ¥21 trillion stimulus package—the largest since the COVID era.
This fiscal dovishness from the new Prime Minister, historically a negative for currency strength, has been heavily priced in since her appointment. Paradoxically, this may force the Bank of Japan to turn more hawkish, potentially hiking rates sooner to protect against a run on the JPY – The next decision is expected on December 18th.
There could still be an intervention from the BoJ which aims at buying back some Yen against other currency reserves.
For the Pound, the initial volatility relative to the recent Budget is turning into a positive trend. Despite not pivoting to full austerity (aiming to cut expenses for a better fiscal balance), the budget is perceived as far from reckless.
While higher income taxes might dampen consumption slightly, the overall fiscal stance has put the GBP in a decent position, making it the 3rd best performer of today's session.
Technically, the pair is at key point. If the current rally extends beyond the 207.00 level, the price action will point directly to a retest of the July 2024 peak.
Let's dive into a multi-timeframe analysis and technical levels for GBP/JPY, a pair that should stay active during the Thanksgiving break.
GBP/JPY Multi-timeframe Technical Analysis
Daily Chart
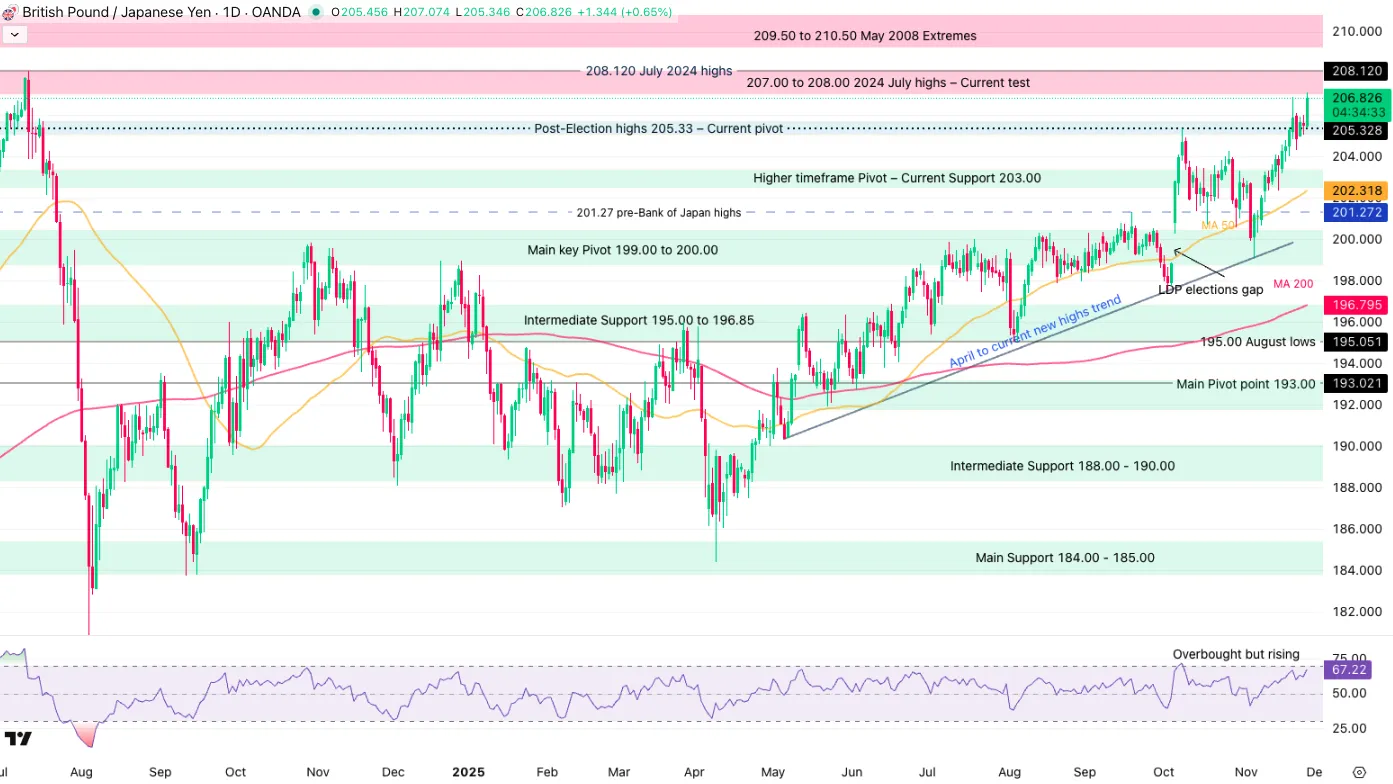
GBP/JPY Daily Chart, November 26, 2025 – Source: TradingView
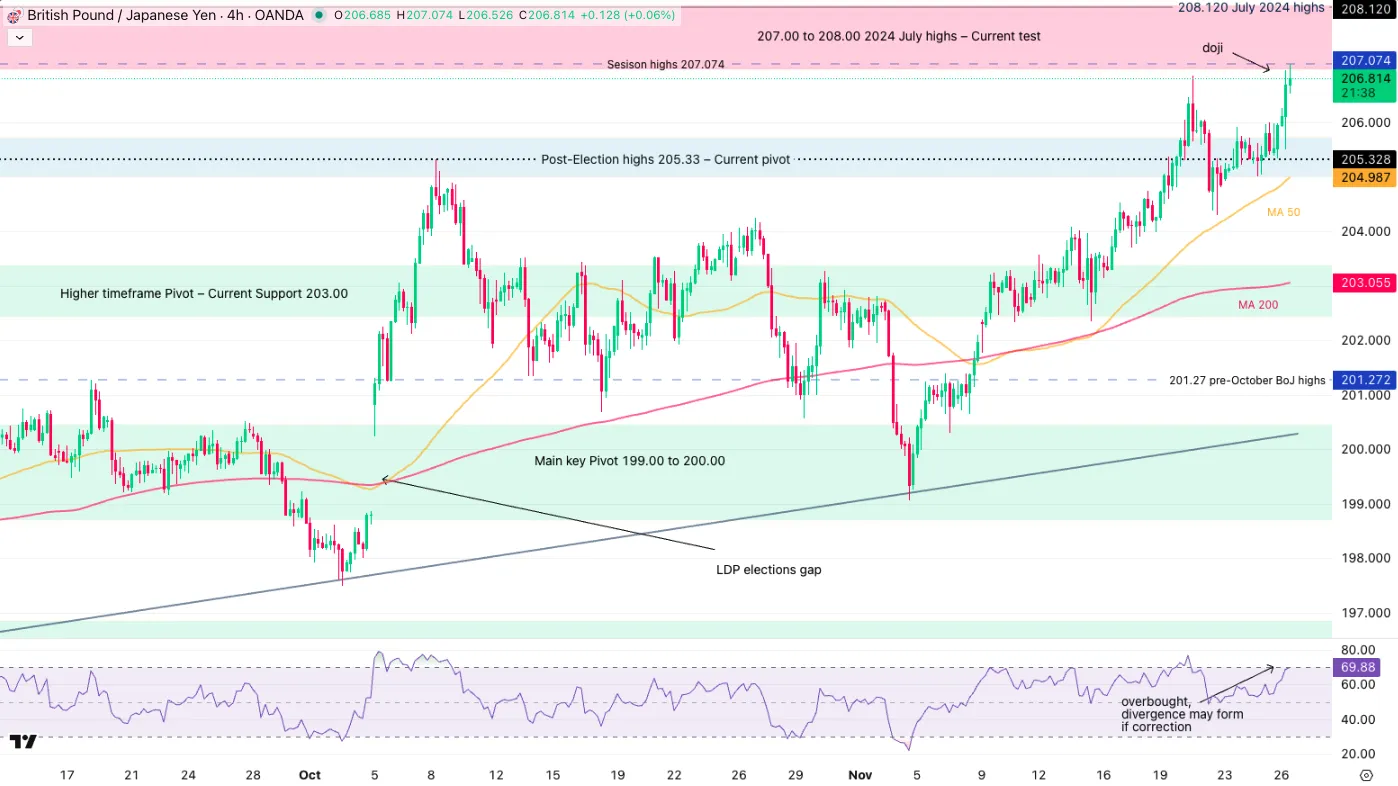
The pair has evolved in a one-way tight bull channel since November 5, taking prices to overbought RSI levels.
Nevertheless, overbought doesn't mean top, particularly as the RSI is still tilting upwards, hence momentum backs the ongoing rebound.
One thing to look for on the bigger timeframe is how the market reacts to its entry (or lack thereof) in the 207.00 Resistance:
- Last week, the action stopped at 206.86 which is the level to keep in mind: Closing above would confirm an entry in the Resistance and targets the 208.120 highs.
- Below, it could point more to a double-top action and a reversal.
- Keep in mind that the Bank of Japan may intervene during the Thanksgiving break which may also provide a huge move lower. The issue is that the timing for such is unknown.
Let's dive into the intraday charts.
4H Chart and Technical Levels
GBP/JPY 4H Chart, November 26, 2025 – Source: TradingView
The current 4H Candle forms a doji – pointing to a more hesitant price action.
A potential trading gameplan could be to look at breakout scenarios:
- A 4H close above 207.074 should push further into the resistance zone.
- A push below the 205.526 candle lows hints at further retracement.
Levels to watch for GBPJPY trading:
Support Levels:
- 4H Candle lows 206.50
- Post-Election highs 205.33 – Current pivot
- Higher timeframe Pivot – Current Support 203.00
- Main key Support 199.00 to 200.00
- Mid 2025 Support 195.00 to 196.85
Resistance Levels:
- 207.00 to 208.00 2024 July highs – Current test
- Session highs 207.074
- 208.120 July 2024 highs
- 209.50 to 210.50 May 2008 Extremes
1H Chart
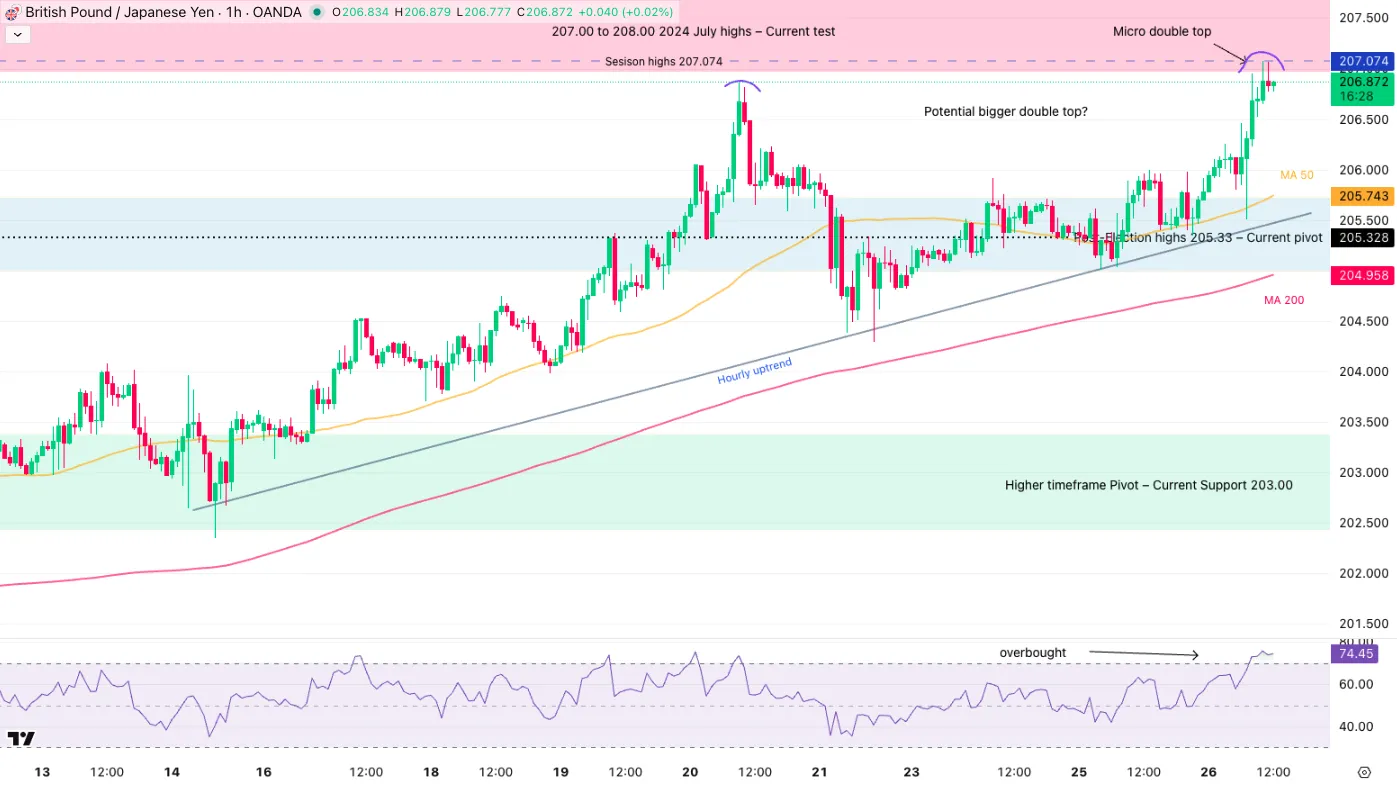
GBP/JPY 1H Chart, November 26, 2025 – Source: TradingView
The shorter timeframe points at further balance as the buying stalls on overbought 1H RSI.
As mentioned, right before, look at whether markets make a push either for the highs or the lows in a breakout scenario.
To avoid fakeouts, a trader can also wait for a 1H or 4H Candle close as confirmation.
In case of a bigger retracement, keep an eye on the Hourly uptrend to see if it holds, implying a buy signal or breaks, implying a sell signal.
Safe Trades!
USDCAD Wave Analysis
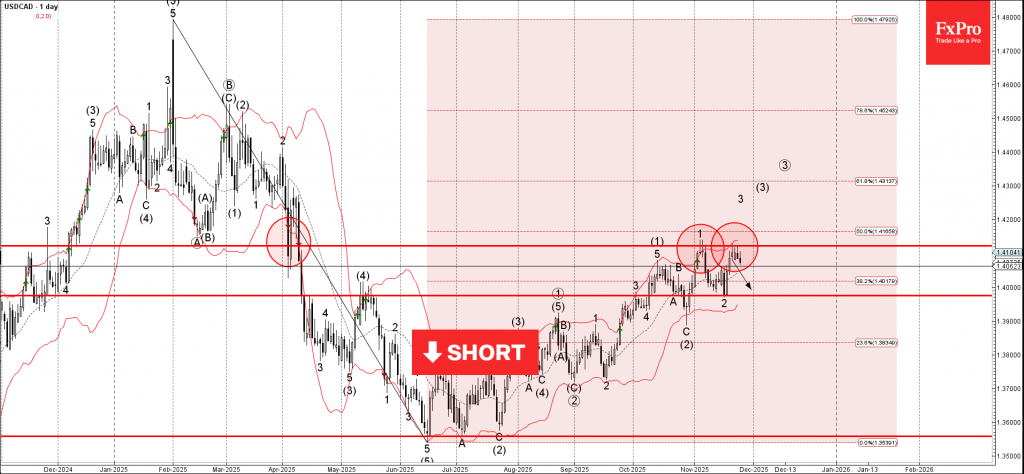
USDCAD: ⬇️ Sell
- USDCAD reversed from resistance area
- Likely to fall to support level 1.3975
USDCAD currency pair recently reversed from resistance area between the pivotal resistance level 1.4125 (which has been reversing the price from April), upper daily Bollinger Band and the 50% Fibonacci correction of the downward impulse from January.
The downward reversal from this resistance area stopped the previous impulse waves 3 and (3).
Given the strength of the resistance level 1.4125, USDCAD can be expected to fall to the next support level 1.3975 (low of the previous correction 2).
Gold Wave Analysis
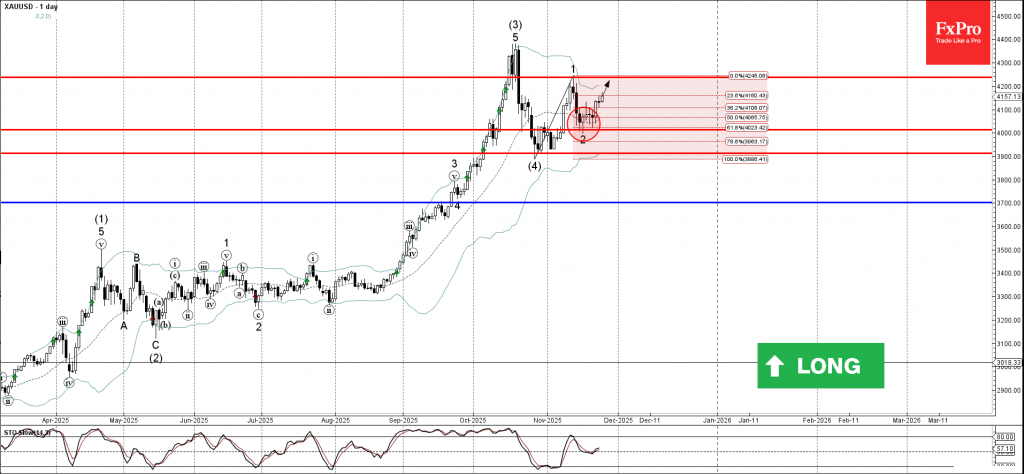
Gold: ⬆️ Buy
- Gold reversed from round support level 4000.00
- Likely to rise to resistance level 4235.00
Gold recently reversed from support area between the round support level 4000.00 (former support from October), 20-day moving average and the 61.8% Fibonacci correction of the upward impulse 1 from October.
The upward reversal from this support area started the active short-term impulse wave 3 of the medium-term impulse wave (5) from the end of October.
Given the clear daily uptrend, Gold can be expected to rise further to the next resistance level 4235.00 (which stopped the previous impulse wave 1).
Sunset Market Commentary
Markets
The UK budget announcement by Chancelor of the Exchequer Reeves was hoped for to bring some clarity on the future path of UK Public finances and provide markets with some insights on what to expect on the UK economic performance over the coming years. However, the political communication process was unexpectedly perturbed by an early release by of Office of Budget Responsibility’s (OBR) economic assessment based on the measures to be announced by the Chancelor, triggering additional market volatility. Regarding the heart of the matter, the budget, not unexpectedly, brought somewhat of a mixed message. The closely watched fiscal buffer (set against the rule that day-to day public spending has to be covered by tax revenues by 2030) was raised to £22bn compared to £9.9bn in the March statement. This buffer was mainly driven by a £26bn of additional taxes, including a freezing of income tax thresholds for three years from 2028-29, a levy on high valued homes, an increase in the tax on savings and property income,… . Spending over the horizon is raised by £11bn. The OBR expects taxes as a share of GDP to rise to an all-time high of 38% in 2029/30 (35% in 2024/25). Stil the combination of higher taxes and higher expenses is expected to reduce the deficit from 5.1% last year and 4.5% this year to 1.9% in 2029/30. Debt as a share of GDP is seen at 95% this year and holding at 96% at the end of the decade. Turning to growth and inflation forecasts, OBR raised its forecast for inflation this year (3.5% from 3.2%) and next year (2.5% from 2.1%) and expects it to return to 2% in 2027, one year later than forecasted in March. Growth is slightly upwardly revised for this year (1.5% from 1.1%), but downwardly revised for next year (1.4% from 1.9%). MT average growth was scaled back from 1.8% to 1.5%. UK gilts and sterling traded volatile after the unexpected OBR forecast release and the address of Chancelor Reeves before the House of Commons. However, for now, the market apparently sees some tentative bright spots as the higher fiscal buffer helps to reinforce a perception of fiscal sustainability. At the moment, markets don’t push for higher UK risk premia. Gilts are rebounding with yields easing between 3 bps (2-y) and 6.5 bps (30-y). After touching an intraday top near EUR/GBP 0.8818, sterling also rebounds to currently EUR/GBP 0.877, admittedly still in nervous trading. UK equities reversed an initial 0.6% intraday dip to currently gaining 0.8% on the day. (FTSE 100). Markets (marginally) further raised expectations on a December rate cut (90%) but still doubt whether there will be room for more than one additional step next year.
News & Views
The Norwegian economy grew by 0.1% q/q (or 1.2% y/y) in Q3 of this year, the statistics agency said in its flash estimate. That’s a deceleration from Q2’s downwardly revised 0.5% (or 2% y/y). Including the country’s vast offshore energy and shipping sector, GDP expanded by 1.1% compared to 1.2% in the previous quarter. The growth figures undershot market and the central bank’s expectations but were to a certain extent affected by one-offs (eg. fishing and aquaculture). Consumption of households, for one, remains a solid driver of the economy, growing by 0.9% q/q. With details less underwhelming than the headline figure suggests, markets aren’t stacking up bets for future rate cuts by the Norges Bank. The central bank had projected an extremely gradual easing pace from the current 4%, penciling in one rate cut annually over the next three years due to sticky inflation. Norwegian money markets aren’t expecting a move at least through May of next year. EUR/NOK trades stoic around 11.84.
The ECB in its Financial Stability Review warned for a series of risks including stretched valuations in equities that do “not appear to reflect persistently elevated vulnerabilities and uncertainties”, a meltdown of the UST market over spiraling borrowing by the Trump administration and a new European sovereign debt crisis originating from member states “with more fragile political landscapes” that fail to address “weak fiscal fundamentals” (they mean France). But it also singled out the risks related to the Dutch pension reform that entails a shift from defined benefit to defined contribution. In the sector, Dutch pension funds account for about 65% of sovereign bond holdings. The impending shift in practice means lower demand for long(er)-dated bonds in a time where supply is abundant due to structural deficits, climate, defense and infrastructure spending. The transition will be split across the next two years. But the early part of 2026 will be a key test, with reportedly some 35% of the Dutch pension sector’s assets then due to switch..
GBP/USD Mid-Day Outlook
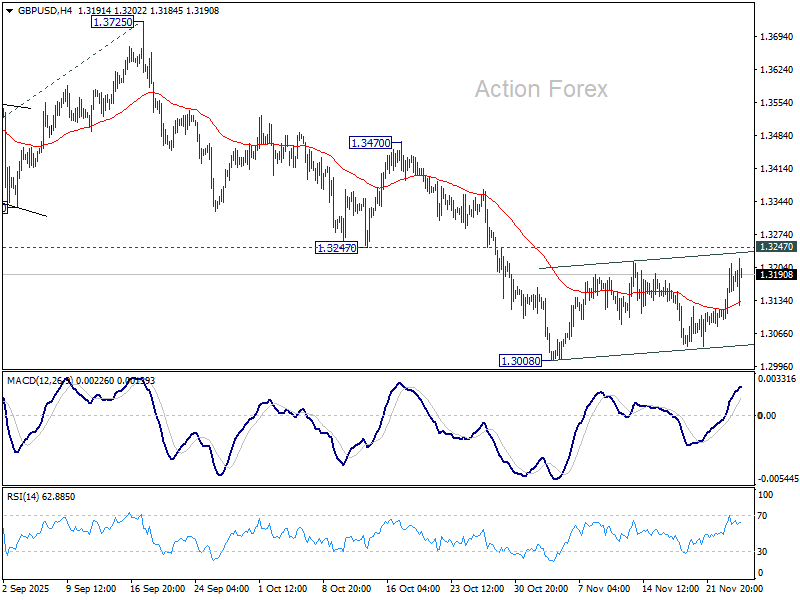
Daily Pivots: (S1) 1.3103; (P) 1.3158; (R1) 1.3221; More...
GBP/USD recovers today but it's still bounded in range of 1.3008/3247. Intraday bias remains neutral at this point. With 1.3247 support turned resistance intact, further decline is expected. On the downside, break of 1.3008 will resume the fall from 1.3725 to 138.2% projection of 1.3787 to 1.3140 from 1.3725 at 1.2831. Nevertheless, firm break of 1.3247 will suggest that fall from 1.3787 has completed as a corrective move already.
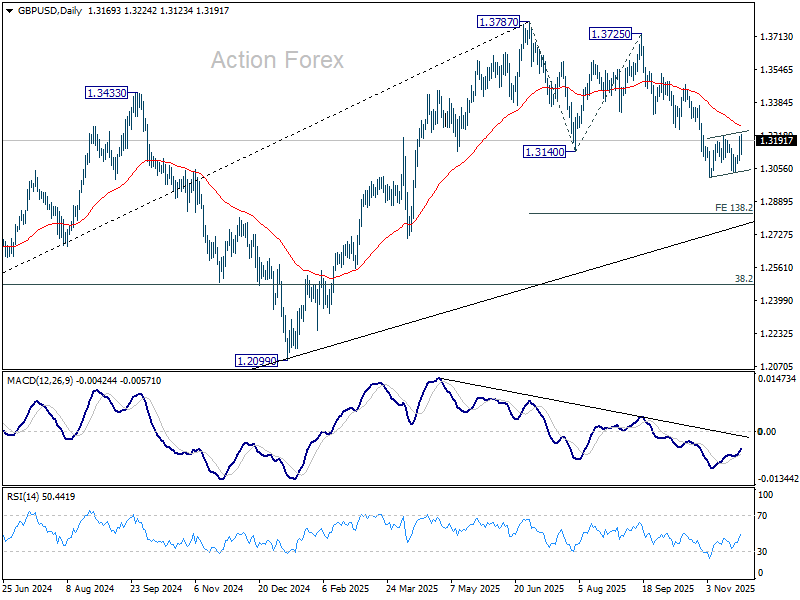
In the bigger picture, the break of 55 W EMA (now at 1.3184) is taken as the first sign that corrective rise from 1.0351 (2022 low) has completed. Decisive break of trend line support (now at 1.2760) will solidify this case and target 38.2% retracement of 1.0351 to 1.3787 at 1.2474 next. Meanwhile, in case of another rise, strong resistance should emerge below 1.4248 (2021 high) to cap upside to preserve the long term down trend.
EUR/USD Mid-Day Outlook
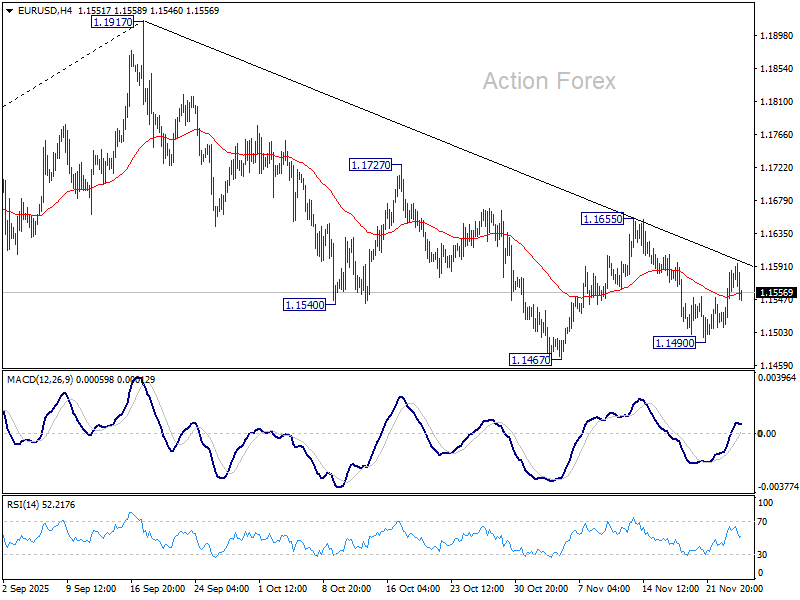
Daily Pivots: (S1) 1.1526; (P) 1.1556; (R1) 1.1600; More…
Sideway consolidations continue in EUR/USD and intraday bias remains neutral. Further decline is expected with 1.1655 resistance intact. On the downside, below 1.1490 and 1.1467 will resume the whole decline from 1.1917 high. Next targets are 1.1390, and then 38.2% retracement of 1.0176 to 1.1917 at 1.1252.
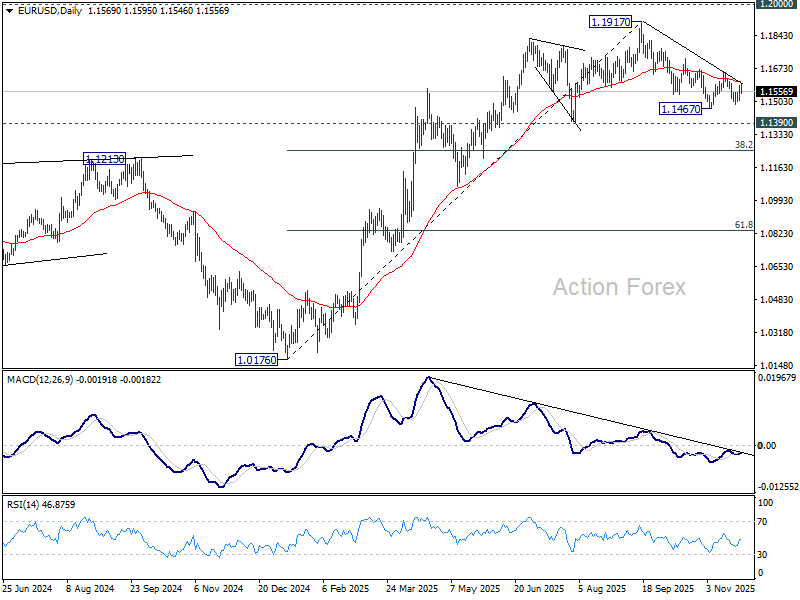
In the bigger picture, considering bearish divergence condition in D MACD, a medium term top is likely in place at 1.1917, just ahead of 1.2 key psychological level. As long as 55 W EMA (now at 1.1328) holds, the up trend from 0.9534 (2022 low) is still in favor to continue. Decisive break of 1.2000 will carry larger bullish implications. However, sustained trading below 55 W EMA will argue that rise from 0.9534 has completed as a three wave corrective bounce, and keep long term outlook bearish.
USD/CHF Mid-Day Outlook
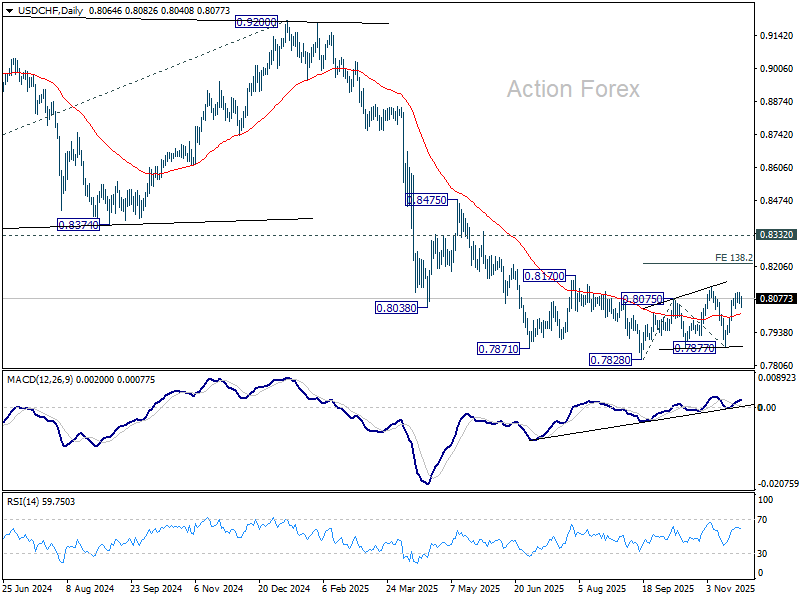
Daily Pivots: (S1) 0.8057; (P) 0.8079; (R1) 0.8101; More…
USD/CHF recovers after hitting 4H EMA but stays below 0.8101. Intraday bias remains neutral first. No change in the outlook that current rise from 0.7877 is still seen as the third leg of the corrective pattern from 0.7828 low. Above 0.8101 will target 0.8123 resistance, and then 138.2% projection of 0.7828 to 0.8075 from 0.7877 at 0.8218. However, sustained break of 55 D EMA (now at 0.8011) will bring deeper fall back to 0.7877 support instead.
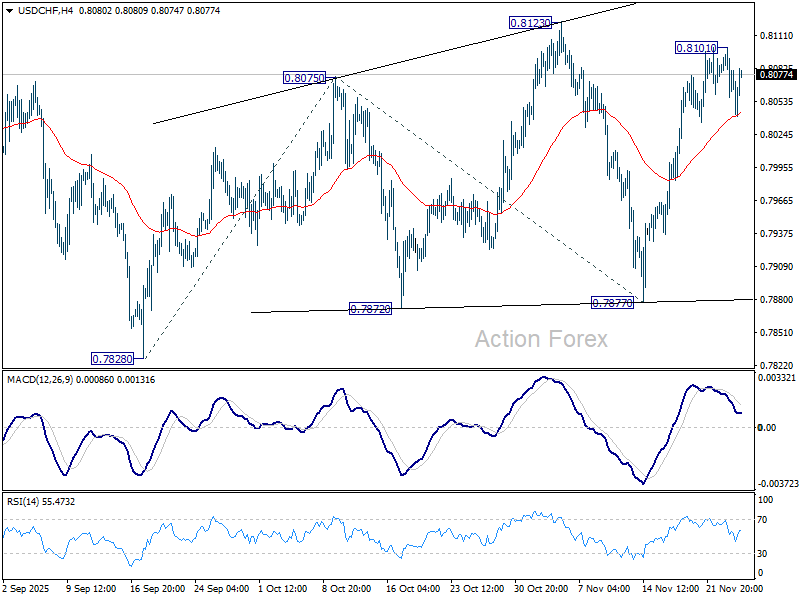
In the bigger picture, long term down trend from 1.0342 (2017 high) is still in progress. Next target is 100% projection of 1.0146 (2022 high) to 0.8332 from 0.9200 at 0.7382. In any case, outlook will stay bearish as long as 0.8332 support turned resistance holds (2023 low).