
Sample Category Title
USD/JPY Mid-Day Outlook
Daily Pivots: (S1) 155.59; (P) 156.29; (R1) 156.77; More...
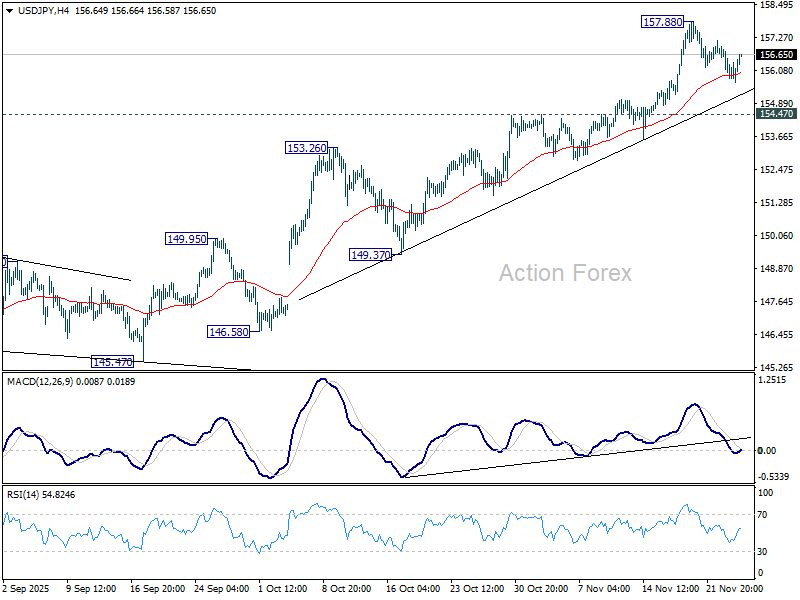
USD/JPY recovers mildly after hitting 55 4H EMA, but stays well below 157.88 resistance. Intraday bias remains neutral and more consolidations could be seen. Downside should be contained by 154.47 resistance turned support. On the upside, break of 157.88 will resume the whole rally from 139.87. Next target is 158.86 structural resistance, and then 161.94 high.
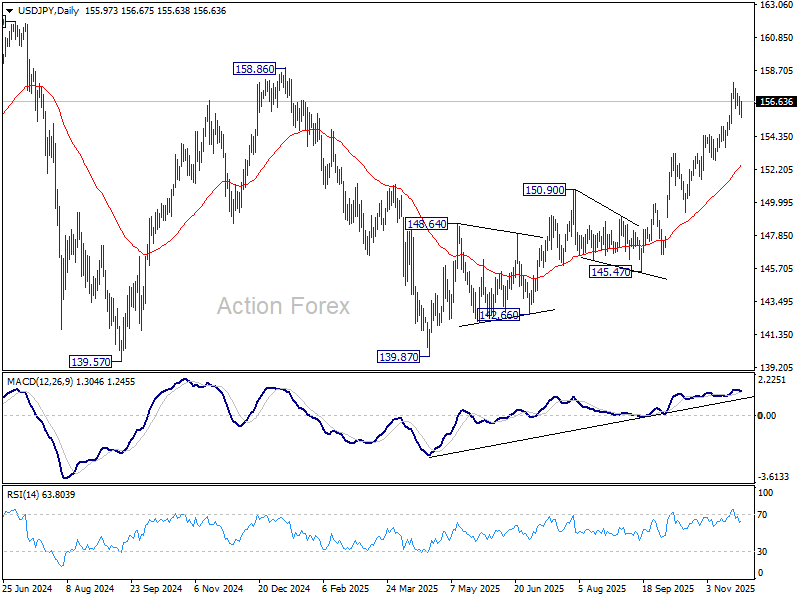
In the bigger picture, current development suggests that corrective pattern from 161.94 (2024 high) has completed with three waves at 139.87. Larger up trend from 102.58 (2021 low) could be ready to resume through 161.94 high. Decisive break of 158.85 structural resistance will solidify this bullish case and target 161.94 for confirmation. On the downside, break of 150.90 resistance turned support will dampen this bullish view and extend the corrective range pattern with another falling leg.
EUR/GBP Mid-Day Outlook
Daily Pivots: (S1) 0.8770; (P) 0.8784; (R1) 0.8803; More…
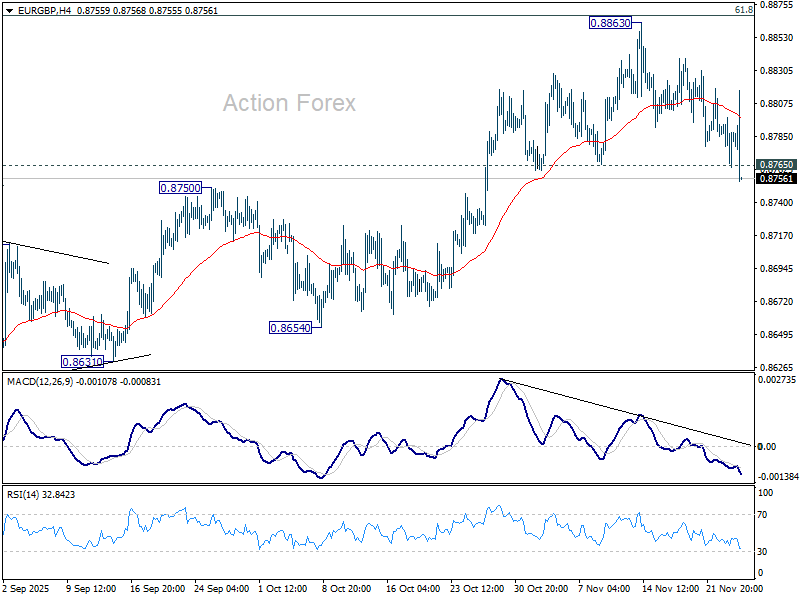
EUR/GBP's fall from 0.8663 extends lower today. The break of 0.8765 support confirms short term topping at 0.8863, on bearish divergence condition in 4H MACD. Intraday bias is back on the downside for 55 D EMA (now at 0.8742) first. Sustained break there will be an early sign of bearish trend reversal. For now, risk will stay on the downside as long as 0.8862 resistance holds, in case of recovery.
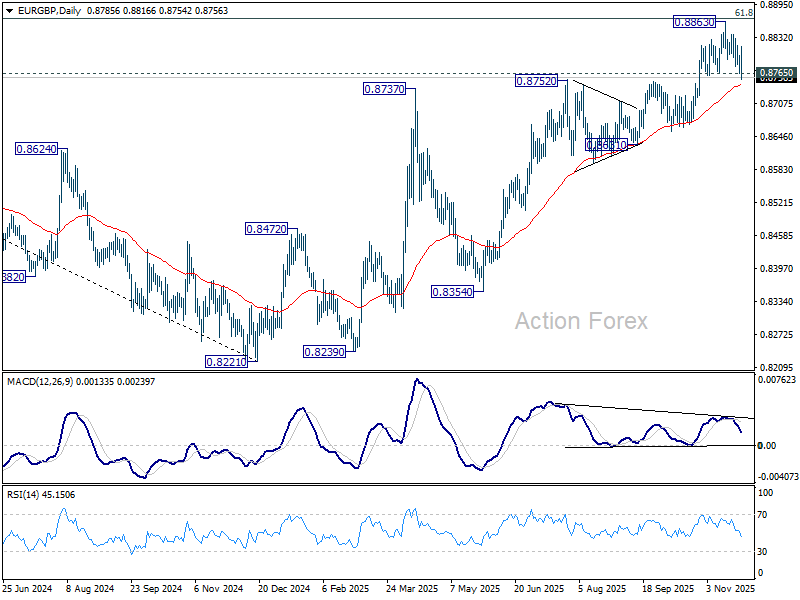
In the bigger picture, rise from 0.8221 medium term bottom is still seen as a corrective move. Upside should be limited by 61.8% retracement of 0.9267 to 0.8221 at 0.8867. Sustained trading below 55 W EMA (now at 0.8588) should confirm that this corrective bounce has completed. However, decisive break of 0.8867 will suggest that EUR/GBP is already reversing whole decline from 0.9267 (2022 high). That should pave the way back to 0.9267.
Sterling Rises as UK Autumn Budget Clears Key Stability Test
Sterling advanced broadly today as markets reacted positively to the highly anticipated Autumn Budget. Early jitters surfaced when the OBR mistakenly published its fiscal forecasts ahead of schedule, triggering brief volatility in both the Pound and 10-year gilt yields. But once the dust settled, sentiment stabilized and then improved further as the full details were unveiled.
Chancellor Rachel Reeves confirmed that the UK is on course to meet her “stability rule” — achieving a balanced current budget with significantly larger headroom than before. The buffer for FY2029-30 now stands at GBP 21.7B, offering a stronger cushion against fiscal shocks. Markets welcomed the commitment to discipline, helping underpin the rebound in gilt prices and GBP.
However, the near-term deficit profile was less flattering. The OBR projected larger shortfalls from FY2025 through FY2028 than those seen in the spring statement. Even so, the medium-term framework and the stronger end-of-decade headroom were treated as credible enough to retain investor confidence.
Growth projections painted a mixed picture. The OBR now expects UK GDP to expand 1.5% in 2025, an upgrade from March’s 1% outlook. But forecasts for 2026 and 2027 were revised down to 1.4% (from 1.9%) and 1.5% (from 1.8%) respectively, highlighting the structural constraints still weighing on the economy.
Elsewhere in the currency markets, Dollar found some support from a lower-than-expected jobless claims print. Although the data does little to alter the prevailing view that the Fed is leaning toward a risk-management cut in December, it strengthens the case that a long pause is likely to follow as policymakers assess how the economy digests monetary loosening and tariff-related impacts.
But in today’s performance scoreboard, Kiwi remains the clear outperformer. RBNZ’s hawkish rate cut signaled that the easing cycle may already have ended, prompting further unwinding of previously priced-in dovishness. Aussie followed closely behind as stronger-than-expected CPI data pushed expectations for the next RBA cut further into 2026. Sterling sits in third place
Yen is the weakest performer amid renewed selling in early US trading, followed Euro. Dollar is the third worst, though it has potential to recover into the session. Swiss Franc and Loonie are holding the middle ground.
In Europe, at the time of writing, FTSE is up 0.56%. DAX is up 0.44%. CAC is up 0.47%. UK 10-year yield is down -0.021 at 4.478. Germany 1-year yield is up 0.012 at 2.692. Earlier in Asia, Nikkei rose 1.85%. Hong Kong HSI rose 0.13%. China Shanghai SSE fell -0.15%. Singapore Strait Times rose 0.36%. Japan 10-year JGB yield rose 0.015 to 1.819.
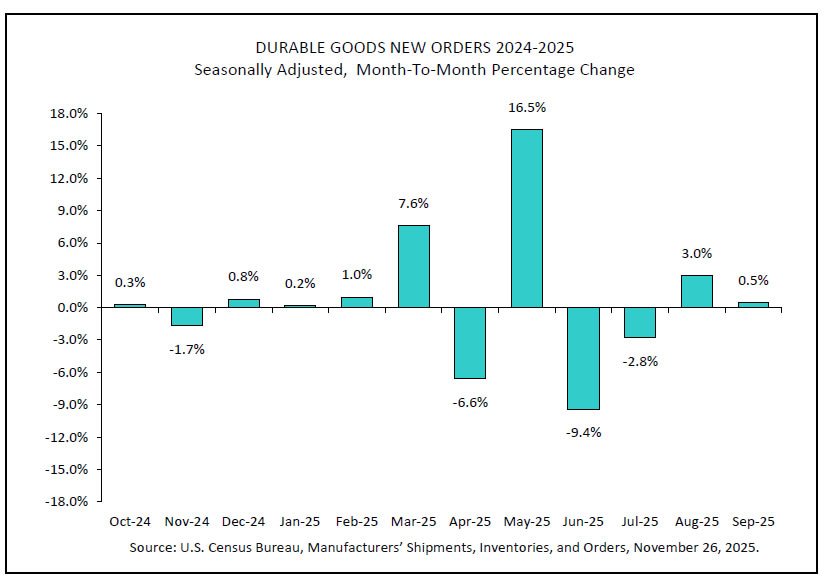
US durable goods rise 0.5% mom in September, ex-transport strength stands out
US durable goods orders rose 0.5% mom to USD 313.7B in September, matching expectations. The headline increase was driven primarily by transportation equipment, which climbed 0.4% mom to USD 110.7B, extending gains for a second month.
Ex-defense orders also inched 0.1% higher to USD 290.6B, reflecting still-modest momentum across broader manufacturing categories.
The stronger signal came from core orders, with ex-transportation rising 0.6% mom — well above the 0.2% consensus — to USD 202.9B. The data suggest business investment remains resilient, offering a mild counterweight to recent signs of cooling elsewhere in the economy.
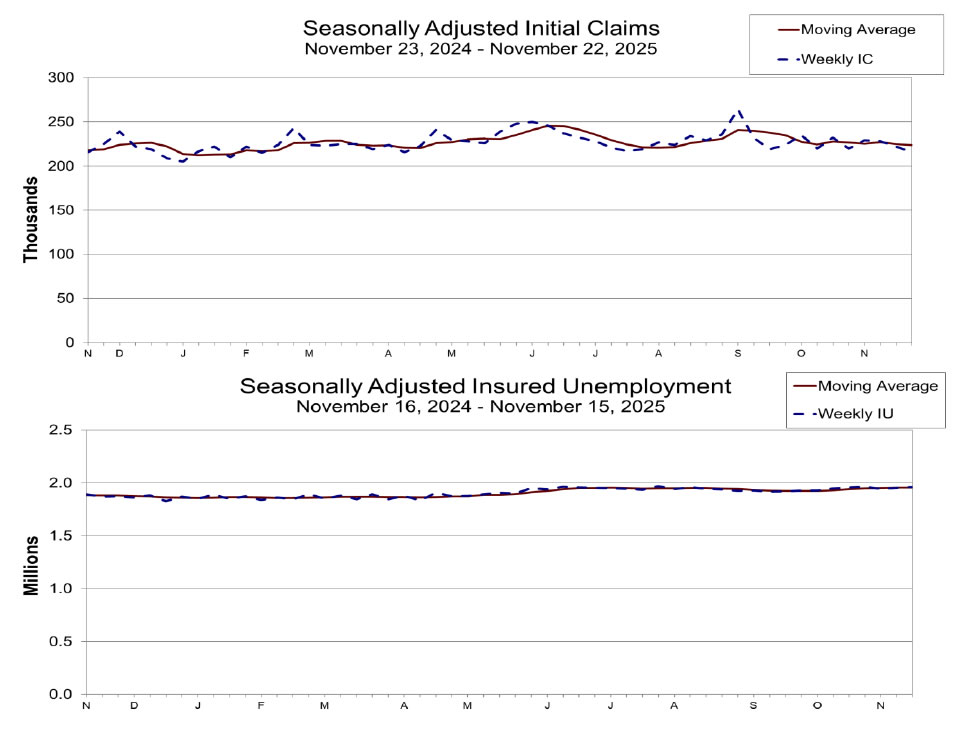
US initial jobless claims fall to 216k vs exp 226k
US initial jobless claims fell -6k to 216k in the week ending November 22, below expectation of 226k. Four-week moving average of initial claims fell -1k to 224k.
Continuing claims rose 7k to 1960k in the week ending November 15. Four-week moving average of continuing claims rose 750 to 1956k.
RBNZ delivers 25bps cut but signals little room for further easing
RBNZ cut the OCR by 25bps to 2.25% as widely expected, but the tone of the announcement was more hawkish than markets had anticipated.
Policymakers revealed they had debated holding rates at 2.50% versus cutting to 2.25%, and the final decision was reached by a 5–1 vote. The lone dissenter in favour of holding highlights pockets of concern about easing too deeply and reflects a more cautious internal balance than many had assumed.
More importantly for markets, RBNZ’s updated forward guidance showed a notably firmer policy path. The Bank now expects the OCR to bottom at just 2.2% through 2026 before gradually rising to 2.7% by the end of 2027. That trajectory implies minimal scope for further cuts next year if the economic outlook holds, effectively signaling that today’s move may mark the end of the easing cycle.
The accompanying statement reinforced that message. RBNZ said economic activity was weak through mid-2025 but is now improving, with lower interest rates supporting household spending and the labor market stabilizing. The fall in the exchange rate is also lifting exporters’ incomes, reducing the need for more aggressive stimulus from here. Risks to the inflation outlook are now viewed as “balanced”.
Australia CPI surges to 3.8% in October, goods and services prices accelerate
Australia’s CPI accelerated more than expected in October, rising from 3.5% yoy to 3.8%, beating expectations of 3.6%. Underlying pressure also firmed, with trimmed mean CPI moving up from 3.2% to 3.3%.
Both goods and services inflation picked up, with annual goods inflation at 3.8% (up from 3.7%) and services inflation at 3.9% (up from 3.5), signaling renewed price momentum. The combination will keep the RBA wary of easing again too soon.
The details showed broad-based increases. Housing costs was the largest contributor at 5.9%, followed by food and non-alcoholic beverages at 3.2%, and recreation and culture at 3.2%.
The release is also notable as the first in which Monthly CPI replaces the quarterly gauge as Australia’s primary headline measure.
EUR/GBP Mid-Day Outlook
Daily Pivots: (S1) 0.8770; (P) 0.8784; (R1) 0.8803; More…
EUR/GBP's fall from 0.8663 extends lower today. The break of 0.8765 support confirms short term topping at 0.8863, on bearish divergence condition in 4H MACD. Intraday bias is back on the downside for 55 D EMA (now at 0.8742) first. Sustained break there will be an early sign of bearish trend reversal. For now, risk will stay on the downside as long as 0.8862 resistance holds, in case of recovery.
In the bigger picture, rise from 0.8221 medium term bottom is still seen as a corrective move. Upside should be limited by 61.8% retracement of 0.9267 to 0.8221 at 0.8867. Sustained trading below 55 W EMA (now at 0.8588) should confirm that this corrective bounce has completed. However, decisive break of 0.8867 will suggest that EUR/GBP is already reversing whole decline from 0.9267 (2022 high). That should pave the way back to 0.9267.
US initial jobless claims fall to 216k vs exp 226k
US initial jobless claims fell -6k to 216k in the week ending November 22, below expectation of 226k. Four-week moving average of initial claims fell -1k to 224k.
Continuing claims rose 7k to 1960k in the week ending November 15. Four-week moving average of continuing claims rose 750 to 1956k.
US durable goods rise 0.5% mom in September, ex-transport strength stands out
US durable goods orders rose 0.5% mom to USD 313.7B in September, matching expectations. The headline increase was driven primarily by transportation equipment, which climbed 0.4% mom to USD 110.7B, extending gains for a second month.
Ex-defense orders also inched 0.1% higher to USD 290.6B, reflecting still-modest momentum across broader manufacturing categories.
The stronger signal came from core orders, with ex-transportation rising 0.6% mom — well above the 0.2% consensus — to USD 202.9B. The data suggest business investment remains resilient, offering a mild counterweight to recent signs of cooling elsewhere in the economy.
AUD/NZD Accelerates Lower After RBNZ’s Hawkish Cut
The pair fell one full figure and hit the lowest in almost one month after the Reserve Bank of New Zealand cut rates by 25 basis points, as expected, but signaled pause that lifted kiwi dollar.
Fresh weakness extended below Nov 18 higher low at 1.1443, with sustained break here to generate fresh signal on completion of bearish failure swing and keep the downside in focus.
The structure on daily chart weakened as falling 14-d momentum broke into negative territory and converging 10/20DMA’s are about to form bear-cross.
On the other hand, quick bounce from the session low (1.1406, slightly below Fibo 61.8% of 1.1283/1.1636 upleg), signals that bears face headwinds at pivotal 1.1400 zone, but bearish hourly studies add to scenario of limited upticks providing better levels to re-enter bearish market.
The notion is supported by hotter than expected Australia’s October inflation which is likely to increase pressure on RBA and sour the sentiment of Aussie dollar.
Daily close below broken Fibo 50% (1.1460) is required to keep near-term action biased lower and risk renewed attack at 1.1400 zone, violation of which would expose key supports at 1.1316/1.1286 (top of ascending daily cloud/Oct 22 higher low).
Res: 1.1460; 1.1500; 1.1527; 1.1553.
Sup: 1.1418; 1.1400; 1.1367; 1.1316.
A Worryingly Weak Rebound in Crypto
Market Overview
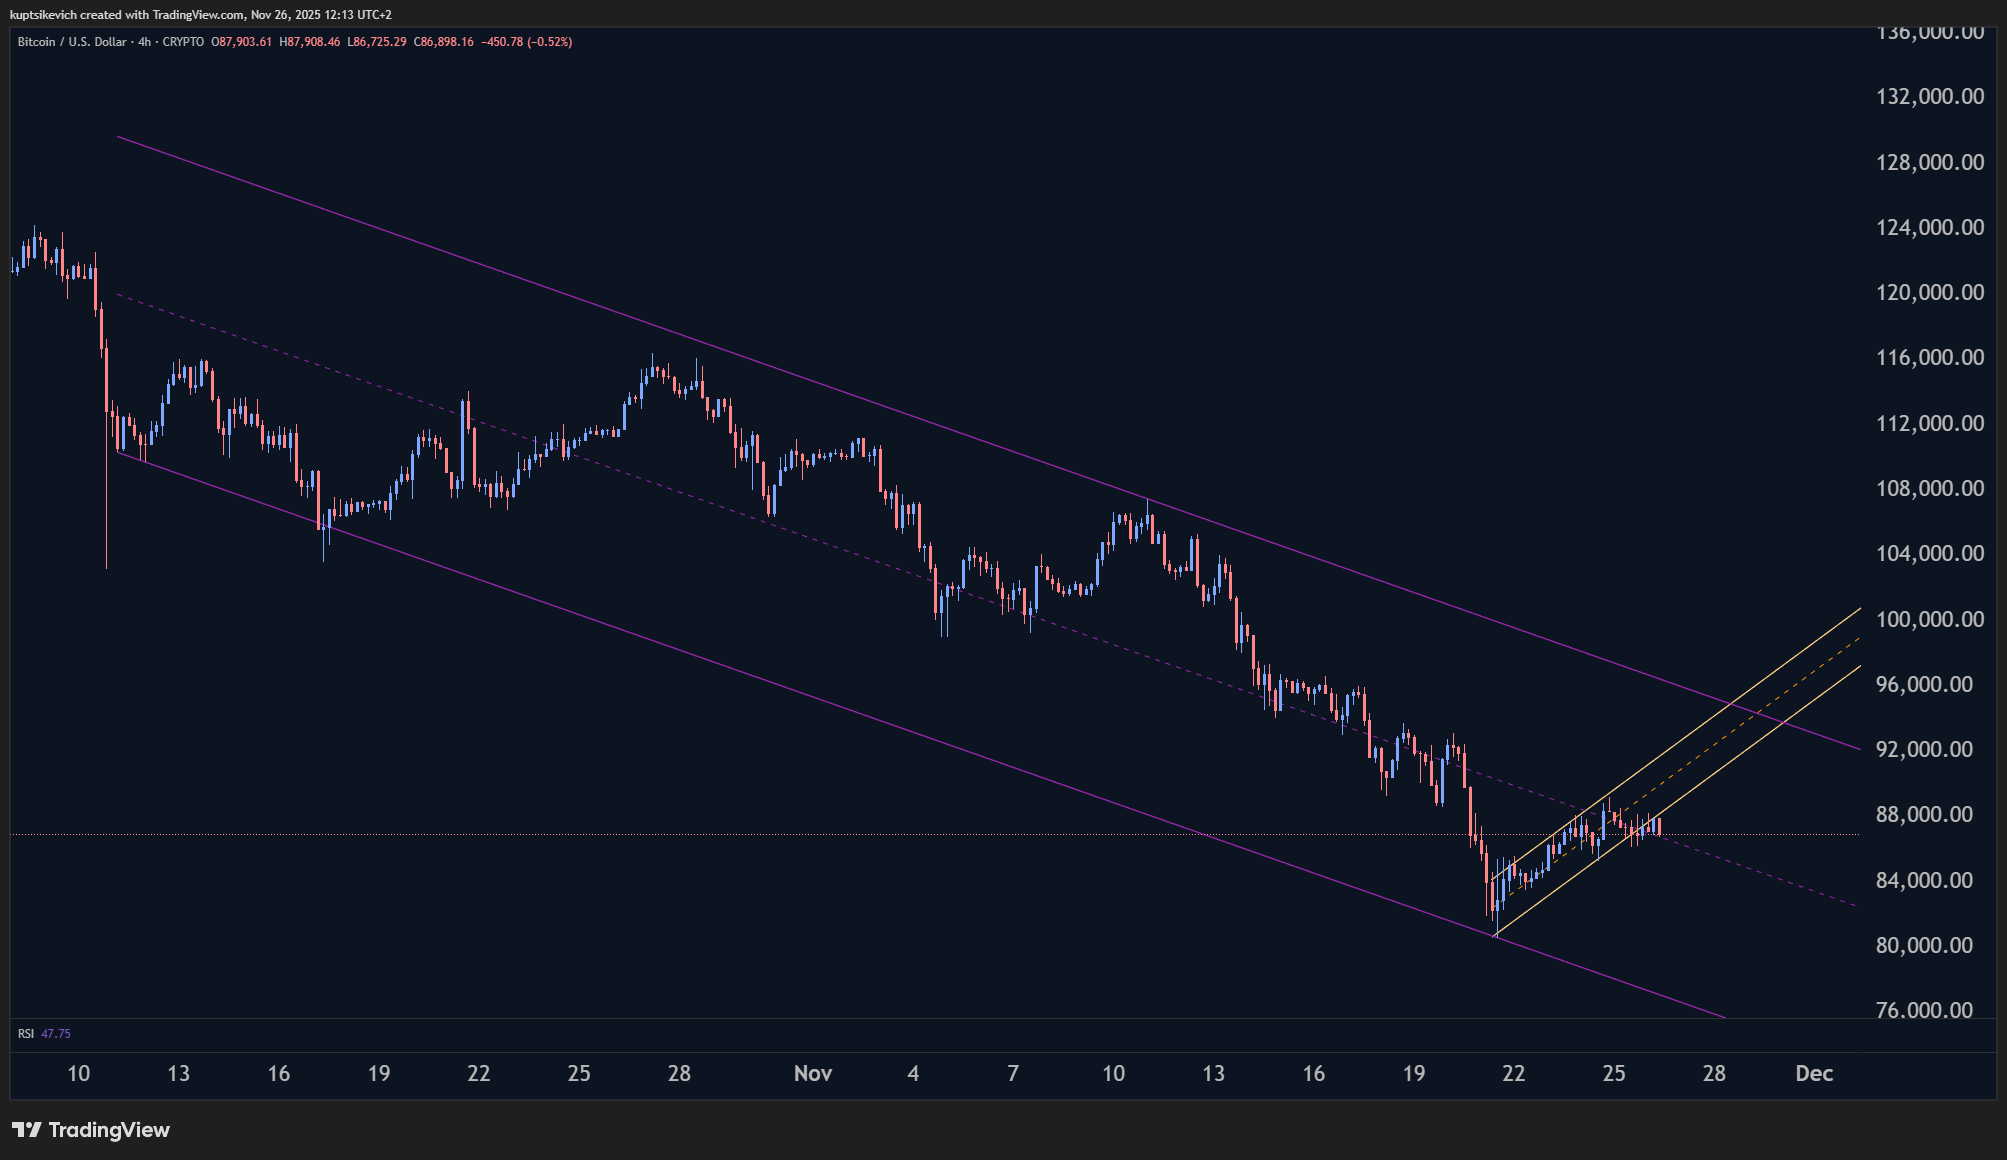
The crypto market cap rose 0.6% to $3.02T, continuing its retreat from the local low reached on Friday. Once again, the stock market pulled cryptocurrencies up, but this time the positive sentiment was only enough for a slight increase to the level of 24 hours ago, with a decline at the end of Tuesday.
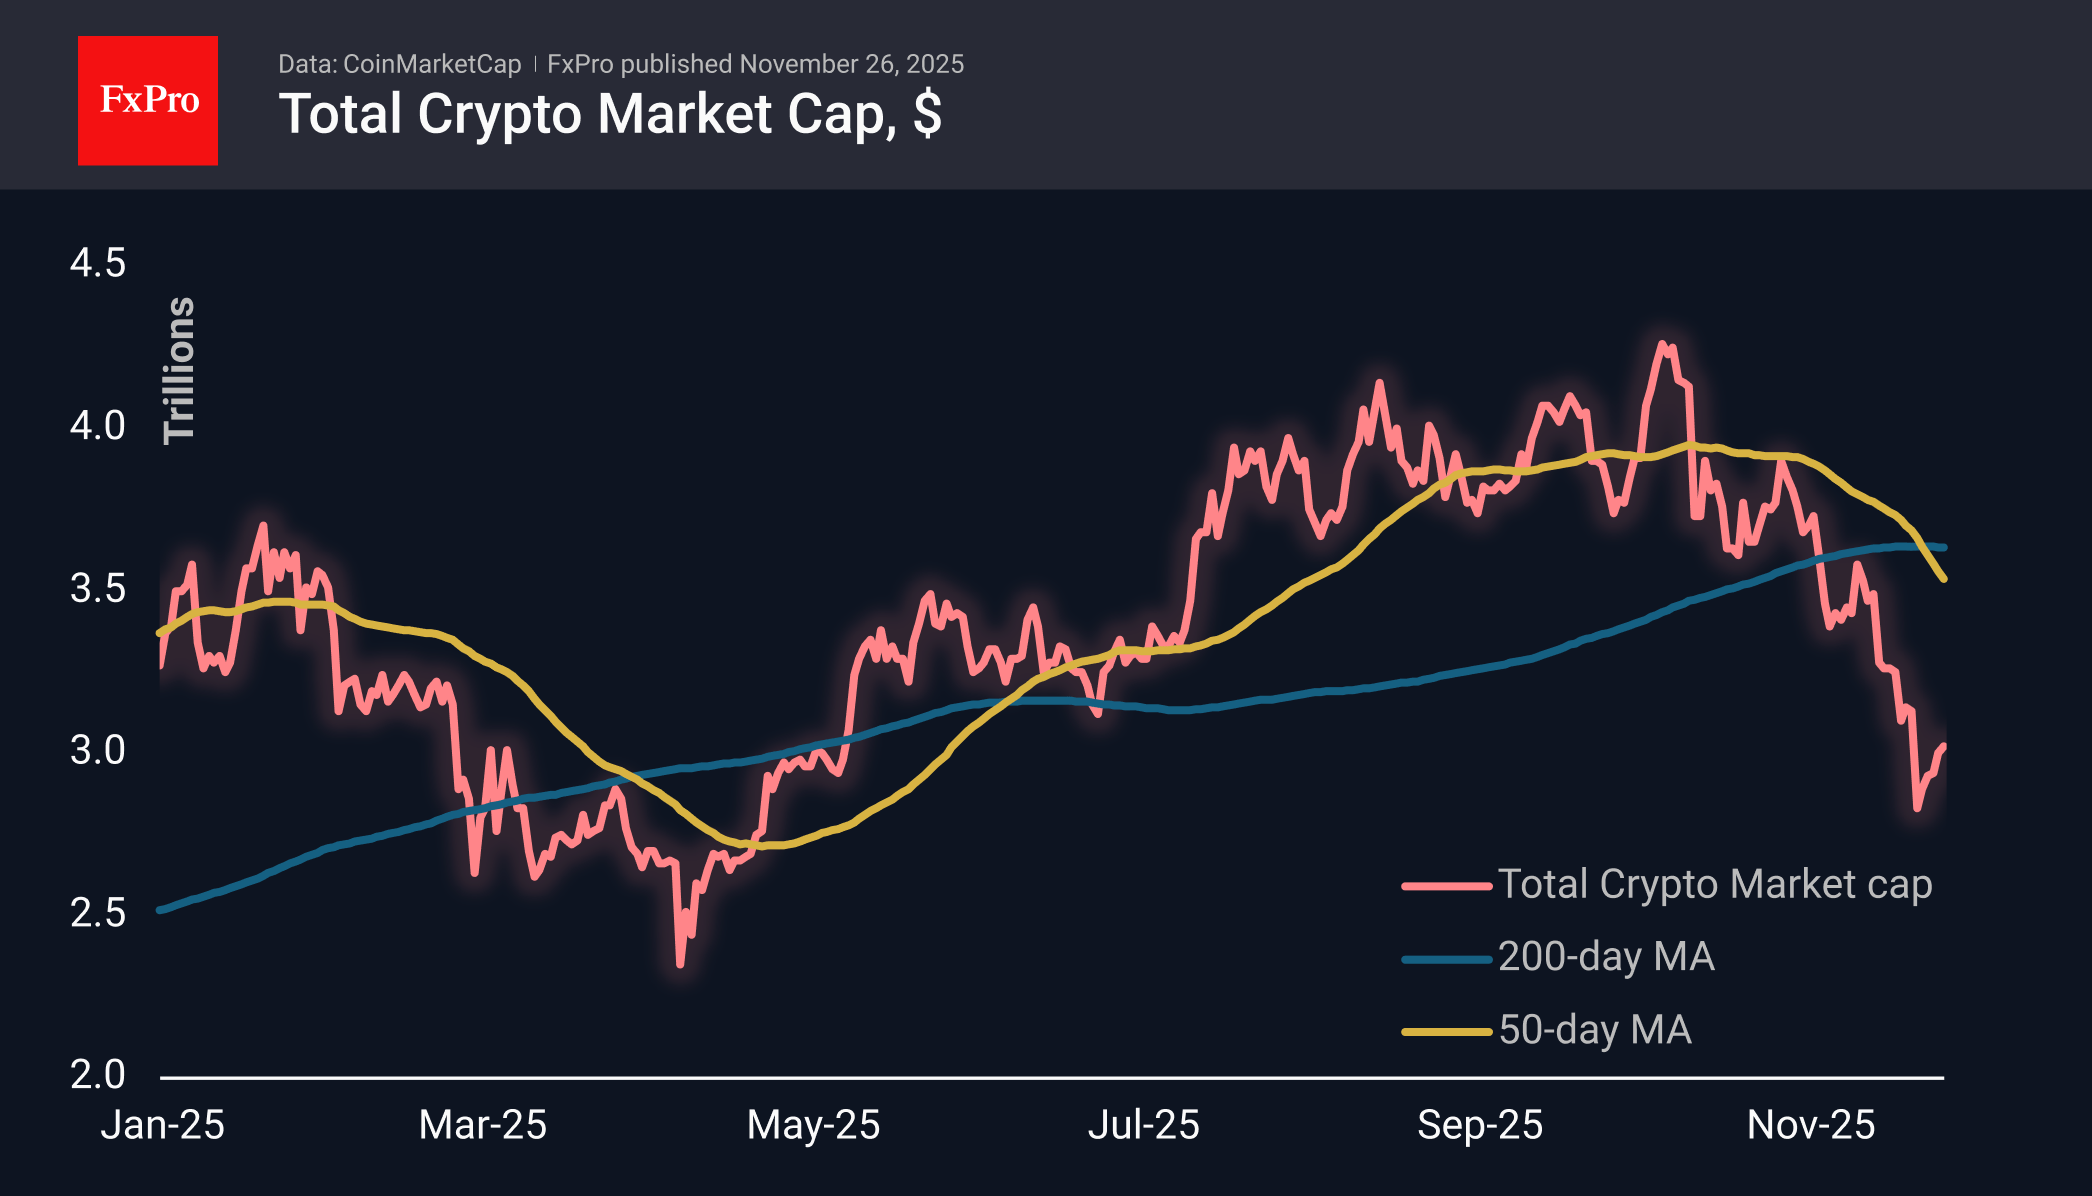
Bitcoin has been trading around $87K for the last three days. The recovery rebound has lost momentum, but the bears have not taken active action either, due to increased risk appetite in global markets and a moderate weakening of the dollar, which is an ideal breeding ground for cryptocurrencies. We continue to note the weakness of cryptos, given the favourable investment environment, which forces us to look for reasons in longer-term processes, such as profit-taking after the rapid growth of the last two years.
News Background
The fall in Bitcoin is linked to the reaction of institutional investors on Wall Street, who were unprepared for the sharp fluctuations in the asset, said Anthony Pompliano, founder of Pomp Investments. The situation is exacerbated by the end of the year: fund managers are concerned about bonuses and are selling assets they have begun to doubt.
According to CryptoQuant, Bitcoin’s risk-return ratio has become the most attractive since mid-2023. This does not guarantee that the bottom has been reached, but it does indicate high potential in the future.
In the first quarter of 2026, the first cryptocurrency may remain in the $82K-$90K range without sharp volatility, Citigroup bank suggested. After the October collapse of cryptocurrencies, investors’ appetite for risk has sharply declined.
According to The Block Data, the ratio of long and short positions on Bitcoin among major players on Binance exceeded 3.8, the highest figure in more than three years.
JPMorgan has opened sales of Strategy (MSTR) shares, according to TV presenter Max Keiser, but there has been no official confirmation of this. In October, the bank announced the risks of MSTR being excluded from key MSCI stock indices, which could lead to an outflow of $2.8 billion.
According to Cointab, 73% of public companies that have invested in Bitcoin have liquidity problems, and 39% have liabilities that exceed the value of their accumulated crypto assets.
GBP/USD Rises as Markets Await Crucial UK Budget
The GBP/USD pair extended its gains, reaching 1.3189, as investors await details of the UK budget, to be presented today, 26 November. All attention is on Chancellor Rachel Reeves and her strategy to close the fiscal deficit while adhering to the government's self-imposed budgetary rules. This challenge requires finding tens of billions of pounds in savings or revenue. Market volatility has been stoked by reports suggesting the government may avoid immediate tax increases.
The fiscal backdrop is deteriorating. According to media reports, the Office for Budget Responsibility (OBR) is preparing to lower its growth forecasts for 2026 and beyond. This revision could widen the budget deficit by £20–30 billion, intensifying the long-term pressure for tax rises.
Recent macroeconomic data underscores the economy's fragility. Public sector borrowing remains at record highs outside of the pandemic period, business activity is slowing, retail sales have contracted sharply, and consumer confidence is waning.
Amid this weak economic landscape, October's inflation reading fell to 3.6%, solidifying expectations for monetary policy easing. Markets are now pricing in an 80% probability of a 25-basis-point rate cut from the Bank of England in December.
Technical Analysis: GBP/USD
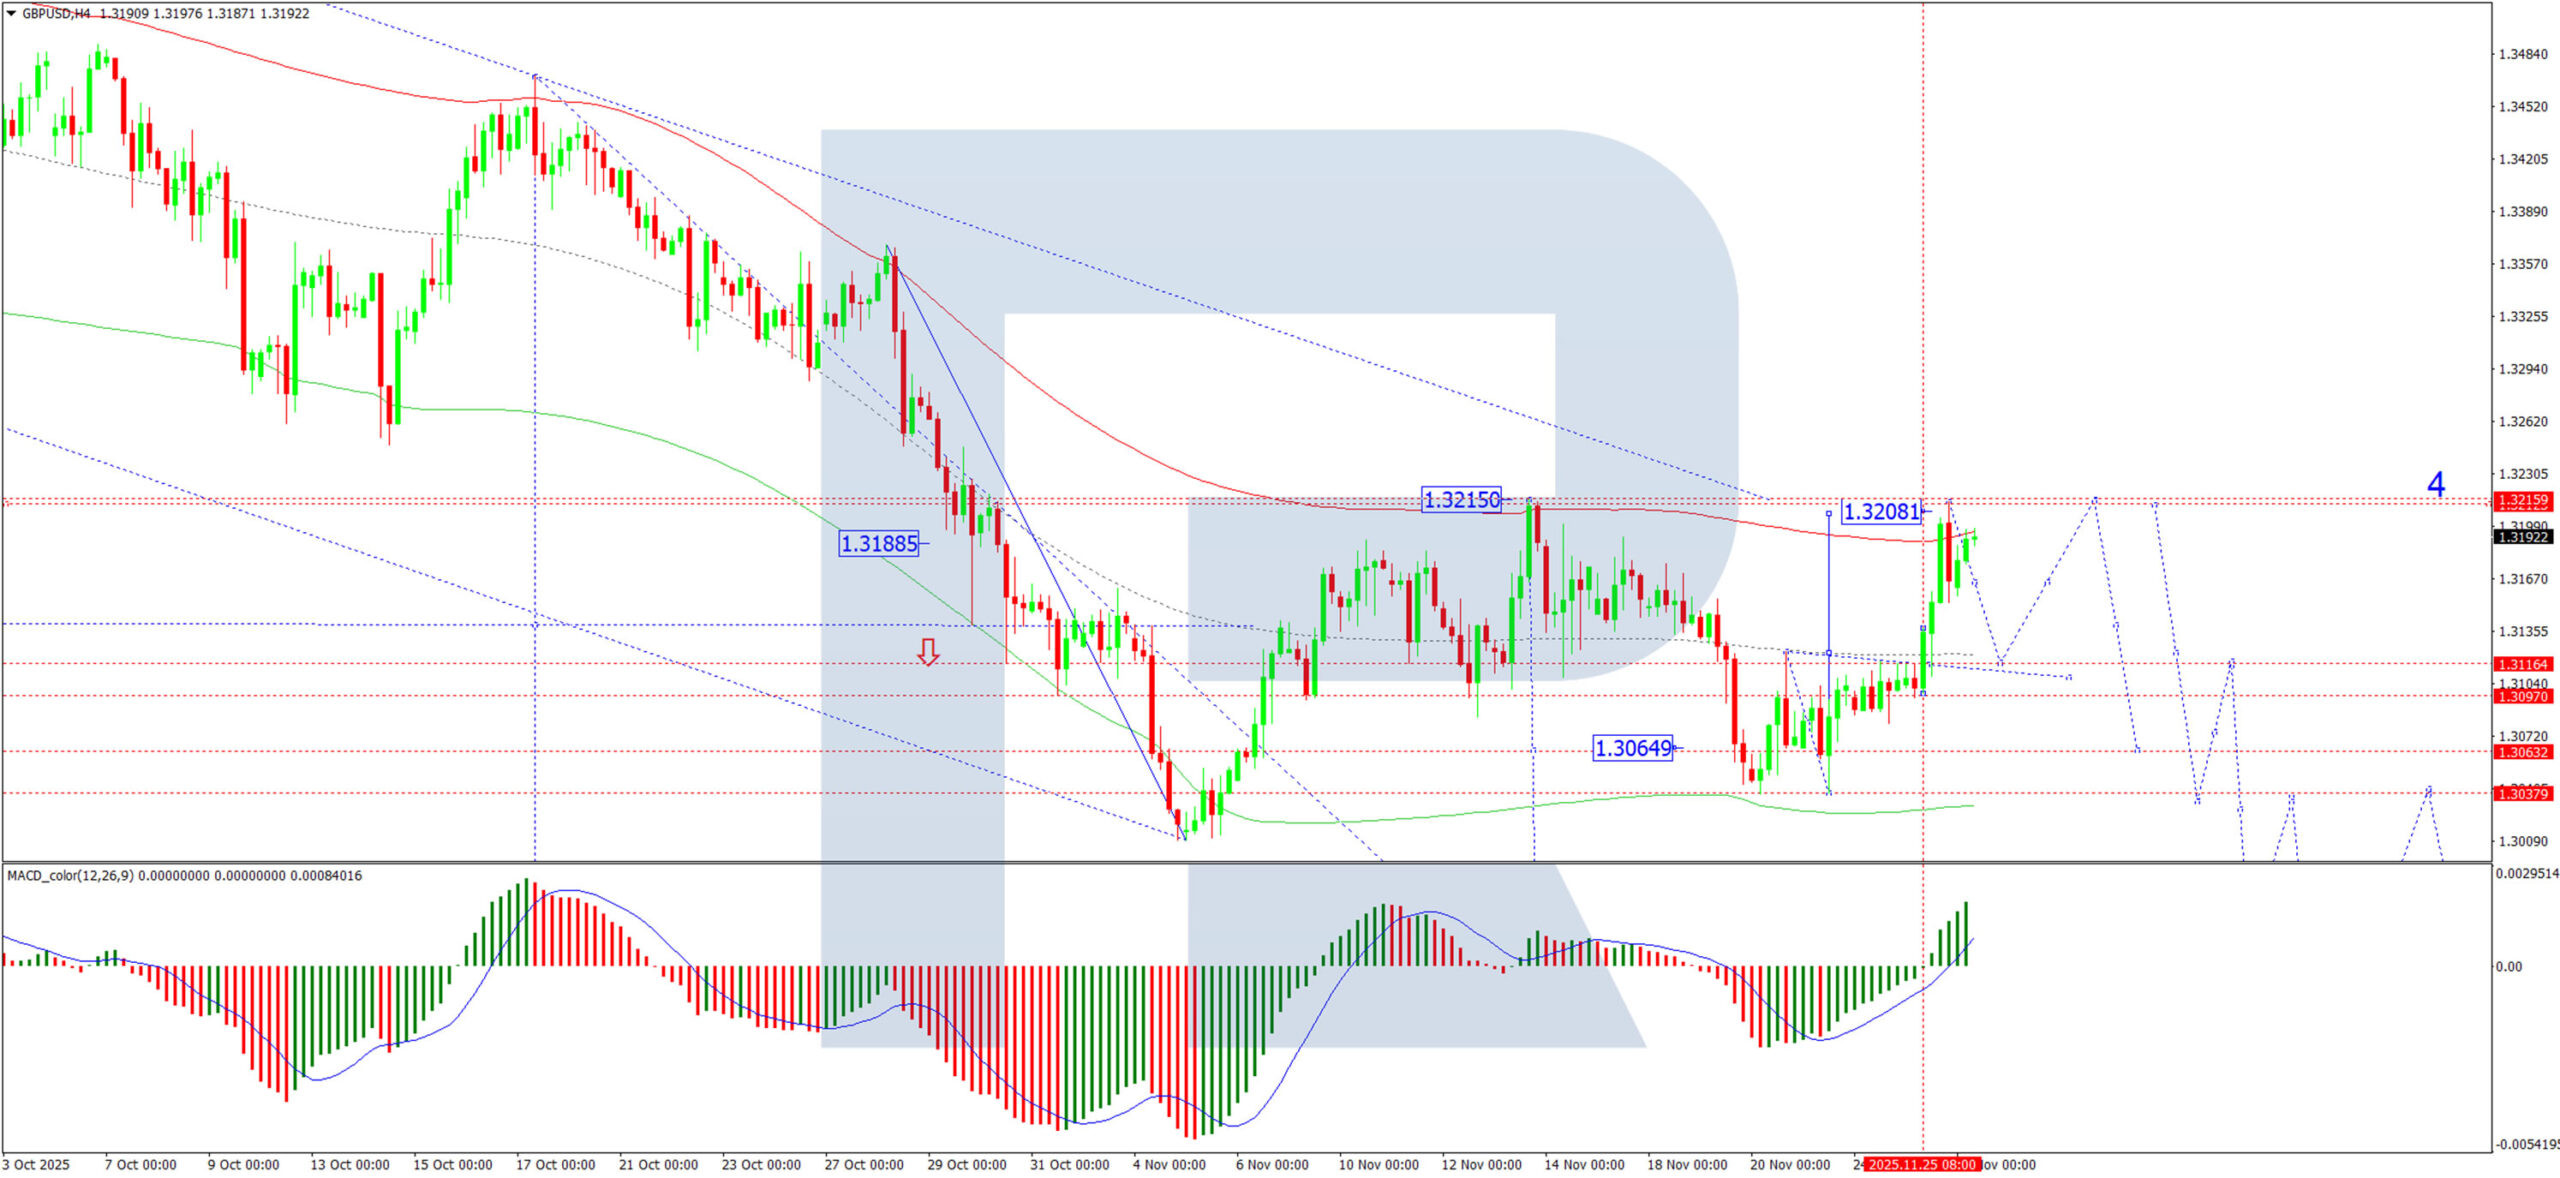
H4 Chart:
On the H4 chart, GBP/USD broke decisively above 1.3116, completing a corrective wave structure to 1.3210. We now anticipate a pullback to retest the 1.3116 level from above. Following this retest, a final leg of the correction could push the pair towards 1.3215.
Once this corrective phase is complete, the primary downtrend is expected to resume. The next key target for the subsequent wave of selling is at 1.2911. The MACD indicator supports this view; its signal line is above zero and pointing upwards, confirming the current corrective strength is likely a prelude to a new downtrend.
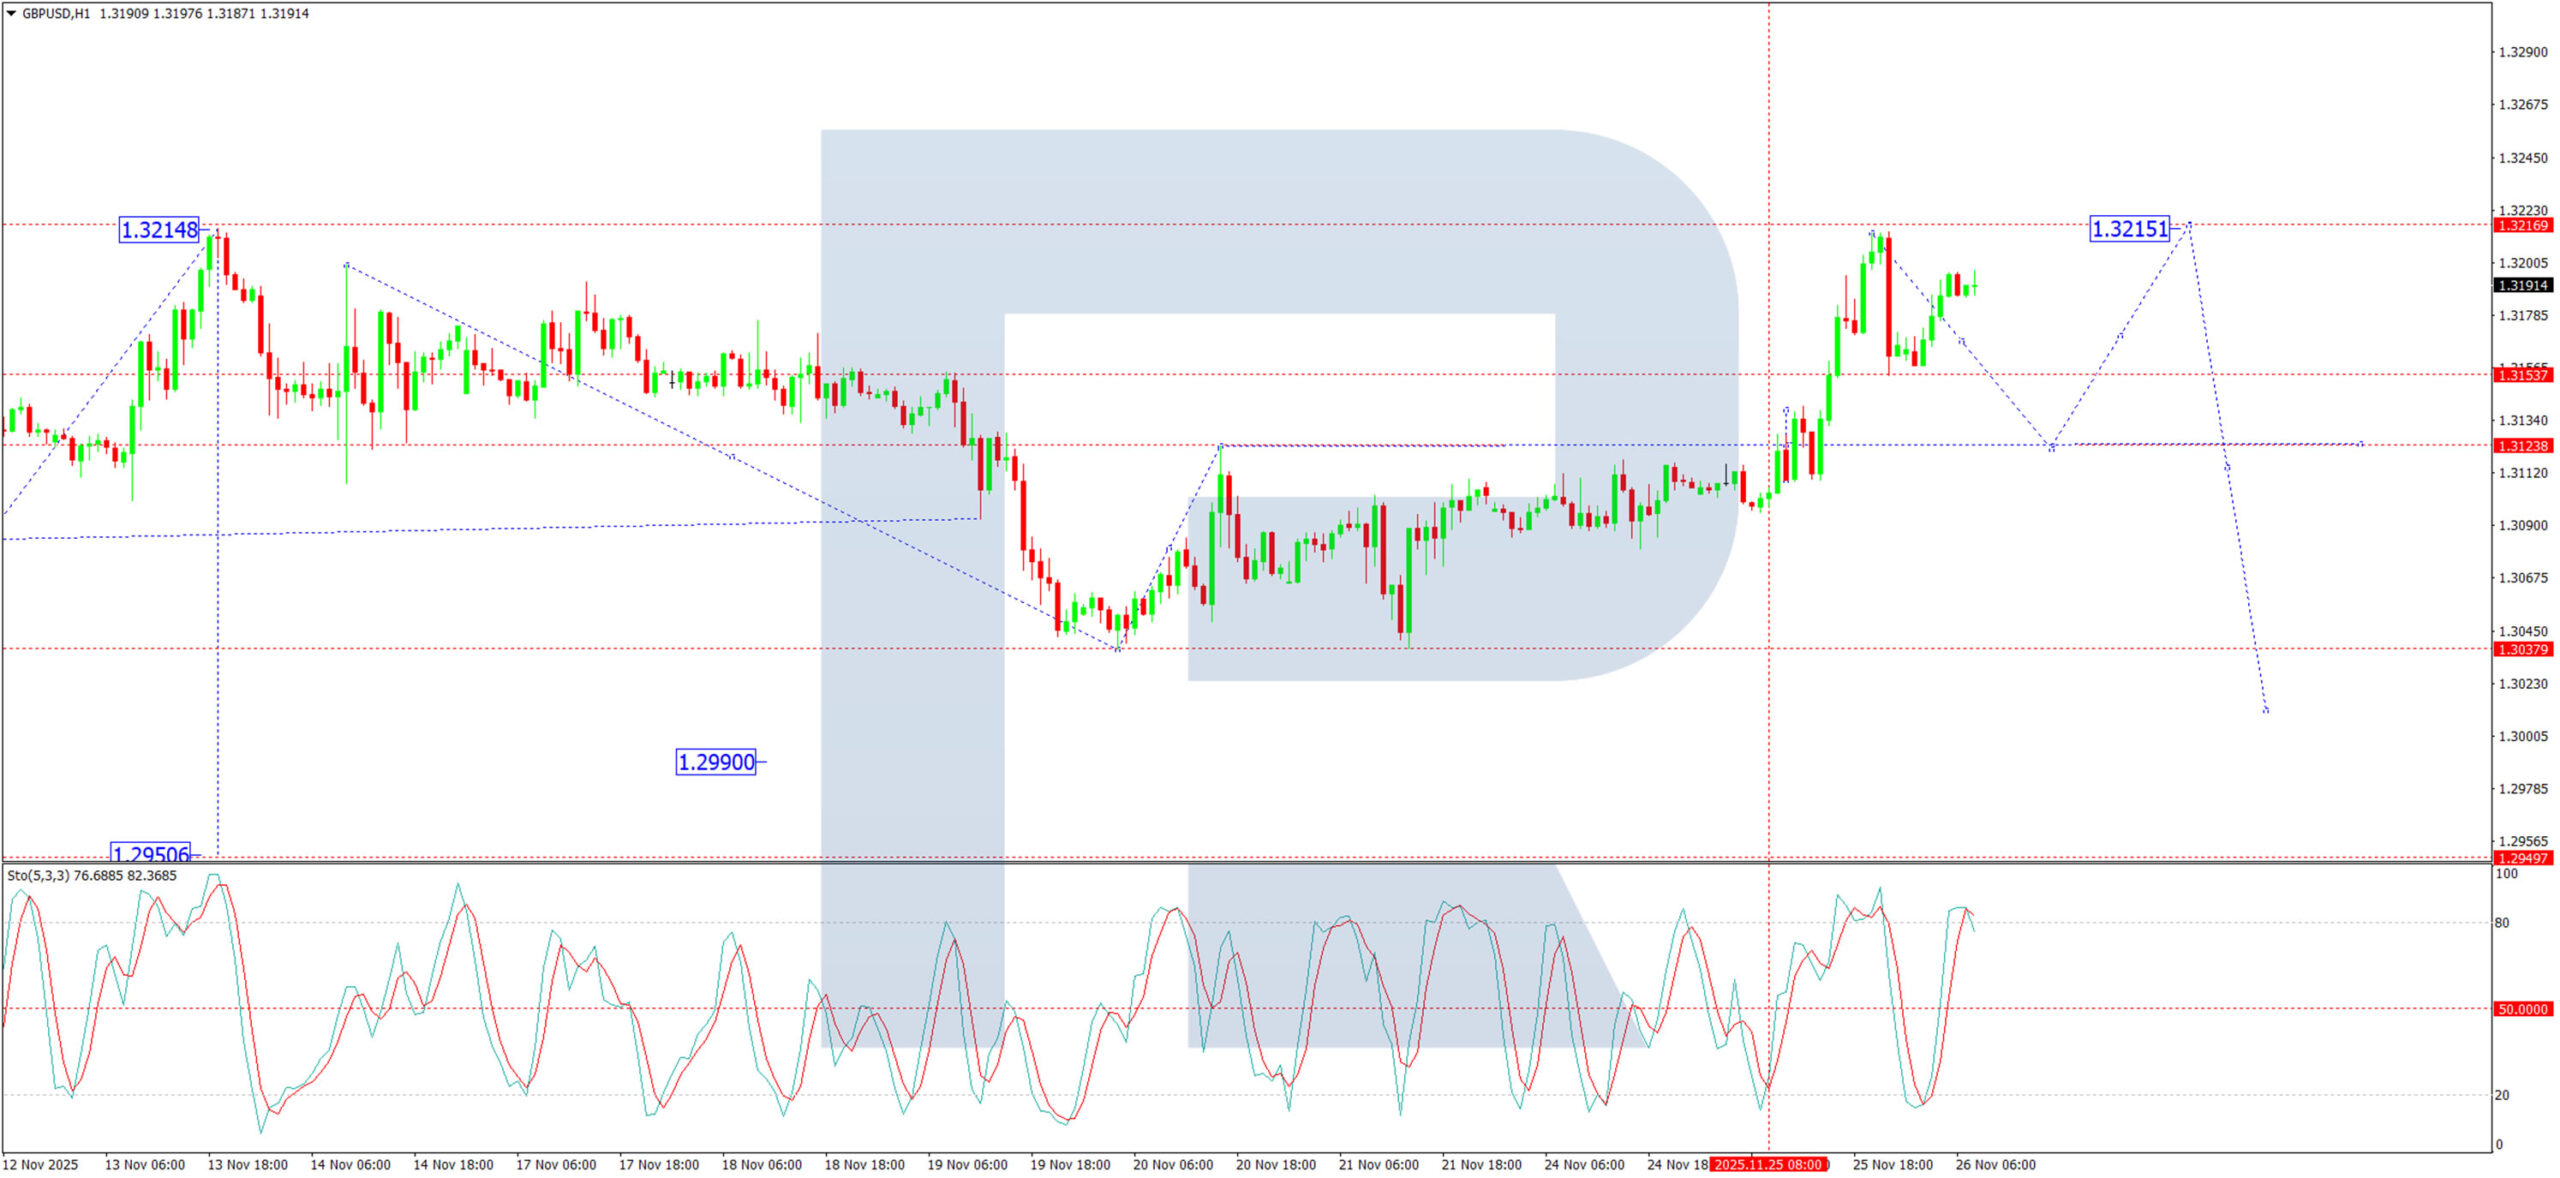
H1 Chart:
On the H1 chart, the pair broke upwards from a pronounced consolidation range around 1.3123, reaching its initial target at 1.3210. A decline to retest 1.3123 is now expected. This should be followed by a final upward push to 1.3215, at which point the corrective potential is likely to be exhausted.
We then forecast the start of a fifth and typically powerful wave of decline, targeting 1.2911. The Stochastic oscillator confirms this scenario. Its signal line is in overbought territory above 80 and is turning downwards, signalling that the current upward momentum is losing steam.
Conclusion
The pound's strength is fragile, driven by budget speculation rather than a shift in fundamentals. The pre-budget rally is viewed as a corrective bounce within a broader bearish trend. Technically, the pair is approaching a critical resistance zone near 1.3215. We anticipate this level will cap gains and present a selling opportunity, paving the way for a resumption of the downtrend with an initial target at 1.2911. The budget details and the BoE's subsequent December meeting will be key determinants of the pound's medium-term direction.
EUR/USD Rebounds Cautiously, USD/CHF Coils for Next Move
EUR/USD is attempting a recovery wave from the 1.1500 zone. USD/CHF climbed higher above 0.8050 and might correct some gains.
Important Takeaways for EUR/USD and USD/CHF Analysis Today
- The Euro declined toward 1.1500 before it started a recovery wave against the US Dollar.
- There was a break above a major bearish trend line with resistance at 1.1530 on the hourly chart of EUR/USD at FXOpen.
- USD/CHF climbed higher above 0.8050 and 0.8080 before it faced hurdles.
- There was a break below a bullish trend line with support at 0.8085 on the hourly chart at FXOpen.
EUR/USD Technical Analysis
On the hourly chart of EUR/USD at FXOpen, the pair extended the decline below 1.1550. The Euro even declined below 1.1520 before the bulls appeared against the US Dollar.
The pair tested 1.1490 and recently started a recovery wave. There was a move above 1.1520 and 1.1550. The pair climbed above the 50% Fib retracement level of the downward move from the 1.1653 swing high to the 1.1491 low.
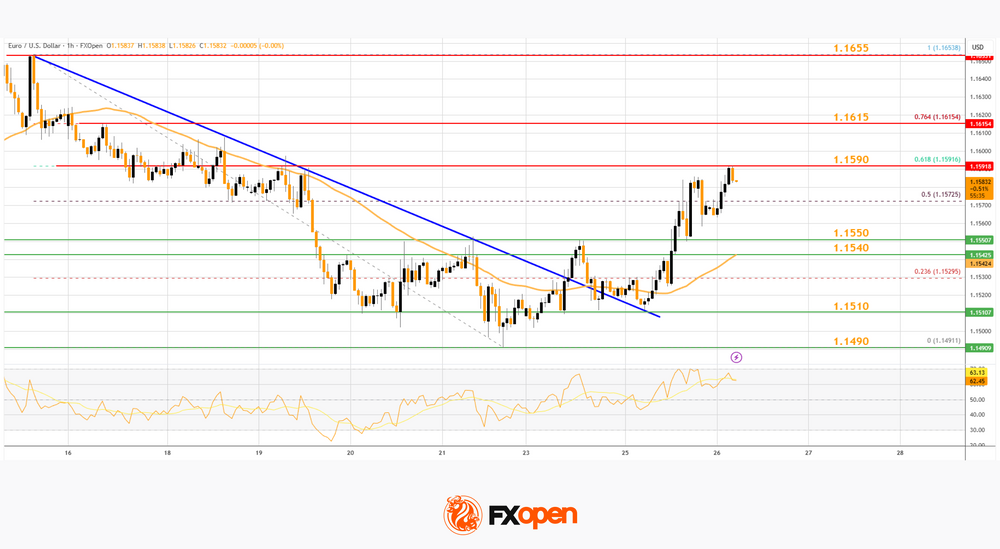
More importantly, there was a break above a major bearish trend line with resistance at 1.1530. The pair is now trading above 1.1575 and the 50-hour simple moving average. Immediate hurdle on the EUR/USD chart is near the 61.8% Fib retracement at 1.1590.
The first key breakout zone sits at 1.1615. An upside break above 1.1615 might send the pair toward 1.1655. Any more gains might open the doors for a move toward the 1.1700 zone. If there is a fresh decline, the pair might find bids near 1.1550.
The next major support is 1.1540. A downside break below 1.1540 could send the pair toward 1.1510. Any more losses might send the pair to 1.1490.
USD/CHF Technical Analysis
On the hourly chart of USD/CHF at FXOpen, the pair started a decent increase from 0.7940. The US Dollar climbed above the 0.8000 handle against the Swiss Franc.
The bulls were able to pump the pair above the 50-hour simple moving average and 0.8050. Finally, the pair tested 0.8100. A high was formed near 0.8101 and the pair is now consolidating gains. The pair dipped below the 23.6% Fib retracement level of the upward move from the 0.7937 swing low to the 0.8101 high.
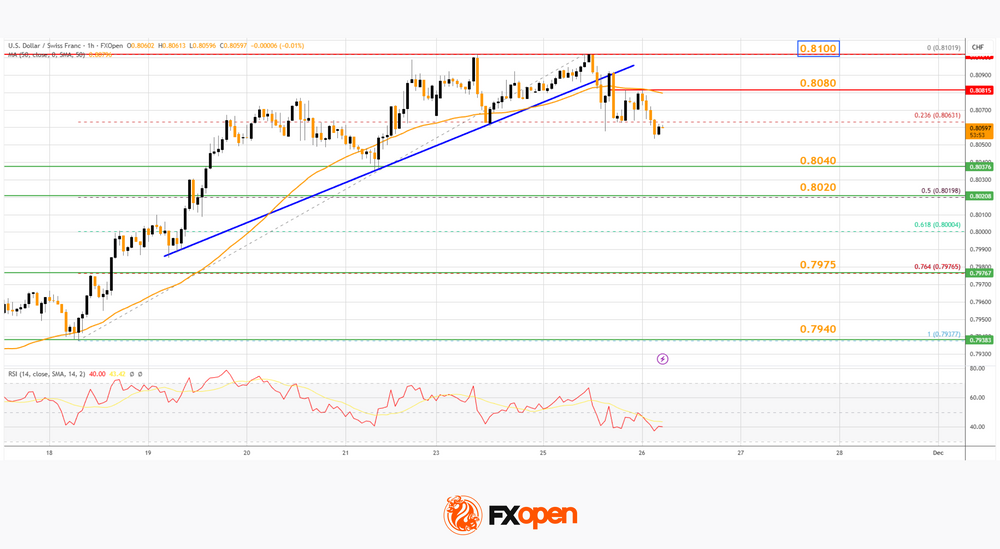
Besides, there was a break below a bullish trend line at 0.8085. On the downside, immediate support on the USD/CHF chart is near 0.8040. The first key area of interest might be near the 50% Fib retracement at 0.8020.
A downside break below 0.8020 might call for a drop to 0.7975. Any more losses may possibly open the doors for a move toward 0.7940.
On the upside, the pair could struggle near 0.8080. The first major barrier for bulls is 0.8100. If there is a clear break above 0.8100 and the RSI climbs above 50, the pair could start another increase. In the stated case, it could test 0.8150.
Trade over 50 forex markets 24 hours a day with FXOpen. Take advantage of low commissions, deep liquidity, and spreads from 0.0 pips. Open your FXOpen account now or learn more about trading forex with FXOpen.
This article represents the opinion of the Companies operating under the FXOpen brand only. It is not to be construed as an offer, solicitation, or recommendation with respect to products and services provided by the Companies operating under the FXOpen brand, nor is it to be considered financial advice.
Nasdaq 100 Ahead of the Holidays
As the chart shows, the Nasdaq 100 (US Tech 100 mini on FXOpen) has rebounded from its roughly 2.5-month low recorded on 21 November. At that point, bearish sentiment was driven by fears of an “AI bubble”, expectations of higher interest rates, and other news-related pressures.
The recovery from that level was strong — in less than a week the index gained around 5.3%, signalling robust demand. This not only offsets last week’s concerns but also injects optimism into the near-term outlook.
Technical Analysis of the Nasdaq 100 Chart
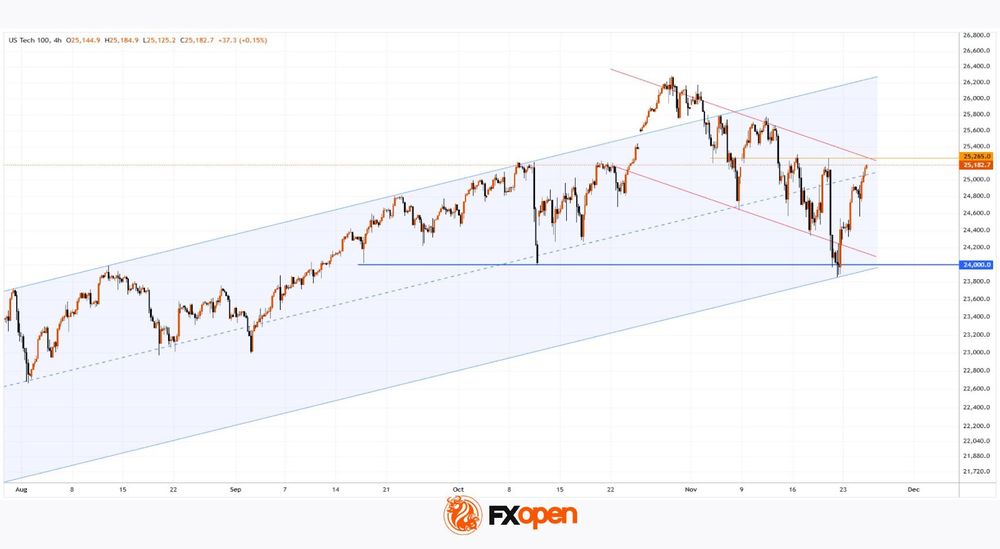
Examining recent price action in the Nasdaq 100 (US Tech 100 mini on FXOpen), we can outline an ascending channel in which:
→ the median line acted as support until mid-November;
→ support at the lower boundary helped form the 21 November low.
From the perspective of buying pressure:
→ The November dip appears to be an intermediate correction within a broader emerging uptrend.
→ The brief move below the psychological 24k level (where the notable September and October lows lie) resembles a Liquidity Grab pattern, suggesting so-called Smart Money may have used sellers’ liquidity to build long positions — a sign of bullish intent.
From the perspective of selling pressure:
→ the market remains within a corrective structure (highlighted in red);
→ today, the Nasdaq 100 (US Tech 100 mini on FXOpen) is trading near 25,265, a level that acted as resistance on 17–20 November.
It is possible that trading near the channel’s median line will encourage a balance between buying and selling forces — just as market participants head off to celebrate Thanksgiving.
Trade global index CFDs with zero commission and tight spreads. Open your FXOpen account now or learn more about trading index CFDs with FXOpen.
This article represents the opinion of the Companies operating under the FXOpen brand only. It is not to be construed as an offer, solicitation, or recommendation with respect to products and services provided by the Companies operating under the FXOpen brand, nor is it to be considered financial advice.