Sample Category Title
(RBNZ) OCR lowered to 2.25%
Media release
Annual consumers price inflation increased to 3 percent in the September quarter. However, with spare capacity in the economy, inflation is expected to fall to around 2 percent by mid-2026.
Economic activity was weak over mid-2025 but is picking up. Lower interest rates are encouraging household spending, and the labour market is stabilising. The exchange rate has fallen, supporting exporters’ incomes.
Global economic growth has benefited from strong AI-related investment but is expected to slow in 2026 as trade barriers weigh on activity.
Risks to the inflation outlook are balanced. Greater caution on the part of households and businesses could slow the pace of New Zealand’s economic recovery. Alternatively, the recovery could be faster and stronger than expected if domestic demand proves more responsive to lower interest rates.
The Committee voted to reduce the OCR by 25 basis points to 2.25 percent. Future moves in the OCR will depend on how the outlook for medium-term inflation and the economy evolve.
Summary record of meeting – November 2025
Annual consumers price inflation increased to 3 percent in the September quarter, the top of the Monetary Policy Committee’s 1 to 3 percent target band. Significant spare capacity remains in the economy and inflation is expected to fall to around 2 percent by mid-2026. The significant reduction in the OCR since August 2024 is expected to support a recovery in economic activity.
Annual inflation is at the top of the target band but expected to moderate
The Committee noted that both core and non-tradables inflation have continued to decline. Annual tradables inflation increased in September due to petrol prices and high food inflation but is expected to decline over the medium term. Annual headline CPI inflation increased due to higher tradables inflation along with high inflation in household energy costs and local council rates. As these dissipate, this will support headline CPI inflation returning to near the 2 percent mid-point of the target range in mid-2026.
Household inflation expectations have fallen but remain high relative to recent history. The inflation expectations of professional forecasters and business leaders have remained stable at slightly above the 2 percent target midpoint.
The economic recovery stalled in the June quarter
Committee members considered how US tariff policy announcements and broader geoeconomic uncertainty disrupted New Zealand’s nascent economic recovery. Greater uncertainty likely led to increased precautionary behaviour by households and businesses, dampening consumption and investment.
However, while measured GDP declined by 0.9 percent in the June quarter, this likely overstates the weakness in the economy through this period. The Committee noted that an unusually large seasonal balancing item contributed to the weakness in the headline figure. This is expected to be reversed over the next few data releases.
Some industry-specific factors may also have constrained supply. For example, high milk prices and unfavourable weather conditions likely contributed to higher livestock retention and lower meat production in the first half of 2025. Limited access to domestic energy sources and higher energy prices are likely to have weighed on manufacturing more generally.
Significant spare capacity remains
The Committee discussed the balance between supply capacity and demand. In addition to short-run factors, the economy’s medium-term supply capacity has been reduced by weak growth in productivity and the working age population. Estimates suggest that annual potential output growth is currently around 1.5 percent.
Weak economic activity has resulted in significant spare capacity opening in the economy since mid-2024. Unemployment and measures of labour underutilisation have increased, and firms are reporting that it is now relatively easy to find workers. While job losses are not high compared to past economic downturns, job vacancies and job transitions have been low, so it has been relatively difficult for unemployed people to transition back to work.
Economic conditions have been variable across different sectors and regions of the economy. High prices for New Zealand’s commodity exports have lifted incomes in the rural economy. This has supported economic activity in rural areas, although debt reduction by farmers has meant measures of on-farm investment have not yet increased to the extent seen in previous commodity price cycles. The level of economic activity remains low in industries reliant on domestic demand.
Financial conditions have eased and the financial system remains stable
The Committee discussed the easing in domestic financial conditions that has occurred. Wholesale interest rates have declined and the New Zealand dollar Trade Weighted Index has depreciated since August. Cuts to the OCR have reduced borrowing costs and mortgage rates. The average yield on mortgages has fallen to 5.4 percent. With close to 40 percent of fixed rate mortgages due to reprice over the December and March quarters, the average mortgage yield is expected to fall further to 4.7 percent by September 2026 based on current market pricing.
Measures of domestic financial stress have eased as lower interest rates reduce debt servicing pressures. Early arrears, which provide an early indicator of impaired lending, have declined. Non-performing housing loans have also declined, and banks expect further reductions in housing and commercial property impairments over 2026. Non-performing loans in the business sector remain elevated, although at lower levels than in previous downturns.
Economic activity is recovering
Committee members discussed an improvement in near-term indicators of economic activity from their lows in the June quarter, suggesting a return to modest GDP growth in the September quarter. Feedback from recent business visits also suggest that, while activity remains weak, demand has stabilised.
The Committee noted that there are also some early signs of stabilisation in labour demand, with job vacancies and total hours worked increasing in the September quarter. This is expected to broaden into a wider improvement in labour market conditions over coming quarters, which will support household confidence and spending.
Relative weakness in the labour market over the past two years has contributed to higher outward migration from New Zealand, particularly to Australia. Regional disparities in housing and labour markets have also likely encouraged higher internal migration. Outward migration is expected to reduce as the New Zealand economy and labour market recovers, with net migration expected to increase towards long-run trends.
Future growth in house prices is expected to be moderate
Members discussed that house prices, in aggregate, have remained stable to date despite lower mortgage interest rates and a modest pick-up in housing market activity. Stable house prices could reflect weak population growth and elevated long-term interest rates. Supply side reforms in the housing market, such as less restrictive zoning laws, may also be moderating the extent to which increases in housing demand contribute to house price inflation.
The Committee assessed that upcoming reductions in mortgage loan-to-value ratio requirements are unlikely to have a material effect on house prices, especially with debt-to-income restrictions now in place. House price growth is expected to be moderate over the projection period, broadly in line with growth in nominal incomes.
Global growth has been resilient but is expected to slow
Members noted that tariffs have had less impact on the global economy than initially expected, reflecting the imposition of lower tariff rates than originally envisaged, inventory management, and adjustments in global supply chains. Global growth has also been supported by higher investment in artificial intelligence technology, particularly in the US, which has boosted exports from Asia. Higher demand for exports has supported economic growth in China, despite weakness in domestic demand.
Global growth is expected to slow modestly in 2026. This reflects an anticipated weakening in global export demand as the pace of AI investment slows. The Committee still expects trade barriers to weigh on global economic activity and to have a modest disinflationary effect on New Zealand.
Risks to the outlook for inflation are balanced
The Committee discussed the risk that price setting behaviour by businesses may become more sensitive to upside inflation surprises, given recent high inflation and inflation expectations remaining above the target mid-point. Spare capacity in the economy has reduced business profit margins and some restoration in margins is expected as demand improves. This restoration in margins could occur more rapidly than anticipated, which would pose an upside inflation risk.
Members noted there are risks around the speed of the recovery. Some members highlighted the risk that continued caution on the part of households and businesses could further slow the recovery in domestic demand, which could see inflation fall below the target midpoint. Conversely, other members highlighted the possibility of a faster recovery if house prices and household spending increase more quickly than assumed given lower mortgage rates, leading to more persistence in medium-term inflation pressures. Members also discussed the possibility of a stronger increase in on-farm investment stemming from high export commodity prices and the expected return of capital to dairy farmers in 2026 from the sale of Fonterra’s consumer brands business.
The Committee discussed risks to the global outlook. Investment in AI technologies has been a significant driver of global growth and equity returns over the past year. Uncertainty remains around the returns from AI adoption. There is a risk of a more significant correction in equity markets and reduced investment if heightened investor expectations are not met.
Inflation remains high in several advanced economies. Global policy uncertainty also remains high. The Committee noted downside risks to growth in China, as policy makers attempt to maintain growth in the face of weak domestic demand and an increasingly fragmented global trading environment. The Committee also noted uncertainty about US economic policy, and the associated risk of higher US inflation.
The Committee discussed the risk that unsustainable fiscal dynamics and increased politicisation of central banks globally could create the conditions for higher and more persistent inflation.
The Committee voted to lower the OCR to 2.25 percent
The Committee discussed the options of holding the OCR at 2.5 percent and lowering the OCR to 2.25 percent, noting low tolerance for prolonging the return of inflation to the target mid-point.
The case for holding the OCR emphasised the considerable reduction in the OCR to date, which is still working its way through the economy. Economic indicators are recovering, and economic activity is expected to strengthen through 2026. Particular emphasis was placed on the upside risks to inflation and output. Leaving the OCR unchanged at this meeting would provide the optionality to lower the OCR in the future if required.
The case for a further reduction in the OCR emphasised significant excess capacity in the economy. This provides confidence that medium-term inflation will return to, and remain around, the target midpoint. The economic recovery is at an early stage, and the inflation outlook provides scope to place more emphasis on avoiding unnecessary volatility in output and employment. With this context, retention of the easing in overall monetary conditions delivered to date would support an enduring recovery in economic activity.
The Committee discussed how to balance the achievement of their inflation mandate with the need to avoid unnecessary instability in output, employment, interest rates and the exchange rate.
On Wednesday 26 November the Committee voted by 5 to 1 to reduce the OCR by 25 basis points to 2.25 percent. The Committee noted that a reduction in the OCR would help to underpin consumer and business confidence and lean against the risk that the economy recovers more slowly than needed to meet the inflation objective.
Future moves in the OCR will depend on how the outlook for medium-term inflation and the economy evolves.
Attendees:
MPC members: Christian Hawkesby (Chair), Carl Hansen, Hayley Gourley, Karen Silk, Paul Conway, Prasanna Gai
Treasury Observer: James Beard
MPC Secretary: Chris Bloor
US Dollar Takes a Hit as Dovish Fed U-Turn Boosts AUD, EUR, and JPY Outlook
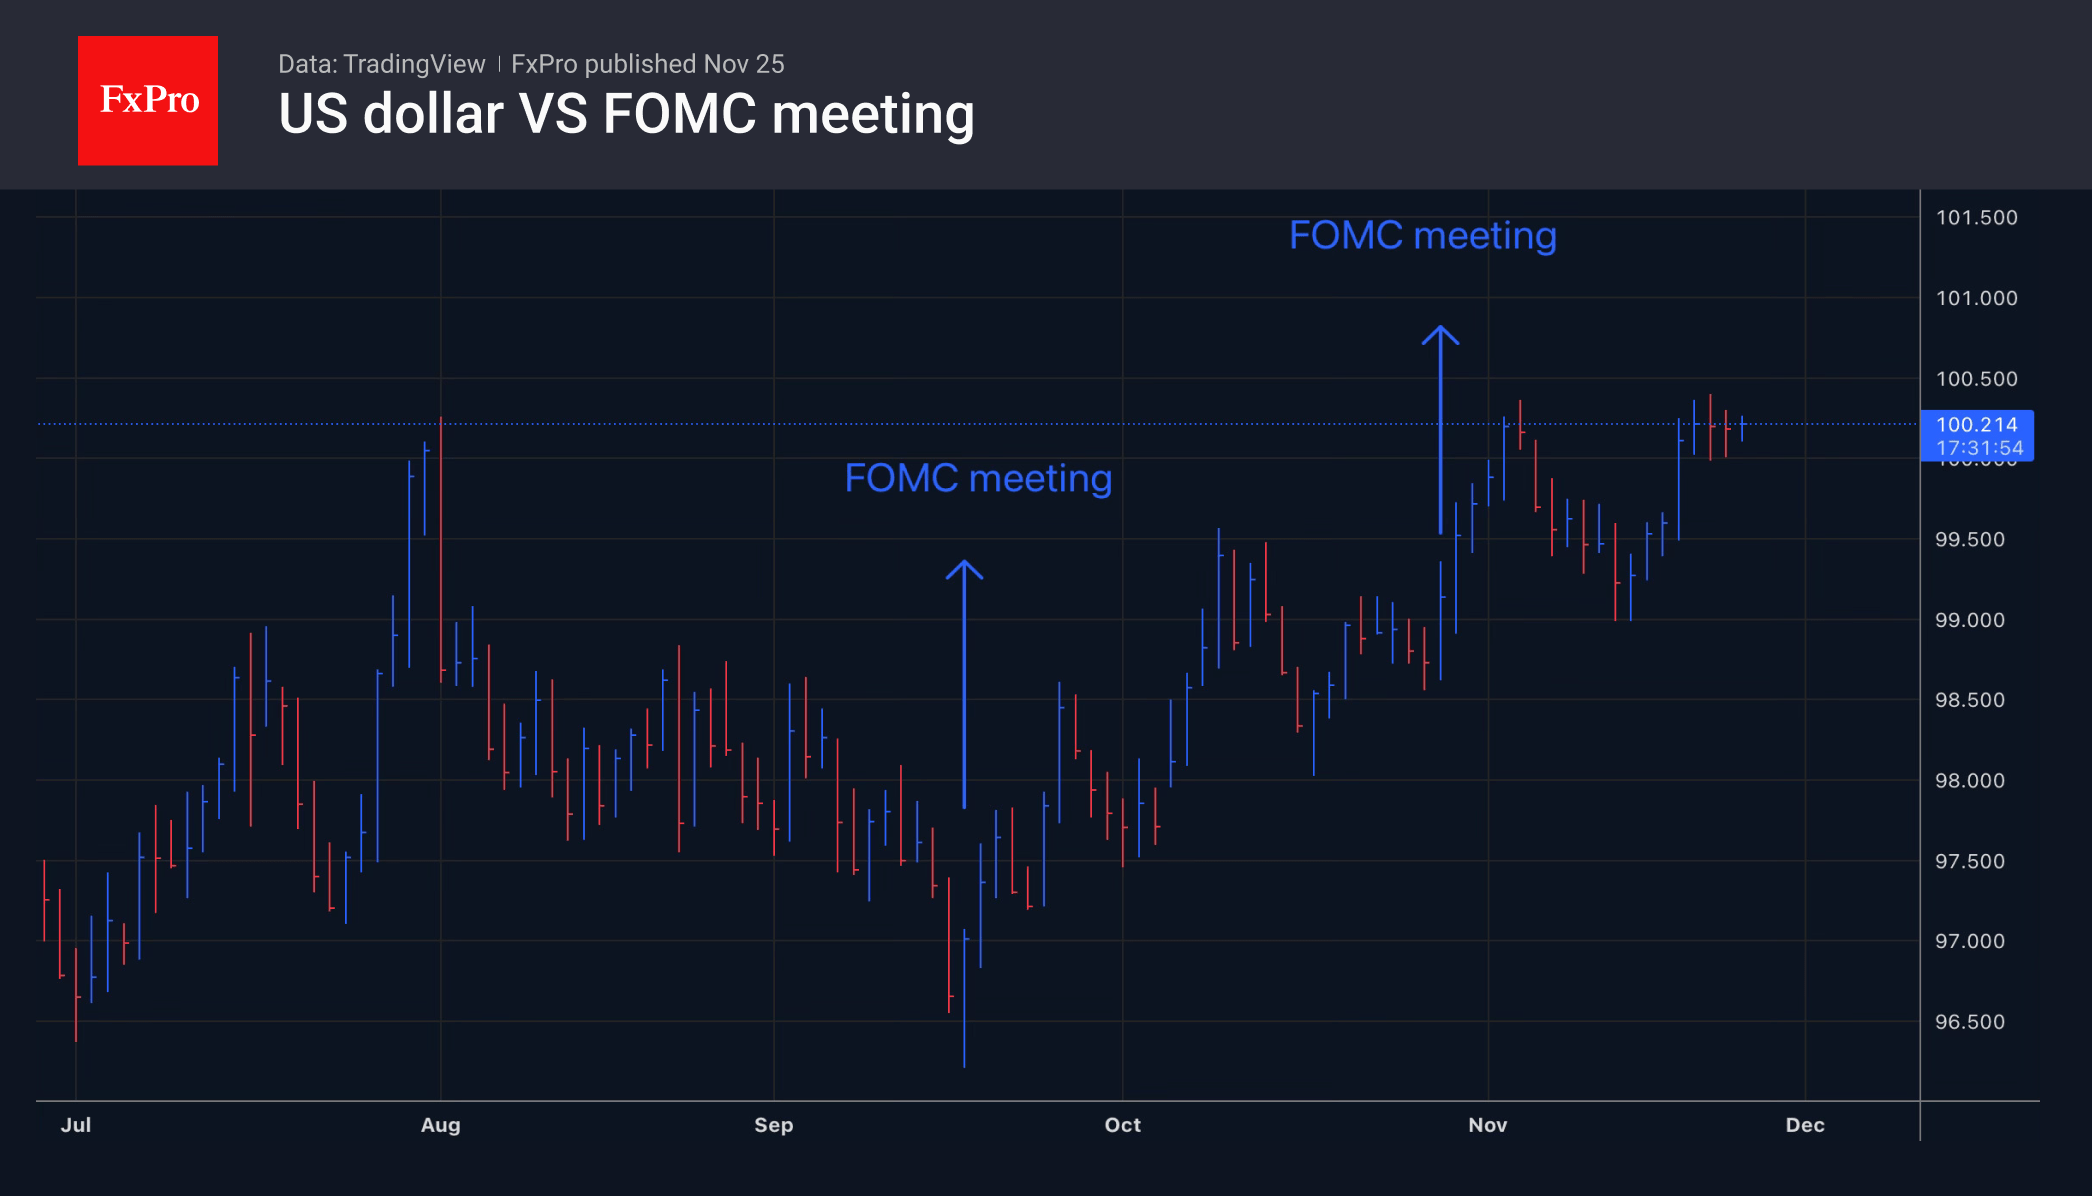
Strongest Major currency of the past month, the Dollar had swept through most of its peers powered by a hawkish repricing, assumed by the Market after Powell's speech at the October 29th FOMC (You can access it right here).
The Federal Reserve Chair made many more mentions of their dual mandate to monitor both Employment and Inflation compared to the September meeting which had seen a tilt towards employment (meaning tariffs were posing an issue yet again).
The rough numbers and downward revisions to NFP in August and many other labor releases had warranted such a dovish turn from the Fed during the early Summer, but also caught people by surprise when data did not continue to worsen consequently – Explaining by the way the steep rally from 97.50 all the way to above 100.00 in the Dollar Index.
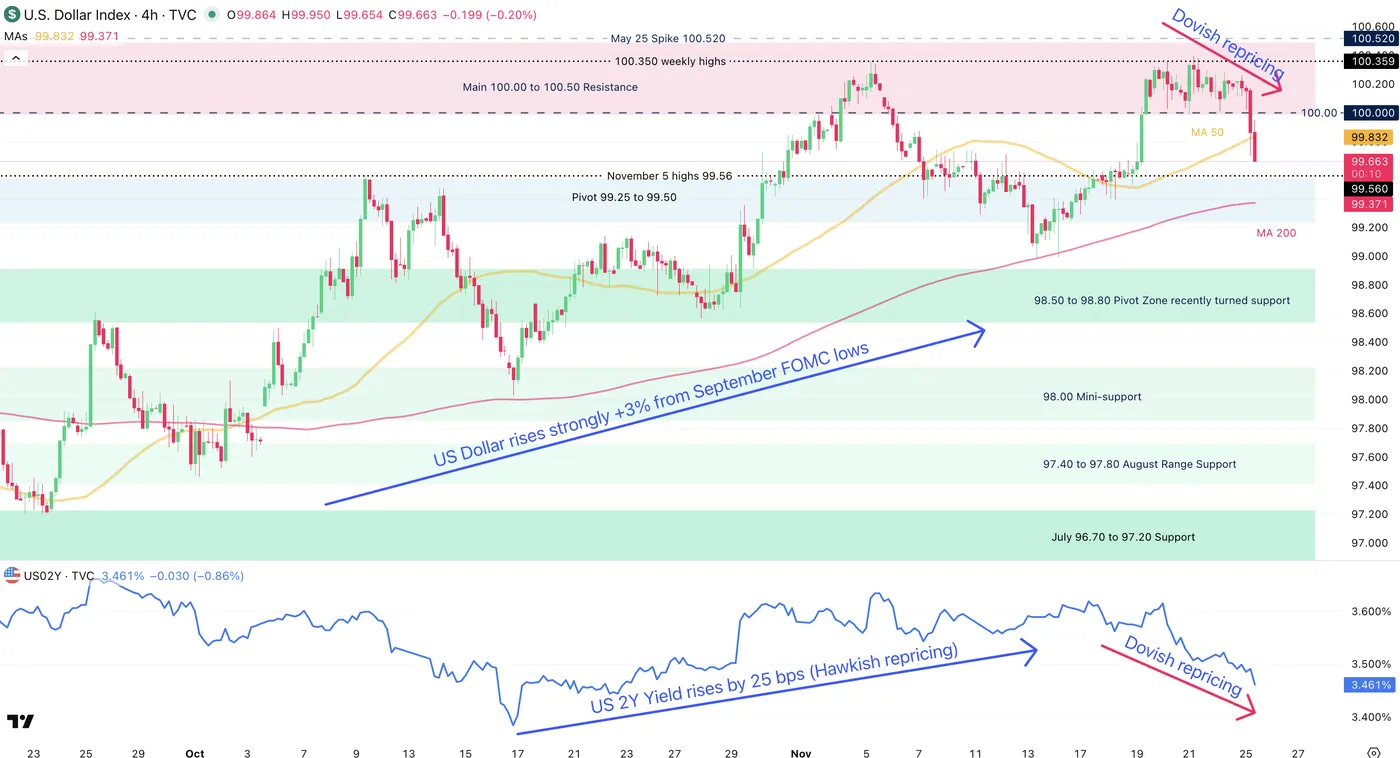
Dollar Index (DXY) since end-September 2025 (top panel) with US 2-Year Yield (bottom panel) – Source: TradingView
Turning to today, late releases from the Bureau of Labor Statistics haven't corroborated with a high inflation and better employment picture; Quite the opposite actually:
Despite better Jobless Claims last Thursday, consecutive misses in US Retail Sales (particularly ex. Auto and Gas at 0.1% vs 0.4% exp), PPI (Headline as expected, but a 0.1% miss on the Core) and Private Labor Data (-13.5K vs -2.5K previous) confirmed the more protective tone from Fed's Williams at his speech last Friday.
Since the end of last week, the Pricing for a 25 bps cut consequently went from lows of 20% all the way to the current 85%.
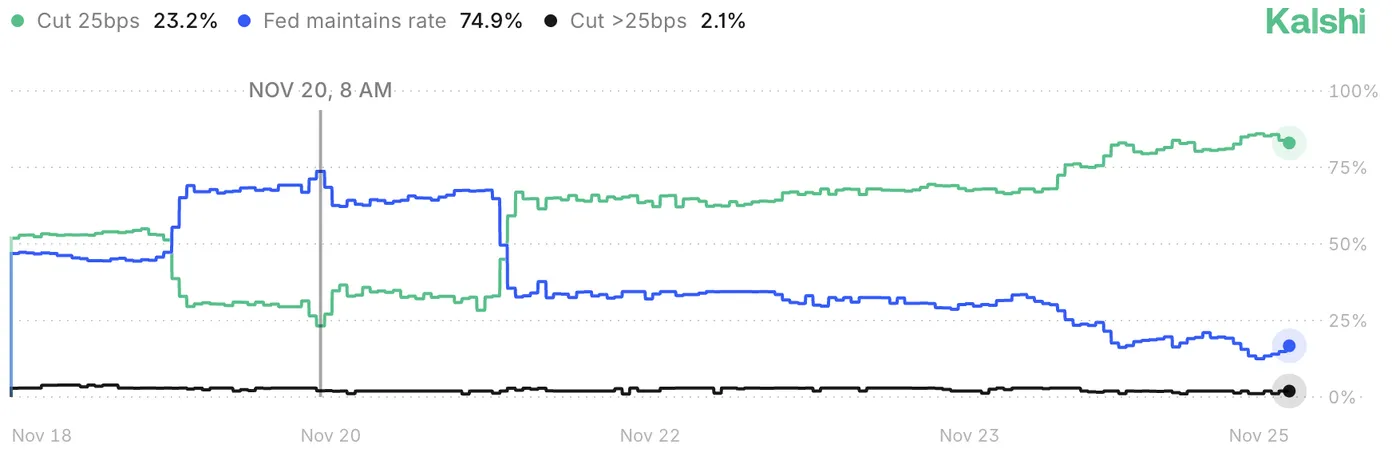
Evolution of the Fed's Rate Cut odds, November 25, 2025 – Source: Kalshi
Let's have a look at a few intraday FX Major Pairs (USD/JPY, EUR/USD and AUD/USD) to see how the turn in the pricing for the December 10 meeting led to strong reversals.
USD/JPY – Is the Squeeze done?
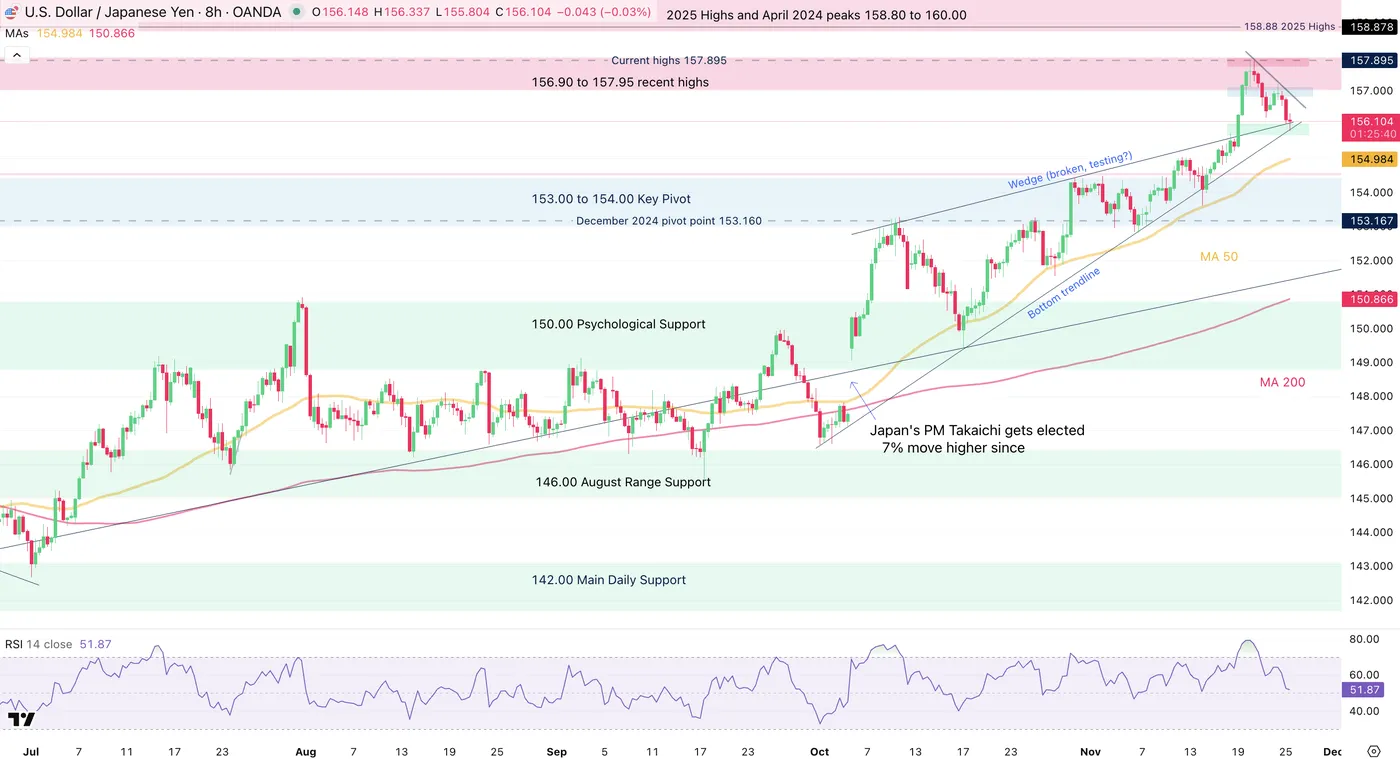
USD/JPY 8H Chart. November 25, 2025 – Source: TradingView
USD/JPY, subject to a 10,000 pip, one-way up-move since beginning October, has just initiated a turn lower since the speech from Fed's Williams.
A monetary policy convergence trade (where rates differential between US –at 4% – and Japan –at 0.5%– bearish for the pair had been put on the side after PM Takaichi's appointment.
However, the Bank of Japan is showing their teeth after the one-sided move, pointing towards a potential rate hike in December to help the yen.
Fears of intervention which could come during Thanksgiving have also calmed the squeeze.
Currently at 156.00 after reaching 158.80, the pair is holding tight at an hourly support.
- An hourly close below the 156.00 handle opens the door for a Major retracement all the way to 153.00.
- A rebound from here would point to 157.00, a test of the descending trendline
Levels of interest for USD/JPY Trading
Resistance levels
- 156.90 to 157.95 Recent top resistance
- 2025 Highs and April 2024 peaks 158.80 to 160.00
- 1990 and July 2024 Peak 161.00 to 162.00
- November highs at 157.895
Support levels
- 156.00 to 156.20 Short-timeframe Support
- 153.00 to 154.00 Key high timeframe pivot
- 150.00 Psychological support
- 146.00 August range support
- 2025 142.00 Main daily support
EUR/USD holds its range
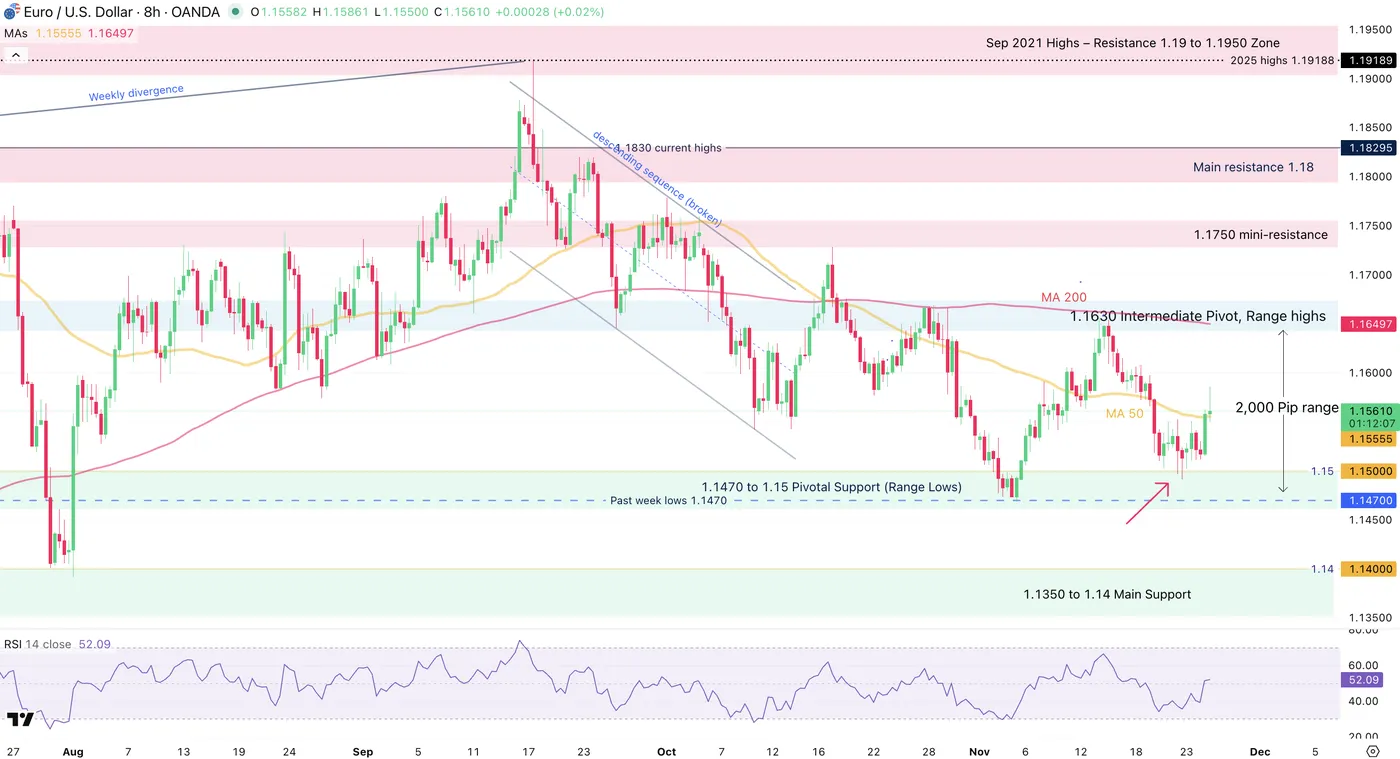
EUR/USD 8H Chart. November 25, 2025 – Source: TradingView
The range in EUR/USD, mentioned throughout our recent detailed analysis of the pair, is holding extremely well in those current conditions.
Since October 27, Fiber has been holding between 1.1470 lows and 1.1650 highs.
Confirmed by a flattening MA 200 and with fundamentals not coinciding with major breakouts, the range can be expected to hold ; Directional trends have the tendency to slow down before FOMC meetings– However, always watch for fakeouts and don't forget that everything can happen .
Levels of interest for EUR/USD Trading
Resistance levels
- 1.1630 to 1.1670 Pivot zone (range Highs)
- 1.1750 mini-resistance
- Resistance Zone around 1.18 (+/- 150 pips)
- Sep 2021 Highs – Resistance 1.19 to 1.1950 Zone
- Weekly highs 1.1656
Support levels
- 1.1470 to 1.15 range support
- 4H MA 200 Mini-support 1.16190
- 1.1475 to 1.15 Support Zone
- 1.1350 to 1.14 Support
- Session lows 1.14966
AUD/USD bounces back at the lows of its yearly range
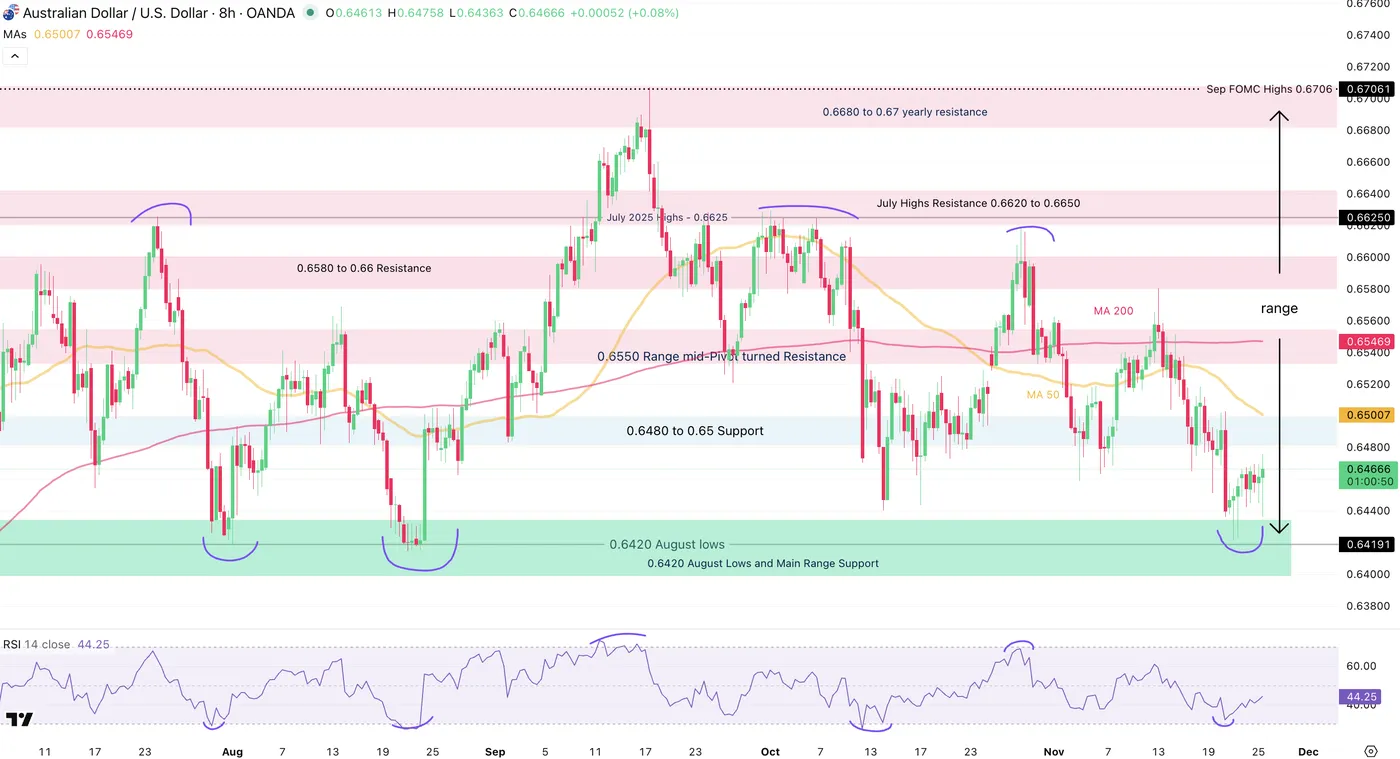
AUD/USD 8H Chart. November 25, 2025 – Source: TradingView
It is one of the first time that I noticed such an obvious range!
Since August 2025, FX Markets haven't materialized any trends – Pretty logical when seeing the extent of the moves throughout the first half of this year.
Nevertheless, AUD/USD had caught quite a wave of weakness after a strong performance against all its major counterparts, with the "Risk-on" currency brought down by a worsening sentiment (The Aussie tends to correlate well with Equity markets).
Holding between 0.64 (Support) and 0.66 (Resistance) since August, the latest bounce can offer quite a mean-reversion setup.
Still, as always, keep an eye on any session close below support or above resistance, but same as EUR/USD, you can expect the range to hold ahead of the FOMC meeting (as fundamentals have few chances of changing much more).
Levels of interest for AUD/USD Trading
Resistance levels
- 0.6480 to 0.65 Pivot
- 0.6550 Range mid-Pivot turned Resistance
- 0.6580 to 0.66 Resistance (Range Highs)
- July Highs Resistance 0.6620 to 0.6650
Support levels
- 0.6420 August Lows and Main Range Support (recent bounce)
- 0.6250 May support
- 0.62 Psychological support
- Liberation Day lows 0.59140
Safe Trades!
Silver (XAG/USD) Price Outlook: Failed Breakout and Double-Top hints at Rangebound action
Silver (XAG/USD) has stalled its gigantic rally higher as a more hawkish Fed pricing and lower economic projections have effectively brought a top to the precious industrial metal.
After forming a clear double top at its all-time highs of $54.50, Silver retraced lower to just graze below the psychological $50 mark.
Still, the metal's resilience to correct lower suggests that the underlying dovish catalysts haven't entirely disappeared.
NY Fed President John Williams recently revived hopes for a 25 basis point cut, pushing the odds for the December meeting back up to around 70%.
This pricing was further consolidated by a raft of weak data released this morning: PPI came in at 2.7% (matching expectations), while both Retail Sales and the ADP Private Employment report surprised to the downside.
Hence, the prospect of gradual rate easing—a fundamental booster for commodities like Silver—keeps underpinning prices even as sellers try to push lower.
Marking a recent low at $48.65 but also failing to breach the $52 level, a range is gradually forming.
Let's look at it through a multi-timeframe analysis of the metal.
Silver (XAG/USD) Multi-timeframe Technical Analysis
Daily Chart
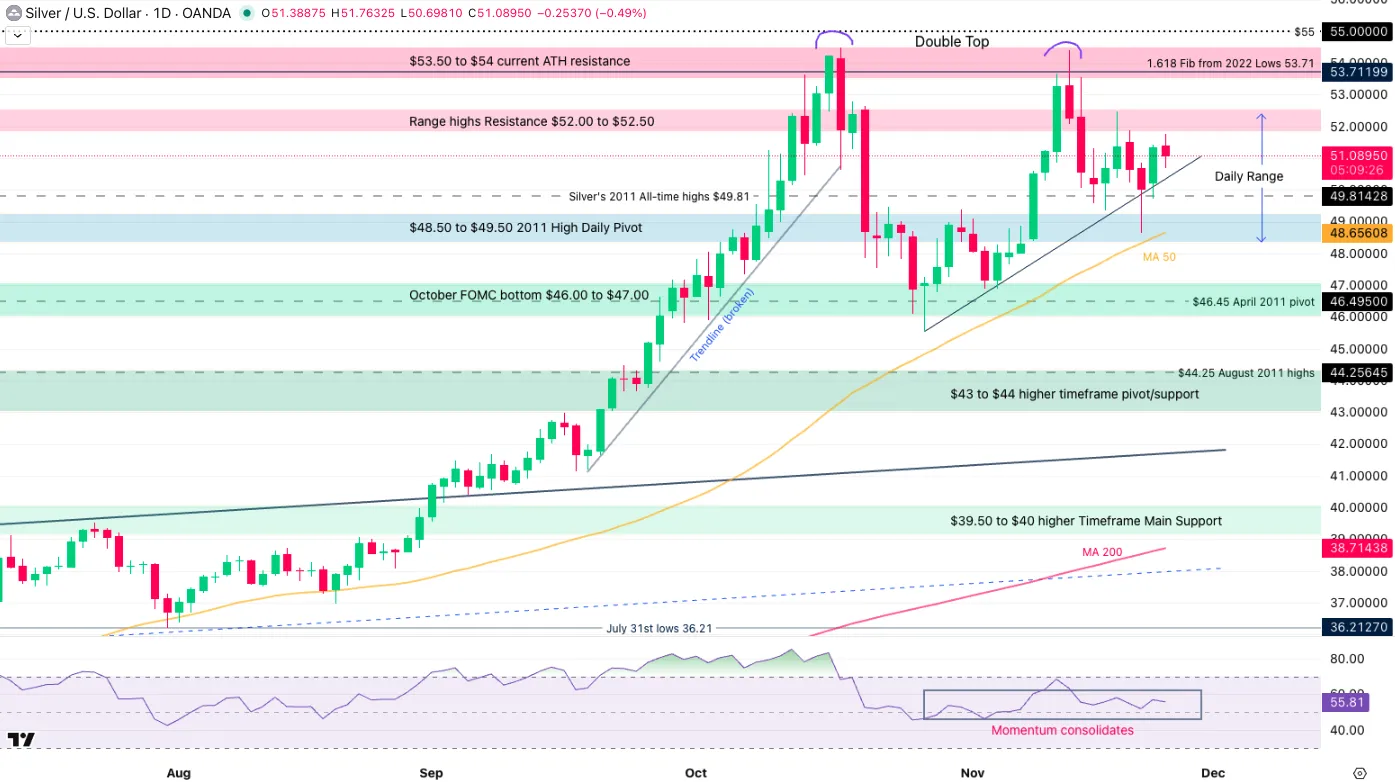
Silver (XAG/USD) Daily Chart, November 25, 2025 – Source: TradingView
After yesterday's strong rebound back above the $50 mark, buyer hesitancy and another failed test of the $52.00 level proves how weak directional attempts are.
This is characteristic of a Thanksgiving week, when many traders are absent and leads to lower odds of trending-environment (Who will be there to push prices?).
When looking at the past few weeks of action, the up-down action forms typical signs of a range.
It also gets confirmed further when looking at the long wicks, and a flattening RSI right around the neutral zone.
Let's dive into shorter timeframe to spot more details on how to exploit this range.
4H Chart and Technical Levels
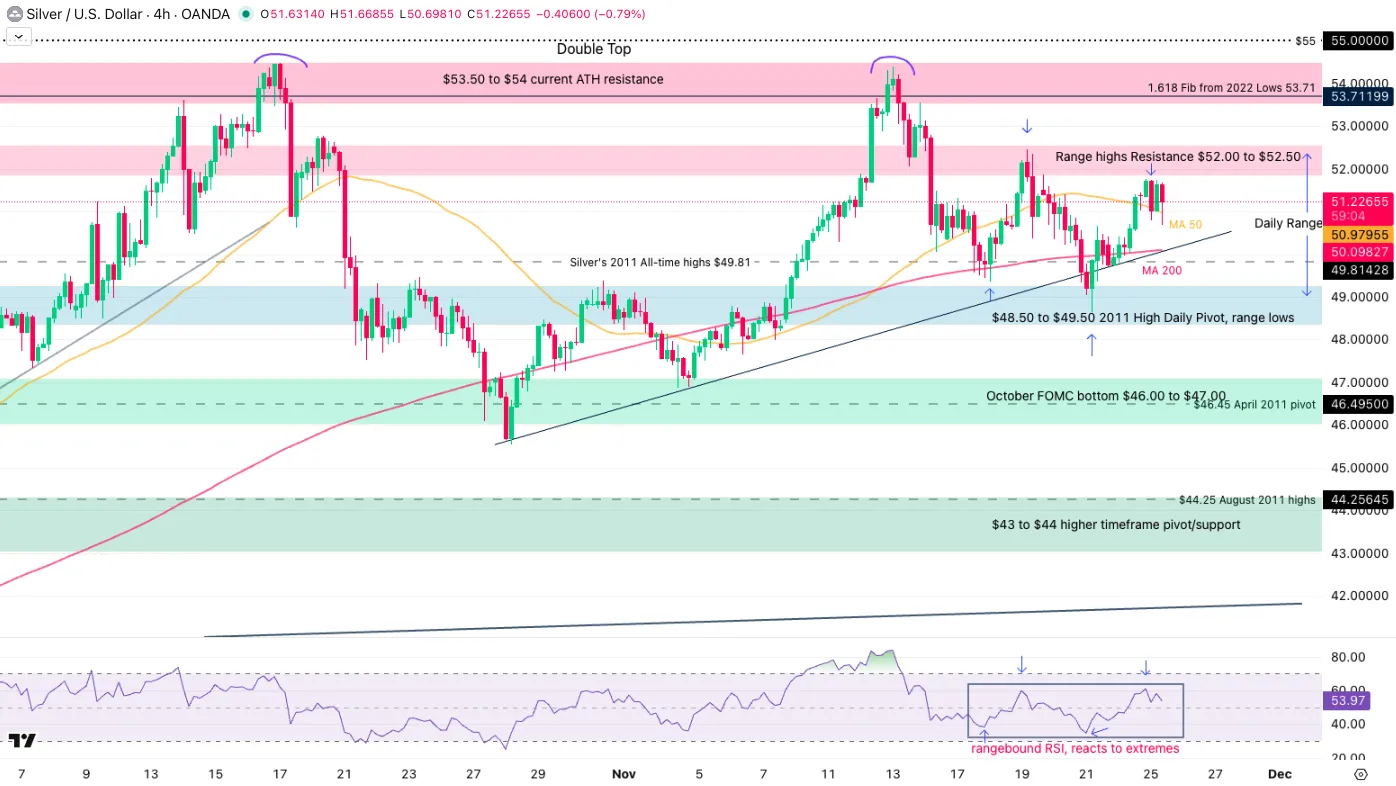
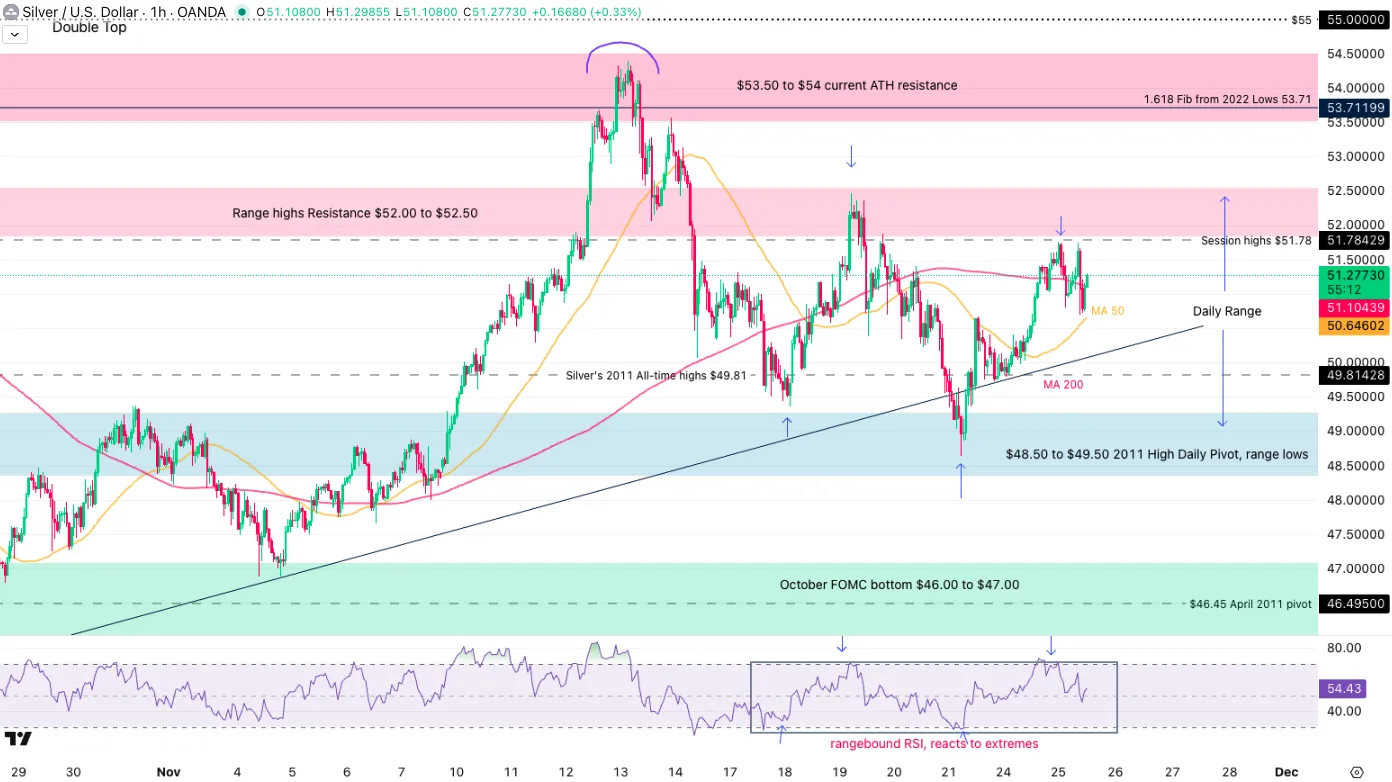
Silver (XAG/USD) 4H Chart, November 25, 2025 – Source: TradingView
Levels to watch for Silver (XAG) trading:
Resistance Levels:
- Range highs Resistance $52.00 to $52.50
- 2025 record $55.48
- $53.50 to $54 current ATH resistance
- $52.47 past week highs
- Potential resistance 1 $57.50 to $60 (1.382% from 2022 lows)
Support Levels:
- $48.50 to $49.50 Daily Pivot, Range lows
- October FOMC bottom $46.00 to $47.00
- $45.55 October 28 lows
- $43 to $44 higher timeframe pivot/support
- $39.50 to $40 higher timeframe support
1H Chart
Silver (XAG/USD) 1H Chart, November 25, 2025 – Source: TradingView
The current $48.00 to $52.00 range has found root in more troubles fundamentals as time comes:
Is the Fed lowering rates enough to fuel another All-time high rally?
Are ongoing geopolitical reconciliations enough to lower demand and bring prices down?
As traders and participants scratch their heads, an opportunity to trade the range emerges.
- Sell the $52.00 to $52.50 resistance; Wait for a candle rejecting the level and spot if selling continues.
- Buy the $48.00 to $49.00 range lows to play the range.
- Track for daily closes above and below these range levels to see if flows create a diversion from the ongoing consolidation
Safe Trades!
Oil Falls Below $58 as Ukraine Agrees to 19-Point Peace Plan
Oil took another pipeline lower as recent headlines reduced supply route concerns for one of its bigger producers.
The initially secret discussions for a Ukraine-Russia peace plan, initiated by the US, have taken a much more serious shape.
An original Russian-drafted 28-point plan—similar to the one proposed for Gaza—had earlier been publicized but was subject to fierce debate among European leaders, as the guarantees would not play in Ukraine's or the EU's favor, particularly clauses regarding the recognition of occupied Ukrainian territory like Crimea and Donetsk as Russian.

A map of Ukraine and Russian-controlled territories – Source: UnderstandingWar.Org, November 22, 2025.
A revised 19-point plan has hence emerged in the past day, with ABC News reporting that "the Ukrainians have agreed to a peace deal", though there are still details to be sorted out.
The agreement is described by officials as a "living paper," implying that many clauses remain subject to change as negotiations evolve. The rest of the war now hinges on whether Russia accepts the terms.
This major geopolitical development has sent Oil back below the $57.50 mark, more than 2.50% lower.
Still stuck in descending, choppy trading, Oil presents some interesting technical looks as fundamentals swing again.
Let's dive right into the charts for Black Gold.
US Oil (WTI) Multi-timeframe Technical Analysis
Daily Chart
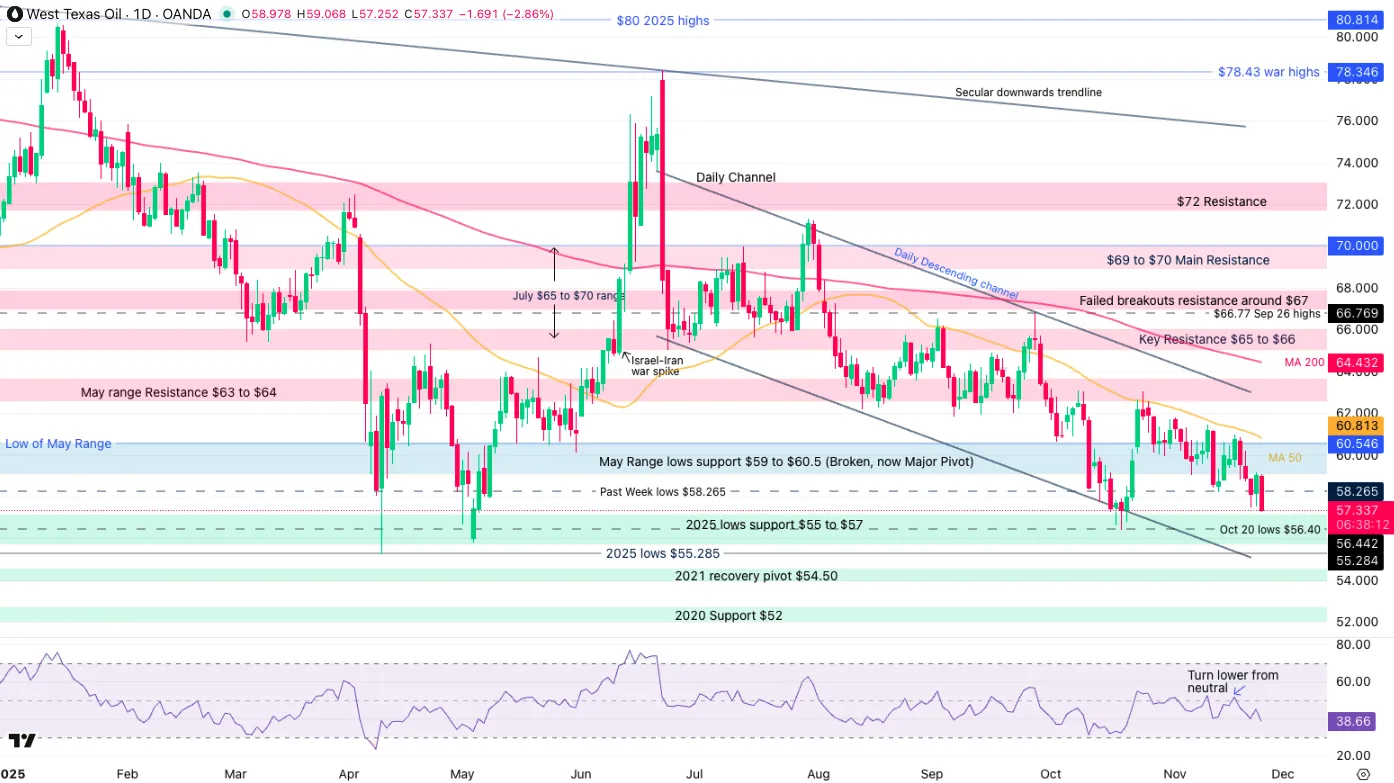
US Oil (WTI) Daily Chart, November 25, 2025 – Source: TradingView
The energy-commodity is still not out of its descending trend when looking at how solid the Daily Channel is.
The 50-Day MA acted once again as a major point for sellers to enter. If current momentum continues strong, the next step could be a test of the 2025 lows ($55.285) which also coincides with the lows of the Channel.
The Daily RSI also formed a concrete selling sign, as momentum tried to test the neutral level but rejected it lower. Keep an eye on such formations in RSI which can render strong signals.
For now, shorter-timeframes may indicate an earlier stop in the selling. Let's take a closer look
4H Chart and Technical Levels
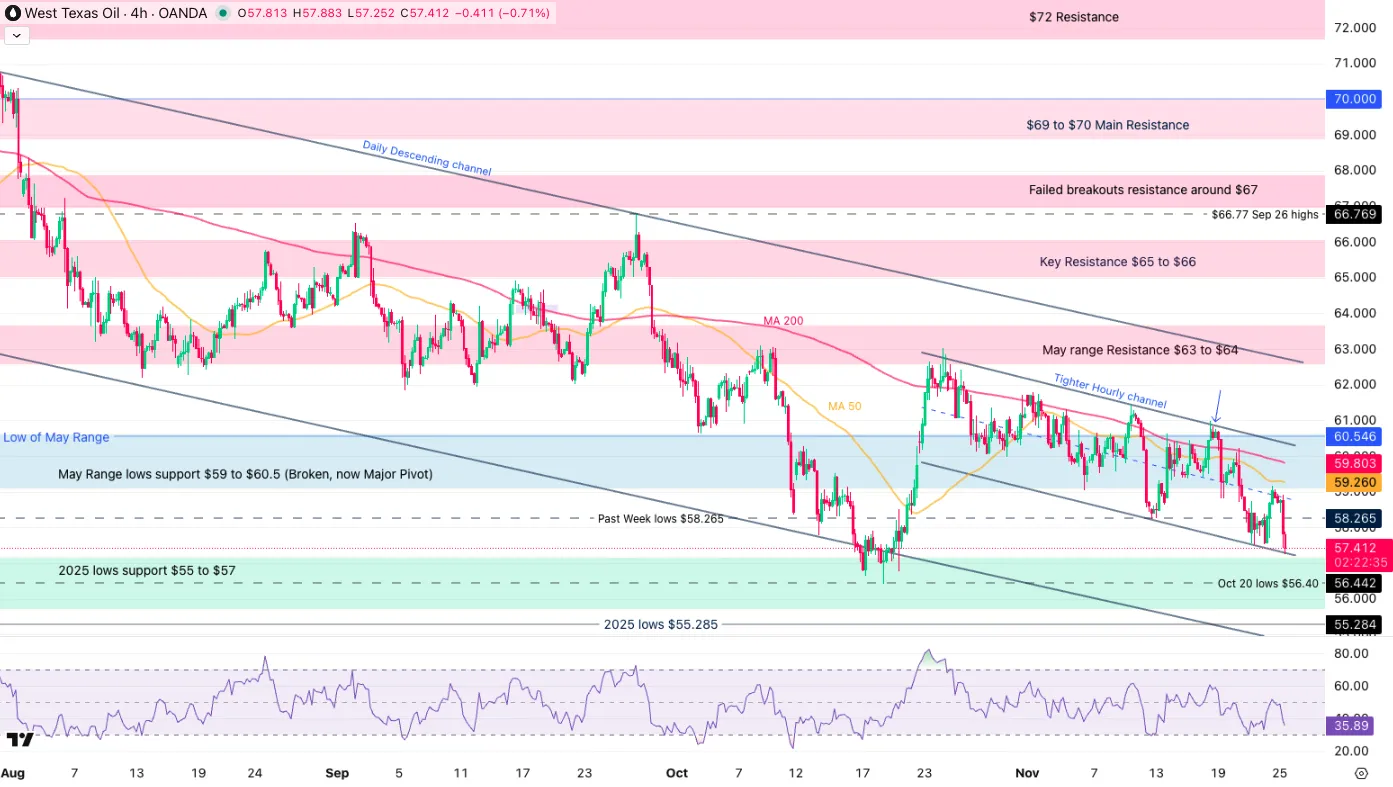
US Oil (WTI) 4H Chart, November 25, 2025 – Source: TradingView
Levels to place on your WTI charts:
Resistance Levels
- Key September Resistance $65 to $66
- May range Resistance $63 to $64
- $60.90 Past Week highs
- $58.265 short-timeframe pivot level
- May Range lows support $59.00 to $60.50 (Broken, now Major Pivot)
Support Levels
- Higher bound of 2025 support $57.00 to $57.30 (testing)
- Oct 20 lows $56.38
- $55 to $55.70 low 2025 Support
1H Chart
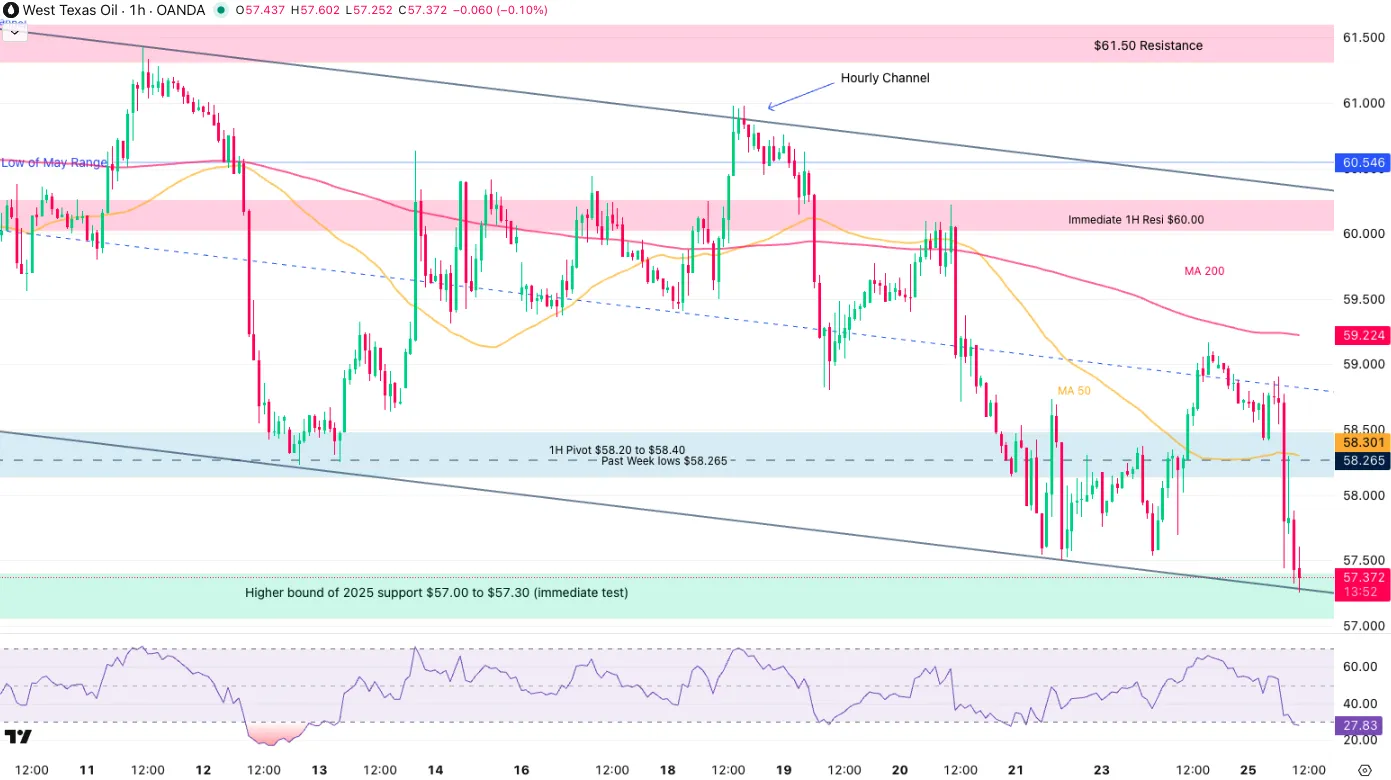
US Oil (WTI) 1H Chart, November 25, 2025 – Source: TradingView
The shorter timeframe shows a clear evolution within an Hourly Bear Channel, contained within the higher timeframe sequence.
Now testing its lows, some hesitant mean-reversion attempts to take place.
This comes at multiple confluences with the higher timeframe support coming close, but no signs of reversal are shown.
To get an immediate momentum guide, look at the current 1H Candle:
- Above its highs ($57.60), a reversal higher has high chances of materializing.
- Holding current levels adds more chance towards a lower break (look at the session lows at $57.25)
Some spikes could also take place as the geopolitical developments occur. Therefore watch your risk!
One of my theories was also one of a potential sell-the-peace rumours, buy the peace-news. But is still for now a bit farfetched.
Safe Trades!
Natural Gas Wave Analysis
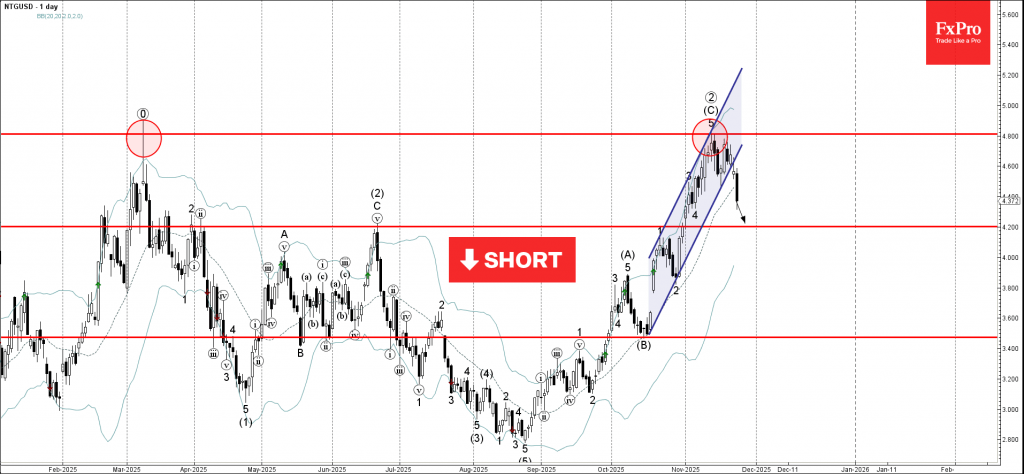
Natural Gas: ⬇️ Sell
- Natural Gas falling inside impulse wave (1)
- Likely to fall to support level 4.200
Natural Gas recently reversed from resistance area between the long-term resistance level 4.800 (former top of the shooting star from May) and the upper daily Bollinger Band.
This resistance area was further strengthened by the resistance trendline of the narrow daily up channel from October.
Having just broken the aforementioned daily up channel, Natural Gas can be expected to fall further in the accelerated impulse wave (1) to the next support level 4.200.
AUDUSD Wave Analysis
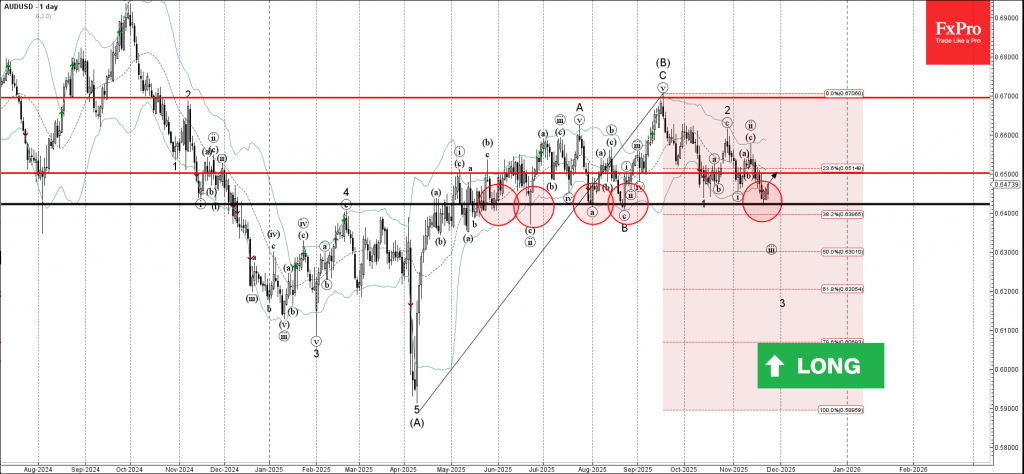
AUDUSD: ⬆️ Buy
- AUDUSD reversed from support area
- Likely to rise to resistance level 0.6500
AUDUSD currency pair recently reversed from support area between the key support level 0.6420 (which has been reversing the price from May) and the lower daily Bollinger Band.
This support area was further strengthened by the 38.2% Fibonacci correction of the previous sharp upward ABC correction B from April.
Given the clear daily uptrend, AUDUSD currency pair can be expected to rise to the next resistance level 0.6500.
UK Budget 2025 Preview: Fiscal Drag, Wealth Tax, and Market Impact on GBP & Gilts
The Labour government is set to release a crucial budget plan on November 26. Instead of announcing new spending, the main goal is to prove that the government is being careful with money to keep financial markets stable. Chancellor Rachel Reeves faces a tough challenge as she tries to stick to the strict financial rules she created for herself. Her plan focuses on three main priorities: reducing the time people wait for healthcare (NHS), paying down the country's debt, and lowering the cost of living for everyone.
The Immediate Fiscal Challenge and the OBR Downgrade
The economic context necessitates aggressive action. The pressure begins with the widely anticipated forecast revision by the Office for Budget Responsibility (OBR), which publishes its updated economic and public finances outlook concurrently with the Budget statement.
Experts expect the OBR to admit that its previous growth predictions were too optimistic, which will likely reveal a hole in the government’s finances of £20 to £30 billion. This problem is made worse by the fact that the government has already borrowed nearly £10 billion more this year than originally planned.
Market participants are watching closely; if the government cannot prove it has a credible plan to fix this gap and build a safety cushion, investors will lose trust. This loss of confidence would make it much more expensive for the UK to borrow money, as it would suggest the government is reacting to a crisis rather than following a solid, long-term strategy.
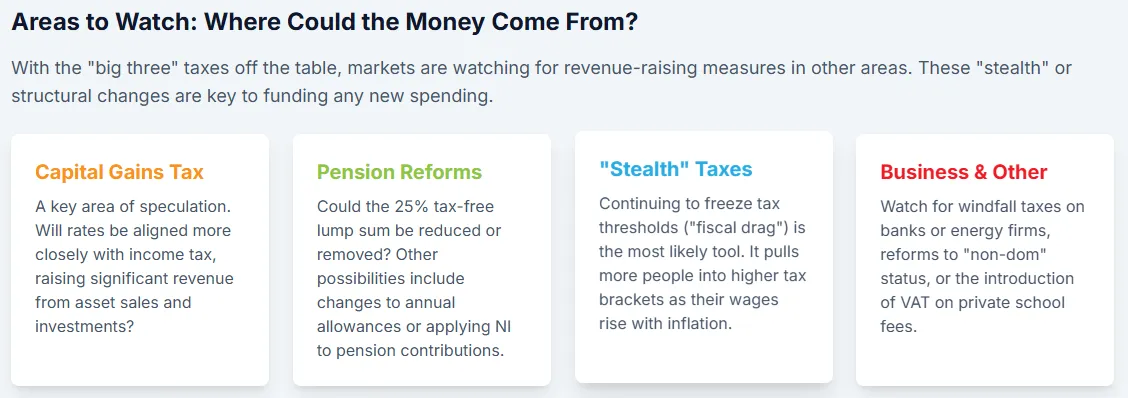
Policy Watchlist: The Mechanics of Stealth and Wealth Taxation
Labour's fiscal strategy is heavily constrained by explicit manifesto pledges ruling out any increases to the rates of Income Tax (basic, higher, or additional), National Insurance, or VAT, alongside a commitment to cap Corporation Tax at 25%. To close the substantial fiscal gap, estimated to require gross revenue generation approaching £30–40 billion (when accounting for non-negotiable spending), the Chancellor is compelled to employ a strategy focused on "stealth" taxes and targeted measures on wealth.
The Engine of Revenue: Stealth Taxation via Fiscal Drag
The main way the government plans to raise this money is by freezing the income levels at which people start paying tax. Even though official tax rates aren't changing, rising wages and inflation (which was 3.6% in October 2025) mean that more people will be pushed into higher tax brackets.
This process, known as "fiscal drag," is expected to generate a massive £42.9 billion by 2027 and will increase the number of higher-rate taxpayers from four million to over ten million. While this helps the government keep its election promises, economists worry it might discourage people from working harder or saving money.
Targeted Wealth Measures and Expenditure Commitments
Beyond these stealth measures, the budget is expected to target assets and property, which the government views as undertaxed. We may see higher taxes on profits from selling assets (Capital Gains Tax), stricter rules on inheritance and tax-free gifts, and higher taxes on expensive homes, potentially including a "mansion tax" for properties worth over £2 million.
This extra money is needed to pay for expensive commitments, such as increasing the State Pension by over £550 a year and lifting the cap on benefits for larger families. To make the numbers work, the Chancellor may also introduce smaller charges, such as a tax per mile for electric vehicle drivers and reduced tax perks for high earners paying into pensions.
Created by Zain Vawda, Data from LSEG, ING
Market Implications for the GBP and UK Gilts
The value of the British Pound is currently being pulled in two directions. On one side, a solid government budget would boost trust and help the currency; on the other, if the Bank of England cuts interest rates quickly, the currency usually weakens.
Right now, the Pound is trading around 1.31 against the US dollar because investors have already accounted for most of the uncertainty. If the Chancellor presents a strong and believable financial plan, the Pound could stabilize or rise slightly. However, if the plan is weak or hurts economic growth, investors might sell off the Pound. For the currency to truly gain value, the trust created by a good budget must be strong enough to overcome the natural dip caused by falling interest rates.
GBP/USD Daily Chart, November 25, 2025
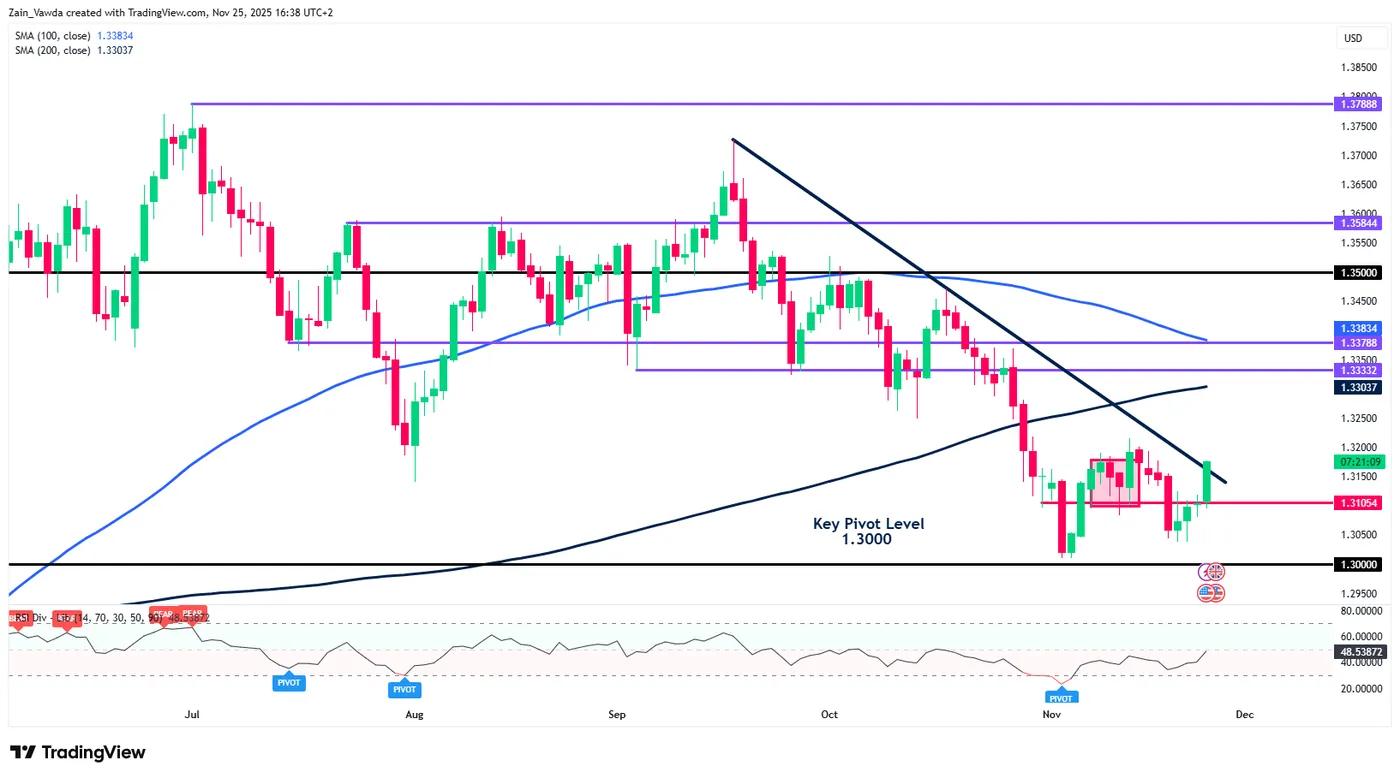
Source: TradingView
Government Bonds (Gilts) and Political Risk
The market for UK government bonds, known as "Gilts," is in a risky position. Part of this is due to global trends, such as huge spending on AI and defense, which pushes long-term interest rates up worldwide.
However, the biggest specific threat to the UK is domestic politics. If the current government looks unstable or weak in the polls, investors worry that a new leader might take over and start borrowing recklessly. Since the UK already plans to sell nearly £300 billion in bonds for the 2025-26 period, investors are nervous. If they feel the political situation is shaky, they will demand higher returns (yields) to lend their money, making it more expensive for the government to borrow.
The Solution: A Strong Budget A strict and credible budget is the best way to calm the bond market. If the government proves it can manage its money well, the Bank of England will feel safe enough to cut interest rates faster and deeper. With inflation at 3.6% and the current interest rate at 4.00%, a tight budget helps the central bank lower borrowing costs for everyone.
This strategy is expected to balance the economy: short-term rates will fall as the Bank of England eases its policies, while long-term rates will stabilize because investors will finally trust the government's financial plan.
Gold Price Forecast: Bullion Rallies to $4,118 Key Level as Markets Increase Fed Rate Cut Bets
Currently trading at $4,118 per troy ounce, gold has started the week on an encouraging note, finding support in Monday’s session.
Rallying by staggering 1.70% in yesterday’s trading, which, albeit by recent accounts, seems to be perfectly normal, dovish comments made by Fed Williams last week have offered a new lease of life to current gold upside.
Join me as I attempt to answer the question: What’s next for gold?
Gold (XAU/USD): Key takeaways 25/11/2025
- Dovish comments from John Williams, President & CEO of the Federal Reserve Bank of New York, have recently challenged an increasingly hawkish narrative from the Fed, with rate cut probabilities spiking ahead of the December decision and bolstering gold pricing
- In the face of a stronger dollar, which currently trades at three-month highs, gold has found support at the 20-day moving average and will look to target $4,200 in the short term
- Gold continues to benefit from uncertainty created by the government shutdown, in no small part thanks to a perceived decline in central bank efficacy owing to the lack of data, which otherwise would be relied on to make monetary policy decisions
Gold (XAU/USD): At the mercy of the Federal Reserve
Granted, the above sounds like the title of a James Bond film, but the point remains:
The health of the current gold rally, and indeed much of the US equity markets, is at the mercy of the Federal Reserve and how votes are cast on December 10th
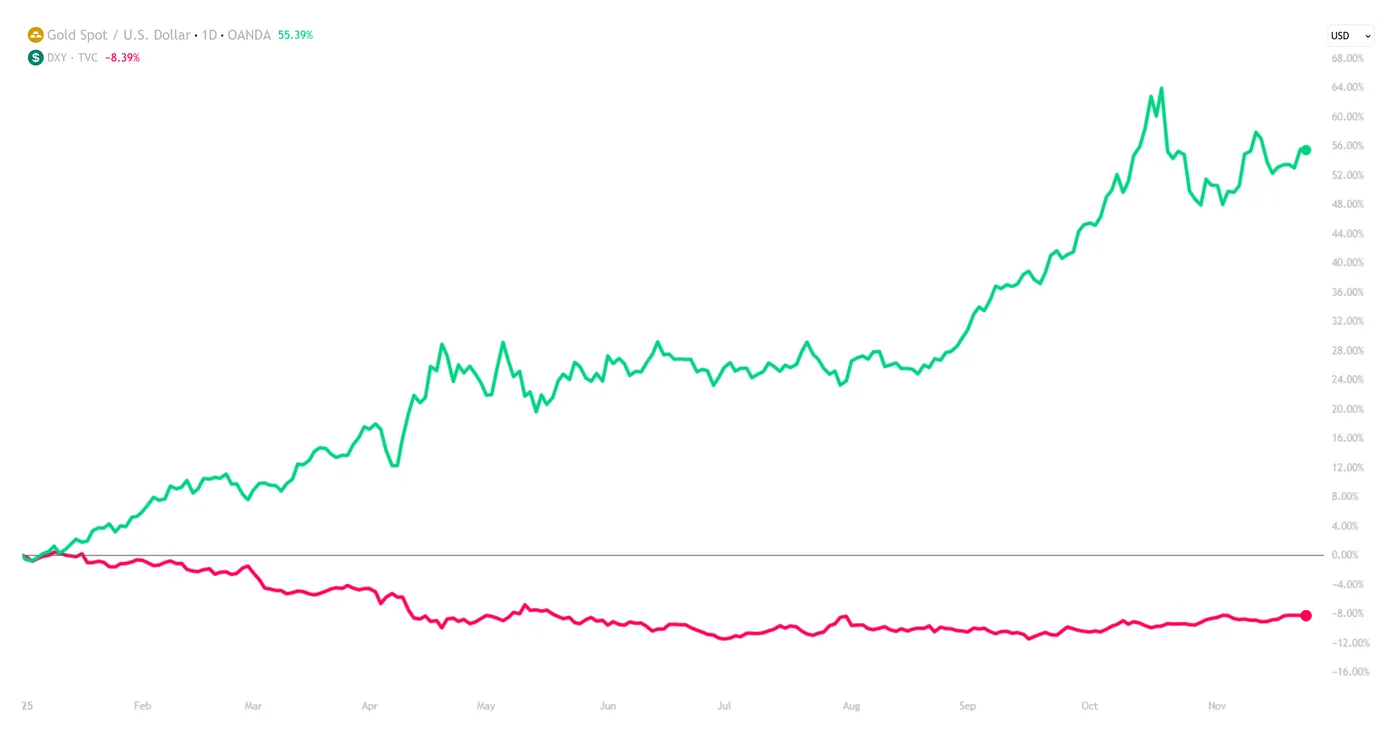
Gold (XAU/USD) vs Dollar Strength Index (DXY), D1, OANDA & TVC, TradingView, 25/11/2025
It was less than a week ago that I wrote an increasingly hawkish Fed had caused gold price to settle at $4,077, mainly on the back of October’s FOMC Minutes, which revealed “strongly differing views” amongst policymakers, as well as comments from Vice Chair of the Federal Reserve Philip Jefferson to “proceed slowly” with the current easing cycle.
The difference a week can make in the markets, however, continues to amaze me.
If you would, let’s discuss some of the macroeconomic themes within the precious metals markets, with special attention to current predictions for the December Fed meeting.
Gold (XAU/USD): Fundamental Analysis 25/11/2025
Fed Chair Williams shocks markets with dovish commentary
I won’t bury the lead - the latest U-turn in relation to Federal Reserve monetary policy has not offered newfound support, but represents the most significant of macroeconomic themes within precious metal markets.
Speaking last Friday at the Central Bank of Chile Centennial Conference in Santiago, Fed Williams offered the following commentary, to the surprise of much of the markets:
"Looking ahead, it is imperative to restore inflation to our 2 percent longer-run goal on a sustained basis. It is equally important to do so without creating undue risks to our maximum employment goal. I view monetary policy as being modestly restrictive, although somewhat less so than before our recent actions.
Therefore, I still see room for a further adjustment in the near term to the target range for the federal funds rate to move the stance of policy closer to the range of neutral, thereby maintaining the balance between the achievement of our two goals.
My policy views will, as always, be based on the evolution of the totality of the data, the economic outlook, and the balance of risks to the achievement of our maximum employment and price stability goals"
John Williams, President & CEO of the Federal Reserve Bank of New York, speaking at the Central Bank of Chile Centennial Conference, Santiago, Chile
In a nutshell, the above commentary presented a dovish perspective on the upcoming decision, in contrast to previously hawkish comments that, according to the CME FedWatch tool, had previously had markets predicting rates would be maintained at odds of over 70%.
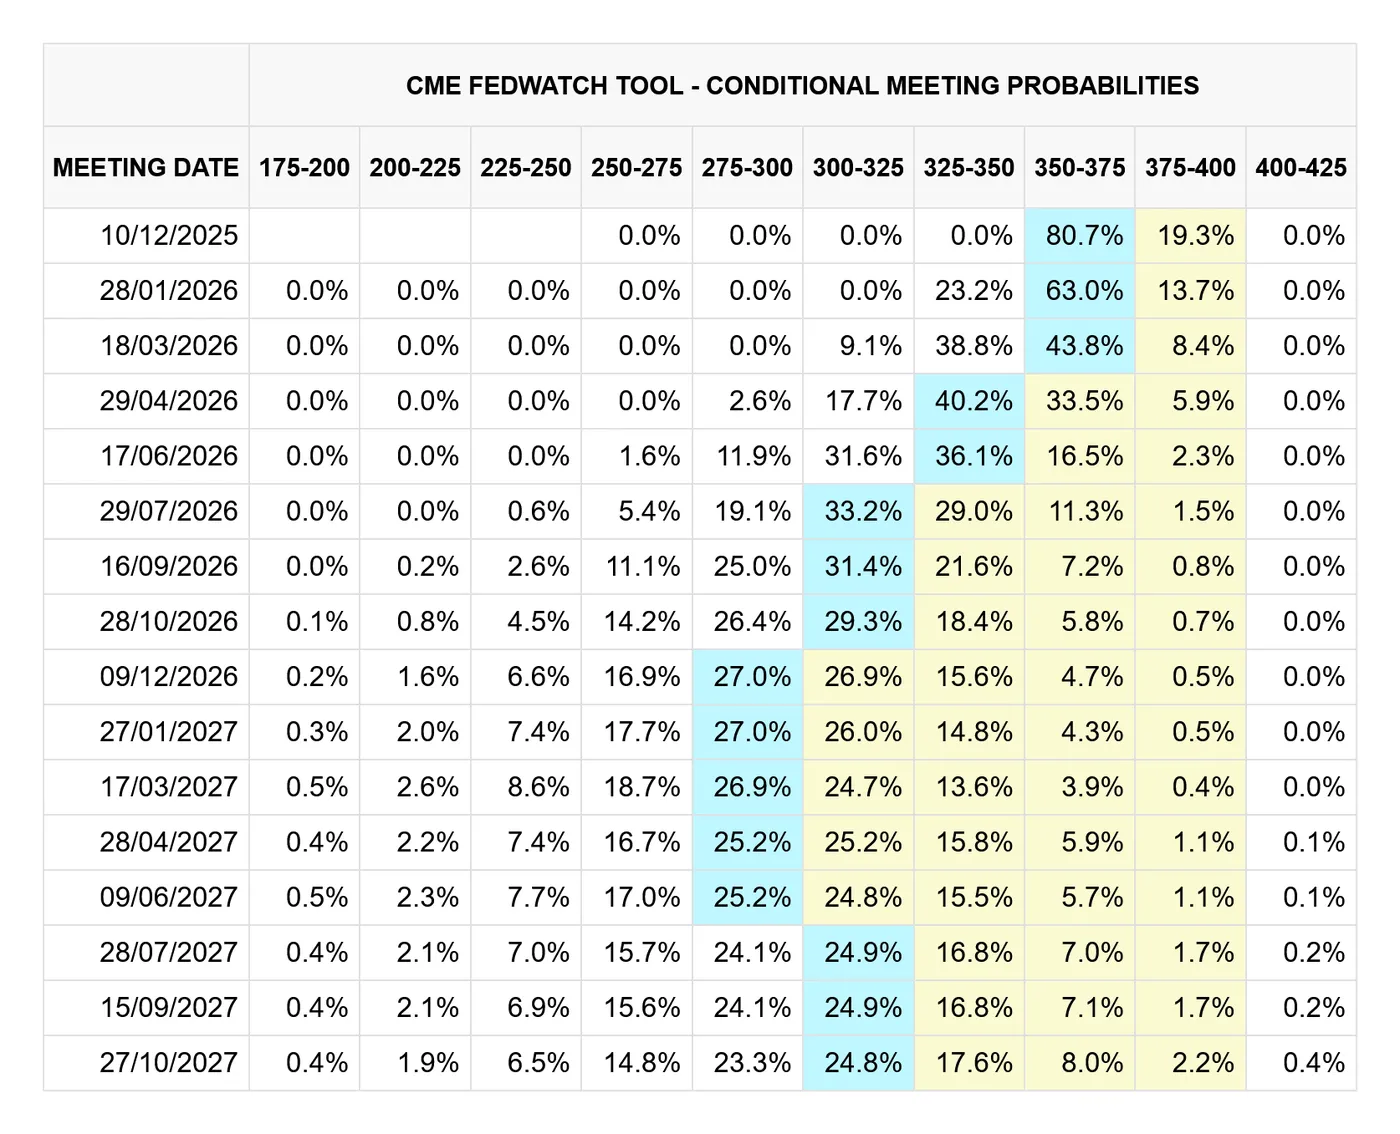
CME FedWatch, 25/11/2025
Predictably, William’s words have reignited hope for a rate cut in December, which, according to some sources, now trades at an ~80% probability. Naturally, this bodes well for precious metals, which benefit from lower interest rates, as the opportunity cost of holding gold compared to dollars becomes lower.
This would go some way to explaining the recent support found in gold bullion pricing.
It’s worth mentioning that, as per my previous commentary, October’s FOMC Minutes highlighted a split room amongst policymakers, which, by definition, would mean that a few changes of opinion could sway the vote in December.
As a personal aside, I cannot remember a time when a Fed meeting has been so contested in terms of dovish and bearish push and pull, similarly to how we’ve seen for the upcoming meeting - never a dull moment.
I’ll briefly touch on a few remaining points, since the fundamental outlook remains essentially unchanged since the last time we spoke.
Gold undeterred by dollar upside
It was VP of NNFX who once said that gold drives the bus, and having received these words in my formative years as a trader, they have stuck with me throughout.
They are especially relevant to recent events, however, with dollar and gold prices currently rallying alongside each other.
While I won’t pretend that there has been an astronomical upside for either in the past few days or so, both trade substantially higher since mid-September.
Logically, of course, there is at least some level of negative correlation between gold and dollar pricing, with falling USD value across 2025 offering some upside to gold, being priced typically in USD.
With that said, gold drives the bus, meaning that gold can rally despite the best efforts of a stronger dollar.
Albeit perhaps not to the same extent as years past, the dollar still maintains some safe-haven appeal, with the uncertainty of delayed data releases, courtesy of the longest US government shutdown in history, adding to the risk premium.
The same can be said for gold, of course, which can explain, at least in part, why both have rallied in recent memory.
What I mean to say is that gold and the US dollar often share common ground in terms of economic tailwinds that often cause pricing to rally, especially in risk-off markets
As such, a downgrade in the dollar’s safe-haven appeal directly benefits gold, as seen this year, with both assets competing for a finite amount of safe-haven demand.
Let’s progress into some market technicals to wrap up, alongside some price levels to watching.
XAU/USD: Technical Analysis 25/11/2025
XAU/USD: Daily (D1) chart analysis:
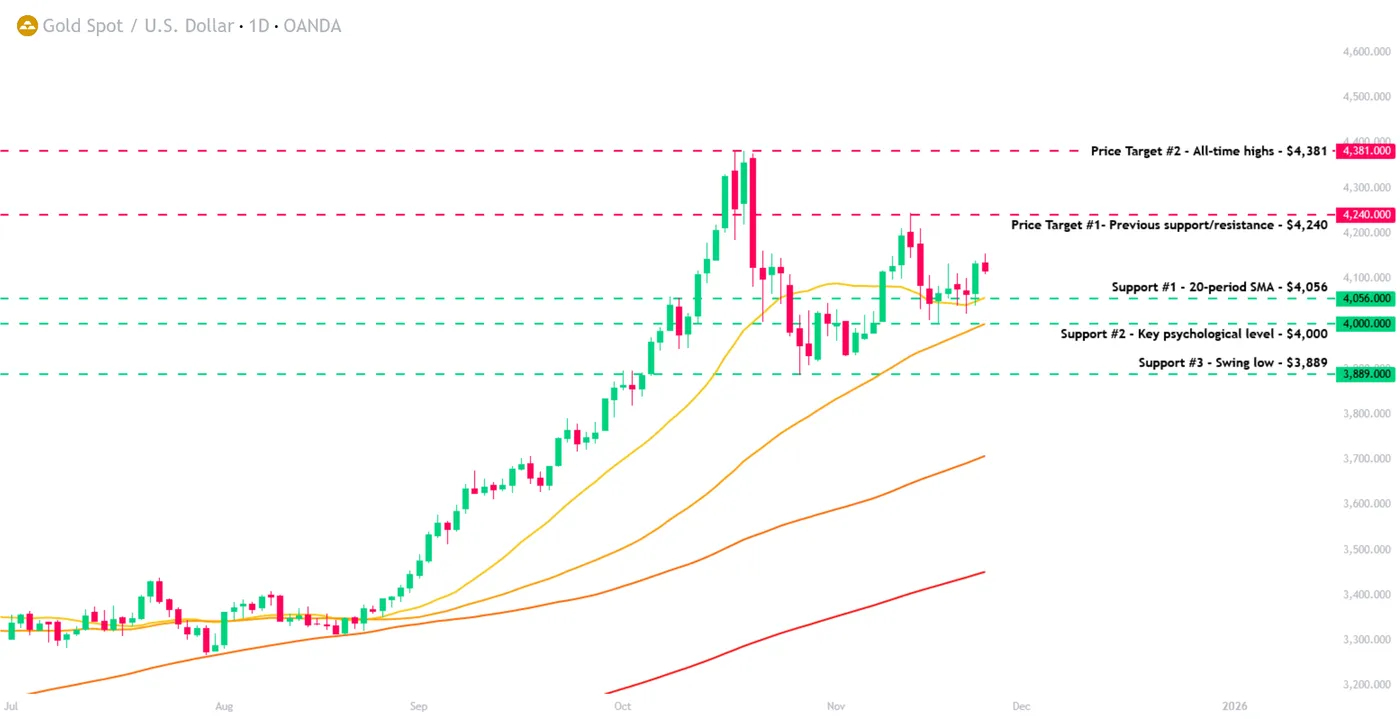
Gold (XAU/USD), D1, OANDA, TradingView, 25/11/2025
In the spirit of honesty, much of my analysis remains unchanged from my previous coverage, as all price targets and support levels remain intact.
With that said, fair warning: market expectations for the upcoming Fed meeting could invalidate any level of technical analysis should another narrative shift occur.
Considering how volatile the run-in to the December meeting has been, traders would be well-advised to plan their exits carefully.
Now that my observations to generic trading advice is out of the way, let me start by saying that gold remains very well-supported on a technical basis. There has been little to question the ongoing rally, even though it has fallen substantially from all-time highs
What’s important is that price seems to have found support around $4,050, and should price continue upwards, this would suggest that we remain in uptrend territory, forming a higher low.
The next test will of course be the previous highs, as in, the higher high part, to fully confirm.
Should this happen, and considering the firm fundamental footing also, we could make another bid for all-time highs.
With that said, and if I were a betting man, all-time highs are only likely to be achieved in the next two weeks before volume begins to wane courtesy of holiday festivities.
For this to happen in two weeks alone would be a stretch, so I’d be looking at early 2025 at best for record pricing. Just my two pence.
Price targets and support/resistance levels:
- Price target/Resistance #1 - $4,240 - Previous support/resistance
- Price target/Resistance #2 - $4,381 - All-time highs
- Support #1 - $4,056 - 20-Period SMA
- Support #2 - $4,000 - Key psychological level
- Support #3 - $3,889 - Swing low
Fed May Pause After December Cut
- The US economy is strong, thanks to spending on AI.
- The Fed is easing interest rates while tightening forecasts, but the Trump factor has not yet played out.
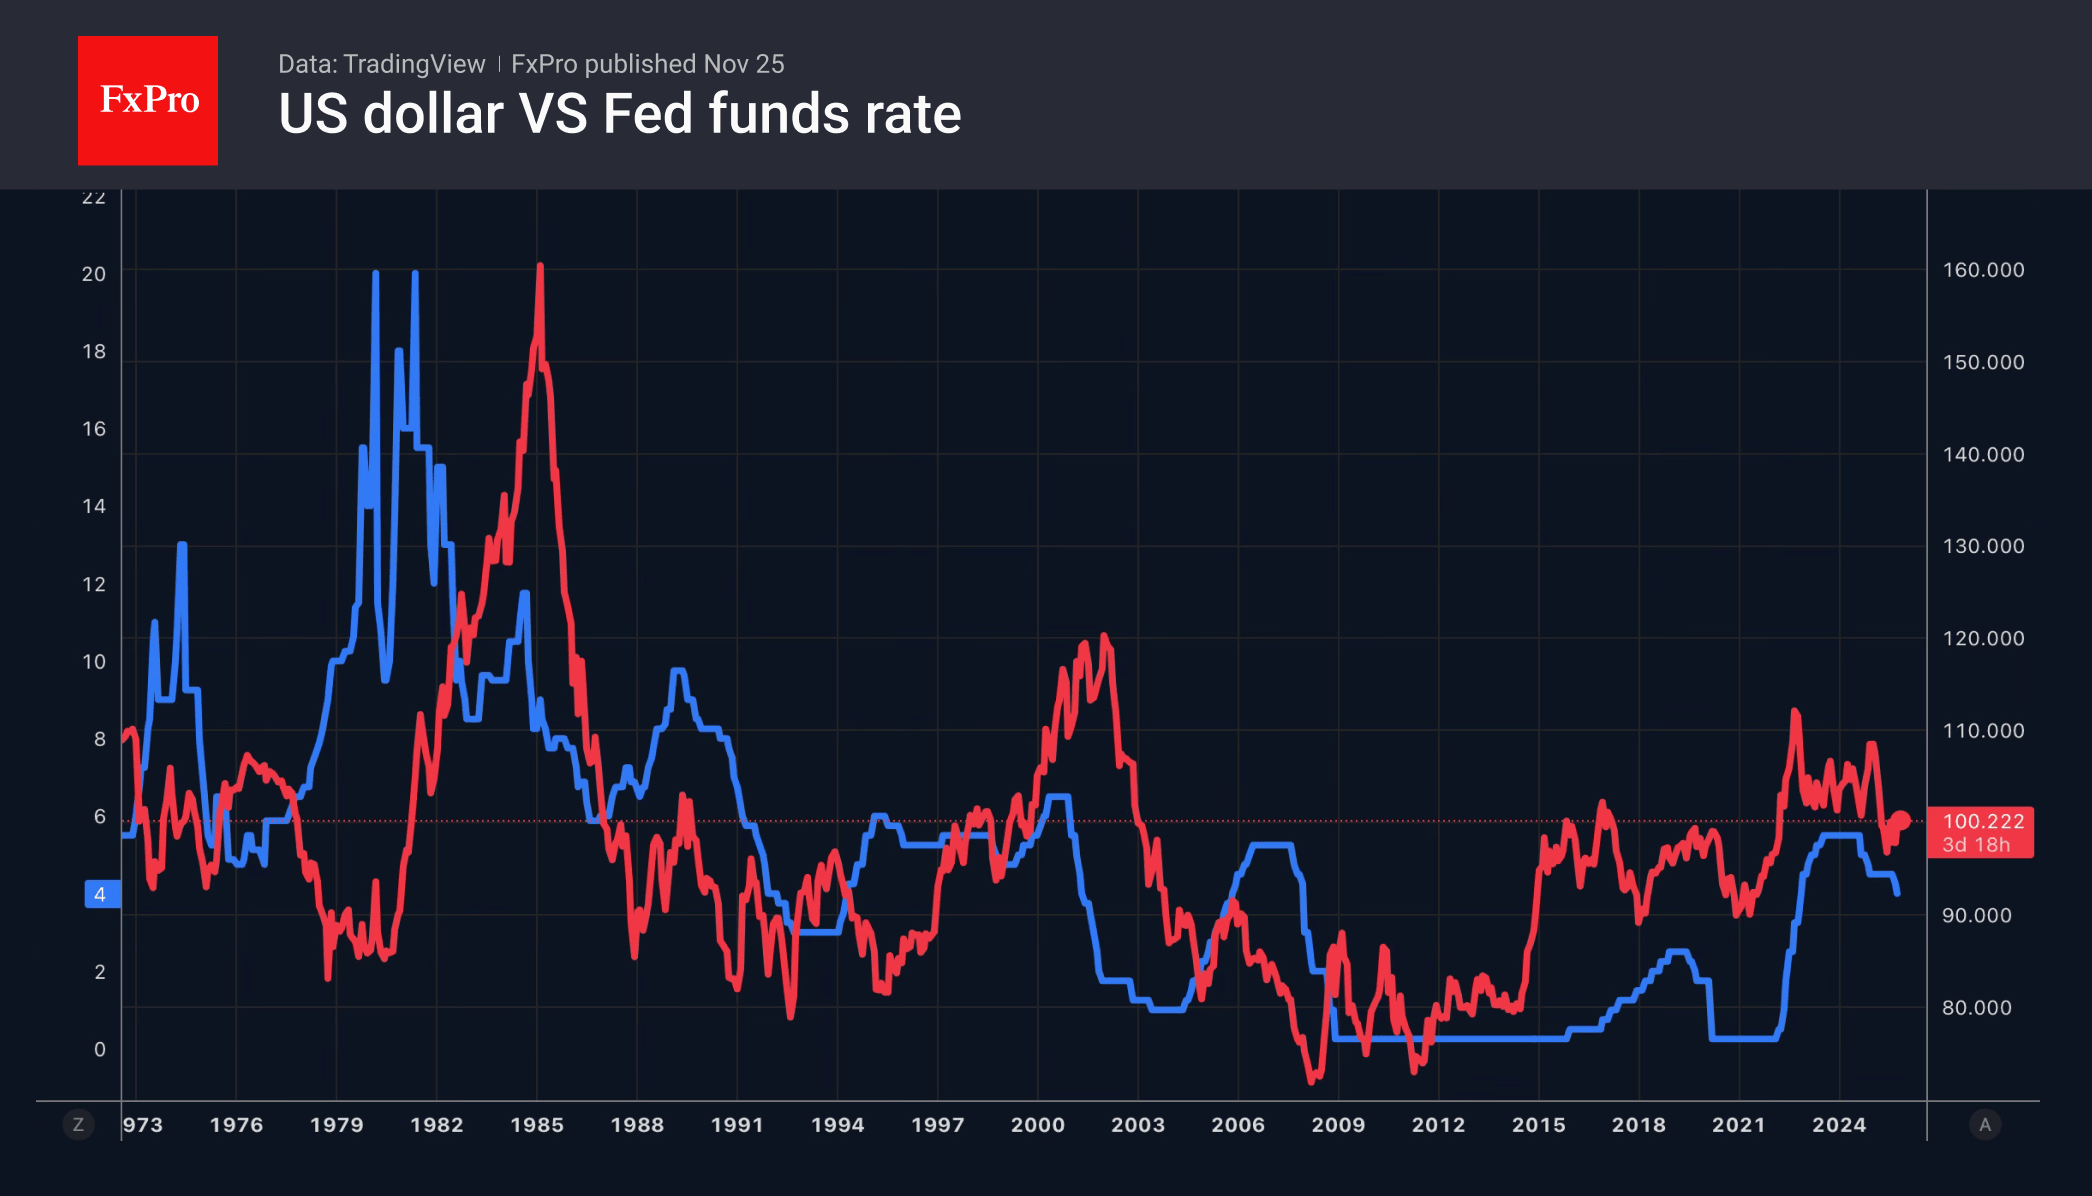
A strong economy equals a strong currency. The US dollar remains stable even as the probability of a Fed rate cut in December rises to 81%. A leading indicator from the Federal Reserve Bank of Atlanta signals an acceleration in gross domestic product from 3.8% in the second quarter to 4.2% in the third quarter. The BLS is set to release GDP data for July-September before Christmas. This is likely to be a gift to both the White House and all Americans.
Artificial intelligence is behind the strength of the US economy. According to Deutsche Bank, private investment, excluding AI, is comparable to 2019. If data centres are excluded, commercial construction has virtually stalled. Bank of America estimates that the capital expenditure of four companies, Microsoft, Amazon, Alphabet and Meta Platforms will increase from $228 billion to $344 billion in 2025. This is equivalent to 1.1% of GDP.
At the same time, rising tech stocks are increasing the wealth of Americans, driving consumer spending and accelerating the economy. Can the United States stand up to Europe? Judging by the disappointing statistics on the business climate in Germany, investors are sceptical about the speed of Friedrich Merz’s fiscal stimulus measures.
As for the recovery of expectations for a rate cut in December, the stability of the US dollar is understandable. In September and October, the dollar index rose after the rate cut in September, as the FOMC reduced the number of expected cuts in its updated forecasts.
History risks repeating itself for the third time in December. Jerome Powell will find a delicate compromise between the Fed’s hawks and doves, cutting rates but sending an even stronger signal of at least a pause in the near term. The dollar’s dynamics are influenced by expectations for the key rate over the next two years, and investors often look beyond a single meeting.
If everything depended solely on the Fed, it would be easier for investors. However, there is the Trump factor in the markets. The US president will not abandon his attempts to weaken the US dollar. There is also the economy, a factor that is only beginning to reveal itself.