Sample Category Title
NZD/USD Posts Major Reversal Higher After RBNZ Cut – Technical Outlook
While US Markets are away for the Thanksgiving holiday, leaving the broader session fairly calm, the FX markets remain open and active, with all eyes turning to the Kiwi Dollar (NZD), posting yet another strong session.
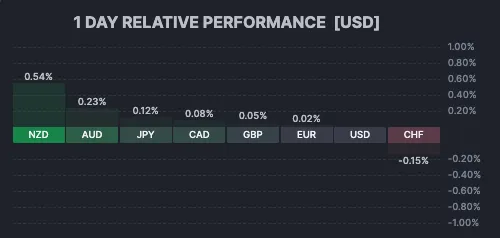
1-Day FX Performance – NZD demarks itself in the calm Thanksgiving Session – Source: Finviz
The Antipodean currency has faced its share of struggles this year, weighed down by a slowing New Zealand economy that proved more sensitive than its neighbor Australia to the slowdown in global trade post-tariffs—a weakness that was starkly evident in a terrible Q2 GDP growth rate of -0.9%.
However, after 325 basis points of cuts, the data has started to come back in a flash. New Zealand Retail Sales just posted a strong beat of 1.9% versus the 0.5% expected, a sign of strong recovery that follows stronger inflation prints and improving Manufacturing PMIs.
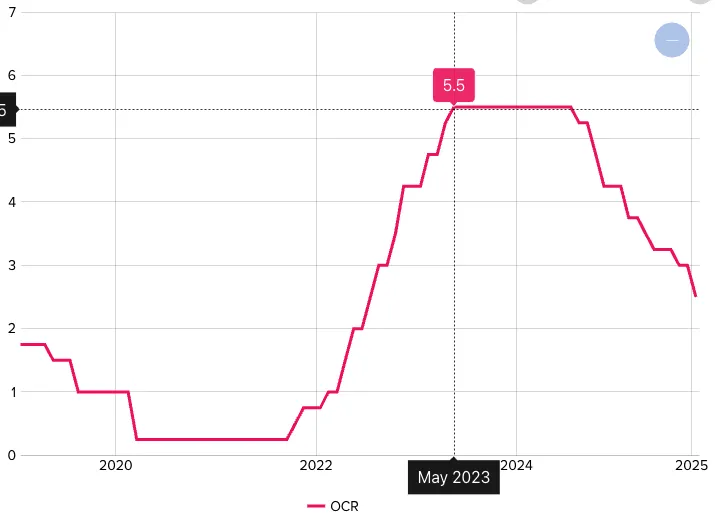
New Zealand's Main Interest Rate (OCR) since 2020 – Source: Reserve Bank of New Zealand
Adding to the shift in sentiment, RBNZ Governor Christian Hawkesby mentioned that a future rate cut faces "significant hurdles."
This wording sufficed the market to assume that the 2.25% rate is the lower bound for the Kiwi rate, with markets now pricing rates to stay put throughout 2026.
This fundamental pivot is a clear sign of renewed strength for the NZD, which is up 2.65% against the US Dollar since last Friday.
Let's look at the major Kiwi pair, NZD/USD, to spot where that takes the action looking forward.
NZD/USD Multi-Timeframe Technical Analysis
Daily Chart
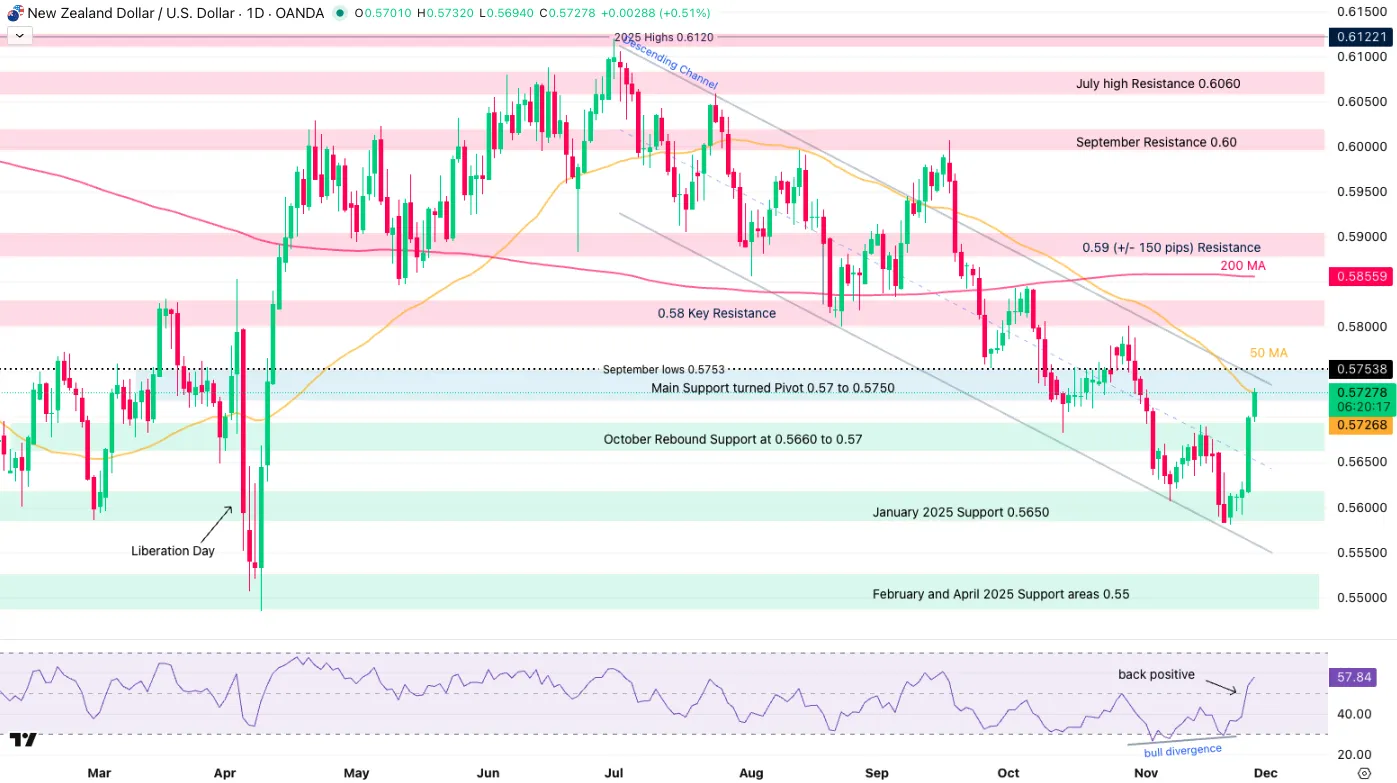
NZD/USD Daily Chart, November 27, 2025 – Source: TradingView
Since July 1st and the comeback of the US Dollar, the NZD/USD has been in a one-way descent, exacerbated by diverging policies between the Fed and the RBNZ.
Taking the pair all the way down to a retest of the Liberation Day troughs in a Monthly Downward Channel, the action is now marking a first clear rebound in months.
Propulsed by changing fundamentals and bullish daily divergences, the ongoing action is strong and will face hurdles at the 50-Day Moving Average (0.57268) and Channel highs.
Still, when looking at how strong the current candles are, these hurdles could be breached soon. For confirmation, look at a session close above the 50-MA.
4H Chart and Technical Levels
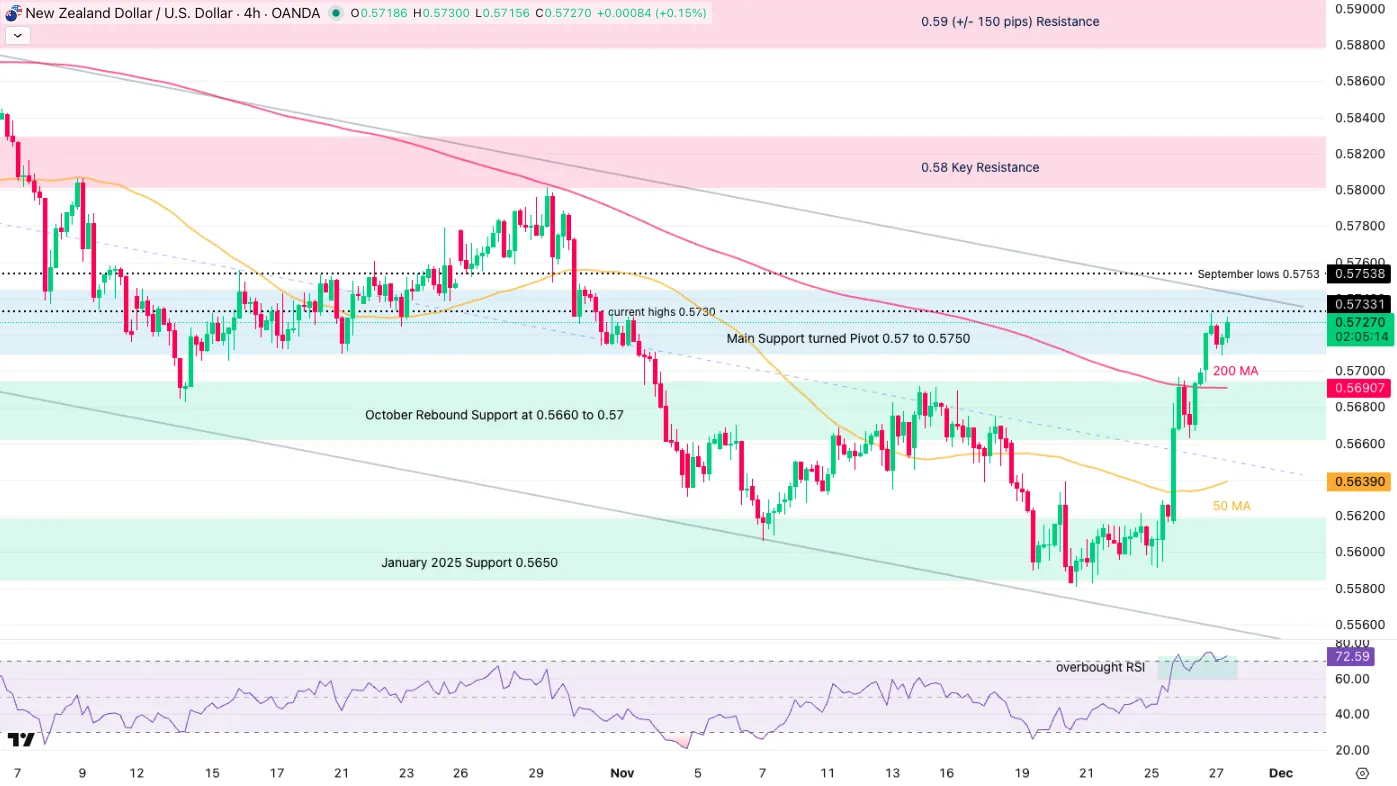
NZD/USD 4H Chart, November 27, 2025 – Source: TradingView
The ongoing rally is also facing a few hurdles on the intraday timeframe:
Overbought RSI levels within the Pivot Zone (0.5720 to 0.5750) could trigger some small mean-reversion.
A retest of the 4H-MA 200 (0.5690) could see higher probability for the action to continue its path higher.
NZD/USD Technical Levels to keep on your charts:
Resistance levels (NZDUSD)
- Main Support turned Pivot 0.5720 to 0.5750 (testing)
- Daily highs 0.5730
- 0.58 Key Resistance
- 0.59 (+/- 150 pips) Resistance
Support levels
- 4H 200 MA at 0.5690
- October Rebound Support at 0.5660 to 0.57
- 4H 50-period MA 0.56385
- January 2025 Support 0.5650
1H Chart
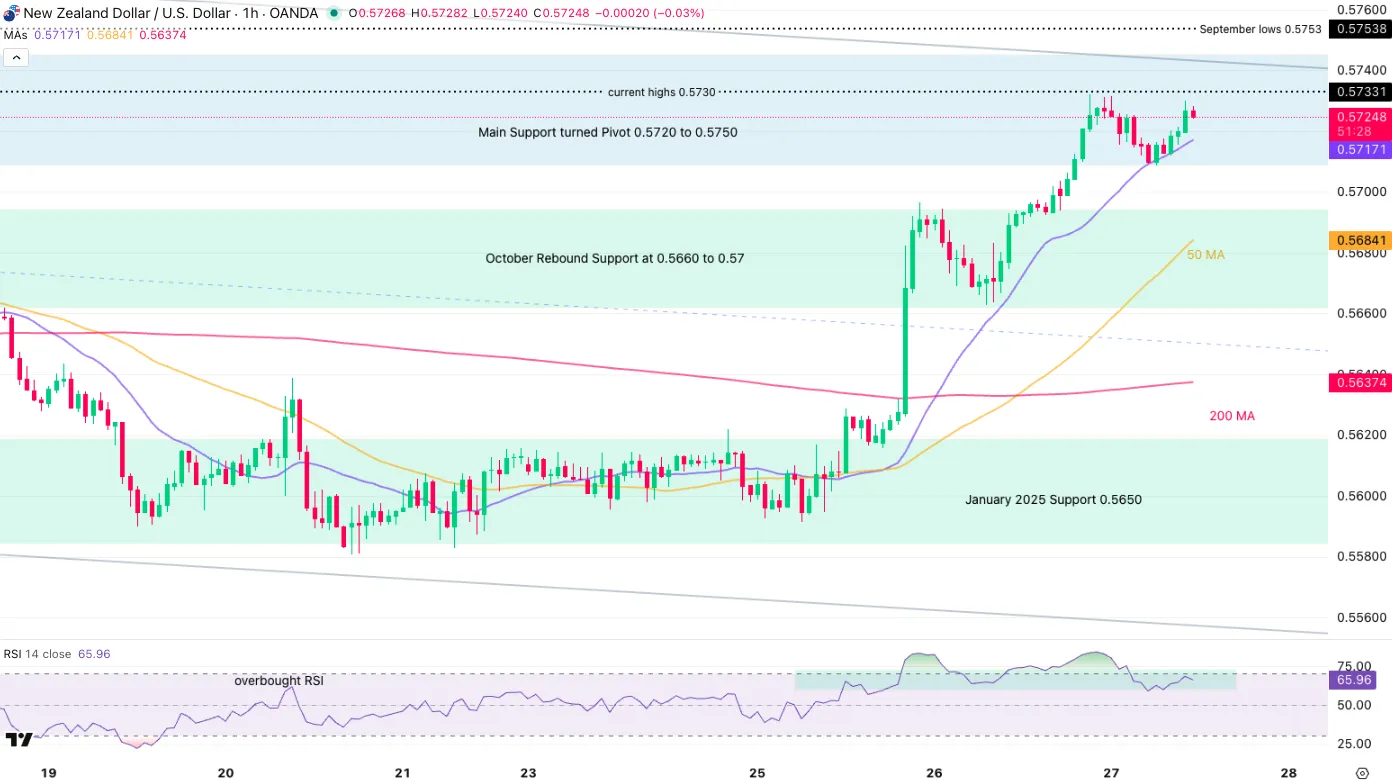
NZD/USD 1H Chart, November 27, 2025 – Source: TradingView
Looking even closer, the action is strongly following the 20-Hour MA at 0.57140;
- A break below would point to a retest of the 4H MA 200 mentioned on the 4H Timeframe
- A break and close above the Daily highs (0.5730) will then face a 100-pip resistance to breakout of the Weekly bear Channel
- Above this, the next Resistance is 600 pips higher.
Safe Trades!
NZDUSD Wave Analysis
NZDUSD: ⬆️ Buy
- NZDUSD broke daily Falling Wedge
- Likely to rise to resistance level 0.5800
NZDUSD currency pair recently reversed from support area between the powerful support level 0.5550 (which has been reversing the price from January) and the lower daily Bollinger Band.
The upward reversal from this support area stopped the previous minor impulse wave 5 of the intermediate impulse wave (C) from September.
Having recently broken the resistance level 0.5700 and the daily Falling Wedge from August, NZDUSD can be expected to rise to the next resistance level 0.5800.
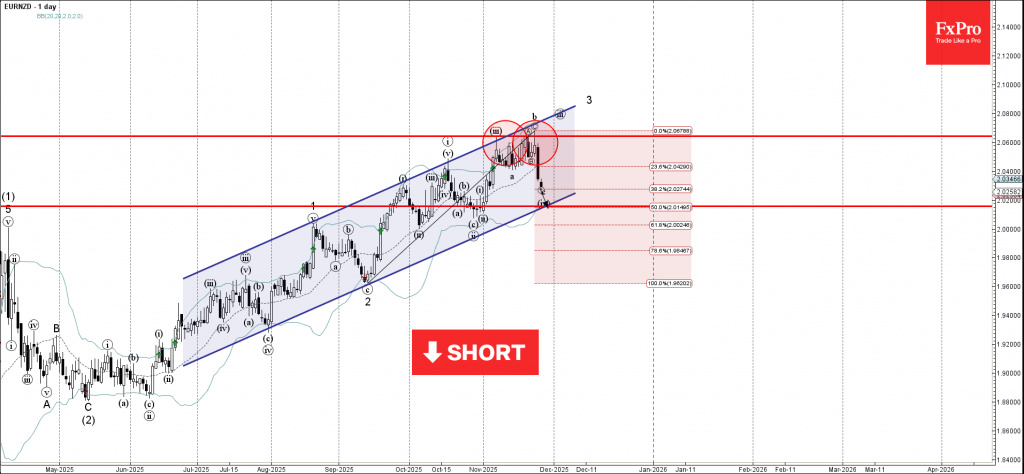
EURNZD Wave Analysis
EURNZD: ⬇️ Sell
- EURNZD reversed from resistance area
- Likely to fall to support level 2.015
EURNZD currency pair recently reversed from resistance area between the key resistance level 2.065 (which stopped the previous minor impulse wave iii), upper daily Bollinger Band and the resistance trendline of the daily up channel from June.
The downward reversal from this resistance area started the active short-term correction iv.
Given the strength of the resistance level 2.065 and the bearish US dollar sentiment seen today, EURNZD can be expected to fall to the next support level 2.015 (target price for the completion of the active correction iv).
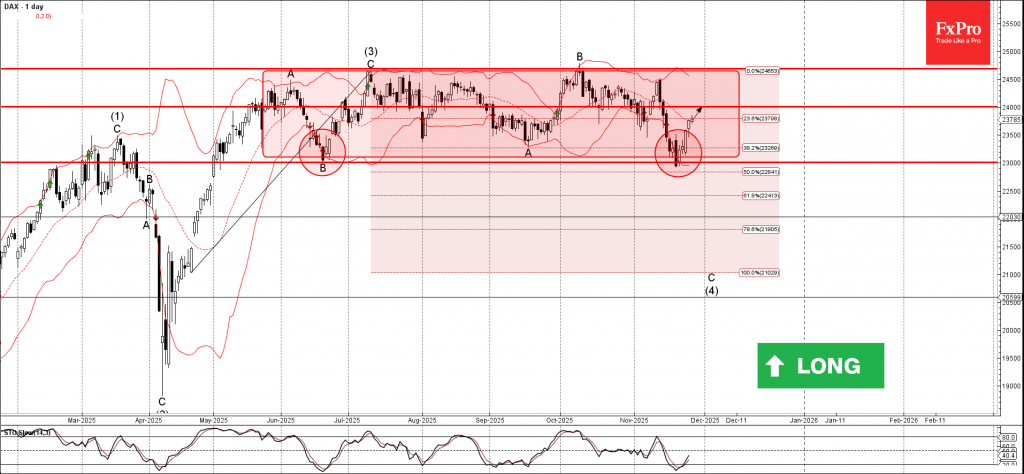
DAX Wave Analysis
DAX: ⬆️ Buy
- DAX reversed from support area
- Likely to rise to resistance level 24000.00
DAX index recently reversed from support area between the support level 23000.00 (lower border of the sideways price range inside which the price has been moving from June) and the lower daily Bollinger Band.
The upward reversal from this support area stopped the previous minor impulse wave C of the intermediate ABC correction (4) from July.
Given the clear daily uptrend, DAX index can be expected to rise to the next resistance level 24000.00.
Sunset Market Commentary
Markets
Global markets developed as one could expect with US markets closed for Thanksgiving. A lack of guidance from US markets and too little ‘new news’ on this side of the Atlantic resulted in technical, order-driven trading. Minutes of the October 29-30 ECB policy meeting didn’t bring much directional insights. The ECB looks very happy to hold on to a status quo scenario. Minor short-term shocks/surprises, if they were to occur, probably won’t steer the policy rate away from the 2% equilibrium level. Inflation has moved close to 2%. A technical dip is possible in 2026, but inflation is expected to stay close to target over the policy horizon. On activity, the ECB assesses that the economy continues to grow despite the challenging global environment. The robust labour market, solid private sector balance sheets and past interest rate cuts are mentioned as sources of resilience. Even a rather elevated level of uncertainty “justifies keeping interest rates unchanged. Maintaining policy rates at their current levels would allow for more information to become available”. “The current level of policy rates should be seen as sufficiently robust for managing shocks, in view of the two-sided inflation risks and taking into account a broad range of possible scenarios”. As said, the bar to deviate from the current 2% level remains (very) high. EMU/German yields understandably are going nowhere, changing 1 bp or less across the curve. After this week’s rebound, European equites held on to recent gains, but without US guidance, momentum dwindled (Eurostoxx 50 perfectly unchanged). Similar story on FX, EUR/USD yesterday/this morning tried a test of the 1.16 big figure, but in the end the status quo. (EUR/USD 1.159) was unavoidable. In the UK, there was also no ‘new news’, but investors had time to give a second look at yesterday’s UK budget announcement. This second opinion at least doesn’t lead to follow-through market enthusiasm. Yesterday’s easing in UK risk premia already came to a standstill. The higher budgetary buffer provides some breathing space, but doesn’t profoundly improve the overall picture, as illustrated by the decline in trend growth from the OBR. UK yields add 1.5-3.5 bps across the curve. It will be interesting to see first comments from the BoE post-budget. A softer inflation due to some subsidies/price caps shouldn’t change the BoE’s LT view on the neutral policy rate, but helps the short term narrative to err on the dovish side. Sterling also runs into resistance after yesterday’s rebound. At EUR/GBP 0.876, the pair still struggles to clear first minor support (uptrend line since June).
News & Views
Belgian headline inflation accelerated from 0.36% M/M in October to 0.56% M/M in November. The most significant price increases last month were registered for travels abroad and city trips (+11.7%), domestic appliances and repairs (+9.1%), motor fuels (+1.9%), information processing equipment (+14.6%), electricity (+1.4%), smartphones (+18.2%) as well as bread and cereals (+0.8%). However, plane tickets (-13.8%), holiday villages (-5%) and natural gas (-0.8%) have had a decreasing effect on the index. Annual inflation increased from 2% to 2.4%, the highest level since April. Core inflation accelerated from 2.58% Y/Y to 3.1% Y/Y. Energy prices fell by 2.15% Y/Y (from -1.85%). Rent inflation was broadly stable at 3.91% Y/Y while food price inflation went up from 2.68% to 3%. Services inflation surged from 3.62% to 4.52%.
The European Commission’s EMU economic confidence indicator remained broadly stable (97 from 96.8) in November. Details showed employment expectations improving, but remaining below the long term average (98.8 vs 100). On a sectoral level, more upbeat confidence in services (broad-based), retail trade (significantly better backward looking view) and construction (employment) was almost entirely offset by lower confidence in industry. Industrial managers’ confidence worsened significantly when it comes to product expectations and the current overall level of order books (both intern & extern). Selling price expectations picked up in all four business sectors, exceeding long-term average in all of them and most so in services. EC consumer confidence was confirmed at -14.2.
EUR/USD Mid-Day Outlook
Daily Pivots: (S1) 1.1563; (P) 1.1582; (R1) 1.1617; More…
Intraday bias in EUR/USD stays neutral as sideway trading continues. Further decline is expected with 1.1655 resistance intact. On the downside, below 1.1490 and 1.1467 will resume the whole decline from 1.1917 high. Next targets are 1.1390, and then 38.2% retracement of 1.0176 to 1.1917 at 1.1252.
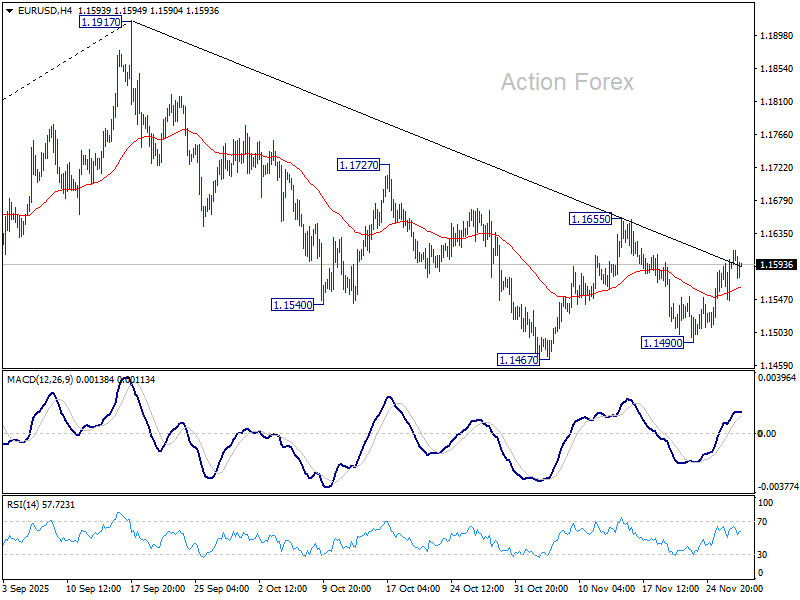
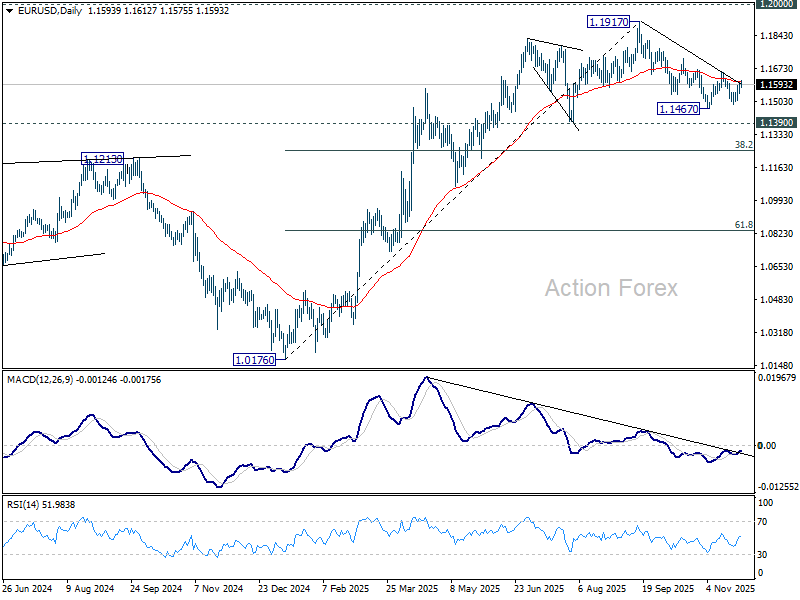
In the bigger picture, considering bearish divergence condition in D MACD, a medium term top is likely in place at 1.1917, just ahead of 1.2 key psychological level. As long as 55 W EMA (now at 1.1328) holds, the up trend from 0.9534 (2022 low) is still in favor to continue. Decisive break of 1.2000 will carry larger bullish implications. However, sustained trading below 55 W EMA will argue that rise from 0.9534 has completed as a three wave corrective bounce, and keep long term outlook bearish.
USD/CHF Mid-Day Outlook
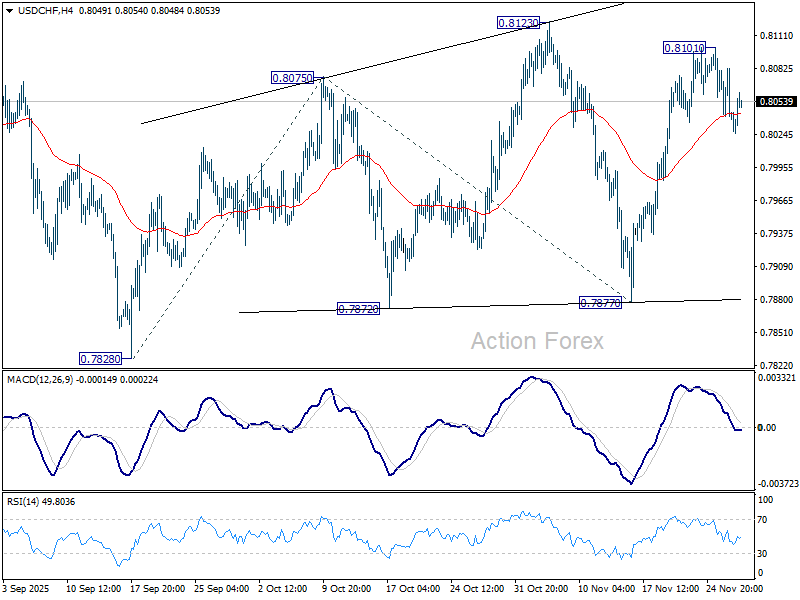
Daily Pivots: (S1) 0.8027; (P) 0.8055; (R1) 0.8072; More…
Intraday bias in USD/CHF stays neutral at this point. Outlook is unchanged that current rise from 0.7877 is still seen as the third leg of the corrective pattern from 0.7828 low. Above 0.8101 will target 0.8123 resistance, and then 138.2% projection of 0.7828 to 0.8075 from 0.7877 at 0.8218. However, sustained break of 55 D EMA (now at 0.8012) will bring deeper fall back to 0.7877 support instead.
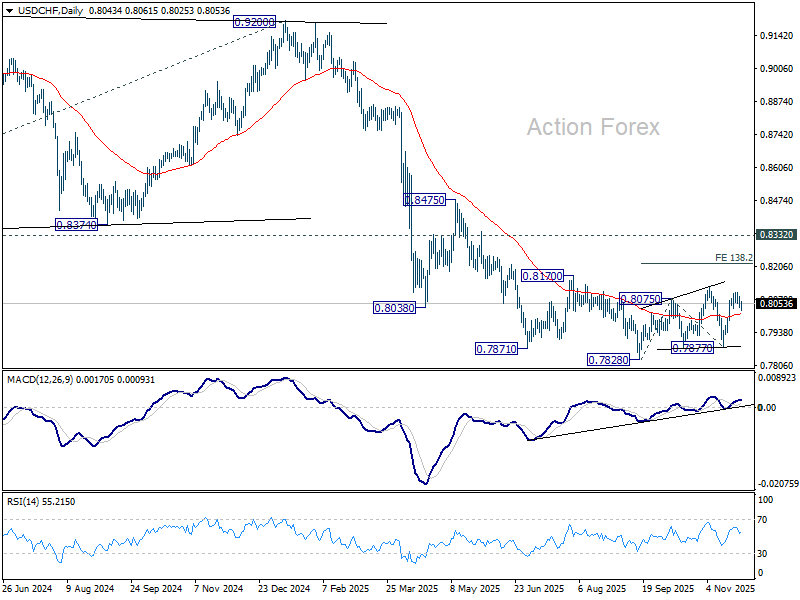
In the bigger picture, long term down trend from 1.0342 (2017 high) is still in progress. Next target is 100% projection of 1.0146 (2022 high) to 0.8332 from 0.9200 at 0.7382. In any case, outlook will stay bearish as long as 0.8332 support turned resistance holds (2023 low).
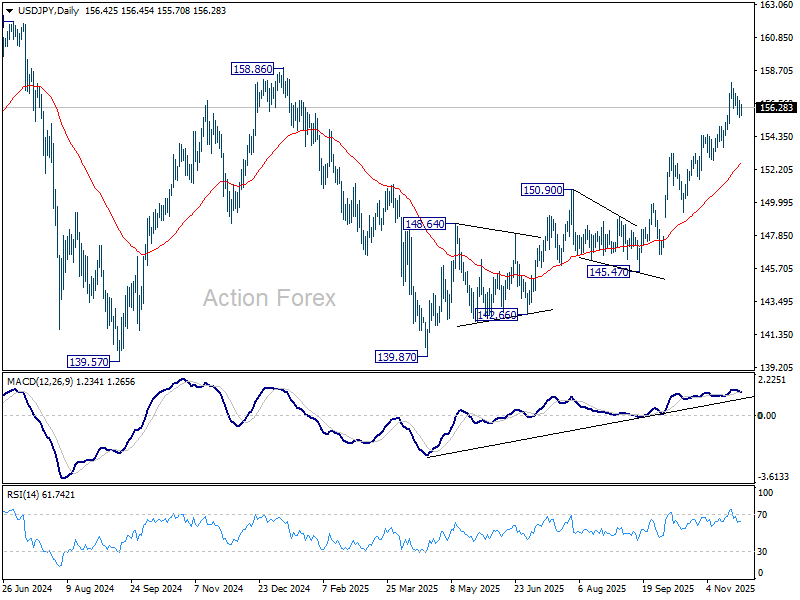
USD/JPY Mid-Day Outlook
Daily Pivots: (S1) 155.82; (P) 156.28; (R1) 156.91; More...
Intraday bias in USD/JPY stays neutral at this point, as consolidation is still in progress. Downside should be contained by 154.47 resistance turned support. On the upside, break of 157.88 will resume the whole rally from 139.87. Next target is 158.86 structural resistance, and then 161.94 high.
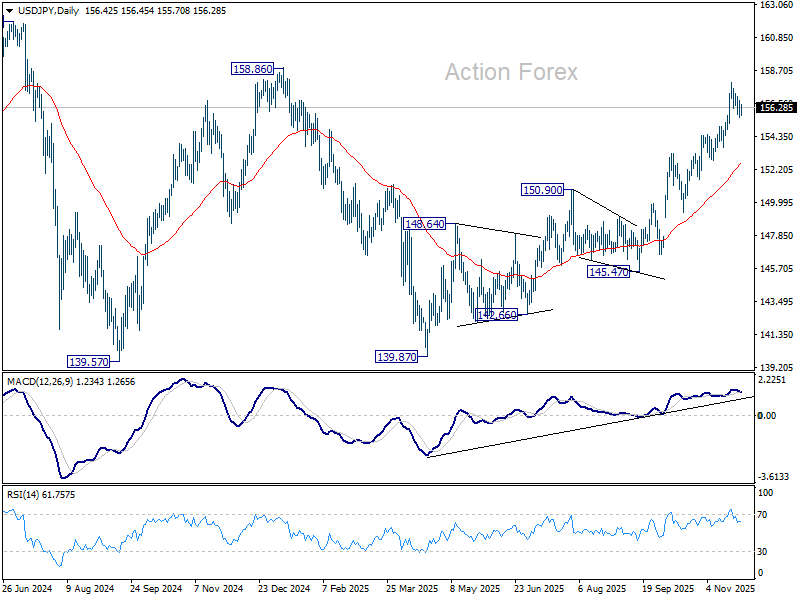
In the bigger picture, current development suggests that corrective pattern from 161.94 (2024 high) has completed with three waves at 139.87. Larger up trend from 102.58 (2021 low) could be ready to resume through 161.94 high. Decisive break of 158.85 structural resistance will solidify this bullish case and target 161.94 for confirmation. On the downside, break of 150.90 resistance turned support will dampen this bullish view and extend the corrective range pattern with another falling leg.
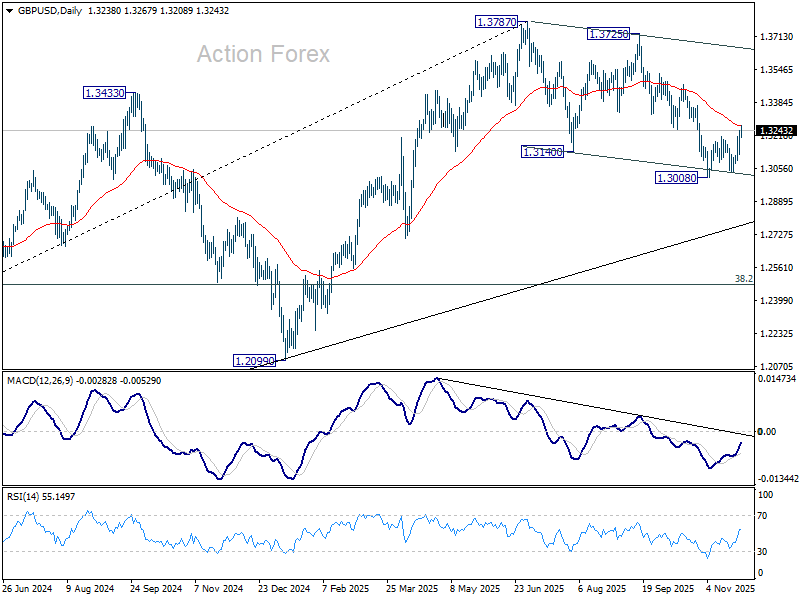
GBP/USD Mid-Day Outlook
Daily Pivots: (S1) 1.3162; (P) 1.3204; (R1) 1.3282; More...
Intraday bias in GBP/USD stays mildly on the upside at this point. Corrective fall from 1.3787 could have completed with three waves down to 1.3008. Sustained trading above 55 D EMA (now at 1.3268) should confirm and target a retest on 1.3725/3787 resistance zone. Nevertheless, break of 1.3123 minor support will revive near term bearishness, and bring retest of 1.3008.
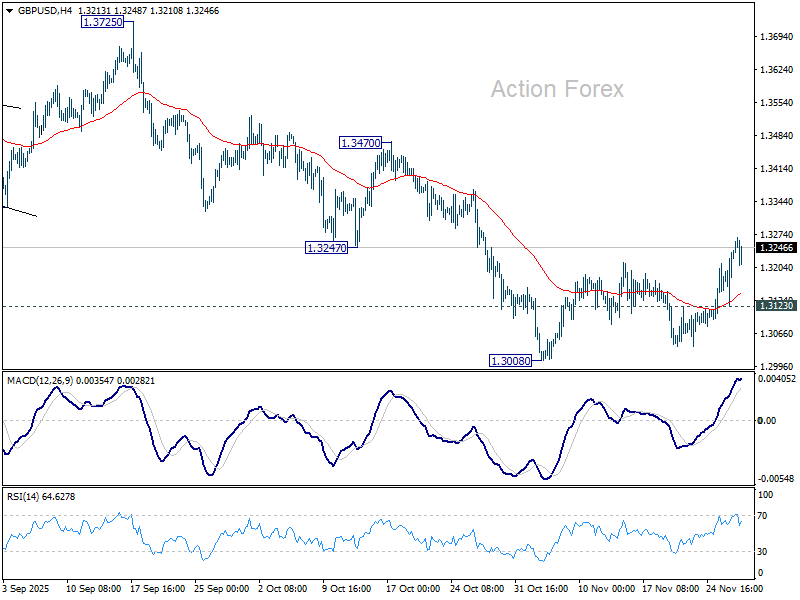
In the bigger picture, the break of 55 W EMA (now at 1.3184) is taken as the first sign that corrective rise from 1.0351 (2022 low) has completed. Decisive break of trend line support (now at 1.2760) will solidify this case and target 38.2% retracement of 1.0351 to 1.3787 at 1.2474 next. Meanwhile, in case of another rise, strong resistance should emerge below 1.4248 (2021 high) to cap upside to preserve the long term down trend.