Sample Category Title
Fed’s Goolsbee Keeps Focus on Inflation, Echoes Warsh on Rate Guidance
Chicago Federal Reserve President Austan Goolsbee said inflation remains the Federal Reserve's primary concern, warning that underlying price pressures continue to move in the wrong direction despite some recent improvement. Speaking in a CNBC interview on Thursday, Goolsbee said, "If we look at core inflation, it's still well too high and it's trending the wrong way, and we've got to see improvement on that." He added that while there have been "a few bright spots," policymakers still have more work to do before inflation can be considered under control.
Goolsbee pointed in particular to services inflation, where he acknowledged some encouraging developments but stressed that progress remains insufficient. "You have seen now a little bit of improvement on this services inflation, and I've been identifying that as something that we would want to see," he said. Even so, he concluded that "as between the two sides of the Fed's mandate—the inflation side and the job market side—clearly the problem's on the inflation side." He also noted that although oil prices could fall rapidly after their recent surge, services inflation remains elevated and moderating wage growth offers "no guarantee inflation will ease."
Despite his hawkish assessment of inflation, Goolsbee declined to offer guidance on the next policy move. He refused to speculate on whether the Fed should raise interest rates or keep them unchanged, saying he agreed with Chair Kevin Warsh's approach of avoiding unnecessary market speculation over the future rate path. His remarks reinforce the Fed's broader message that policymakers remain firmly focused on restoring price stability while leaving future decisions dependent on incoming economic data.
Fed’s Williams Sees Inflation Returning to 2% Only in 2028
Federal Reserve Bank of New York President John Williams reinforced the case for a prolonged period of restrictive monetary policy, warning that inflation remains too high and is now likely to take longer than previously expected to return to target. Speaking on Thursday, Williams said, "Inflation is still too high," while stressing that "it is imperative that we restore inflation to 2% on a sustained basis." He now expects inflation to return to the Fed's target only in 2028, a year later than his previous projection.
Despite the delayed inflation outlook, Williams stopped short of advocating additional near-term tightening. Instead, he argued that "monetary policy is well positioned to lower price pressures," suggesting the current policy stance remains sufficiently restrictive. He expects inflation to moderate over the coming quarters as tariff-related price increases fade, housing inflation cools, and geopolitical pressures linked to the Middle East continue to ease.
Williams also maintained a constructive view of the broader economy, saying growth should remain positive despite elevated uncertainty. A resilient labor market, together with gradually easing inflation, should allow the current policy stance to continue working through the economy. His remarks reinforce the Fed's higher-for-longer message, indicating policymakers remain committed to restoring price stability even if the journey back to 2% takes considerably longer than previously anticipated.
Cliff Notes: Patience is a Virtue
Key insights from the week that was.
Australian consumer prices fell 0.7% in May, bringing the annual rate of headline inflation down from 4.2%yr to 4.0%yr. The main cause of the decline was an 11.9% fall in auto fuel prices; but, relative to our own forecast, it was holiday travel and accommodation that was the primary contributor.
Stripping out these factors, trimmed mean inflation lifted from 3.4%yr to 3.6%yr. Housing inflation was, once again, key with rents surprising to the upside and new dwelling costs recording their strongest monthly increase since late-2022. The latter contrasts with growing evidence of cooling demand in the housing market, pointing to margin pressure for homebuilders. Cost pass-through was also evident in the detail, though weak household spending may stop businesses from recouping costs through mid-year and beyond. The abrupt reversal in energy supply and prices through June (see below) may also see businesses write off margin compression as a transient concern.
Employment subsequently bounced back from holiday-related weakness in April as expected, jobs up +40.3k and the unemployment rate ticking down to 4.4%. That said, revisions to April offset May’s gain, stalling growth in Q2-to-date after a robust Q1. Looking past the month-to-month volatility, the unemployment rate trend is starting to edge up, in line with our expectation for a sustained softening.
Offshore, the past week saw the Memorandum of Understanding between the US and Iran take effect and a consequent rapid opening up of the Strait of Hormuz, freeing circa 20 million barrels of oil from the Strait in recent days. For the most part, the price of oil has trended down, reaching USD72 mid-week, a level last seen before the conflict began in February. It has not been all smooth sailing, however, an attack on a commercial ship off the coast of Oman overnight sparking concern and an increase in the oil price back above USD75. Several points still require detailed negotiation, including Iran’s nuclear program and the management of the Strait beyond the first 60 days. Discussion on a framework to resolve differences on these matters began at the weekend in Switzerland, and are likely to continue for weeks, if not months. Risks for energy supply and price will therefore linger for the foreseeable future.
On the data front, US personal income surprised to the upside in May, rising 0.7% after being unchanged in April. Compensation growth was more modest at 0.4%, consistent with the average since the beginning of the year. Personal spending growth also accelerated to 0.7%, although much of the gain was driven by inflation, with real spending up just 0.3% after a flat April print. PCE inflation was a touch softer than expected in May at 0.4%, while core inflation was in line at 0.3%. Q2 is therefore looking like another soft period for the US consumer. Notable too is that revisions have been against the consumer, the third estimate of Q1 GDP this week seeing quarterly consumption growth revised down to just 0.5% annualised. An upgrade to business investment and a material reduction in import growth in the quarter more than offset for GDP; but being more than 70% of the economy, the weakness in consumption will have a significant bearing on the aggregate pulse hence.
In our view, this data and events in energy markets warrant the FOMC remaining on hold for the remainder of the year as inflation risks slowly abate. However, the market is likely to continue to price the risk of further tightening, particularly while the White House remains out of the monetary policy debate and AI optimisim persists.
US PCE Inflation Remains Sticky in May as Consumer Spending Accelerates; EURusd Reacts
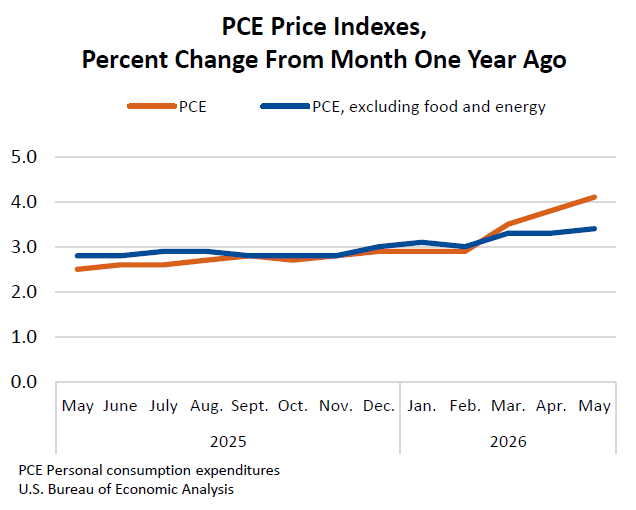
The Bureau of Economic Analysis (BEA) released the Personal Consumption Expenditures (PCE) price index data on June 25, 2026. The headline PCE price index rose 0.4% on a month-over-month basis and 4.1% year-over-year, matching the Bloomberg economic calendar consensus forecasts. Meanwhile, the core PCE price index—which excludes volatile food and energy components and serves as the Federal Reserve’s preferred inflation gauge—increased by 0.3% from the previous month and 3.4% from a year ago, also aligning perfectly with market expectations. The data highlights persistent inflationary pressures, keeping the Federal Reserve under pressure to maintain a restrictive monetary policy stance.
Headline vs. core PCE inflation
The Federal Reserve closely monitors core PCE inflation because it strips out the transitory volatility of food and energy prices, providing a clearer view of long-term underlying inflation trends. Additionally, the PCE index accounts for substitution bias—where consumers switch to cheaper alternatives as prices rise—making it a more dynamic measure than the Consumer Price Index (CPI).
Personal consumption expenditure - PCE - Source: Bureau of Economic Analysis -
Past performance is not indicative of future results.
| Metric | MoM change | YoY change | Trend |
|---|---|---|---|
| PCE price index | 0.4% | 4.1% | Upward from 3.8% prior |
| Core PCE price index | 0.3% | 3.4% | Upward from 3.3% prior |
Consumer spending and prices
- Robust consumer demand: Personal spending rose by 0.7% in May, outpacing the 0.6% forecast, while real personal spending ticked up 0.3%. This indicates that consumer demand remains resilient despite elevated borrowing costs.
- Income growth: Personal income accelerated sharply by 0.7%, well ahead of the 0.4% consensus estimate, providing households with the financial buffer to sustain spending.
- Services vs. goods: Services inflation continues to be the primary driver of price stickiness, sustained by steady wage growth and a tight labor market, as evidenced by initial jobless claims dropping to 215k.
Cross-comparison with CPI and PPI data
The sticky PCE print aligns with the earlier Consumer Price Index (CPI) report, which also showed a flattening of the disinflationary trend, particularly in shelter and core services.
Compared to the Producer Price Index (PPI) data from earlier in the month, which tracks wholesale costs, input pressures remain uneven. While some manufacturing supply chains have stabilized, the pass-through of resilient service-sector input costs continues to filter into consumer-facing metrics, limiting how quickly final prices can moderate.
Macroeconomic and Federal Reserve implications
With headline inflation edging up to 4.1% and core PCE sticking at 3.4%, progress toward the Federal Reserve’s 2% average inflation target appears to have stalled. Combined with an upward revision to first-quarter GDP to 2.1% and resilient durable goods orders, the economic backdrop suggests that the FOMC may prolong its “higher for longer” interest rate stance. The probability of near-term rate cuts may diminish, as the central bank requires more conclusive evidence of cooling demand before easing policy.
Gain insights from OANDA's market experts and learn how to apply technical analysis tools in a real-time market. Register to attend live webinars hosted by Moheb Hanna, CMT, CFTe.
EUR/USD 1-Hour chart technical analysis
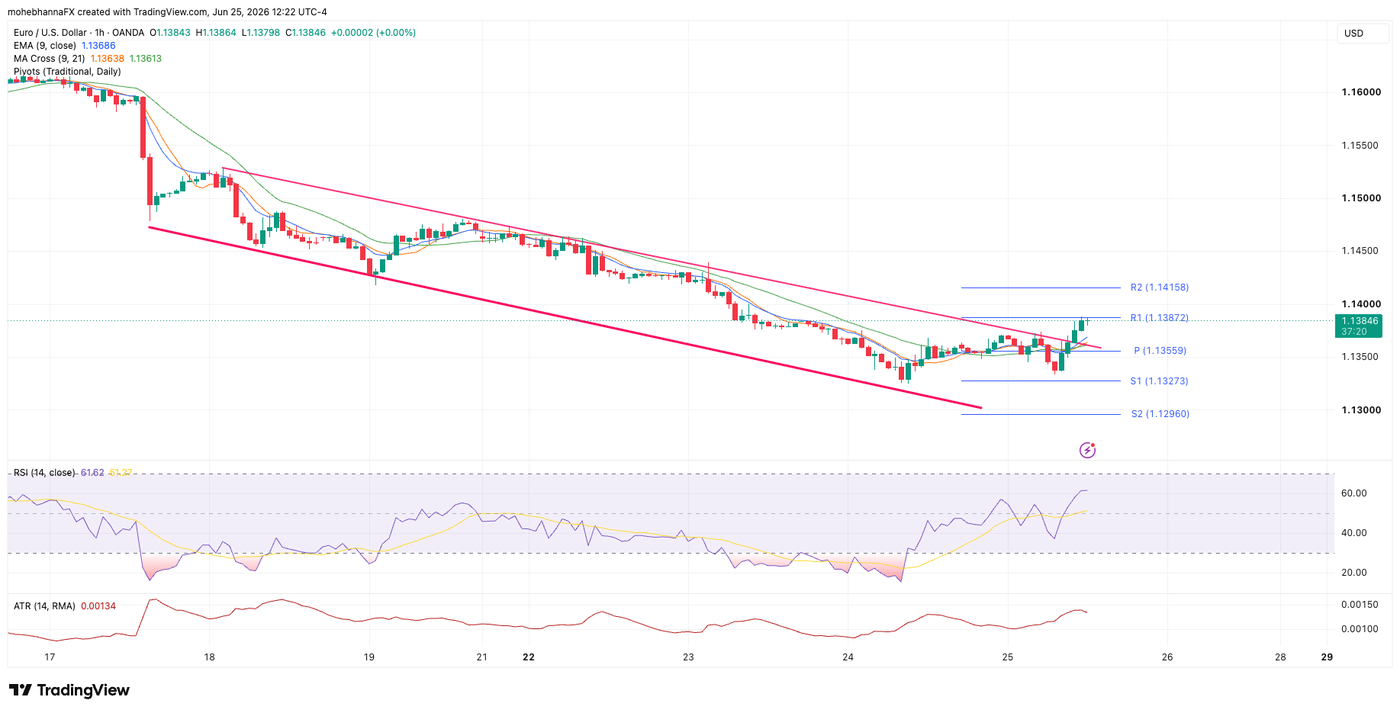
Price action and trend analysis
- Descending Channel Breakout: For the past several days, price action has been tightly contained within a clear descending channel (demarcated by the two solid pink trendlines).
- Recent Breakout: The most notable recent development is that the price has aggressively broken out above the upper descending trendline.
- Moving Averages: The price is currently trading above both the EMA (9) and the MA Cross (9, 21), which are starting to curl upward, confirming short-term bullish momentum following the breakout.
Pivot points & key levels
The chart displays Daily Traditional Pivot Points, providing immediate horizontal structural levels:
- R2 (Resistance 2): 1.14158
- R1 (Resistance 1): 1.13872 — The price is currently testing this level.
- P (Daily Pivot): 1.13559 — Acting as immediate dynamic support.
- S1 (Support 1): 1.13273
- S2 (Support 2): 1.12960
Indicators (RSI & ATR)
- RSI (14): Currently sitting at 59.72 and climbing above its yellow moving average line. It has firmly exited the oversold territory seen on the 24th and has room to run before hitting the overbought threshold (70.00), signaling strong bullish momentum.
- ATR (14): Sitting at 0.00139 (approx. 14 pips). Volatility is ticking up slightly from its recent floor, which aligns with the breakout move.
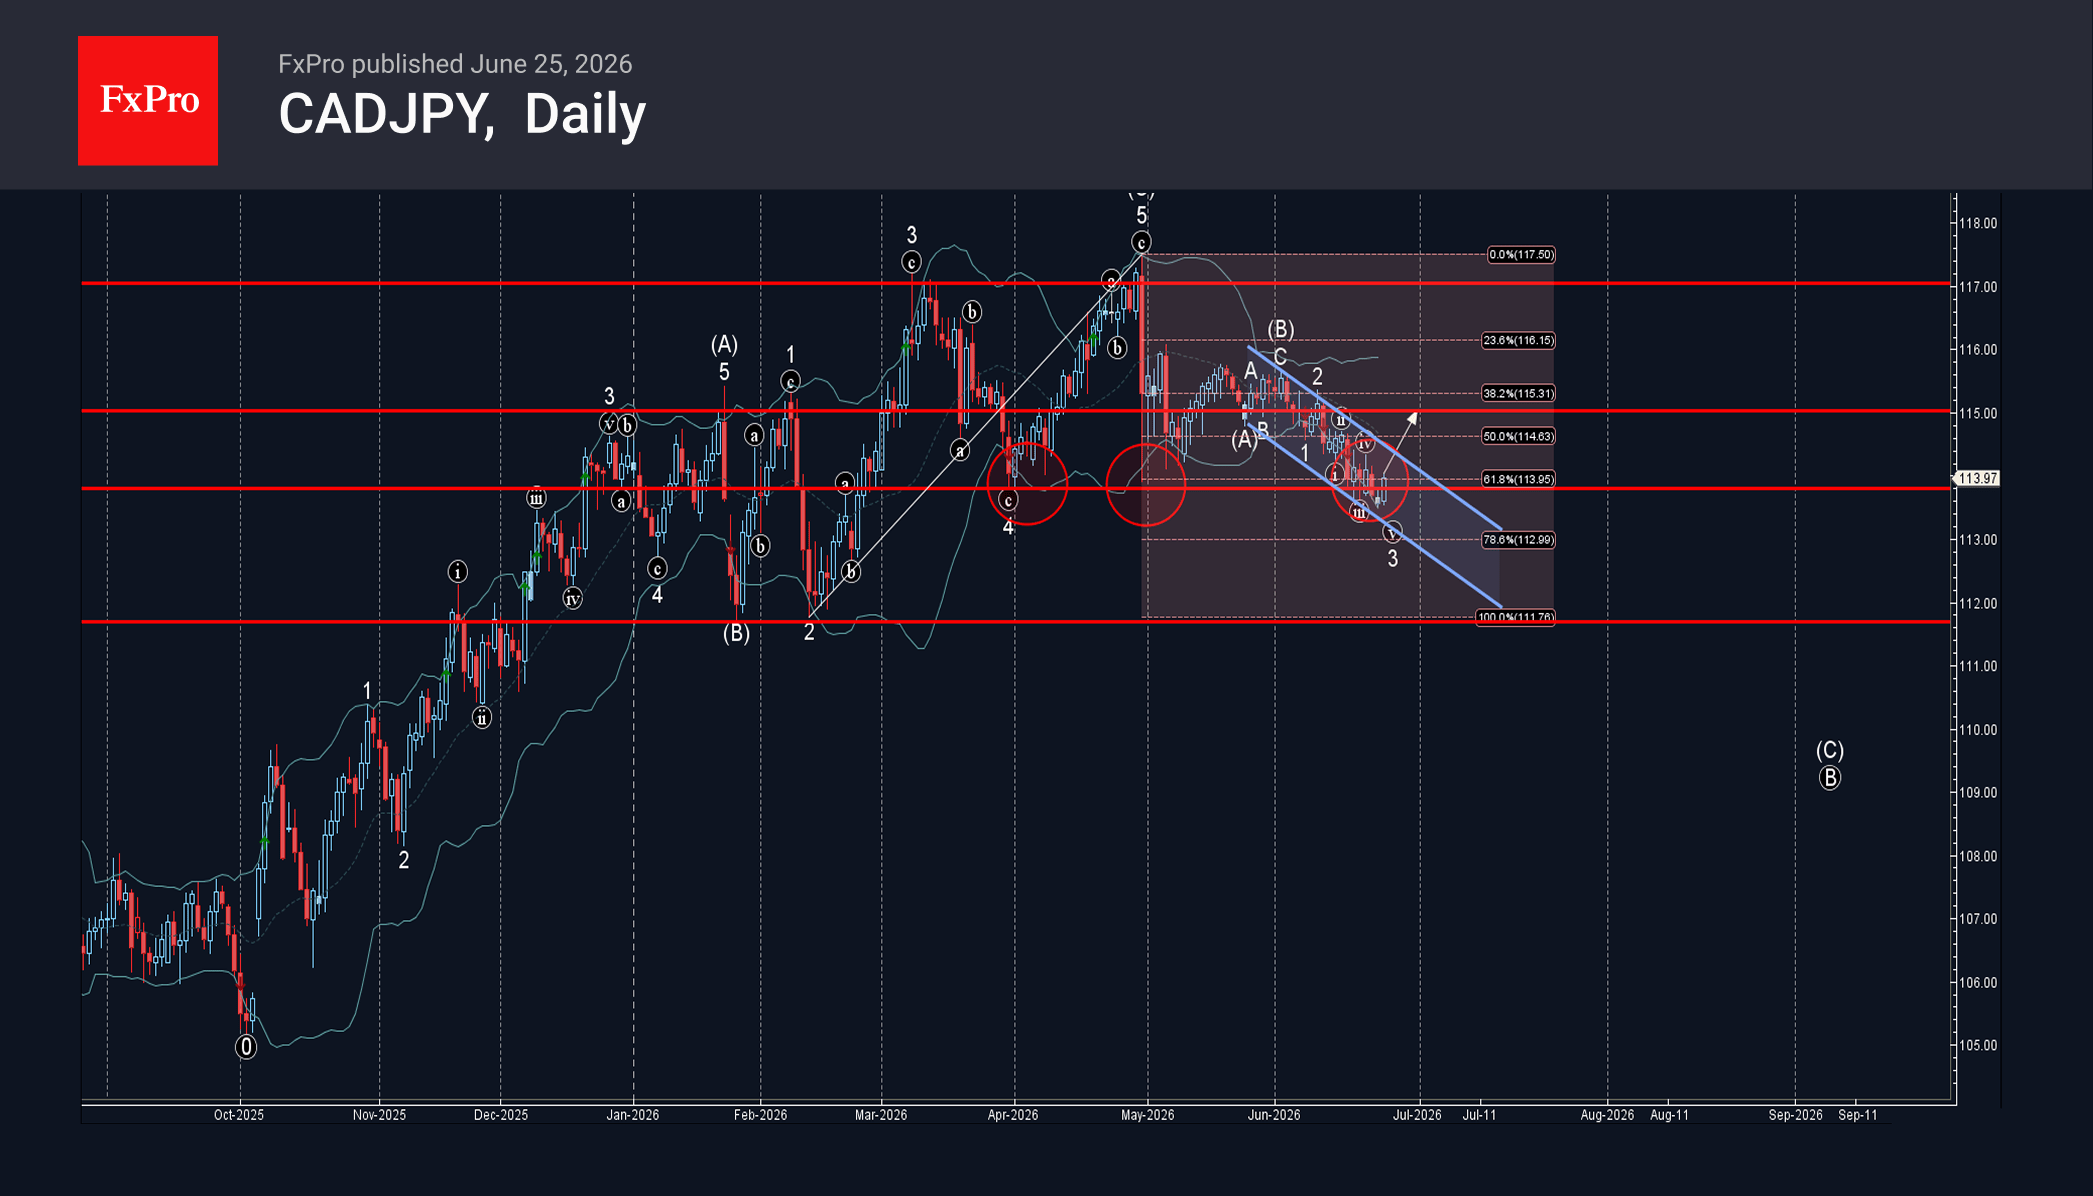
CADJPY Wave Analysis
CADJPY: ⬆️ Buy
– CADJPY reversed from support zone
– Likely to rise to resistance level 115.00
CADJPY currency pair recently reversed up from the support zone between the support level 113.80, which has been reversing the price from March, lower daily Bollinger Band and the support trendline of the daily down channel from May.
This support zone was further strengthened by the 61.8% Fibonacci correction of the upward impulse from February.
Given the clear daily downtrend, CADJPY can be expected to rise to the next resistance level 115.00, that stopped earlier minor correction 2 at the start of June.
Eco Data 6/26/26
| GMT | Ccy | Events | Act | Cons | Prev | Rev |
|---|---|---|---|---|---|---|
| 23:30 | JPY | Tokyo CPI Y/Y Jun | 1.70% | 1.40% | ||
| 23:30 | JPY | Tokyo CPI Core Y/Y Jun | 1.60% | 1.60% | 1.30% | |
| 23:30 | JPY | Tokyo CPI Core-Core Y/Y Jun | 1.90% | 1.60% | ||
| 12:30 | USD | Goods Trade Balance (USD) May P | -105.8B | -85.0B | -83.7B | |
| 12:30 | USD | Wholesale Inventories May P | 0.30% | 0.20% | 0.60% | |
| 14:00 | USD | UoM Consumer Sentiment Jun F | 48.9 | 48.9 | ||
| 14:00 | USD | UoM 1-Yr Inflation Expectations Jun F | 4.60% | 4.60% |
| 23:30 | JPY |
| Tokyo CPI Y/Y Jun | |
| Actual | 1.70% |
| Consensus | |
| Previous | 1.40% |
| 23:30 | JPY |
| Tokyo CPI Core Y/Y Jun | |
| Actual | 1.60% |
| Consensus | 1.60% |
| Previous | 1.30% |
| 23:30 | JPY |
| Tokyo CPI Core-Core Y/Y Jun | |
| Actual | 1.90% |
| Consensus | |
| Previous | 1.60% |
| 12:30 | USD |
| Goods Trade Balance (USD) May P | |
| Actual | -105.8B |
| Consensus | -85.0B |
| Previous | -83.7B |
| 12:30 | USD |
| Wholesale Inventories May P | |
| Actual | 0.30% |
| Consensus | 0.20% |
| Previous | 0.60% |
| 14:00 | USD |
| UoM Consumer Sentiment Jun F | |
| Actual | |
| Consensus | 48.9 |
| Previous | 48.9 |
| 14:00 | USD |
| UoM 1-Yr Inflation Expectations Jun F | |
| Actual | |
| Consensus | 4.60% |
| Previous | 4.60% |
US Inflation Rises Above 4% and Adds to Fed Rate Hike Bets – PCE
The US personal consumption expenditures price index (PCE), Fed’s preferred inflation gauge, rose 4.1% y/y in May from unrevised 3.8% previous month, in line with expectations.
May’s figure shows the largest increase and the first break above 4.0% in over three years, with inflation moving further from the central bank’s 2% target, adding to growing bets for Fed rate hike, as early as September.
Core PCE index that excludes the most volatile food and energy components, increased 3.4% y/y in May after rising 3.3% in April, also meeting forecasts.
The Fed kept its benchmark overnight interest rate in the 3.50%-3.75% range at the policy meeting last week, but updated quarterly projections showed policymakers expected to raise borrowing costs this year amid growing concerns about inflation.
Economists expect inflation, sparked by the US/Israel war against Iran, to stay elevated for some time despite the latest drop in oil prices due to a ceasefire and initial peace deal which continues to fuel optimism.
Separate report showed that consumer spending, which accounts for more than two-thirds of economic activity, jumped 0.7% in May compared to 0.4% rise in April.
The data also showed that consumers have maintained their spending, as larger tax refunds and stock market rally have partially compensated negative impact from higher fuel prices.
Although rise in spending reflects higher prices, May data also signal that consumption might be on track to speed up in the second quarter after slowing in the first three months of the year.
US: Personal Income and Spending Both Perk Up in May
- Following a flat reading in April, personal income rebounded by 0.7% month-over-month (m/m) in May, ahead of market expectations for a 0.4% gain. The gain was driven by a firming in wages and salaries, and an increase in farm proprietors' income, reflecting an increase in payments from the American Relief Act of 2025.
- After adjusting for inflation, taxes, and transfers, real disposable personal income rose 0.3% m/m, partially reversing a 0.5% decline the prior month.
- Consumer spending rose 0.7% m/m in nominal terms, slightly ahead of expectations. Higher prices were part of the story, but not all of it. Real spending rose by a healthy 0.3% m/m.
- Looking across the broad categories, goods spending rebounded, rising 0.5% m/m in real terms. Spending on durables strengthened on the month, supported by higher outlays on motor vehicles and parts (+0.9% m/m), recreational goods and vehicles (+0.8%), and furniture and household equipment (+1.2%). Spending on non-durables was also higher (+0.3%), even as households purchased less gasoline for a third consecutive month. Services spending edged up 0.2% m/m, supported by higher outlays on necessities such as housing, healthcare, and financial services, while consumers cut back on food services and accommodation as well as transportation.
- With income growth keeping up with spending this month, the personal saving rate held steady at four-year low of 3.0%.
- Inflationary pressures remained firm on the month. Core PCE—the Fed’s preferred inflation gauge—rose 0.3% m/m, in line with the prior month and with the average monthly increase so far this year. The twelve-month change accelerated to 3.4%, up slightly from 3.3% last month.
Key Implications
- Today’s report brought some welcome news on the health of the consumer. Both spending and income both rebounded, marking a clear improvement from the prior month. While the revisions made the savings rate look slightly less dire than it did a month ago, it's still sitting at the lowest level in roughly four-years, suggesting household spending capacity remains limited. This is evident in spending data, where consumers have had to start making some tough choices in recent months, by reducing travel and lodging expenses, and cutting back on dining out in an effort to stay within budget.
- Looking ahead, the worst of the gas price increases seems to be in the rear-view mirror, and households should get some modest reprieve from lower prices at the pump in June. The labor market also appears to be showing some signs of strengthening, while household wealth continues to be supported by rising equity valuations. This should help to sustain consumer spending at around a 2% pace through year-end.
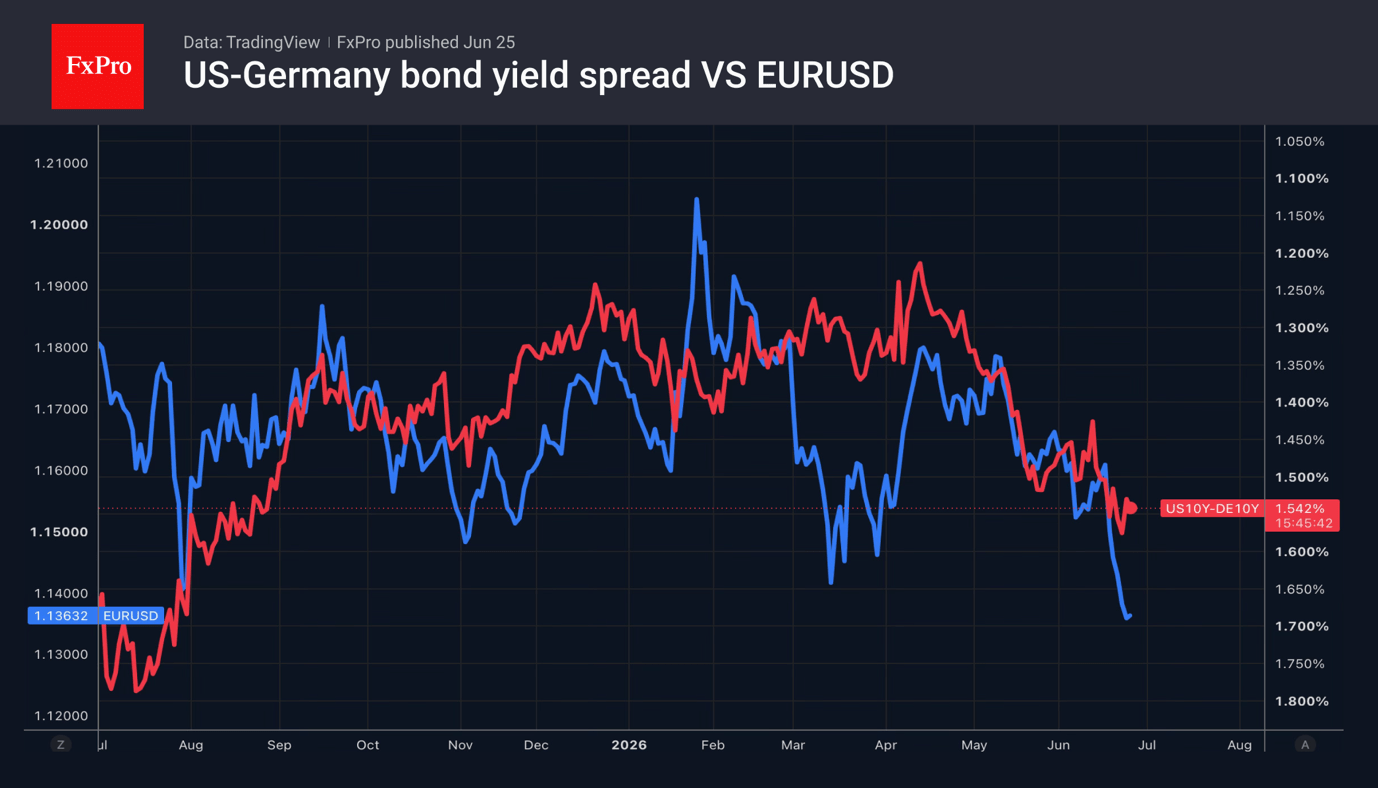
The Euro: After the Sunset Comes the Dawn
- Monetary policy divergence is weighing on EURUSD.
- Europe has always recovered from crises.
The US dollar is on track to close the month with its biggest gain since July last year, thanks to the Fed’s hawkish shift, gloomy European PMI figures and Christine Lagarde’s dovish comments. As a result, the yield spread between US and German bonds is widening, triggering capital outflows and contributing to the fall in EURUSD over 5 of the last 6 trading days.
In recent years, Europe has been in a state of constant upheaval. COVID-19, the armed conflict in Ukraine, the energy crisis, the political crisis in France, Donald Trump’s tariffs, and, finally, the conflict in the Middle East have all weighed on European households’ sentiment, reinforcing their tendency to save. In 2025, they were saving 15 per cent of their disposable income, compared with 12.5 per cent before the pandemic. In contrast, in the US, the figure has fallen over this period from close to 7% at the start of 2020 to 2.6%, according to the latest April data. Since 2019, US consumption has risen by 18%, whilst that of Europeans has risen by only 5.5%. This is precisely what explains the persistent lag in eurozone GDP growth.
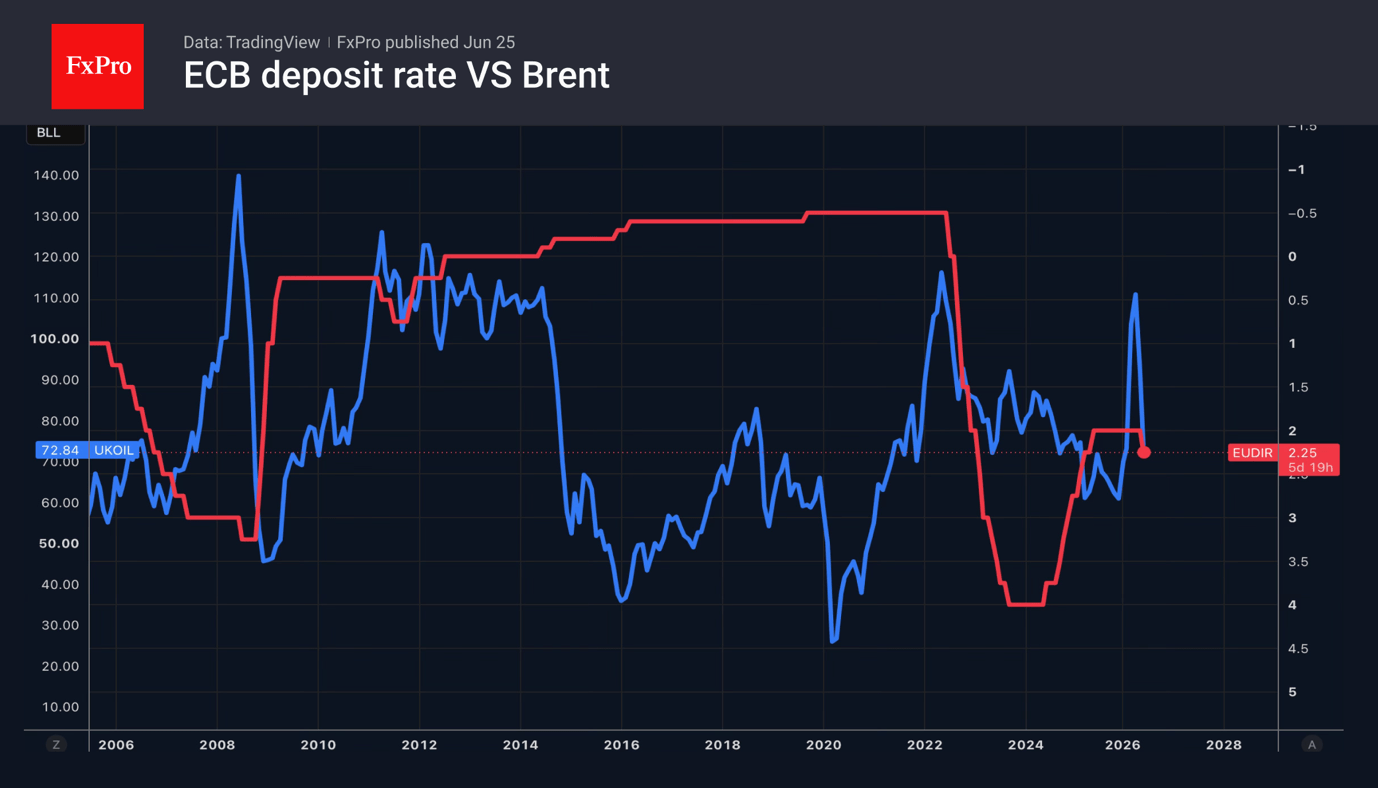
To boost Europe’s GDP growth, domestic demand needs to be stimulated; however, this is being hampered by a never-ending series of shocks. Due to the conflict in the Middle East, the currency bloc’s economy is teetering on the brink of contraction and may well slip into negative territory in the second quarter. Consequently, investors were sceptical that the ECB could raise rates aggressively. Now that oil prices are falling, there is no need to do so. Christine Lagarde’s cautious tone on further hikes is understandable.
However, every sunset is followed by a sunrise. Eurozone GDP has rebounded strongly since the pandemic, and the region’s economy has proved far more resilient to US tariffs than anticipated. Friedrich Merz’s fiscal stimulus measures have raised hopes of rapid growth. Each time, the EURUSD pair has rallied. The end of the conflict in the Middle East and the associated fall in oil prices are creating a springboard for a new surge.
For now, the euro is being dragged down by a ‘hawkish’ surprise from Kevin Warsh. The futures market is pricing in a 65% probability of a Fed rate hike in September and estimates a 47% probability of two rounds of monetary tightening in 2026. However, if the surge in US inflation proves temporary, the figures will fall, and the EURUSD pair will find its footing. The first signal may come from the PCE.
The FxPro Analyst Team
Risk Rebound Fails to Shake Dollar’s Grip on Markets
Global forex markets turned notably quieter on Thursday as major currency pairs and crosses consolidated within Wednesday's ranges. The pause came despite a sharp improvement in risk sentiment after Micron delivered blockbuster quarterly earnings, easing concerns that this week's technology selloff had marked the beginning of a broader unwind in the AI trade. Asian equities responded enthusiastically, with Japan's Nikkei surging 4.61% and South Korea's KOSPI jumping 5.42%, leaving both indices back near the record highs reached only days earlier. US equity futures also pointed higher, though with considerably less conviction.
Currency markets, however, were far less impressed. The latest batch of US data, particularly May's PCE inflation report, reinforced the Federal Reserve's concerns over sticky price pressures and did little to weaken expectations for further policy tightening. With inflation remaining well above target and consumer spending staying resilient, September increasingly looks like the most likely timing for the next Fed rate hike.
Some major institutions are also forecasting another increase in December, while the most hawkish forecasts now call for three hikes in September, October and December. Against that backdrop, the Dollar continued to hold onto this week's gains even as risk appetite recovered.
The strength of the Greenback has left its mark across markets. Gold has broken decisively below the key $4,000 psychological level, while Silver has fallen through $60 as investors reassess the outlook for US interest rates.
In the currency space, Dollar remains the week's strongest performer. Yen ranks second, with USD/JPY once again pressing against the multi-decade high at 161.94, bringing the risk of Japanese intervention back into focus. Sterling is the third-best performer, with markets appearing to welcome Prime Minister Keir Starmer's resignation.
At the other end of the rankings, New Zealand Dollar remains the weakest as falling oil prices reduce the urgency for further RBNZ tightening. Aussie is the second weakest after inflation, employment and spending data painted a mixed picture that keeps an August RBA hike possible but far from certain.Euro, Swiss Franc and Loonie are trading in the middle of the pack.
With no further top-tier economic releases due before the weekend, trading activity may remain subdued as investors turn their attention toward July and next week's US non-farm payrolls report.
AUD/USD Stabilizes as Inflation, Jobs and Spending Keep August RBA Hike Alive
Headline inflation cooled, but that's not the story the RBA is likely to focus on. Sticky core inflation, resilient household spending, and a labor market that continues to hold up have kept August rate hike expectations very much alive. Read More.
Silver Breaks Below $60, Can $50 Hold?
Silver's break below $60 is only the beginning of the real story. The much more important battleground lies around $50, where powerful technical support meets strong industrial demand. The question is whether those forces can withstand a surging Dollar and increasingly hawkish Fed expectations. Read More.
US Core PCE Rises to 3.4%, Income and Spending Top Expectations
The Fed received little relief from May's PCE report. Consumer spending remained strong, personal income accelerated, and inflation stayed well above target—a combination that keeps the case for further tightening intact. Read More.
US Durable Goods Orders Hit by Transportation, Underlying Demand Improves
The headline looked weak, but the details told a different story. Transportation orders drove May's decline in US durable goods, while core orders posted a much stronger-than-expected gain, pointing to resilient business investment. Read More.
US Jobless Claims Fall to 215K, Labor Market Remains Resilient
The latest jobless claims report delivered good news and a note of caution. Layoffs remain low, but more Americans are taking longer to find new work. The labor market is cooling—but only gradually. Read More.
Schnabel: ECB Will Need More Rate Hikes Despite Middle East Ceasefire
Lower oil prices have not changed Isabel Schnabel's message. The ECB Executive Board member says the ceasefire in the Middle East is "no reason" to relax policy, and she still expects further rate hikes to bring inflation back to 2%. Read More.
Germany Gfk Consumer Climate Improves Slightly as Inflation Fears Recede
Germany's consumer mood is no longer deteriorating, but it isn't recovering either. Lower oil prices and easing geopolitical tensions have reduced inflation fears, yet households remain reluctant to spend and continue to prioritize saving. Read More.
BoJ's Tamura Lays Out Tightening Roadmap to 2%
Naoki Tamura didn't just argue for more BoJ rate hikes—he outlined a roadmap. With quarter-point increases every few months toward a 2% neutral rate and the possibility of moving even faster, his remarks offer the clearest glimpse yet into how Japan's tightening cycle could unfold. Read More.
Australia Employment Beats Forecasts, But April Revision Tempers Strength
Australia's jobs report looked strong at first glance, with employment comfortably beating expectations. Dig a little deeper, however, and the picture becomes more balanced. A sharp downward revision to April and falling hours worked suggest the labor market is cooling gradually rather than reaccelerating. Read More.
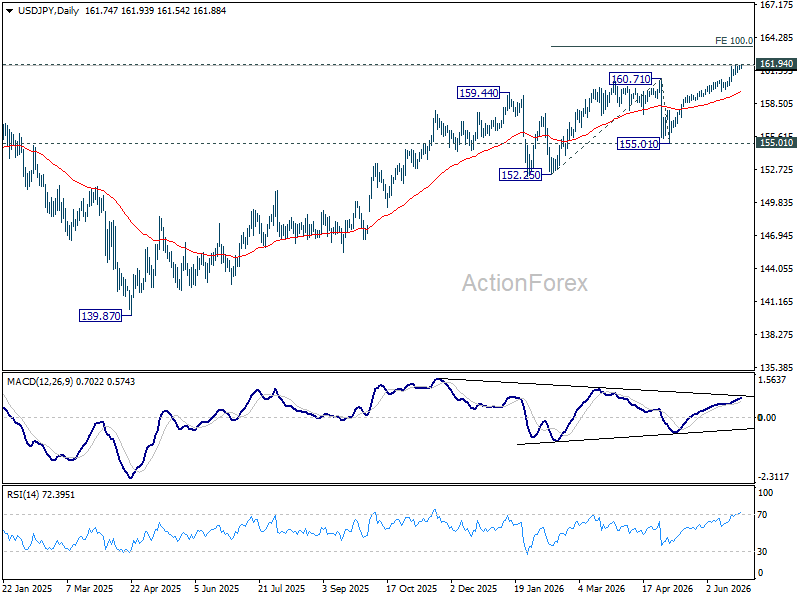
USD/JPY Daily Outlook
Intraday bias in USD/JPY remains neutral for the moment. On the downside, firm break of 160.58 support should confirm short term topping, on bearish divergence condition in 4H MACD. Deeper fall should then be seen to 55 D EMA (now at 159.46) and below. Nevertheless, decisive break of 161.94 high will resume the larger up trend to 100% projection of 152.25 to 160.71 from 155.01 at 163.47 next.
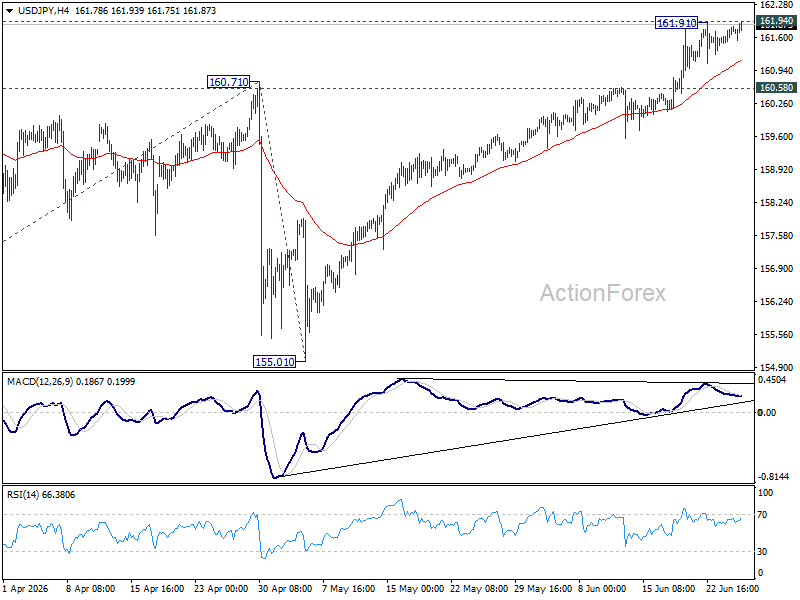
In the bigger picture, for now, corrective pattern from 161.94 (2024 high) is still seen as completed at 139.87. Rise from there is seen as resuming the long term up trend. This will remain the favored case as long as 55 W EMA (now at 155.17) holds.