Sample Category Title
GBP/USD Bounces Back As EUR/GBP Awaits Catalyst
GBP/USD is attempting a recovery wave above 1.3100. EUR/GBP is consolidating and might aim for a fresh increase above 0.8800.
Important Takeaways for GBP/USD and EUR/GBP Analysis Today
- The British Pound is attempting a fresh increase above 1.3120.
- There was a break above a bearish trend line with resistance at 1.3070 on the hourly chart of GBP/USD at FXOpen.
- EUR/GBP is trading in a positive zone above the 0.8750 pivot level.
- There is a short-term declining channel forming with resistance near 0.8805 on the hourly chart at FXOpen.
GBP/USD Technical Analysis
On the hourly chart of GBP/USD at FXOpen, the pair declined after it failed to clear 1.3370. As mentioned in the previous analysis, the British Pound even traded below 1.3250 against the US Dollar.
Finally, the pair tested the 1.3000 zone and is currently attempting a fresh increase. The bulls were able to push the pair above the 50-hour simple moving average and 1.3080. The pair even climbed above a bearish trend line with resistance at 1.3070.
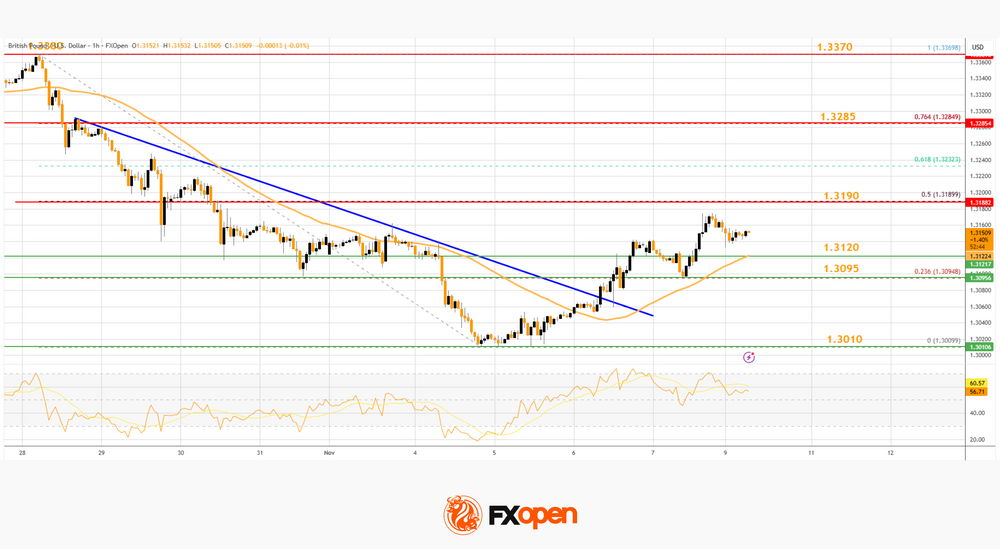
The bulls were able to push the pair above the 23.6% Fib retracement level of the downward move from the 1.3369 swing high to the 1.3009 low.
On the upside, the GBP/USD chart indicates that the pair is facing hurdles near 1.3180. The next major barrier could be near the 50% Fib retracement at 1.3190. A close above 1.3190 could open the doors for a move toward 1.3285. Any more gains might send GBP/USD toward 1.3370.
On the downside, there is decent support forming at 1.3095. If there is a downside break below 1.3095, the pair could accelerate lower. The first area of interest might be near 1.3010, below which the pair could test 1.2950. Any more losses could lead the pair toward 1.2880.
EUR/GBP Technical Analysis
On the hourly chart of EUR/GBP at FXOpen, the pair started a consolidation phase after it failed to surpass 0.8830. The Euro traded below 0.8800 and 0.8790 against the British Pound.
The EUR/GBP chart suggests that the pair even tested 0.8775. A low was formed at 0.8773 and the pair is now correcting some losses. It climbed above the 23.6% Fib retracement level of the downward move from the 0.8816 swing high to the 0.8773 low.
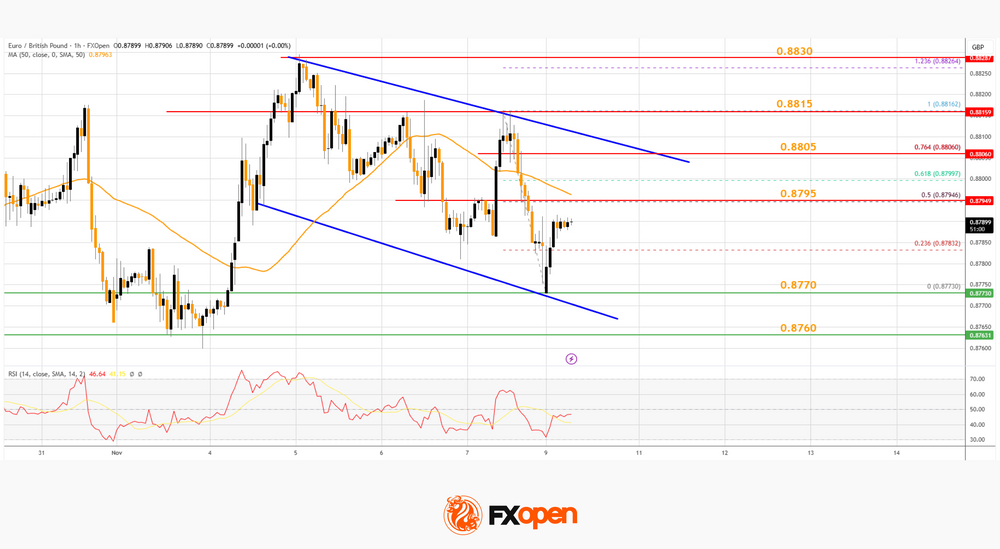
The pair is now facing resistance near 0.8795 and the 50-hour simple moving average. The next hurdle sits at 0.8805. There is also a short-term declining channel forming with resistance near 0.8805. It coincides with the 76.4% Fib retracement.
A close above the 0.8805 level might accelerate gains. In the stated case, the bulls may perhaps aim for a test of 0.8830. Any more gains might send the pair toward 0.8850.
Immediate support sits near 0.8770. The next area of interest for the bulls might be 0.8760. A downside break below 0.8760 might call for more downsides. In the stated case, the pair could drop toward 0.8720.
Trade over 50 forex markets 24 hours a day with FXOpen. Take advantage of low commissions, deep liquidity, and spreads from 0.0 pips. Open your FXOpen account now or learn more about trading forex with FXOpen.
This article represents the opinion of the Companies operating under the FXOpen brand only. It is not to be construed as an offer, solicitation, or recommendation with respect to products and services provided by the Companies operating under the FXOpen brand, nor is it to be considered financial advice.
Some Relief
Last week was a tough one: it was marked by a cocktail of rare but discouraging US data. Falling yields failed to lift risk appetite, and better-than-expected tech earnings couldn’t lure investors back on board. OpenAI even suggested that the US could warrant its trillion-dollar debt — I mean, it was a disaster.
But this morning, things look calmer. The news that the US government shutdown could finally come to an end lifts market sentiment, after the Senate put together the 60 votes needed to push the deal through its first stage. It’s only the opening act in what could still be a drawn-out political drama, but investors are seizing on any sign of progress to end the longest US government shutdown in history and feed on data — data they need to understand where the US economy stands, where inflation and jobs are headed, and what the Federal Reserve (Fed) should do next.
Speaking of the Fed: some members are cautious, while others appear to be giving more weight to inflation than the weakening jobs market. Last week’s Challenger report printed the highest job losses in October since 2003, and Friday’s University of Michigan survey hinted at deteriorating sentiment, gloomy expectations, and a mixed inflation outlook, with 1-year inflation expectations rising to 4.7%. It’s a close call.
Yet the secured overnight financing rate (SOFR) tumbled last week below 4%, the lowest in three years. That’s not because the Fed decided to cut it — SOFR isn’t something the Fed fixes directly. It’s a market-driven rate reflecting what banks and investors charge each other for overnight cash secured by Treasuries. When there’s plenty of liquidity sloshing around, the rate naturally drops. And there is excess cash in the system: nearly $7.5 trillion sits in US money-market funds, while US Treasury auctions have been thinner — partly because the looming government shutdown complicated issuance plans. In other words, the Fed hasn’t pulled the lever — the market has, reacting to all the excess cash. This higher liquidity could give risk assets a lift this week, if the news flow remains calm.
Futures are hinting at an encouraging start, and if the US government can reopen, it would be the cherry on top. The S&P 500 has rebounded around 2% since rumours of a potential shutdown end broke last Friday.
Add to that Jensen Huang’s comments at TSMC’s annual sports day on Saturday — saying “the business is very strong, and it’s growing month by month, stronger and stronger,” and that they need more chips from TSMC — and investors are forgetting last week’s drama. TSMC is up more than 1%, SoftBank jumps 2.5%, Korean SK Hynix is up more than 5% and Nasdaq futures lead gains. Hopefully it lasts!
In FX, the US dollar is steady this morning. The greenback came under renewed selling pressure last week after failing to break the back of the 200-DMA. The end of the US shutdown should — in theory — give a positive jolt to the dollar and challenge some technical levels against major currencies. The EURUSD last week tested support near the minor 23.6% Fibonacci retracement on the year-to-date rally, around 1.1480. Cable dived but returned above the 38.2% retracement on its own year-to-date rally and the USDJPY initially fell on the Finance Minister showing teeth to the bears. But JPY bears are back since Friday, helping support the US dollar, alongside a jump in US yields this morning that prints a roughly 1% rise across the curve.
US economic data is light this week due to ongoing shutdown, but earnings from Nvidia-backed neocloud provider CoreWeave, Cisco and Disney will be in focus, along with 13F filings due Friday. Michael Burry’s large position against Nvidia and Palantir contributed to last week’s risk-off sentiment. Investors will look for evidence of lower exposure or continued bets against tech giants.
Elsewhere, Chinese inflation unexpectedly rose last month, as factory-gate deflation eased. Unlike the West, which doesn’t need more inflation, this is good news for China — they’ve been trying to boost consumption for years, and production prices have been falling for almost three years. That said, the October surprise could be temporary, partly due to the Golden Week holiday lasting an extra day.
Still, US crude is better bid this morning, above $60pb, probably helped by encouraging inflation data from China. But US crude remains under pressure within a longer-term negative trend since summer, influenced by OPEC’s strategy to release more barrels. The cartel has now announced a pause in output increases between January and March, and this Wednesday’s monthly oil report should provide further clarity: will OPEC try to set a floor under prices, or continue letting them slide to gain market share?
Progress in Talks to End US Shutdown
In focus today
In Norway, October inflation data is released today, and we expect unchanged core inflation at 3.0% y/y. October is a month with limited seasonal variations so the range of outcomes this time is lower than usual. We believe the figures will show that the disinflationary trend continues, but at a moderate pace. The most interesting thing will be to see whether services inflation continues to decline as we saw a tendency in September. With Norges Bank's fear that high wage growth will keep inflation up, this will be the most important thing for monetary policy going forward.
In Denmark, we receive inflation data for October. We expect inflation will edge lower to 2.2% y/y from 2.3% y/y in September. It is particularly driven by a base effect on energy. That said, electricity prices also increased this October, and the winter tariff kicks in, which lifts consumer prices. Food prices continue to be the big joker following the price surge over the summer, which weighs heavy on consumer confidence.
In Sweden, the week starts with the release of September's production value index (PVI). If the production figures included in the Q3 GDP indicator published at the end of October are any guide, today's release should confirm the strong growth in September. Retail sales, however, moved sideways at elevated levels, suggesting today's household consumption indicators will remain broadly unchanged. Households appear to have been the main driver of Q3 growth.
The coming week is rather light on market movers due to the US government shutdown. However, the US NFIB Small Business Optimism Index will be released on Tuesday, providing insights into labour market developments. In Sweden, labour market data will be released from the Public Employment Service on Wednesday and from Statistics Sweden's labour force survey on Friday. Given the macro data improvement from recent months, there is hope that the labour market will gradually respond positively. On Friday, China is set to release its monthly data for retail sales, industrial production, home sales and house prices.
Economic and market news
What happened since Friday
In the US, the Senate has taken a key step toward ending the 40-day government shutdown by advancing a bill to fund the government through 30 January 2026 and include three full-year appropriations measures. The deal, brokered with bipartisan support, ensures back pay for federal employees and a December vote on extending ACA subsidies, a key Democratic demand. The bill now moves to the House and then to President Trump for approval. Markets seem to see short-term relief as global shares rose on optimism over the progress to end the shutdown. US stock futures gained, US treasury yields edged higher, and the dollar recovered some of last week's losses. However, concerns about the shutdown's economic toll remain.
Also in the US, the University of Michigan's preliminary November consumer sentiment survey showed a decline, driven by weaker assessments of both the current situation and future expectations. Inflation expectations for 1 year ticked up to 4.7% (from 4.6% in October), while the 5-year inflation expectations declined to 3.6% (from 3.9%).
In China, exports surprised to the downside in October as it dropped into negative growth of -1.1% y/y (cons: 2.9% y/y) from 8.3% y/y in September. However, the decline may be due to the uncertainty around Trump's 100% tariff threat and extra holiday in October compared to last year. We expect exports to rebound in November as the US-China trade deal in late October led to a tariff decline of 10% to the US rather than the increase of 100%.
CPI inflation surprised to the upside, coming in at 0.2% y/y in October. This was the fastest growth in consumer prices since January, while core inflation reached a 20-month high of 1.2% y/y. Meanwhile, PPI fell 2.1% y/y, marking the 37th consecutive monthly decline, though deflationary pressures eased slightly.
In Norway, manufacturing production declined 1.7% m/m in September, driven by a drop in activity in mainland industries. These figures tend to be volatile on a monthly basis, but the underlying trend is now clearly downwards, so 3M/3M is down 0.3 %. Hence, hard data now start to align with the recent weakness in leading indicators.
Annual wage growth (incl. bonuses etc.) dropped from 6.3% to 4.8% in Q3, as we had expected. The figures confirm our suspicion that the high reading in Q2 was driven mainly by accrual effects, and illustrates that wage growth is slowing, but still higher than Norges Bank expected in the MPR in September (4.7%).
In Hungary, Prime Minister Viktor Orban announced that the country has secured an indefinite exemption from US sanctions on Russian energy imports, following a meeting with President Donald Trump. However, the White House stated the exemption is valid for only one year. Hungary, which remains heavily reliant on Russian energy, also agreed to purchase USD 600m worth of US liquefied natural gas as part of the deal.
In the bidding war for obesity drug developer Metsera, Pfizer secured a USD 10bn deal after Novo Nordisk exited the race on Saturday. The acquisition grants Pfizer a key foothold in the rapidly expanding weight-loss market, while Novo remains focused on advancing its own pipeline of obesity treatments.
Equities: Global equities were lower last week, including on Friday, with the MSCI World Index down roughly 1.5% for the week. Defensive sectors outperformed, while cyclical growth lagged as valuation concerns resurfaced in financial media, with discussions of a potential correction. One of the more interesting developments was the strong daily positive correlation between equities and yields, meaning a negative correlation between equities and bonds. This pattern largely reflected the mixed US labour market data: upbeat ADP employment figures one day, followed by weaker Challenger numbers the next.
From a broader perspective, despite the recent equity weakness, we continue to view the backdrop positively. Macro fundamentals remain solid, and earnings results, particularly in the US supportive. Moreover, the latest developments in US-China trade relations have been constructive. Hence, we do not see an increased probability of a market correction compared to several weeks ago. If anything, the combination of resilient data and market dynamics strengthens our confidence that equity markets are likely to move higher in the near term. Asian equities are off to a strong start this morning, with South Korea up more than 3%. Futures in both Europe and the US also point higher. Sentiment will likely be supported by growing signs that the US government shutdown could soon come to an end.
FI and FX: After a volatile end to last week, sentiment this morning has improved following news of Democratic party members in Senate voting to support a deal to end the US government shutdown. US yields are roughly 3bp higher across the curve overnight while EUR/USD is little changed. Risk sensitive currencies are also bid this morning with oil exporting FX benefitting from oil prices moving moderately higher.
EUR/USD Daily Outlook
Daily Pivots: (S1) 1.1532; (P) 1.1562; (R1) 1.1593; More…
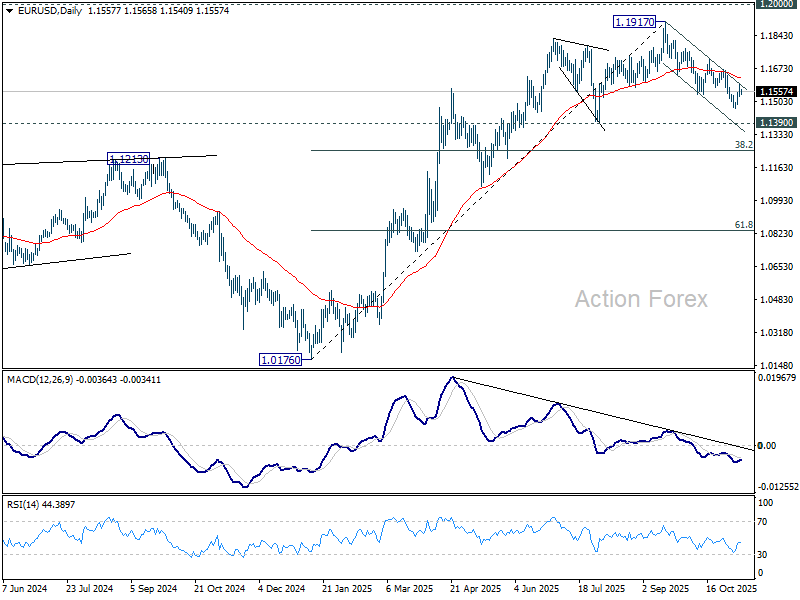
Intraday bias remains neutral at this point. Further fall would remain in favor as long as 55 D EMA (now at 1.1623) holds. Below 1.1467 will resumed the decline from 1.1917 to 1.1390 support next. However, sustained trading above 55 D EMA will argue that fall from 1.1971 has completed as a correction only, and bring further rise to 1.1727 resistance next.
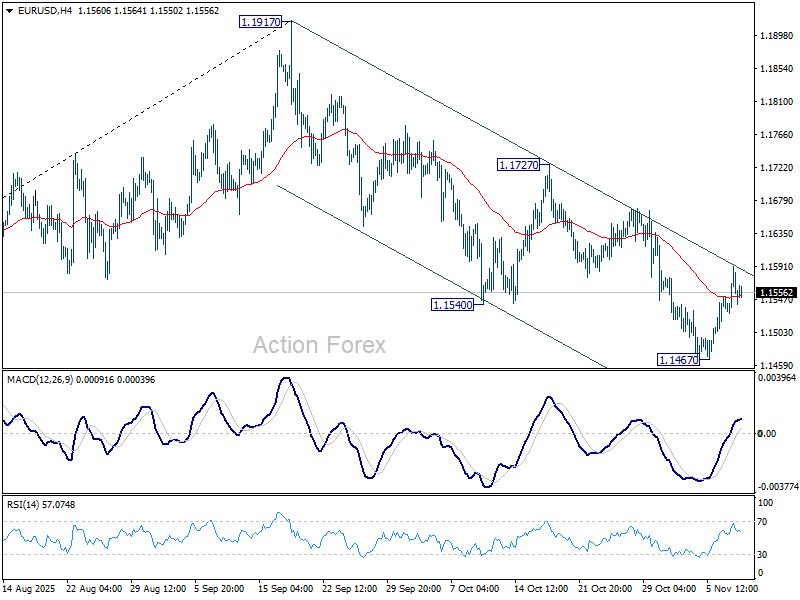
In the bigger picture, considering bearish divergence condition in D MACD, a medium term top is likely in place at 1.1917, just ahead of 1.2 key psychological level. As long as 55 W EMA (now at 1.1306) holds, the up trend from 0.9534 (2022 low) is still expected to continue. Decisive break of 1.2000 will carry larger bullish implications. However, sustained trading below 55 W EMA will argue that rise from 0.9534 has completed as a three wave corrective bounce, and keep long term outlook outlook bearish.
USD/JPY Daily Outlook
Daily Pivots: (S1) 152.97; (P) 153.28; (R1) 153.75; More...
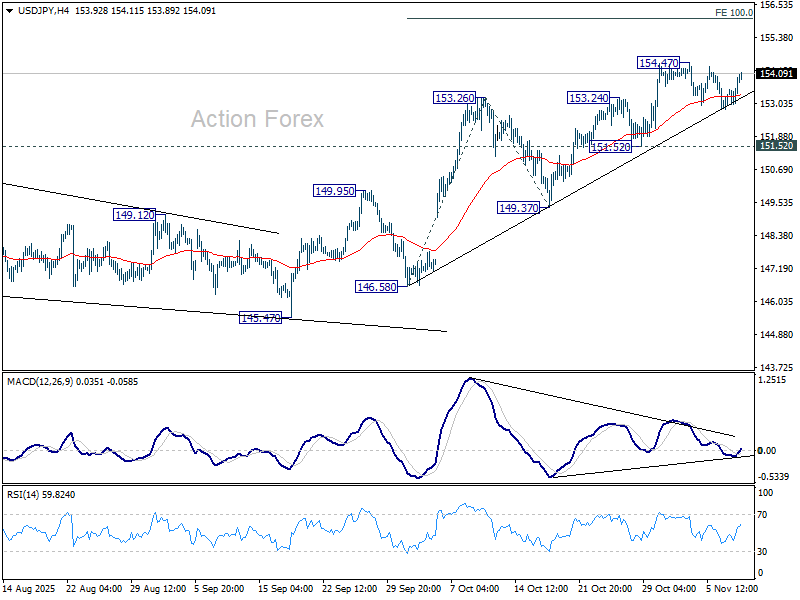
USD/JPY is still bounded in consolidations below 154.47 and intraday bias stays neutral. Further rally is expected as long as 151.52 support holds. Above 154.47 will resume larger rise from 139.87 and target 100% projection of 146.58 to 153.26 from 149.37 at 156.05. Break there will pave the way to 158.85 key structural resistance.
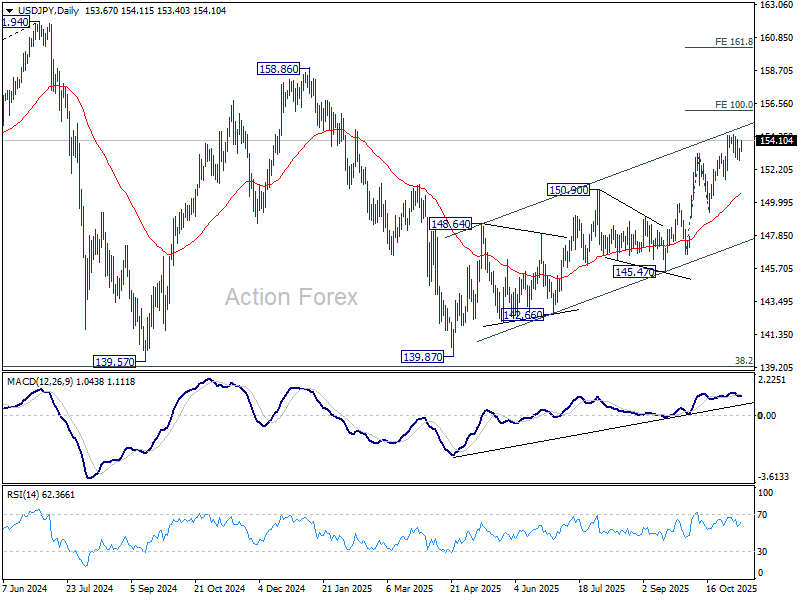
In the bigger picture, current development suggests that corrective pattern from 161.94 (2024 high) has completed with three waves at 139.87. Larger up trend from 102.58 (2021 low) could be ready to resume through 161.94 high. On the downside, break of 149.37 support will dampen this bullish view and extend the corrective pattern with another falling leg.
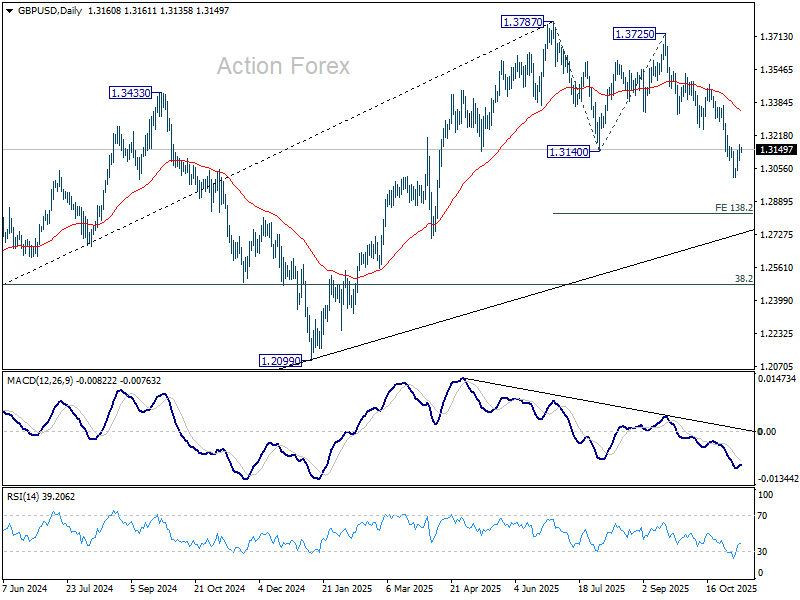
GBP/USD Daily Outlook
Daily Pivots: (S1) 1.3112; (P) 1.3144; (R1) 1.3192; More...
Intraday bias in GBP/USD remains neutral and more consolidations would be seen above 1.3008. Further decline is expected as long as 1.3247 support turned resistance holds. Break of 1.3008 will target 138.2% projection of 1.3787 to 1.3140 from 1.3725 at 1.2831). Nevertheless, firm break of 1.3247 will suggest that fall from 1.3787 has completed as a corrective move already.
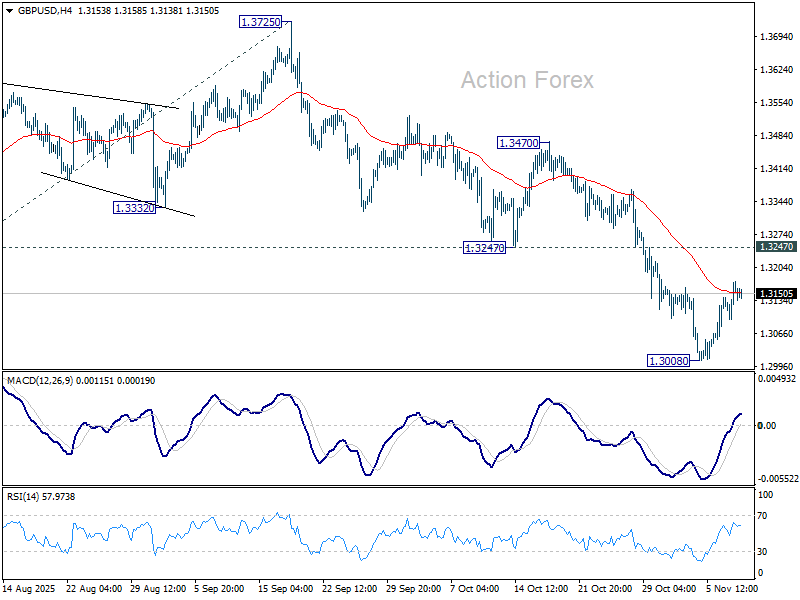
In the bigger picture, the break of 55 W EMA (now at 1.3185) is taken as the first sign that corrective rise from 1.0351 (2022 low) has completed. Decisive break of trend line support (now at 1.2780) will solidify this case and target 38.2% retracement of 1.0351 to 1.3787 at 1.2474 next. Meanwhile, in case of another rise, strong resistance should emerge below 1.4248 (2021 high) to cap upside to preserve the long term down trend.
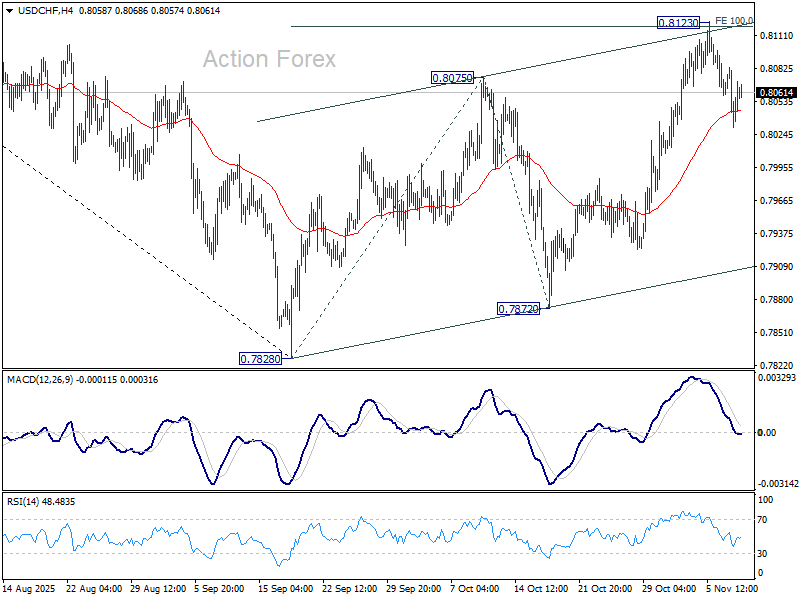
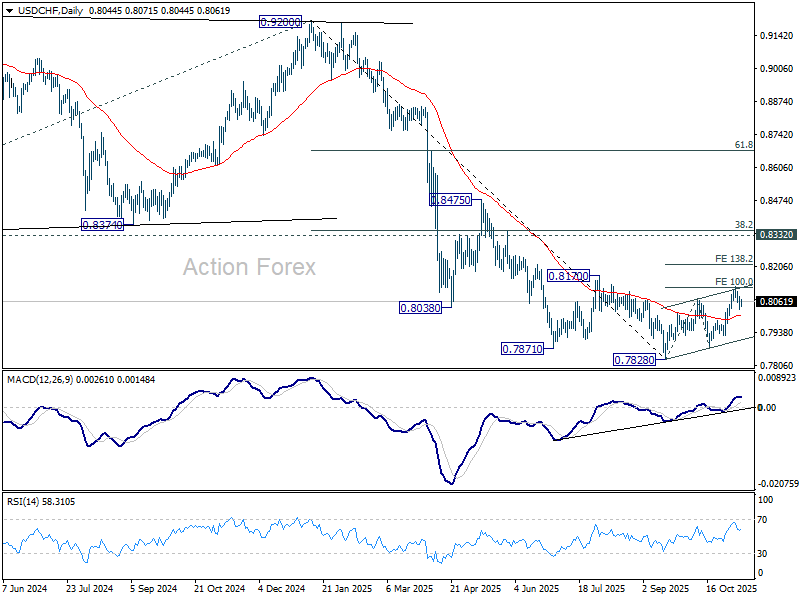
USD/CHF Daily Outlook
Daily Pivots: (S1) 0.8027; (P) 0.8056; (R1) 0.8080; More…
Intraday bias in USD/CHF remains neutral at this point. On the downside, decisive break of 55 D EMA (now at 0.8007) will argue that the corrective bounce from 0.7828 has completed and bring retest of this low. On the upside, above 0.8123 will resume the rebound to 138.2% projection of 0.7828 to 0.8075 from 0.7872 at 0.8213.
In the bigger picture, long term down trend from 1.0342 (2017 high) is still in progress. Next target is 100% projection of 1.0146 (2022 high) to 0.8332 from 0.9200 at 0.7382. In any case, outlook will stay bearish as long as 0.8332 support turned resistance holds (2023 low).
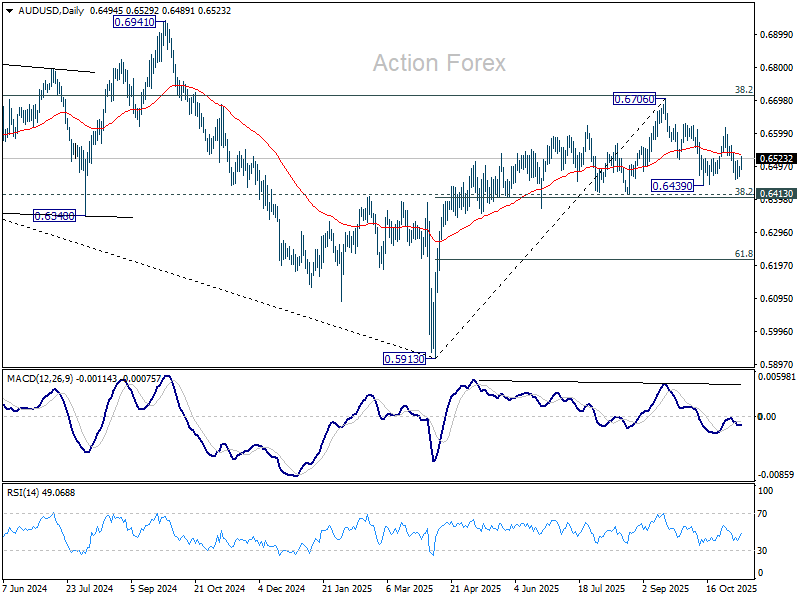
AUD/USD Daily Report
Daily Pivots: (S1) 0.6475; (P) 0.6488; (R1) 0.6507; More...
Intraday bias in AUD/USD remains neutral ad more sideway trading could be seen. On the downside, break of 0.6457 will target 0.6413 cluster (38.2% retracement of 0.5913 to 0.6706 at 0.6403). Decisive break there will carry larger bearish implications. On the upside, break of 0.6616 will bring retest of 0.6706 high instead.
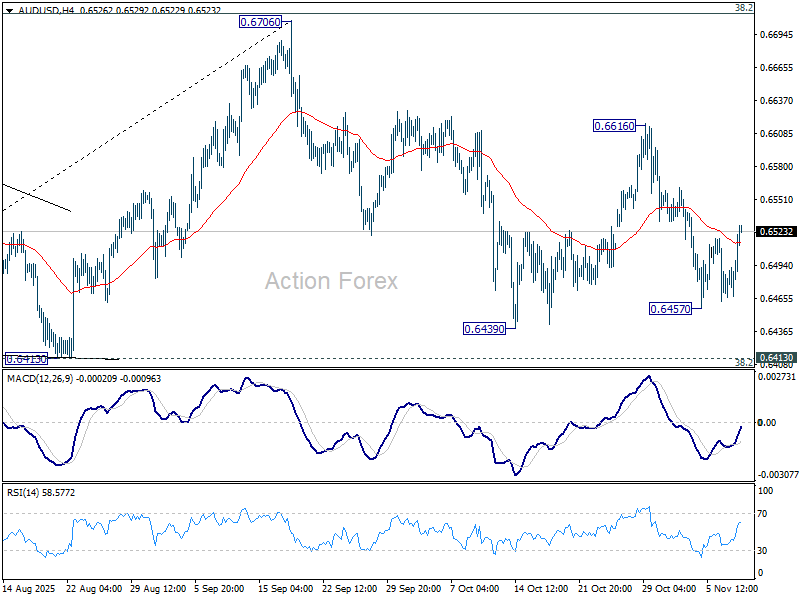
In the bigger picture, there is no clear sign that down trend from 0.8006 (2021 high) has completed. Rebound from 0.5913 is seen as a corrective move. Outlook will remain bearish as long as 38.2% retracement of 0.8006 to 0.5913 at 0.6713 holds. Break of 0.6413 support will suggest rejection by 0.6713 and solidify this bearish case. Nevertheless, considering bullish convergence condition in W MACD, sustained break of 0.6713 will be a strong sign of bullish trend reversal, and pave the way to 0.6941 structural resistance for confirmation.
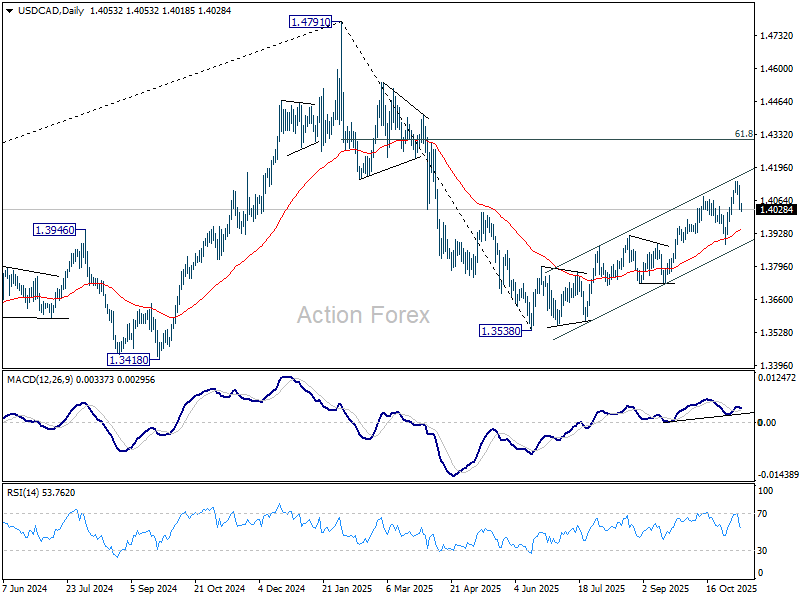
USD/CAD Daily Outlook
Daily Pivots: (S1) 1.4006; (P) 1.4066; (R1) 1.4106; More...
Intraday bias in USD/CAD remains mildly on the downside for the moment. Fall from 1.4139 short term top would extend towards 1.3886 support. On the upside, break of 1.4139 will resume the rally from 1.3538 to 61.8% retracement of 1.4791 to 1.3538 at 1.4312.
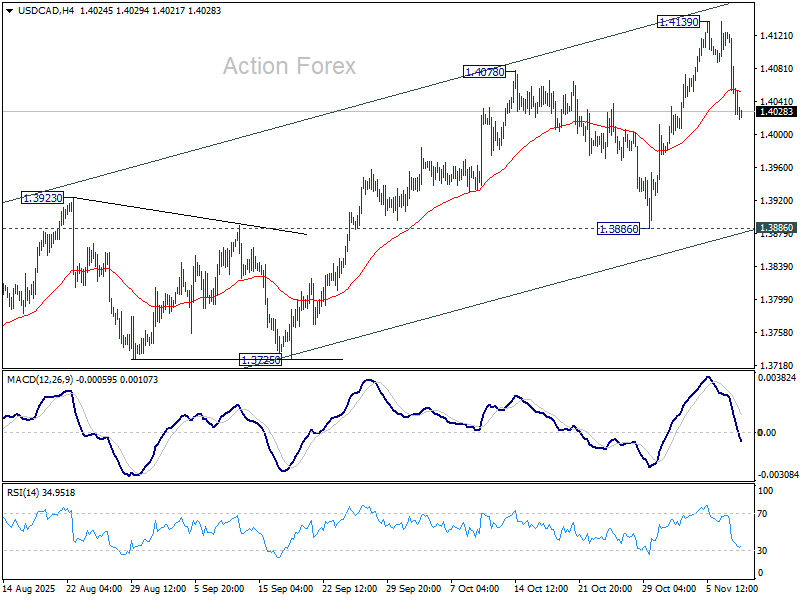
In the bigger picture, price actions from 1.4791 medium term top is likely just unfolding as a correction to up trend from 1.2005 (2021 low), with rise from 1.3538 as the second leg. A third leg should follow before up trend resumption. That is, range trading is set to extend for the medium term. For now, this will remain the favored case as long as 1.3886 support holds. However, firm break of 1.3886 will revive the case that fall from 1.4791 is indeed a larger scale correction.
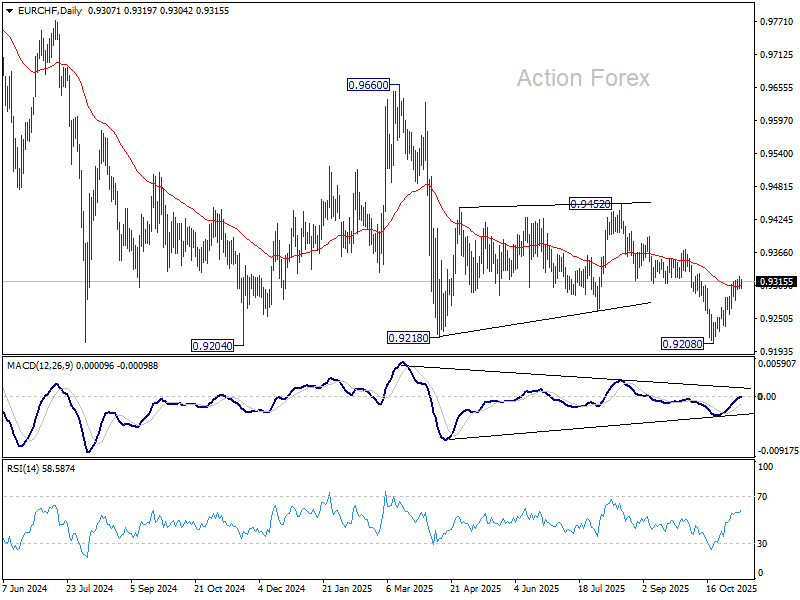
EUR/CHF Daily Outlook
Daily Pivots: (S1) 0.9302; (P) 0.9315; (R1) 0.9324; More....
Intraday bias in EUR/CHF stays neutral and more consolidations could be seen below 0.9325 temporary top. On the upside, break of 0.9325 will target 0.9371 resistance. Break there will pave the way back to 0.9452 resistance next. On the downside, however, break of 0.9257 will revive near term bearishness, and bring retest of 0.9204/8 support zone.
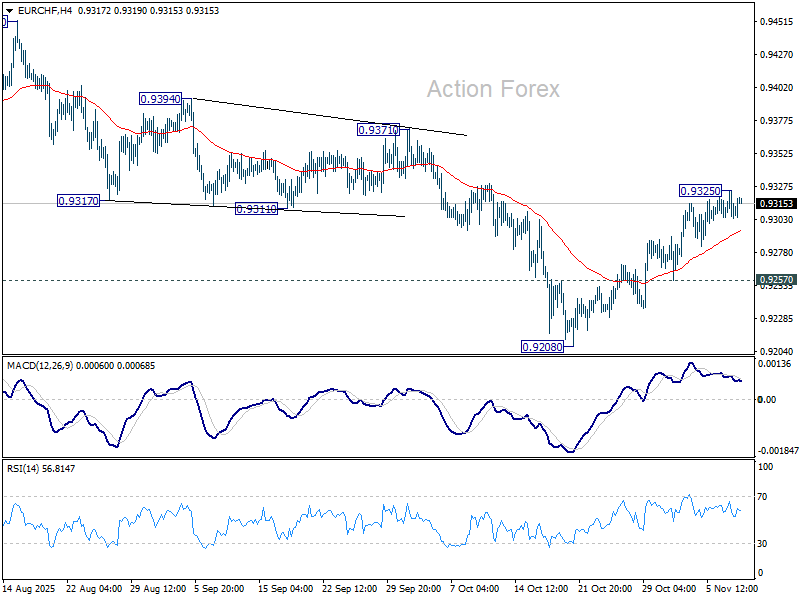
In the bigger picture, outlook remains bearish with EUR/CHF staying well inside long term falling channel after multiple rejection by 55 W EMA (now at 0.9383). Firm break of 0.9204 will resume the whole down trend from 1.2004 (2018 high). Next target is 61.8% projection of 1.1149 to 0.9407 from 0.9928 at 0.8851. However, break of 0.9452 resistance will now be the first sign of medium term bottoming.