Sample Category Title
NZDCAD Wave Analysis
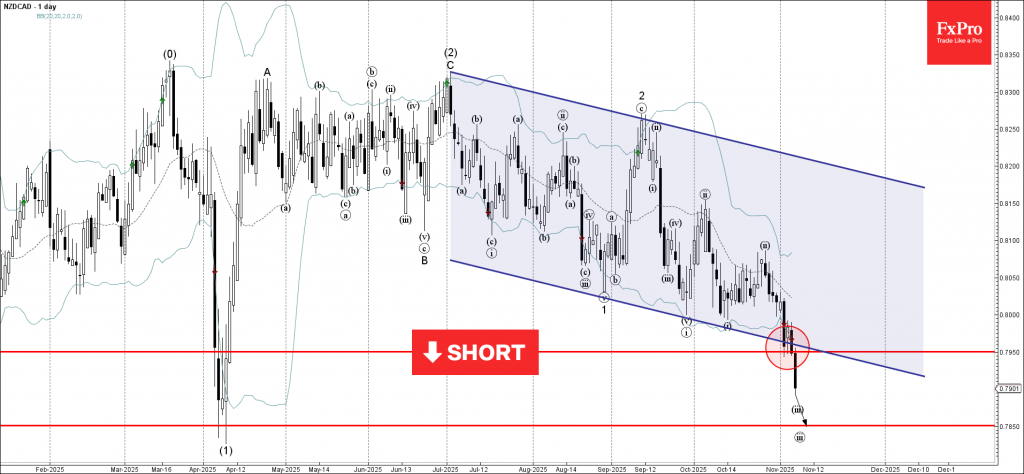
NZDCAD: ⬇️ Sell
- NZDCAD broke support area
- Likely to fall to support level 0.7850
NZDCAD currency pair recently broke the support area between the support level 0.7950 and the support trendline of the wide weekly down channel from the start of July.
The breakout of this support area accelerated the active short-term impulse wave 3 of the intermediate impulse wave (3) from July.
Given the strong daily downtrend, NZDCAD currency pair can be expected to fall to the next support level 0.7850 (former multi-month support from April).
GBPJPY Wave Analysis
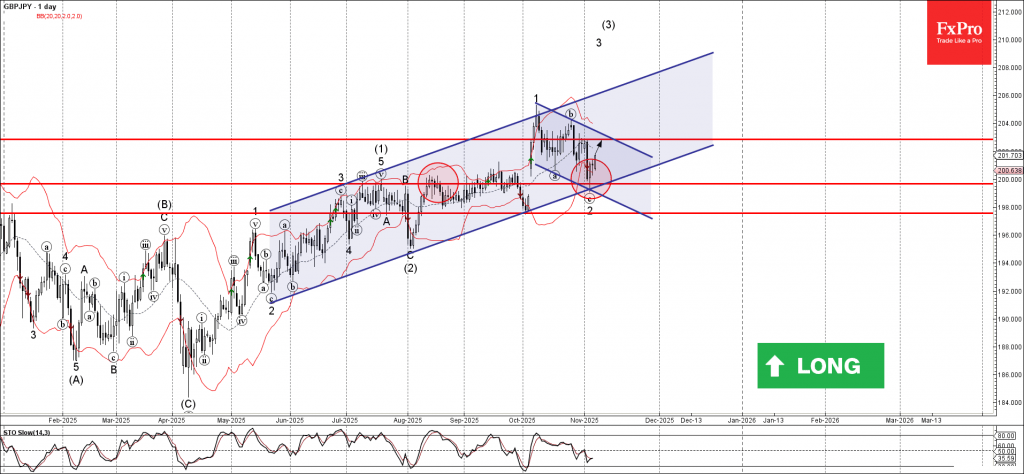
GBPJPY: ⬆️ Buy
- GBPJPY reversed from support area
- Likely to rise to resistance level 202.85
GBPJPY currency pair recently reversed from the support area between the support level 200.00 (former resistance from July to September), lower daily Bollinger Band and the support trendline of the daily down channel from the start of October.
The upward reversal from this support area stopped the previous short-term ABC correction 2 from the start of October.
Given the clear daily uptrend and the strongly bearish yen sentiment seen across the FX markets today, GBPJPY currency pair can be expected to rise to the next resistance level 202.85.
Dollar Ends Mixed as AI Bubble Fears, US Shutdown, and Tariff Court Case Collide
It was another volatile week in global markets, defined less by fresh data and more by the growing weight of unresolved macro risks. With the U.S. government still in shutdown and a raft of key economic reports missing, investors were left to trade sentiment rather than facts — and sentiment turned sharply negative mid-week.
The standout development was the sudden reversal in technology shares, which reignited talk of a possible AI-driven bubble and reminded investors how dependent this year’s rally has become on a narrow group of market leaders.
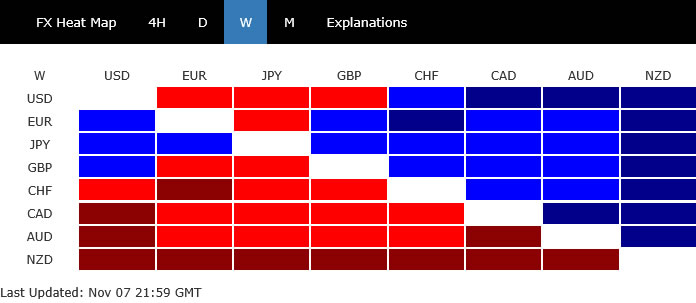
Risk aversion dominated currency trading for most of the week. Kiwi, Aussie, and Loonie sat firmly at the bottom of the performance ladder, all weighed by global risk flows even as their domestic fundamentals diverged.
New Zealand Dollar suffered most after weak labor-market data deepened expectations for another rate cut later this month. Australian Dollar found little comfort in the RBA’s hawkish hold. Investors more focused on fading risk appetite than on policy nuance, even though RBA indicated no more rate hike this year.
Canadian Dollar, meanwhile, lagged early on but found a lifeline in surprisingly strong October employment figures that eased expectations of further BoC easing.
Among the gainers, Yen led the pack, supported by safe-haven demand, though late-week profit-taking erased much of its gains. The Japanese currency’s next moves will likely hinge on how U.S. and European yields evolve in tandem with risk sentiment.
Euro and Sterling rounded out the top three performers, helped by a slightly softer Dollar. BoE narrowly avoided easing in a tense 5-4 vote, but rate cut is still underway after getting more details from the U.K. government’s Autumn Budget later this month. Dollar and Swiss Franc ended in the middle of the pack.
NASDAQ Pullback on AI Fears, But Bulls Still Hold the Line
One of the defining stories of the week was the sharp pullback in technology shares, which reignited debate over whether the AI boom has turned from opportunity to overvaluation. The selloff was abrupt and broad, sending NASDAQ down roughly 3% in its worst week since April. S&P 500 and DOW each lost more than 1%, as investors trimmed exposure to crowded positions that had powered this year’s rally.
The correction was triggered less by new data and more by a shift in psychology. Goldman Sachs CEO David Solomon warned that equity markets could face a “likely 10–20% drawdown” over the next two years. His comment added weight to simmering unease that the AI-driven melt-up might have outpaced real earnings growth.
That view was indeed voiced last month by IMF chief economist Pierre-Olivier Gourinchas, who likened the current enthusiasm for artificial intelligence to the late-1990s dot-com frenzy. His warning drew little attention at the time, overshadowed by headlines on trade tensions, the U.S. government shutdown, and shifting central-bank policies. But it has since resurfaced as the AI correction story takes center stage.
Still, the counter-arguments were also loud. Nvidia’s CEO Jensen Huang pushed back, saying the AI cycle remains in its infancy and comparing the current stage to the early internet build-out. “We’re in the beginning of a very long expansion of artificial intelligence,” he said, dismissing bubble talk as premature. For many investors, that remains the dominant view: short-term volatility may purge excess positioning, but the secular story behind AI remains intact.
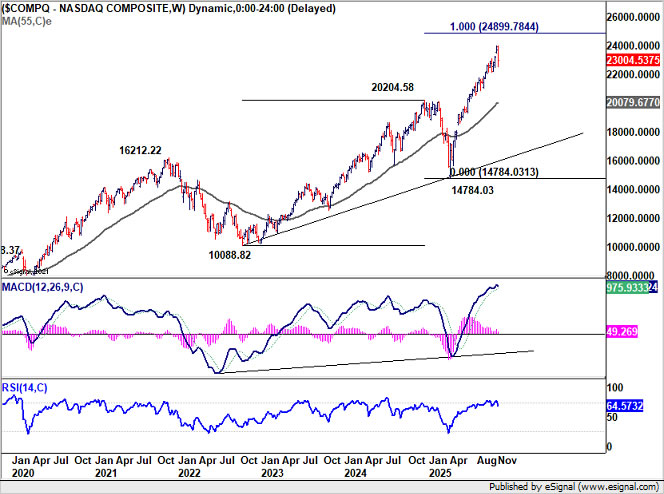
Technically, NASDAQ’s intraday behavior told a similar story of nervous but orderly profit-taking. The index hit a low of 22,563.41 on Friday—almost exactly at its rising 55 D EMA at 22,576.14, before rebounding to close above 23,000. The swift turnaround hinted at bargain-hunting and short-covering rather than capitulation.
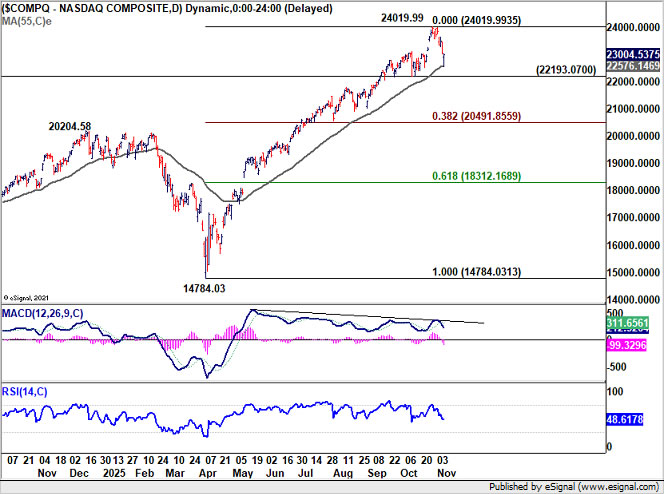
For now, the uptrend from 14,784.03 (Apr low) remains intact. Further rise should still be seen to 100% projection of 10,088.82 (2022 low) to 20,204.58 (2024 high) from 14,783.03 at 24,899.78. But initial resistance should emerge there on overbought condition, or maybe a little higher at 25,000 psychological level, to cap upside on first attempt.
Conversely, decisive fall below 22,193.07 support would signal that the consolidation is maturing into a deeper correction, targeting the 38.2% retracement of 14,784.03 to 24,019.99 at 20,491.85.
Shutdown, Tariff Court Case, and Yield Jitters
Away from the drama in equities, the U.S. macro environment grew more complicated. The federal government shutdown stretched into another week, marking the longest in history, with no sign of political compromise in Washington. The standoff has now begun to show real-world effects, both logistical and psychological, as federal agencies remain shuttered and workers unpaid.
Late in the week, the Senate once again failed to advance competing funding bills. Republicans rejected a Democrat proposal to reopen the government, while Democrats blocked a GOP measure that would have selectively paid active-duty troops and essential personnel. The result is ongoing paralysis — and growing frustration from both markets and the public sector.
The shutdown’s side effects are no longer theoretical. Hundreds of U.S. flights were cancelled or delayed after the administration ordered schedule reductions to ease pressure on unpaid air traffic controllers. Those cuts, currently around 4%, could rise to 10% if no agreement is reached in the coming week. Investors are increasingly wary that prolonged disruption could start to weigh on growth and confidence.
Compounding the uncertainty, the U.S. Supreme Court opened hearings on the legality of President Donald Trump’s reciprocal and fentanyl-related tariffs. The case hinges on whether such tariffs can be justified under emergency powers normally reserved for national security crises.
A ruling against the administration could overturn significant portions of the tariff framework, creating fresh ambiguity for global trade and corporate planning. Equally important is that refund obligations from invalidated tariffs could materially worsen US fiscal arithmetic. Any revenue shortfall, if not offset by spending cuts, might widen the deficit and steepen the Treasury yield curve — with long-term yields rising even as short-term rates fall under Fed easing. The mere possibility has already stirred unease among bond traders.
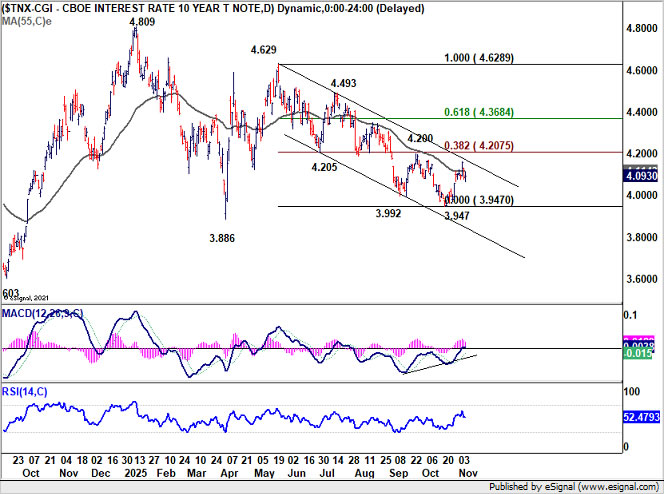
That dynamic was already visible last week as the U.S. 10-year yield climbed back above 4.1, touching an intraday high of 4.161 before retreating. Technically, the rebound from the 3.947 short term bottom still looks corrective within the broader downtrend from 4.629. Upside should be capped by 4.205 cluster resistance (38.2% retracement of 4.629 to 3.947 at 4.207). That should set the range for more sideway trading between 3.95/4.20 in the near term.
Decisive break above 4.205, however, would send a very different signal — suggesting that fiscal concerns are overtaking disinflation and that a deeper re-pricing in the bond market may be under way.
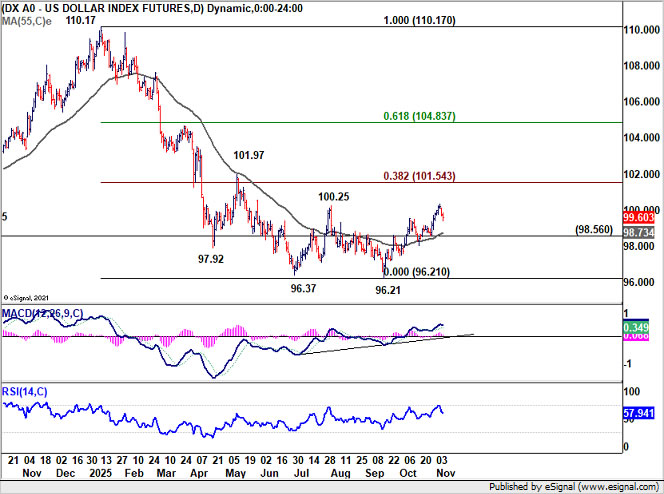
Dollar Index's rebound from 92.61 continued last week and hit 100.36. Further rise is still in favor in the near term, but upside should be limited by 38.2% retracement of 110.17 to 96.21 at 101.54. On the downside, break of 98.56 support will indicate that the corrective rebound has completed and bring deeper fall back to 96.21 low.
However decisive break of 101.54 would argue that Dollar Index is already reversing the whole down trend from 110.17. In particular, if 10-year yield breaks through 4.2 mark decisively in tandem, that would add additional tailwind to Dollar Index for an even stronger rally.
NZD/USD Slide Deepens After Job Data, Pandemic-Era Low Back in Sight
New Zealand Dollar tumbled broadly last week, closing as the weakest performer among major currencies. Global risk aversion remained the dominant drag, but the domestic backdrop offered little to offset it. With labor market momentum stalling and policy expectations leaning dovish, Kiwi continued to lose ground across the board.
The Q3 employment figures were uninspiring. Job growth was flat, and the unemployment rate edged up to 5.3%, its highest level since 2016. While the deterioration was not severe enough to trigger another emergency-sized cut, it nevertheless cemented expectations that the RBNZ will ease by 25 bps to 2.25% at its upcoming meeting.
Whether that move will mark the end of the easing cycle remains uncertain. Much will depend on whether tentative improvements seen in business sentiment surveys can translate into real activity gains over the next two quarters. For now, traders see the odds of another rate cut in 2026 as a coin toss.
Technically, NZD/USD's fall from 0.6119 continued last week. The strong break of the falling channel support and 100% projection of 0.6119 to 0.5799 from 0.6006 at 0.5687 both indicate downside acceleration. Near term outlook will now stay bearish as long as 0.5800 resistance holds. Next target is the support zone between 0.5484 low and 161.8% projection at 0.5490.
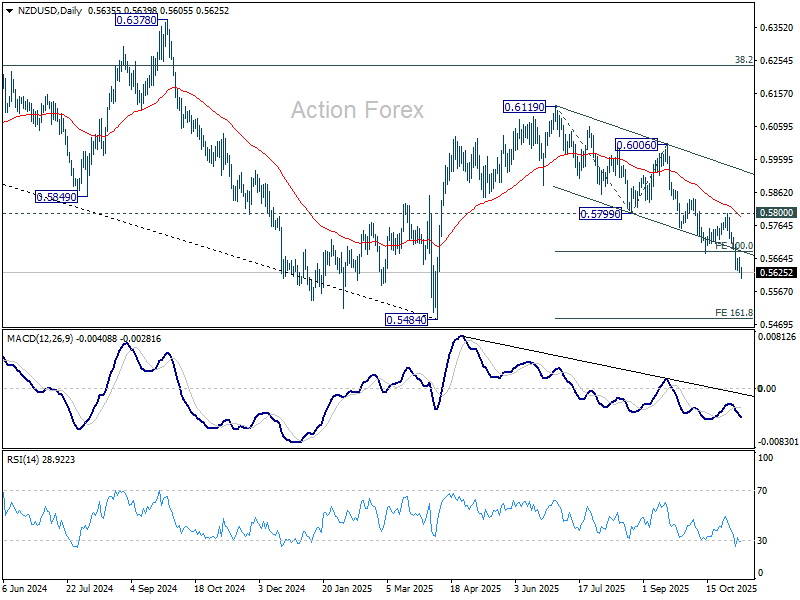
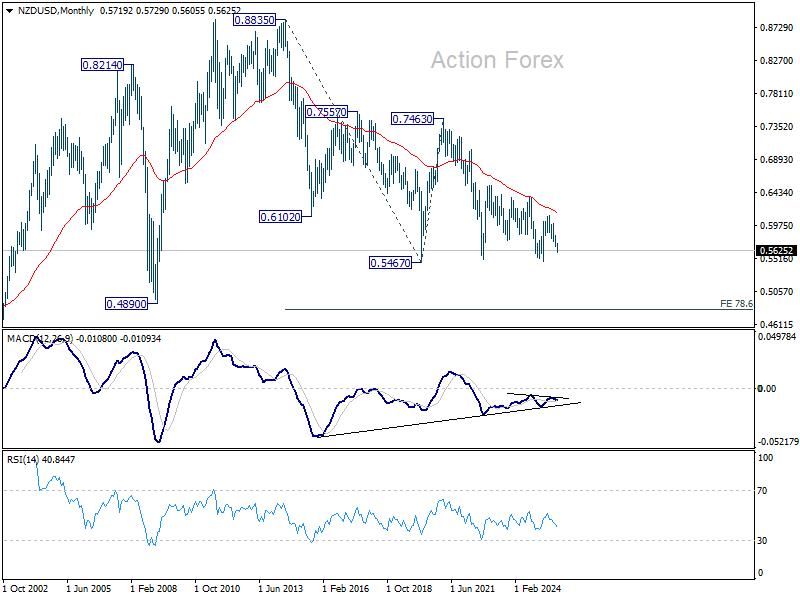
For now, there is little fundamental reason for NZD/USD to collapse through 0.5467 (2020 low) to resume the long term down trend from 0.8835 (2014 high). But the technical risks are growing.
USD/JPY Weekly Outlook
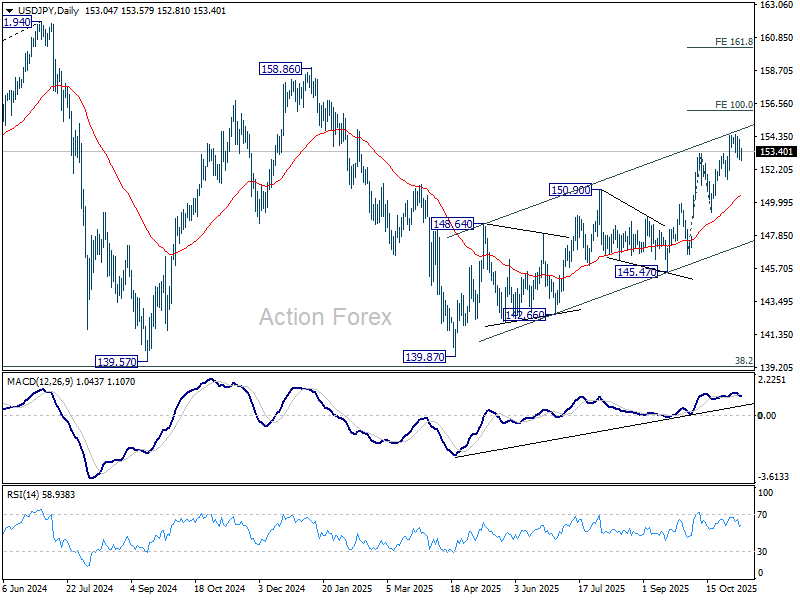
USD/JPY edged higher to 154.47 last week but retreated again. Initial bias remains neutral this week for some more consolidations. Further rally is expected as long as 151.52 support holds. Above 154.47 will resume larger rise from 139.87 and target 100% projection of 146.58 to 153.26 from 149.37 at 156.05. Break there will pave the way to 158.85 key structural resistance.
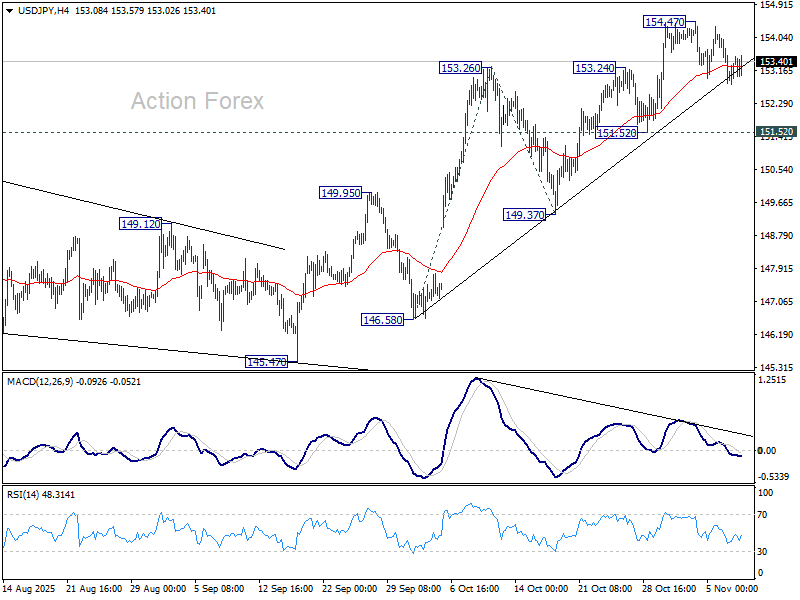
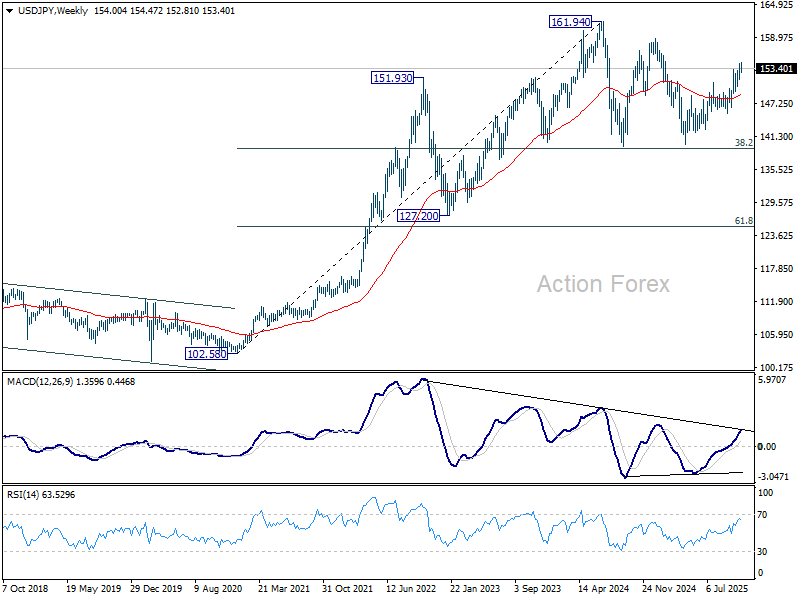
In the bigger picture, current development suggests that corrective pattern from 161.94 (2024 high) has completed with three waves at 139.87. Larger up trend from 102.58 (2021 low) could be ready to resume through 161.94 high. On the downside, break of 149.37 support will dampen this bullish view and extend the corrective pattern with another falling leg.
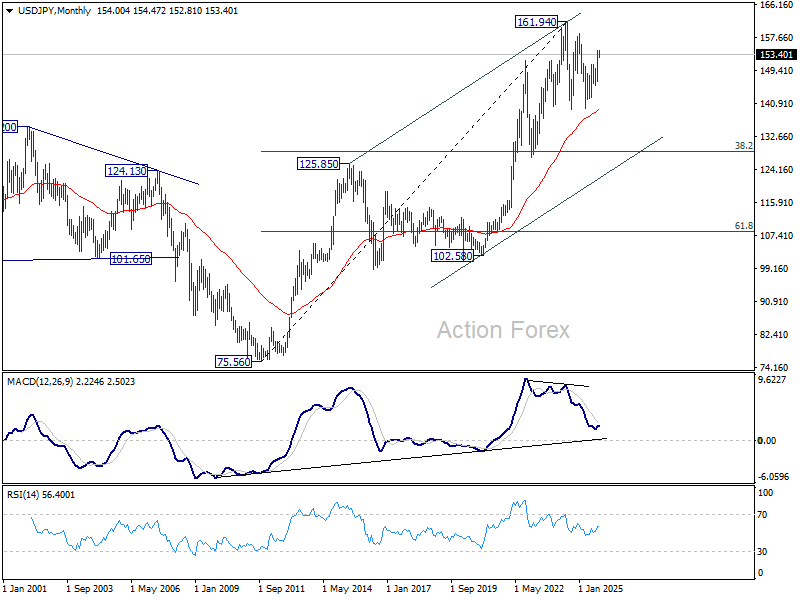
In the long term picture, there is no sign that up trend from 75.56 (2011 low) has completed. But then, firm break of 161.94 is needed to confirm resumption. Otherwise, more medium term range trading could still be seen.
EUR/USD Weekly Outlook
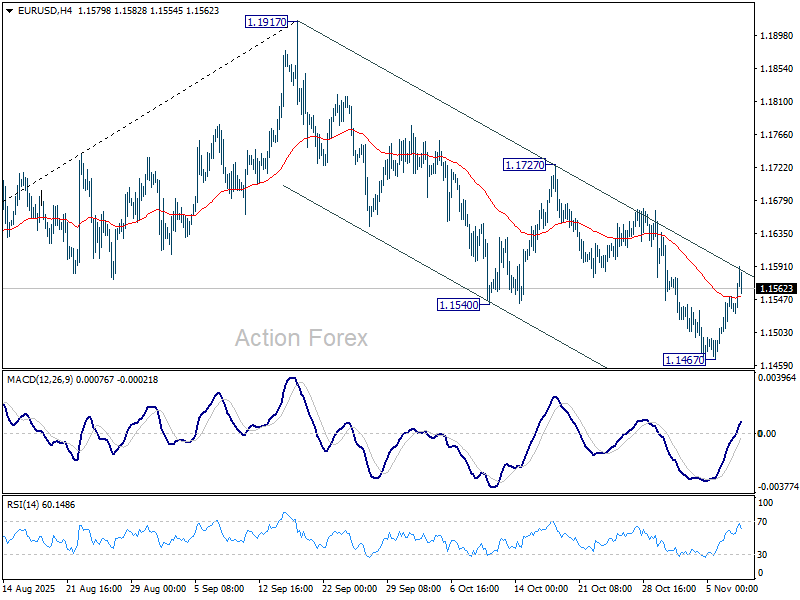
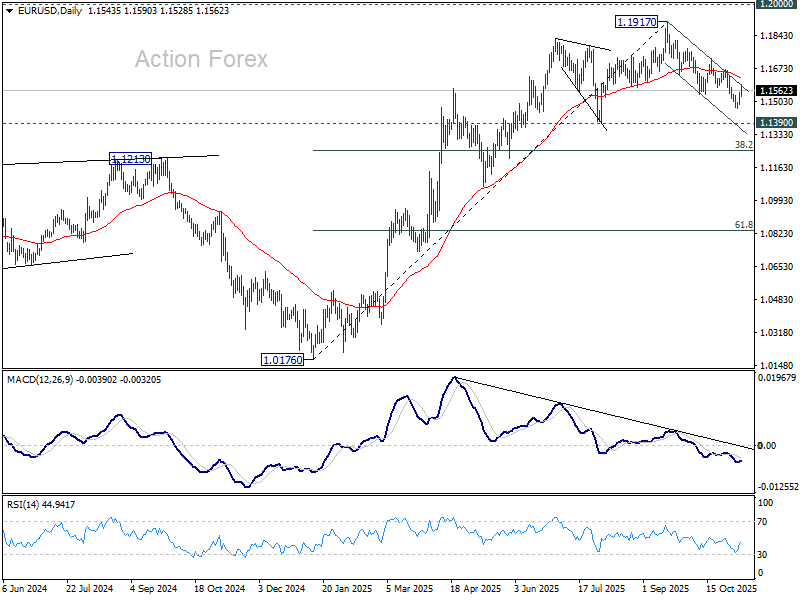
EUR/USD dipped to 1.1467 last week but quickly recovered. Initial bias remains neutral this week first. Further fall would remain in favor as long as 55 D EMA (now at 1.1628) holds. Below 1.1467 will resumed the decline from 1.1917 to 1.1390 support next. However, sustained trading above 55 D EMA will argue that fall from 1.1971 has completed as a correction only, and bring further rise to 1.1727 resistance next.
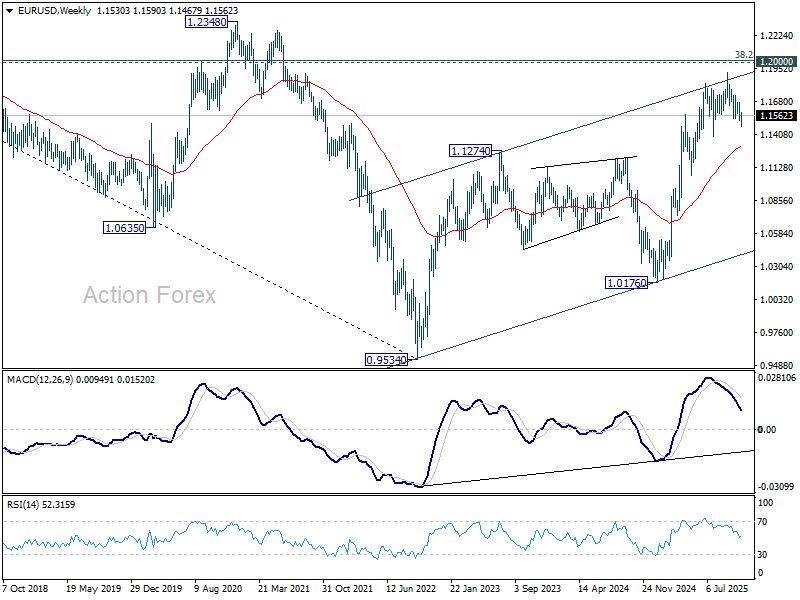
In the bigger picture, considering bearish divergence condition in D MACD, a medium term top is likely in place at 1.1917, just ahead of 1.2 key psychological level. As long as 55 W EMA (now at 1.1306) holds, the up trend from 0.9534 (2022 low) is still expected to continue. Decisive break of 1.2000 will carry larger bullish implications. However, sustained trading below 55 W EMA will argue that rise from 0.9534 has completed as a three wave corrective bounce, and keep long term outlook outlook bearish.
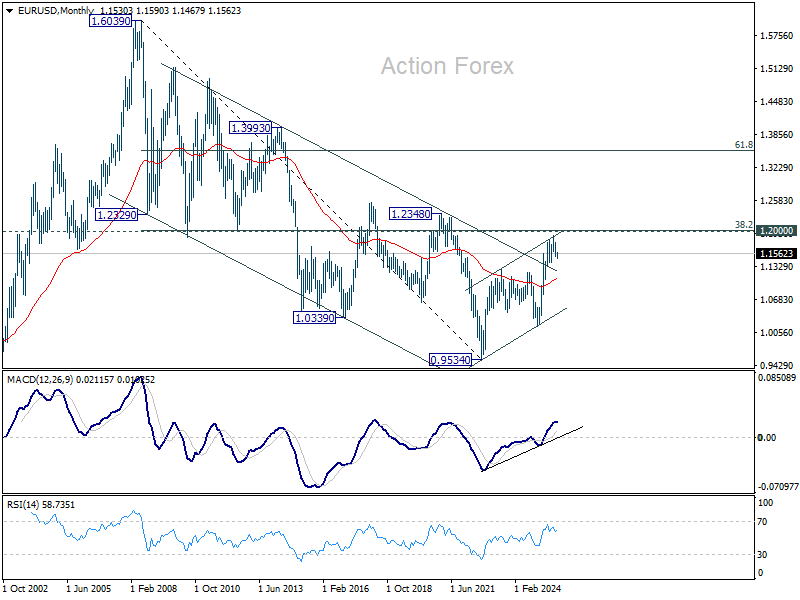
In the long term picture, 38.2% retracement of 1.6039 to 0.9534 at 1.2019, which is close to 1.2000 psychological level is the key for the outlook. Rejection by this level will keep the multi decade down trend from 1.6039 (2008 high) intact, and keep outlook neutral at best. However, decisive break of 1.2000/19, will suggest long term bullish trend reversal, and target 61.8% retracement at 1.3554.
USD/JPY Weekly Outlook
USD/JPY edged higher to 154.47 last week but retreated again. Initial bias remains neutral this week for some more consolidations. Further rally is expected as long as 151.52 support holds. Above 154.47 will resume larger rise from 139.87 and target 100% projection of 146.58 to 153.26 from 149.37 at 156.05. Break there will pave the way to 158.85 key structural resistance.
In the bigger picture, current development suggests that corrective pattern from 161.94 (2024 high) has completed with three waves at 139.87. Larger up trend from 102.58 (2021 low) could be ready to resume through 161.94 high. On the downside, break of 149.37 support will dampen this bullish view and extend the corrective pattern with another falling leg.
In the long term picture, there is no sign that up trend from 75.56 (2011 low) has completed. But then, firm break of 161.94 is needed to confirm resumption. Otherwise, more medium term range trading could still be seen.
GBP/USD Weekly Outlook
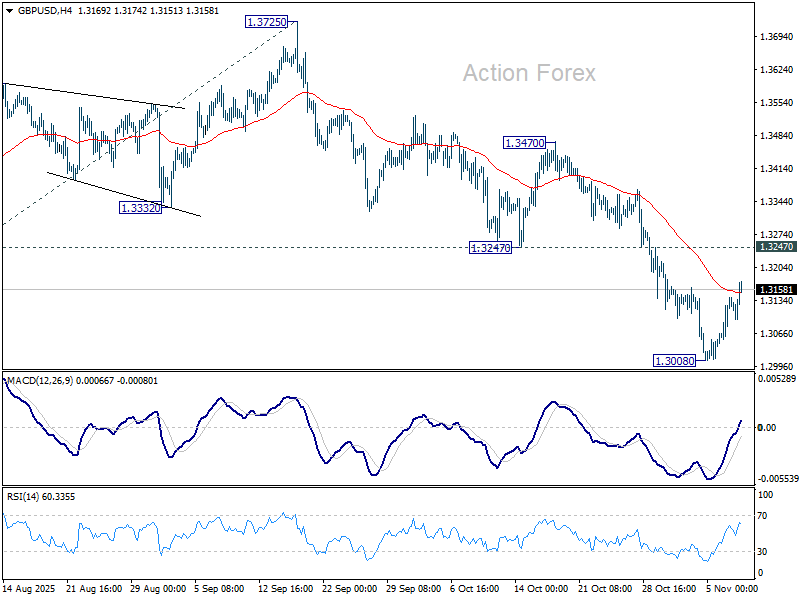
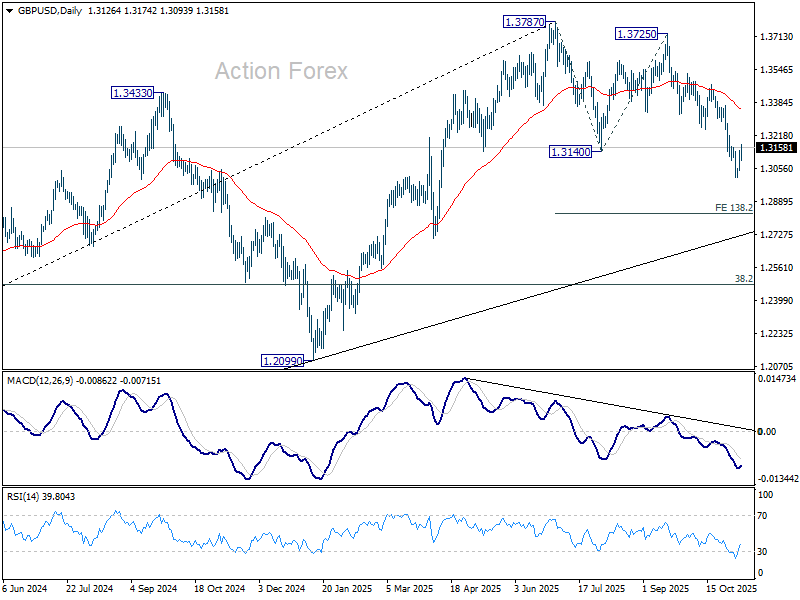
GBP/USD fell further to 1.3008 last week but recovered since then. Initial bias remains neutral this week first. Further decline is expected as long as 1.3247 support turned resistance holds. Break of 1.3008 will target 138.2% projection of 1.3787 to 1.3140 from 1.3725 at 1.2831). Nevertheless, firm break of 1.3247 will suggest that fall from 1.3787 has completed as a corrective move already.
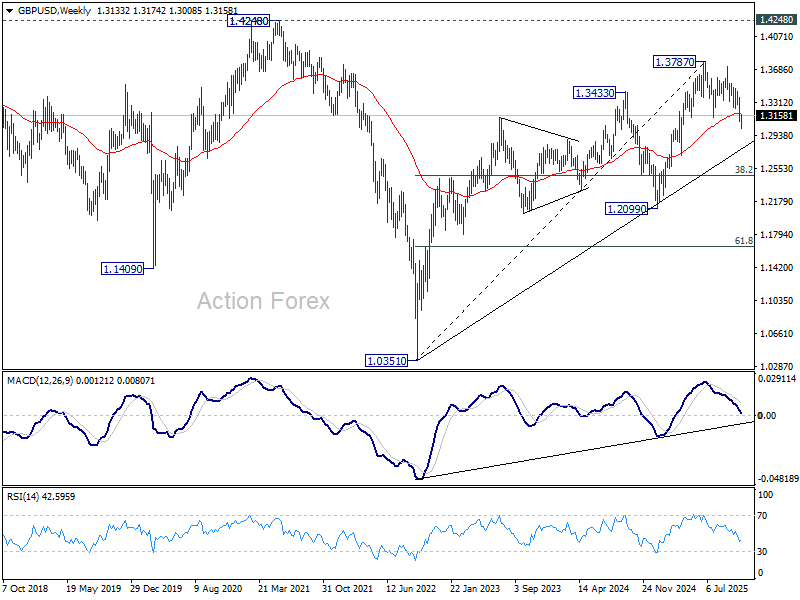
In the bigger picture, the break of 55 W EMA (now at 1.3185) is taken as the first sign that corrective rise from 1.0351 (2022 low) has completed. Decisive break of trend line support (now at 1.2780) will solidify this case and target 38.2% retracement of 1.0351 to 1.3787 at 1.2474 next. Meanwhile, in case of another rise, strong resistance should emerge below 1.4248 (2021 high) to cap upside to preserve the long term down trend.
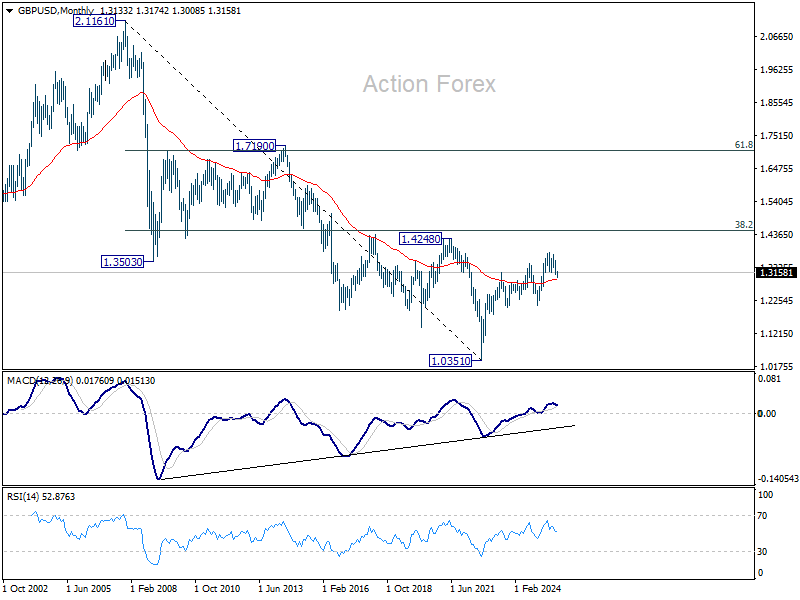
In the long term picture, as long as 1.4248/4480 resistance holds (38.2% retracement of 2.1161 to 1.0351 at 1.4480), the long term outlook will remain bearish. That is, price actions from 1.3051 are seen as a corrective pattern to down trend from 2.1161 (2007 high) only. Nevertheless, decisive break of 1.4248/4480 will be a strong sign of long term bullish reversal.
USD/CHF Weekly Outlook
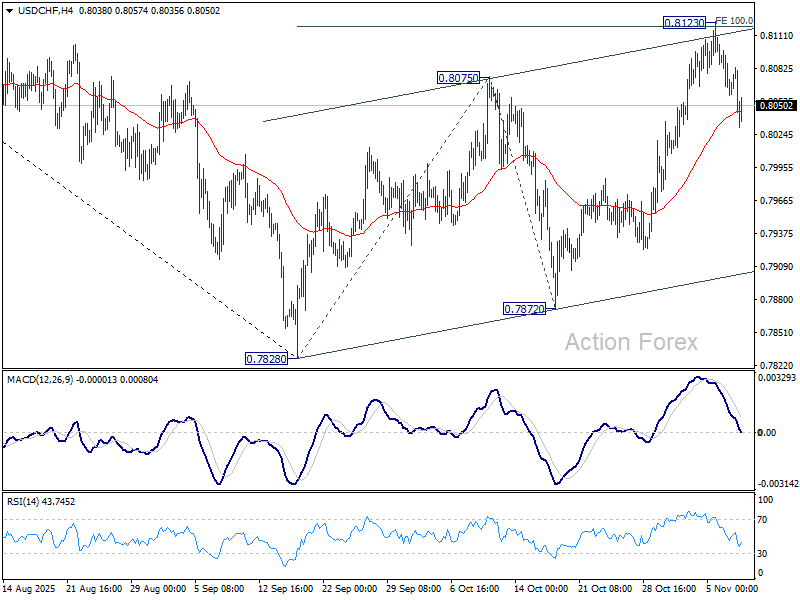
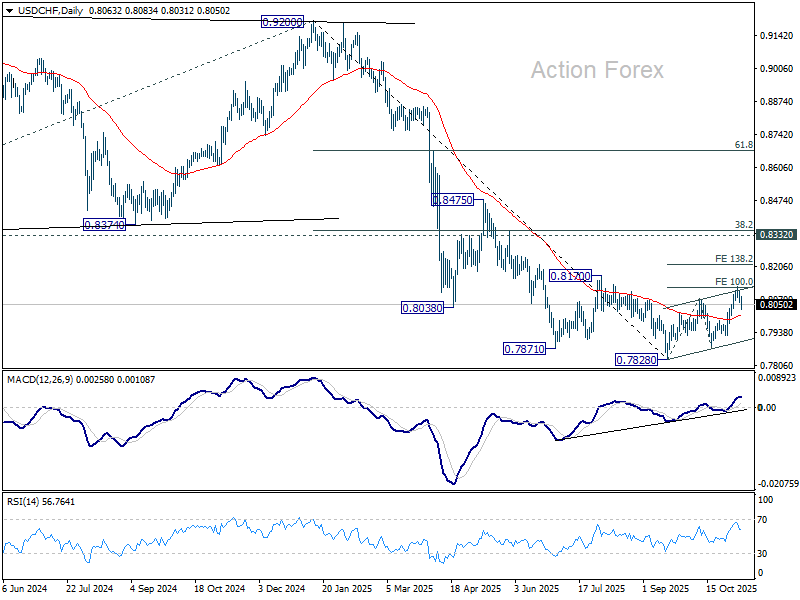
USD/CHF rose to 0.8123 last week but retreated after hitting 100% projection of 0.7828 to 0.8075 from 0.7872 at 0.8119. Initial bias remains neutral this week first. On the downside, decisive break of 55 D EMA (now at 0.8007) will argue that the corrective bounce from 0.7828 has completed and bring retest of this low. ON the upside, above 0.8123 will resume the rebound to 138.2% projection at 0.8213.
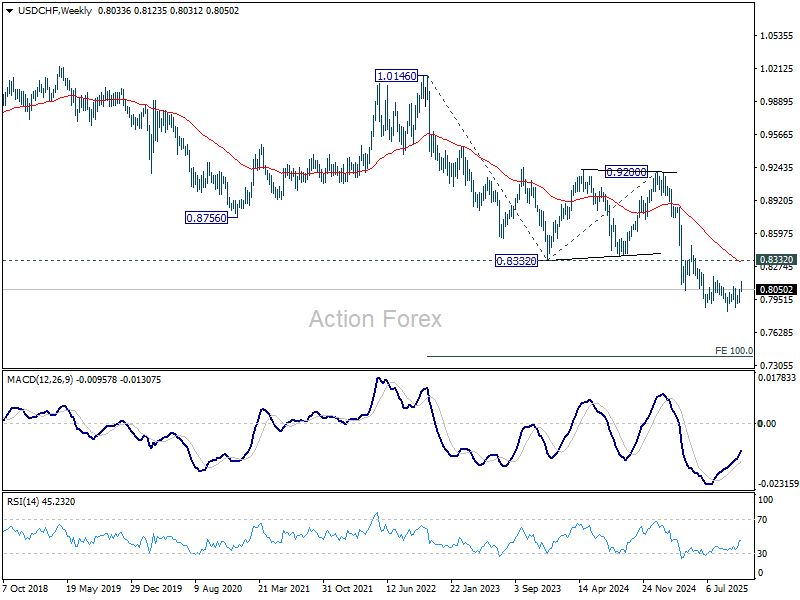
In the bigger picture, long term down trend from 1.0342 (2017 high) is still in progress. Next target is 100% projection of 1.0146 (2022 high) to 0.8332 from 0.9200 at 0.7382. In any case, outlook will stay bearish as long as 0.8332 support turned resistance holds (2023 low).
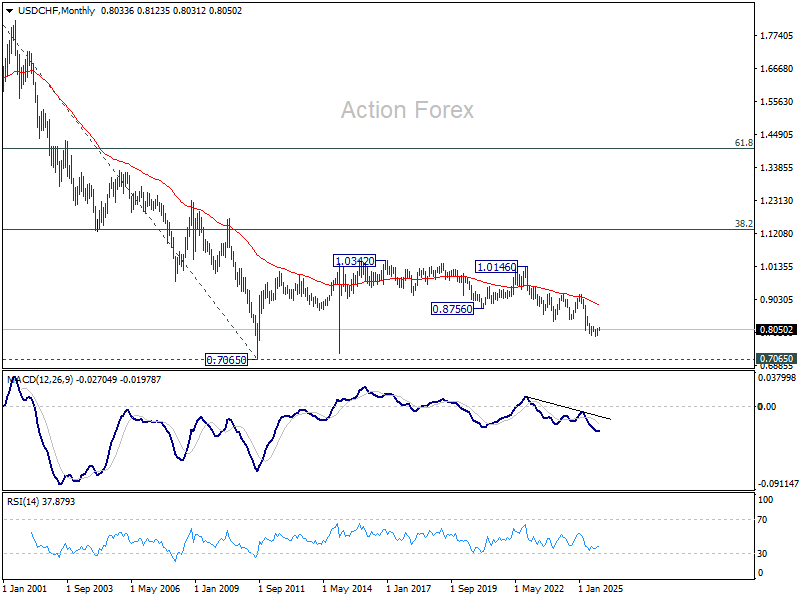
In the long term picture, price action from 0.7065 (2011 low) are seen as a corrective pattern to the multi-decade down trend from 1.8305 (2000 high). It's uncertain if the fall from 1.0342 is the second leg of the pattern, or resumption of the downtrend. But in either case, outlook will stay bearish as long as 0.8756 support turned resistance holds (2021 low). Retest of 0.7065 should be seen next.
AUD/USD Weekly Report
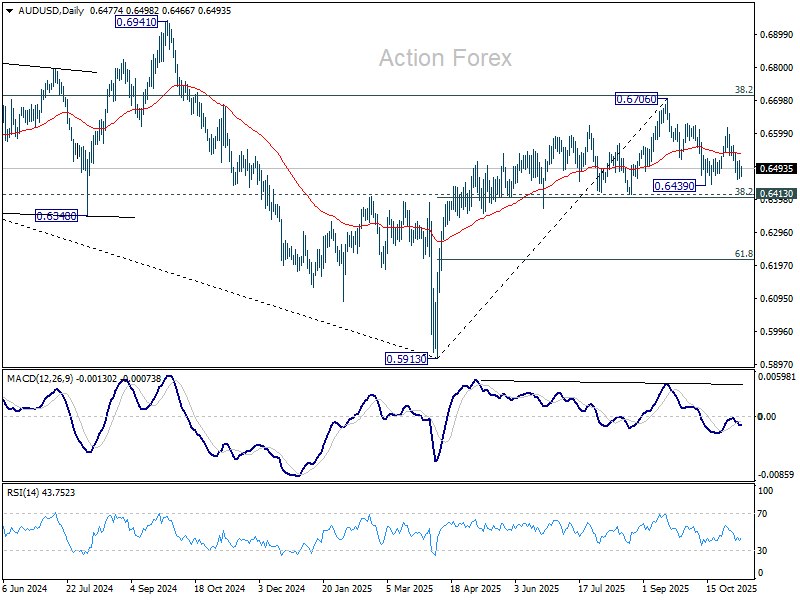
AUD/USD fell to as low as 0.6457 last week but turned sideway since then. Initial bias remains neutral this week first. On the downside, break of 0.6457 will target 0.6413 cluster (38.2% retracement of 0.5913 to 0.6706 at 0.6403). Decisive break there will carry larger bearish implications. On the upside, break of 0.6616 will bring retest of 0.6706 high instead.
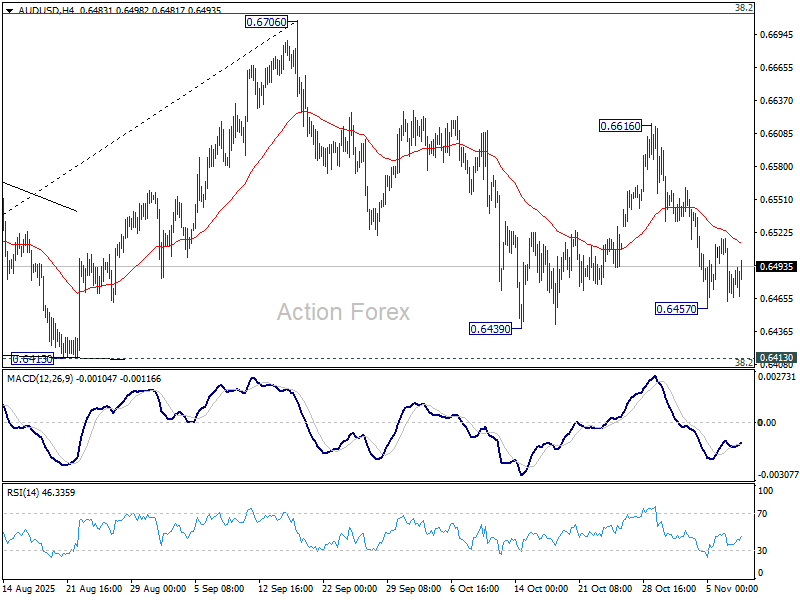
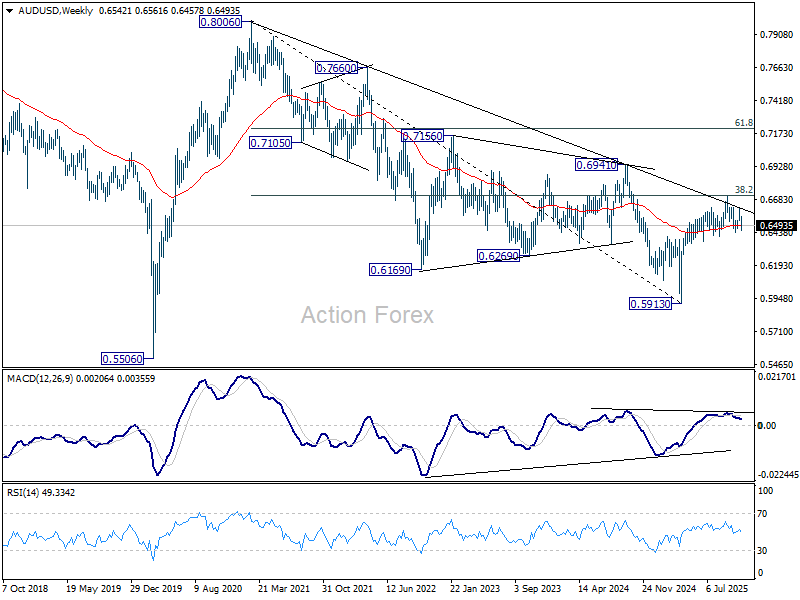
In the bigger picture, there is no clear sign that down trend from 0.8006 (2021 high) has completed. Rebound from 0.5913 is seen as a corrective move. Outlook will remain bearish as long as 38.2% retracement of 0.8006 to 0.5913 at 0.6713 holds. Break of 0.6413 support will suggest rejection by 0.6713 and solidify this bearish case. Nevertheless, considering bullish convergence condition in W MACD, sustained break of 0.6713 will be a strong sign of bullish trend reversal, and pave the way to 0.6941 structural resistance for confirmation.
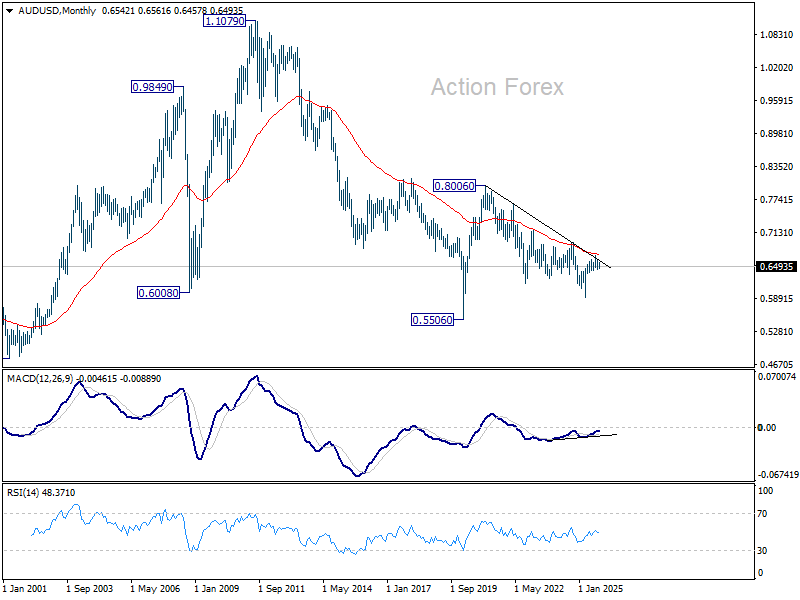
In the long term picture, fall from 0.8006 is seen as the second leg of the corrective pattern from 0.5506 long term bottom (2020 low). Hence, in case of deeper decline, strong support should emerge above 0.5506 to contain downside to bring reversal. On the upside, firm break of 0.6941 will argue that the third leg has already started back to 0.8006.
USD/CAD Weekly Outlook
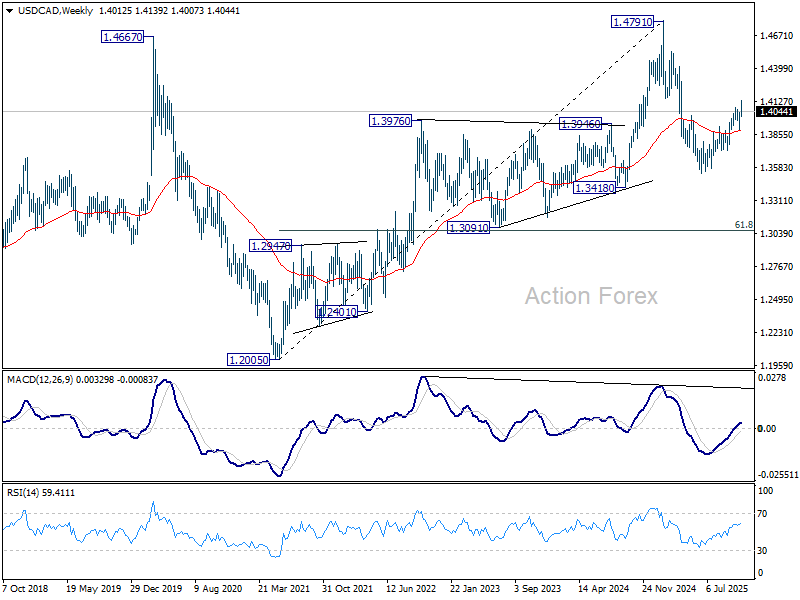
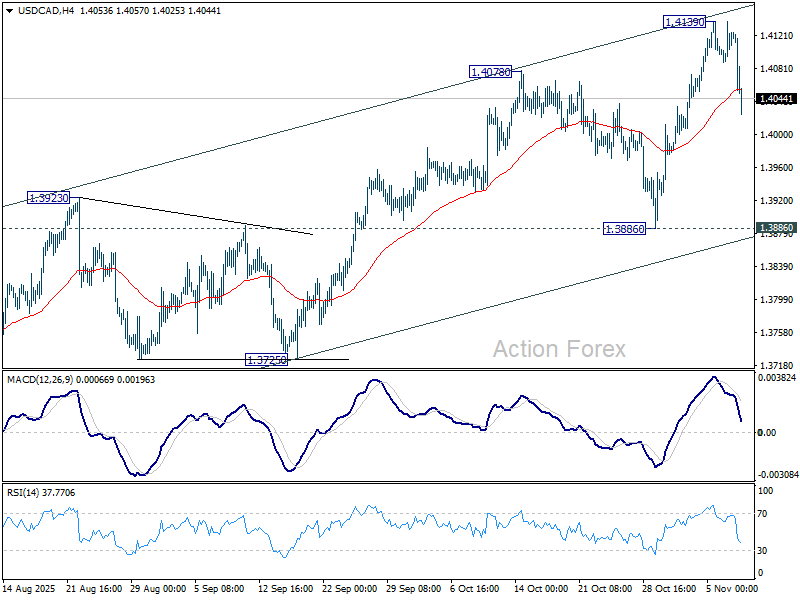
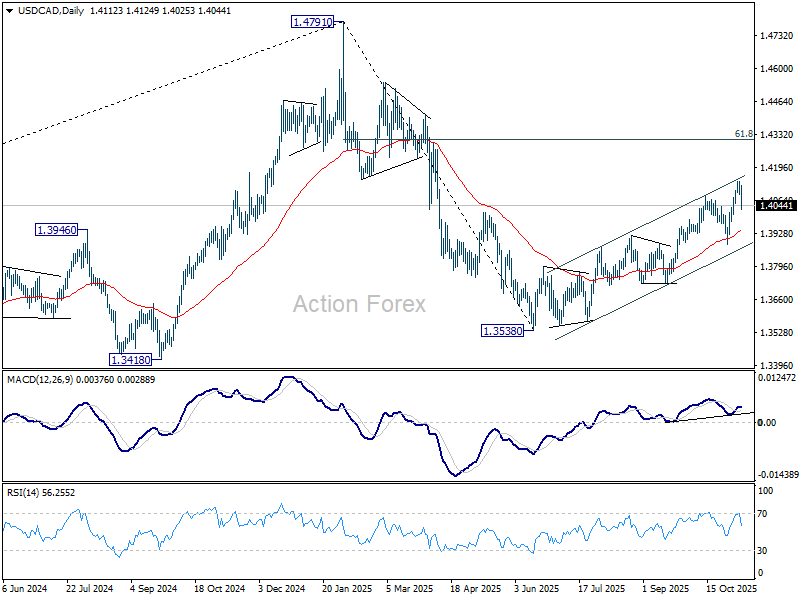
USD/CAD rose further to 1.4139 last week but retreated sharply since then. The break of 55 4H EMA (now at 1.4054) suggests that a short term top was already formed. Initial bias is mildly on the downside this week for 1.3886 support. On the upside, break of 1.4139 will resume the rally from 1.3538 to 61.8% retracement of 1.4791 to 1.3538 at 1.4312.
In the bigger picture, price actions from 1.4791 medium term top is likely just unfolding as a correction to up trend from 1.2005 (2021 low), with rise from 1.3538 as the second leg. A third leg should follow before up trend resumption. That is, range trading is set to extend for the medium term. For now, this will remain the favored case as long as 1.3886 support holds. However, firm break of 1.3886 will revive the case that fall from 1.4791 is indeed a larger scale correction.
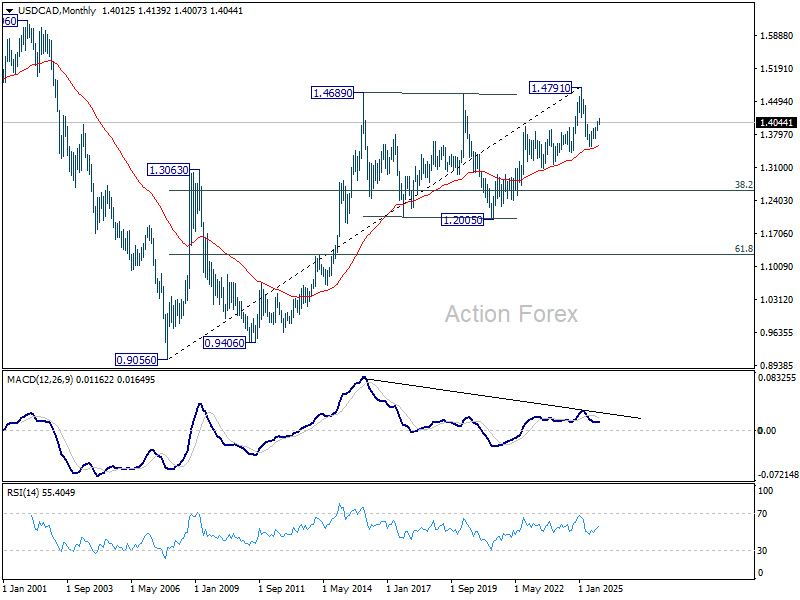
In the long term picture, rising 55 M EMA (now at 1.3543) remains intact. Thus, up trend from 0.90567 (2007 low) should still be in progress. However, considering bearish divergence condition M MACD, sustained trading below 55 M EMA will argue that the up trend has completed with five waves up to 1.4791, and turn medium term outlook bearish for correction.