
Sample Category Title
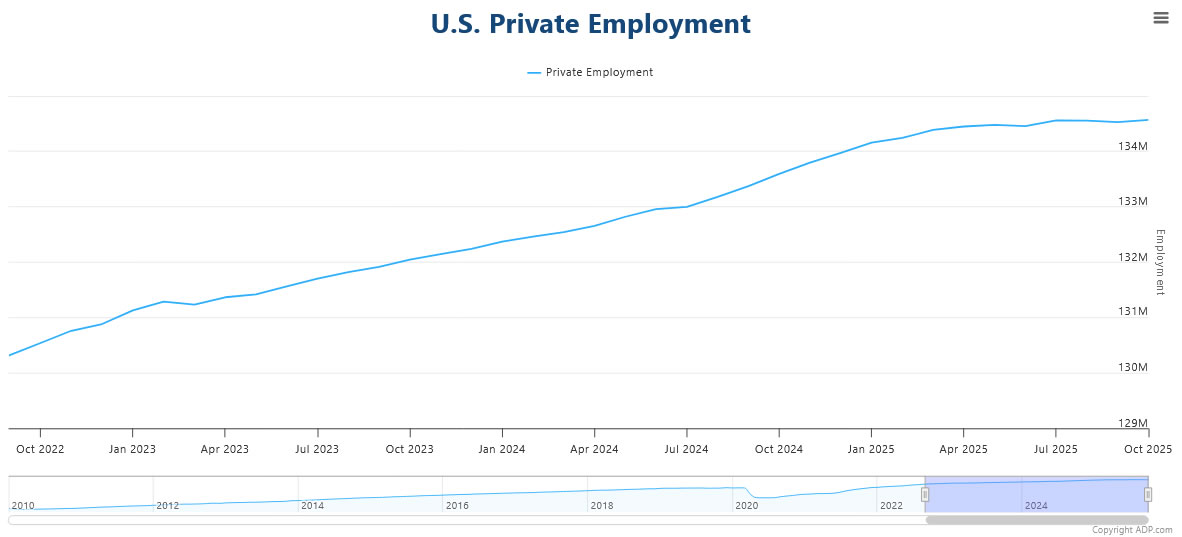
US ADP jobs rise 42K in October, large firms lead modest rebound
U.S. private-sector employment rose modestly in October, with ADP reporting a gain of 42k jobs, slightly above expectations of 32k. It was the first increase since July, suggesting some stabilization in hiring after months of softness. However, the pace of job creation remains well below levels seen earlier in the year, pointing to a labor market that is cooling gradually rather than collapsing.
Sector data showed 33k new service jobs and 9k in goods production. Large firms (+73k) drove most of the gains. Small (-10k) and medium-sized (-21k) companies continued to shed workers. Wage growth remained steady, with job-stayers up 4.5% yoy and job-changers up 6.7% yoy, both unchanged from September.
Overall, the data suggest hiring is stabilizing at lower levels, aligning with the Fed’s goal of cooling the economy without triggering widespread job losses.
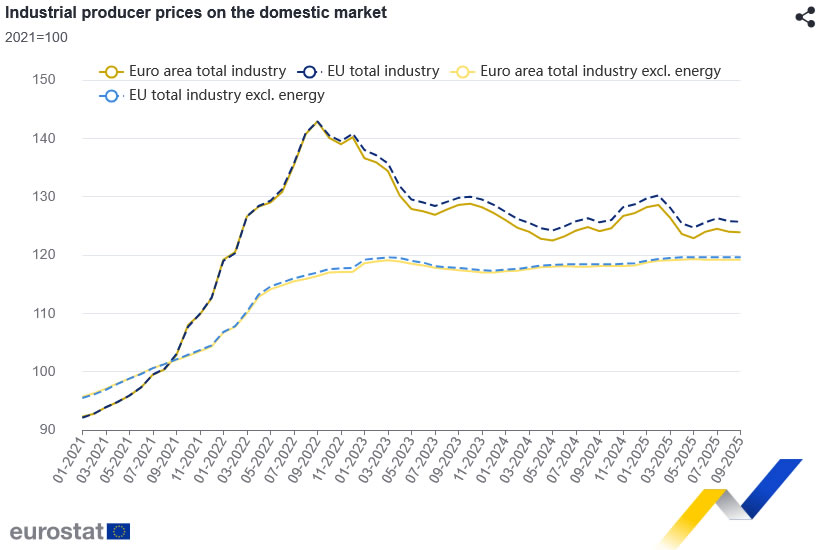
Eurozone PPI edges lower, energy costs weigh
Eurozone producer prices dipped slightly in September. PPI fell -0.1% mom and -0.2% yoy, matching market expectations.
The decline was led primarily by softer energy prices, which fell -0.2% on the month, while prices for intermediate and capital goods remained stable. Among consumer categories, durable goods rose 0.3% and non-durable goods edged up 0.1%.
Across the broader European Union, producer prices rose 0.1% mom and 0.1% yoy, suggesting only a mild uptick in cost pressures. The largest monthly declines were seen in Bulgaria and Finland (-0.7%), while Romania (+1.2%), Estonia (+0.7%), and Lithuania (+0.4%) posted the biggest increases.
Forex Goes to Safe Havens
- The shutdown may end soon.
- Increased volatility supports the dollar.
- The Bank of Japan recalls deflation.
- The pound is frightened by tax increases.
Progress in negotiations between Democrats and Republicans on resuming government operations has cooled the enthusiasm for the US dollar among bulls. The dollar index has taken a step back from its local high, as the record-long shutdown may soon come to an end. The Fed will begin to receive data and will cease to be cautious. The chances of a rate cut in December have risen to 74%, and Treasury yields have fallen.
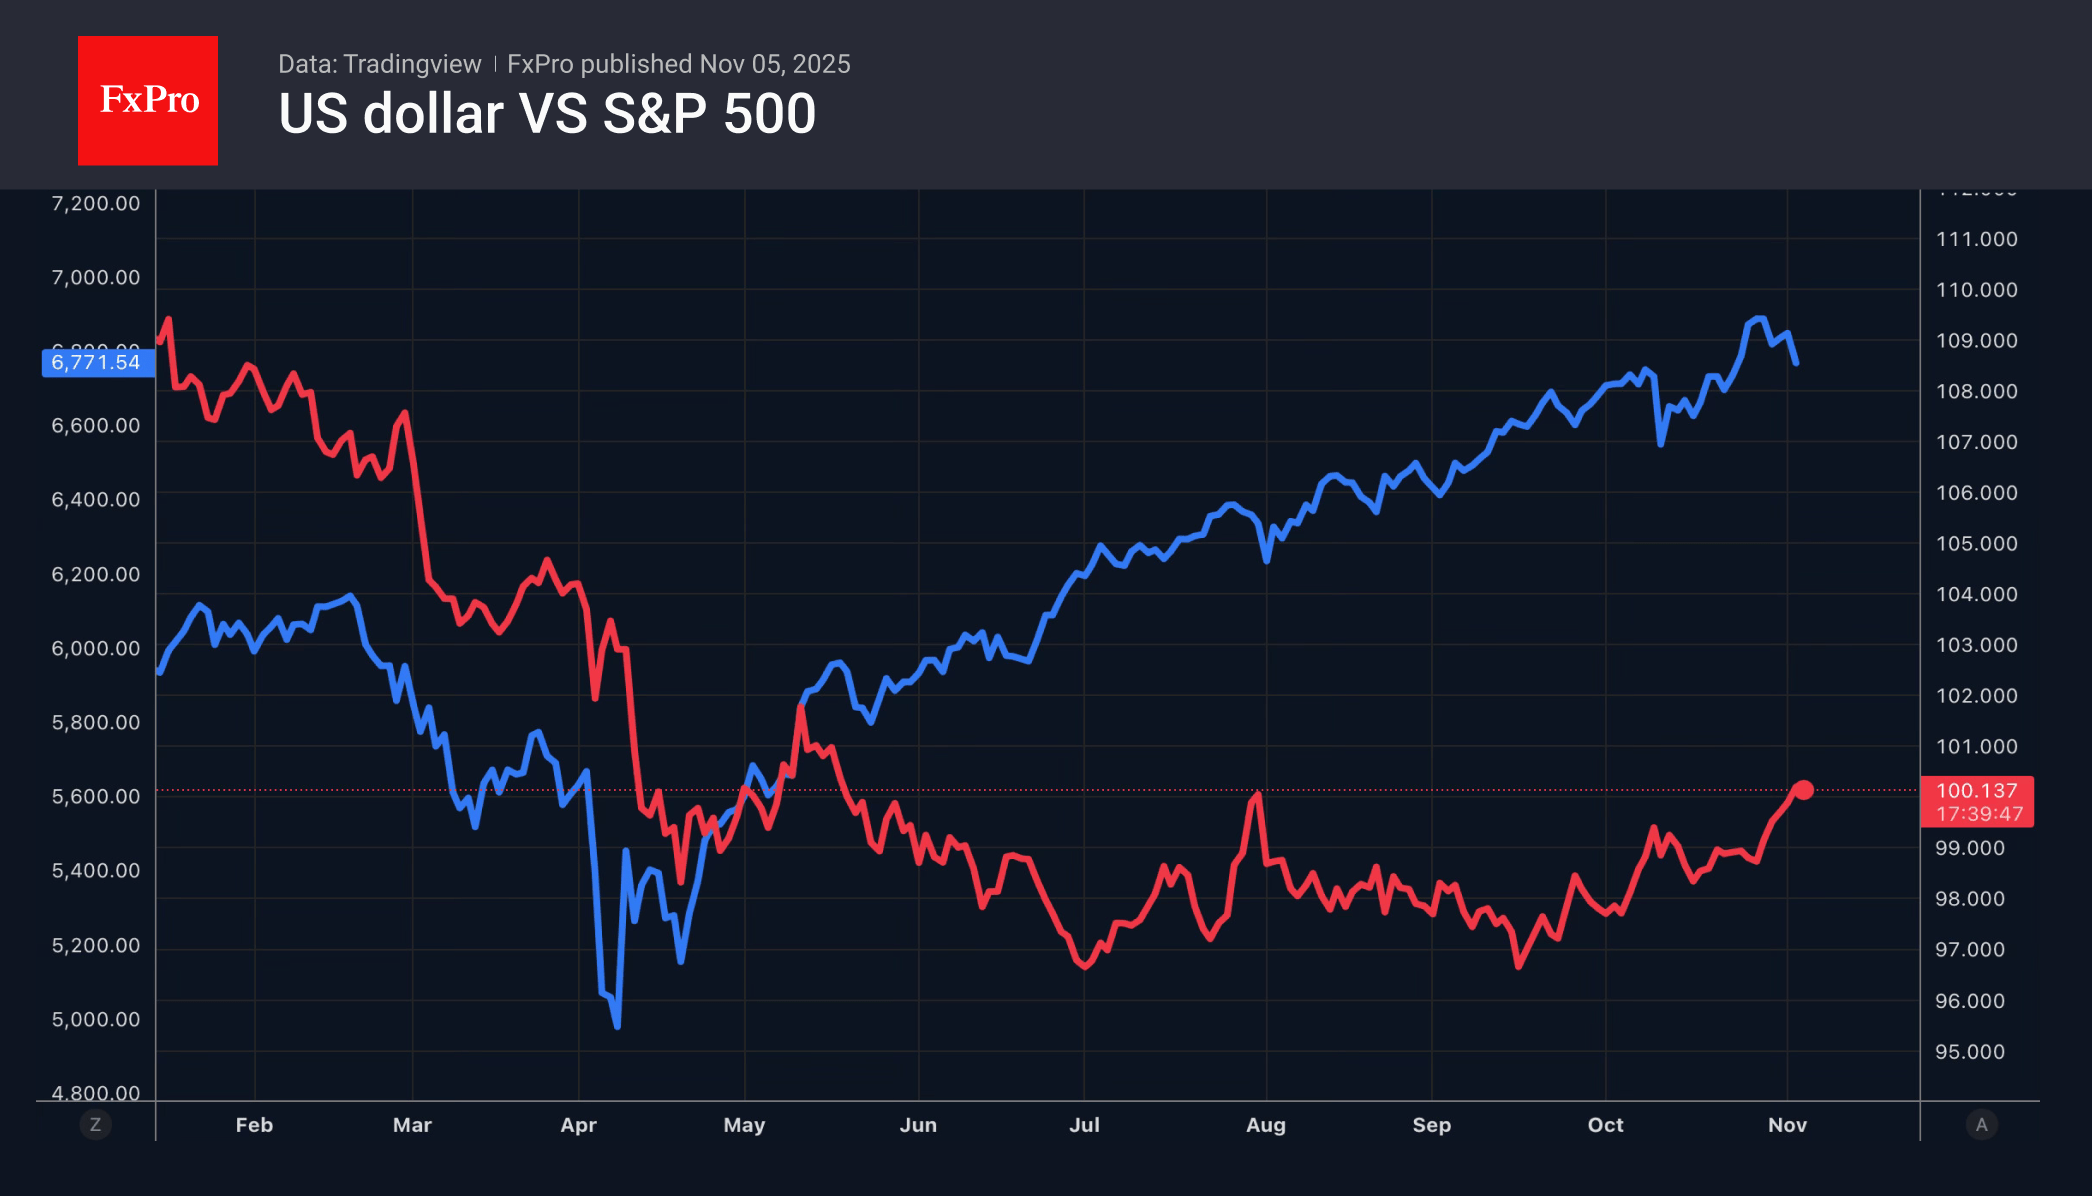
The greenback was supported by increased demand for safe-haven assets amid a pullback in US stock indices and the Supreme Court’s willingness to hear the case on the legality of tariffs. Predictit gives a 73% probability that Donald Trump will lose. Polymarket estimates the chances of such an outcome at 64%. The cancellation of import duties will be a blow to the US economy and the dollar. Refunds and an increase in the budget deficit will require a reduction in government spending and an increase in taxes. This will slow GDP growth and force the Fed to aggressively cut rates.
Nevertheless, in the short term, increased volatility in financial markets may support the dollar and other safe-haven currencies. USDCHF and USDJPY retreated from local highs. The Swiss franc was under pressure due to concerns about the National Bank’s return to a negative interest rate policy. The yen is concerned about the Bank of Japan’s reluctance to signal a continuation of the monetary policy normalisation cycle.
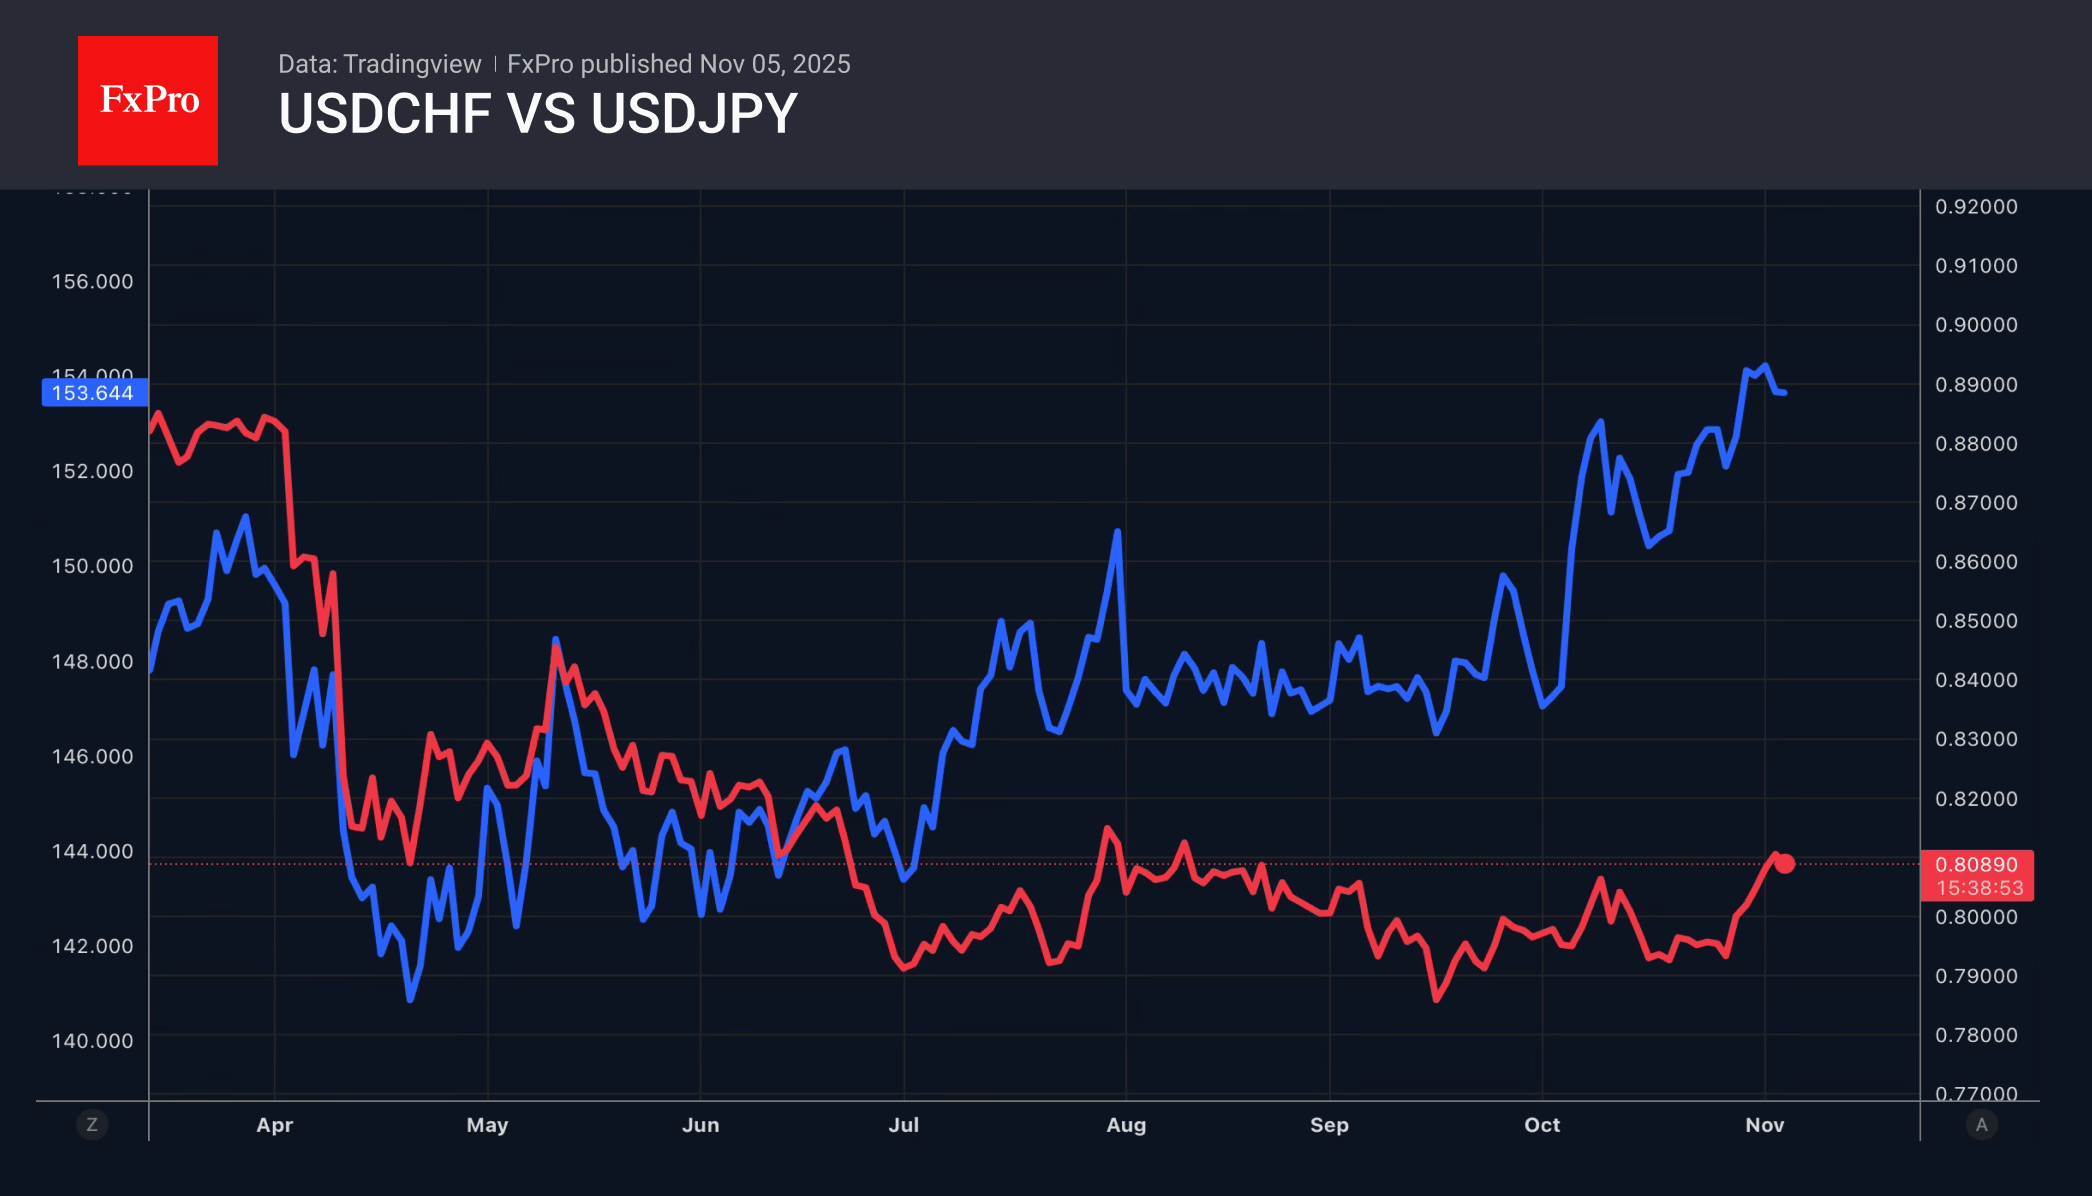
In the minutes of the last BoJ meeting, some members of the Governing Board referred to the need to be cautious. In their opinion, it is necessary to consider that Japan has experienced a long period of deflation. High rates could cause it to return to that state. Such rhetoric reduces the likelihood of an imminent increase in the overnight rate and puts pressure on the yen. At the same time, increased verbal interventions and growing demand for safe-haven currencies amid rising volatility are contributing to mixed dynamics in USDJPY.
The pound fell to April lows due to Rachel Reeves’ unwillingness to repeat Labour’s pre-election pledge not to significantly raise taxes. The Chancellor blamed the previous Conservative administration and trade friction for damaging the British economy..
If the 4-Year Cycles are Still Alive, BTC Faces a Pullback to $70K
Market Overview
The crypto market continues its impressive decline, losing another 2.4% over the past 24 hours. Having fallen to a low of $3.3 trillion, the market is now at its lowest point since early July. A steady move below the 200-day moving average and a drop of more than 20% from its peak are sure signs of a bear market. Perhaps crypto enthusiasts are confident that this is a temporary decline, similar to the one seen in March and April. However, we would prefer not to rule out the possibility of another bear market starting in the coming years. At a time when many have buried the 4-year cycles, we still see that they have only lost amplitude but have generally retained their influence. According to these patterns, the market is close to or has already passed its peak for the next couple of years, which explains the intense selling pressure since October.
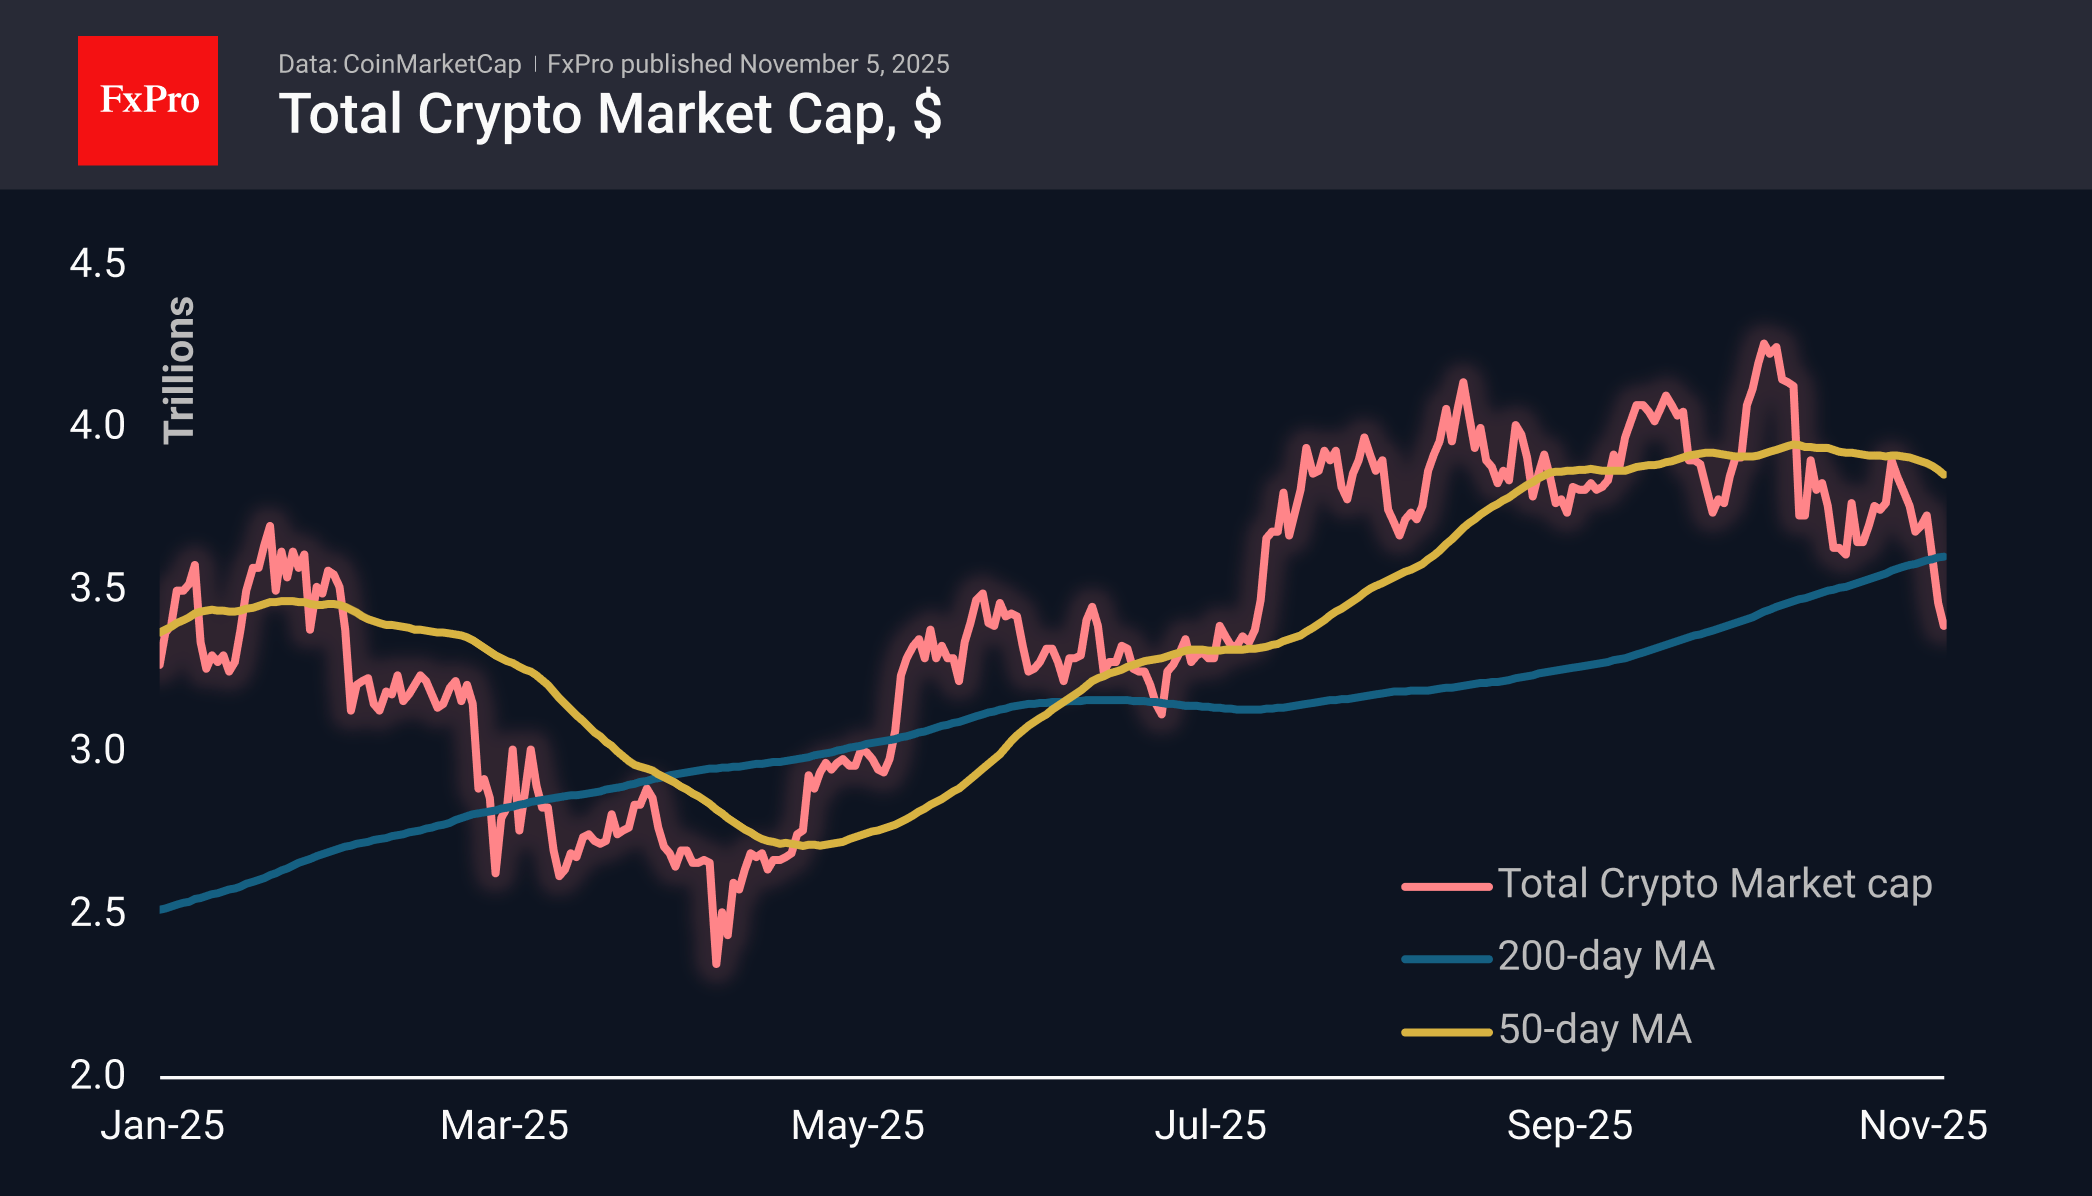
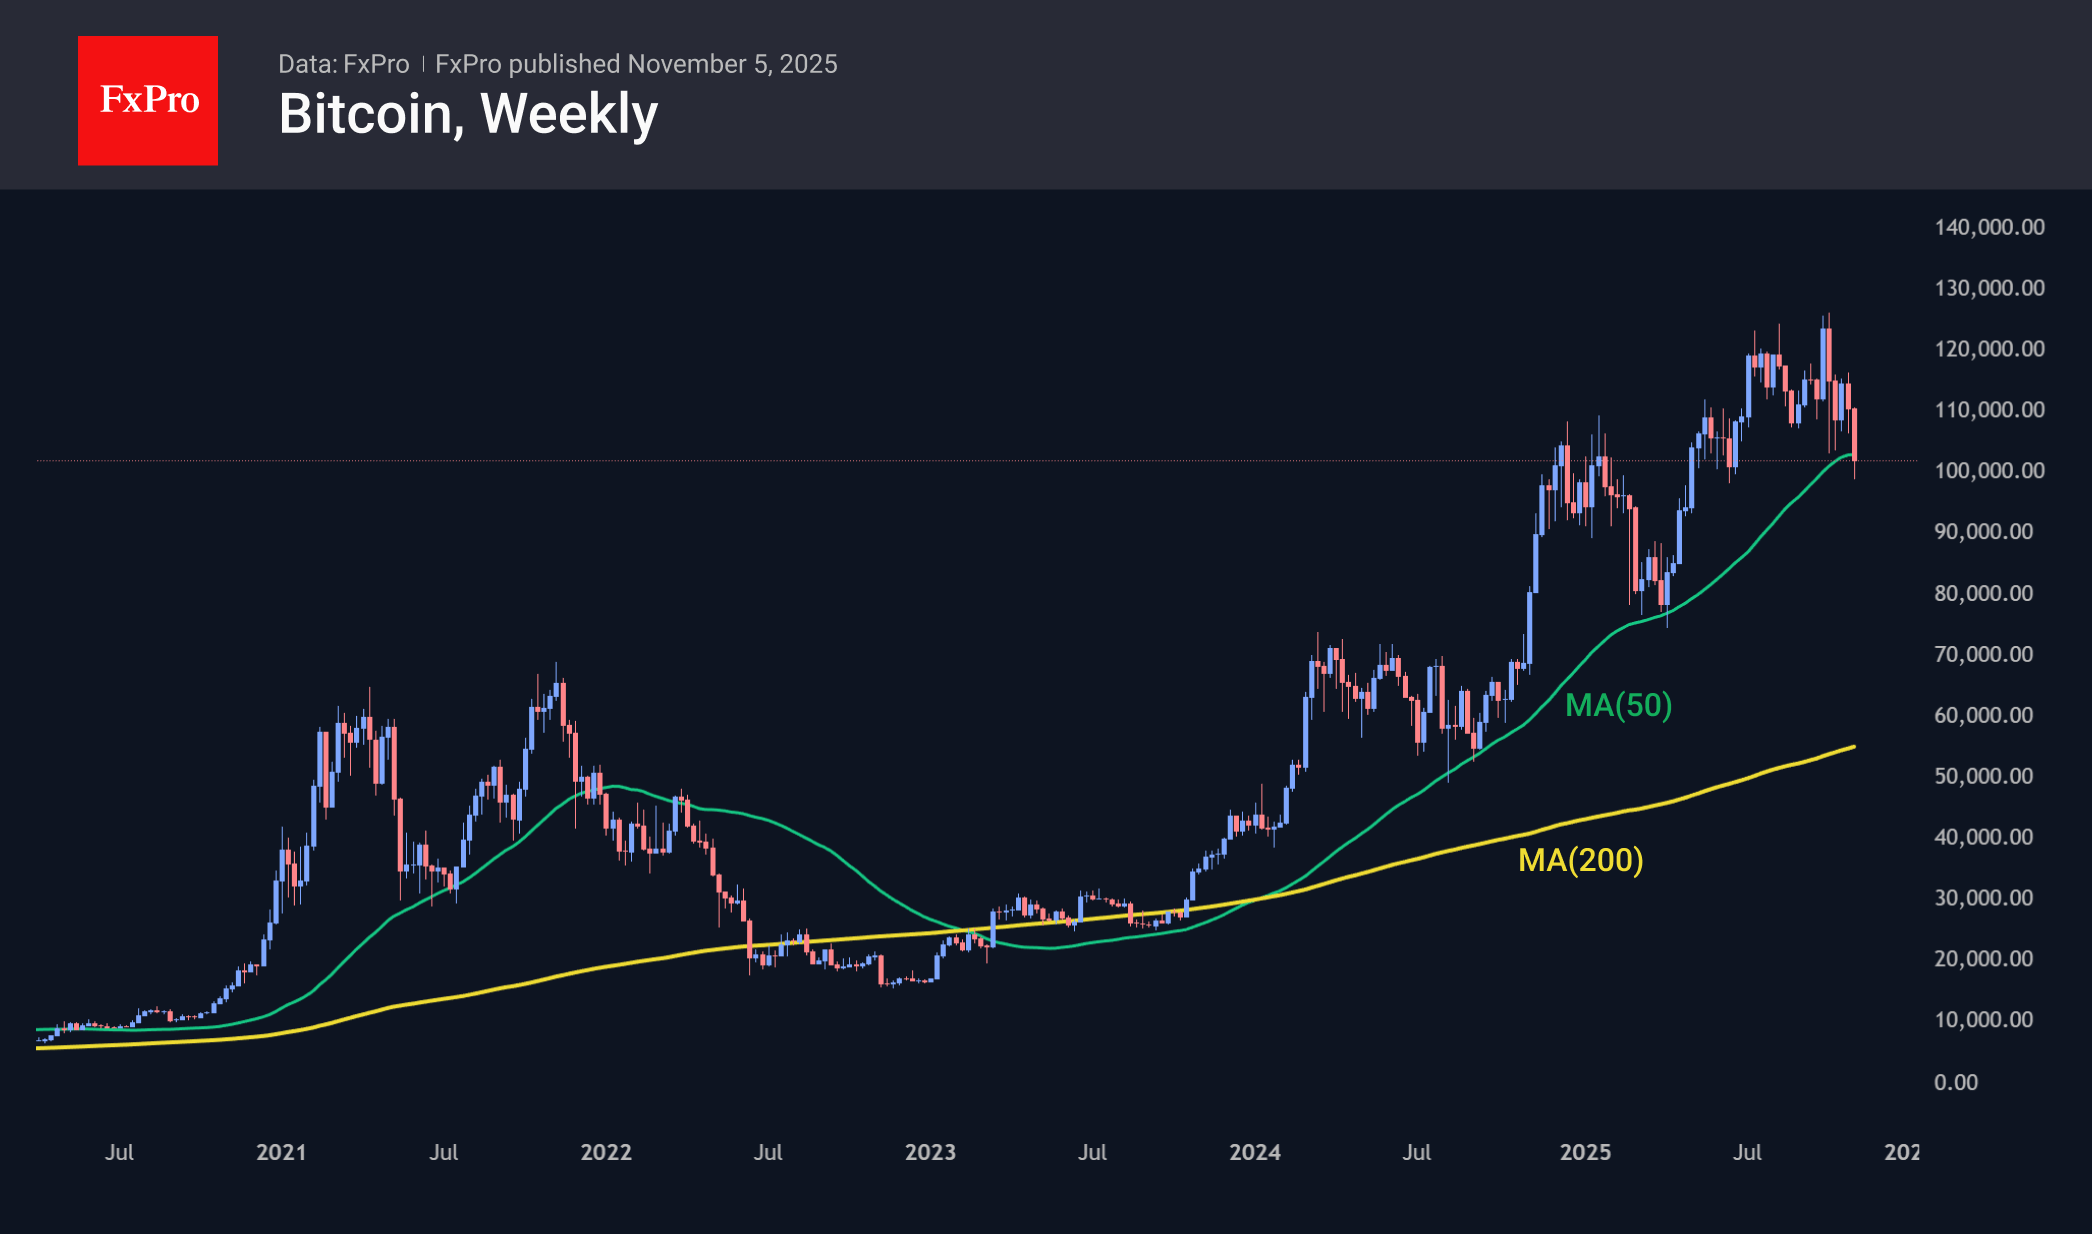
Bitcoin fell to five-digit price levels overnight, touching lows just below $99,000 twice. BTC traded steadily below these levels from February to May. And then there was a psychologically significant consolidation period in December and January. The market is now undergoing a critical test. Another step down will open the way to the $60,000-$70,000 range. However, there is a theoretical chance that BTC will quickly rebound by the end of the week from the 50-week moving average, which has served as a global support since the first half of 2023.
News Background
Early investors continue to sell off cryptocurrency. Over the past 30 days, long-term holders have sold 400,000 BTC — about 2% of the total supply of the asset, according to WeRate. Additional pressure is coming from continued outflows from spot Bitcoin ETFs.
The US government shutdown, now in its second month, is also putting pressure on Bitcoin. Another factor is the Coinbase premium, which remains in negative territory, according to CryptoQuant. This indicates sustained pressure from US sellers.
At the same time, there has been a record outflow of stablecoins from exchanges, indicating a shift of capital from risky assets to safe-haven dollar instruments.
Demand for Bitcoin from institutional investors has declined, according to Capriole. For the first time in seven months, net purchases have fallen below the daily issuance of the asset.
Bitcoin has lost significant growth potential due to the influence of large financial institutions and government structures, according to Peter Thiel, the former PayPal CEO and billionaire.
Strategy intends to conduct its initial public offering on the European stock market, issuing 3.5 million preferred shares denominated in euros. The funds will be used to purchase bitcoins and replenish working capital.
Nikkei 225 Plunges from Record High
As the chart shows, the Nikkei 225 stock index (Japan 225 on FXOpen) formed a historic peak around 52,500 points only yesterday — but today it has fallen sharply, with losses at the session low reaching approximately 7%.
Bearish sentiment was fuelled in part by a slump in shares of Japanese investment giant SoftBank, which dropped by around 14%. The company’s heavy exposure to sectors linked to artificial intelligence and cryptocurrencies, both currently under pressure, has raised investor concerns.
The decline in the Nikkei 225 appears to be an extension of the sell-off in US technology stocks recorded yesterday, driven by a stronger dollar and growing fears of an AI-fuelled bubble.
Technical Analysis of the Nikkei 225 Chart
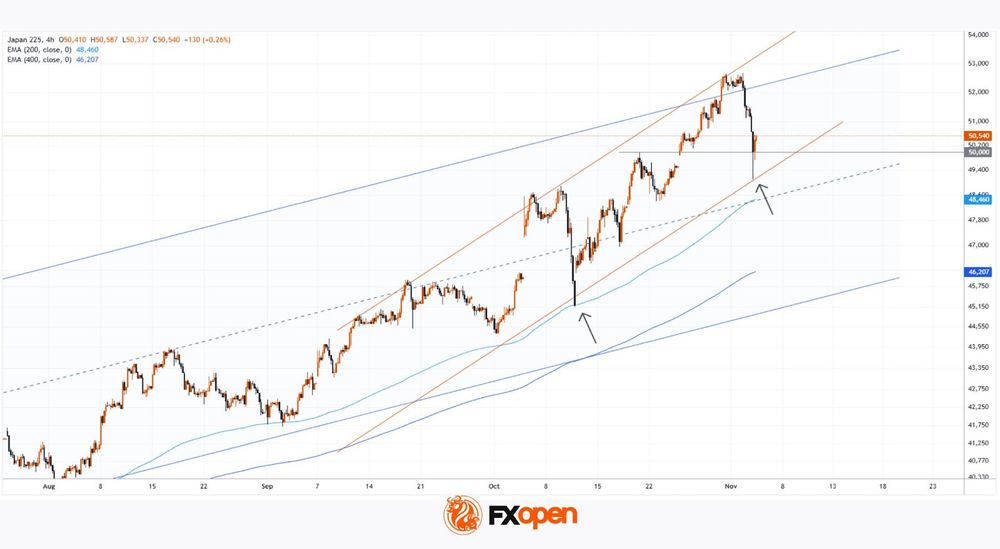
As shown by the 200- and 400-period moving averages on the 4-hour chart, Japan’s equity market remains in a long-term uptrend, with the widening gap between the two lines signalling an acceleration in growth. This supports the relevance of two upward channels:
→ a long-term channel, shown in blue;
→ an intermediate channel, marked by orange lines with a steeper gradient.
It is noteworthy that at the start of November, the Nikkei 225 entered the zone where the upper boundaries of both channels intersect – unsurprisingly, this confluence of resistance lines triggered a wave of selling pressure.
Key observations:
→ Sellers succeeded in pushing the price down towards the lower orange line, which acted as strong support, similar to the movement seen between 10–12 October (indicated by arrows on the chart);
→ Today, the price made a false bearish breakout below the psychological 50,000 level, forming a candle with a long lower shadow – a sign of buying interest.
Given the above, it is reasonable to assume that the market may attempt to resume its upward trajectory. Should this scenario play out, we could see signs of rally exhaustion, as the upward movement that began in April has already lifted the Nikkei 225 by more than 280%.
Trade global index CFDs with zero commission and tight spreads. Open your FXOpen account now or learn more about trading index CFDs with FXOpen.
This article represents the opinion of the Companies operating under the FXOpen brand only. It is not to be construed as an offer, solicitation, or recommendation with respect to products and services provided by the Companies operating under the FXOpen brand, nor is it to be considered financial advice.
UK PMI composite finalized at 52.2, firmer growth, easing inflation pressures
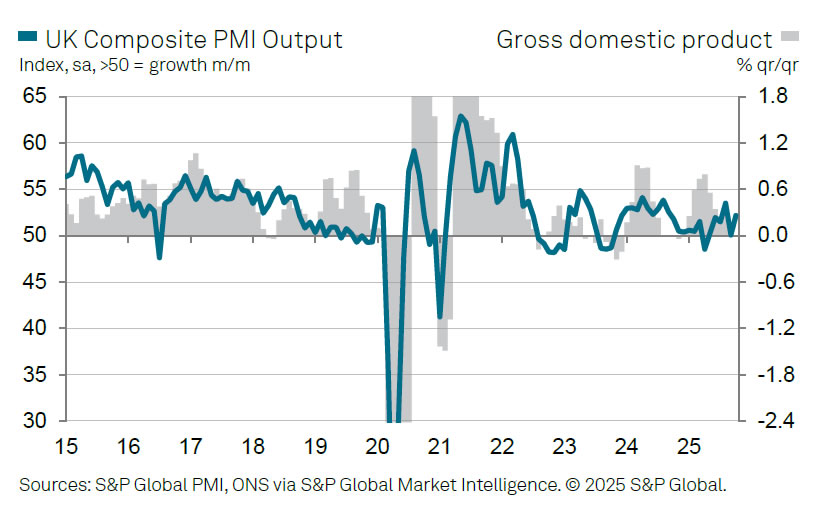
The UK services sector showed encouraging signs of recovery in October, with PMI Services finalized at 52.3, up from September's 50.8. Composite PMI also improved to 52.2 from 50.1.
According to Tim Moore, Economics Director at S&P Global Market Intelligence, the latest survey “offered some positive signals,” as both output and new business growth accelerated notably from September’s lows.
Service providers reported stronger client demand and a pickup in new orders, particularly in domestic markets. Many firms cited resilient consumer spending and a turnaround in new client wins as key drivers of October’s improvement. The data also pointed to labour market stabilization, with job cuts slowing sharply and business expectations rising to a 12-month high.
While higher wages were still pushing up costs, the overall pace of input inflation fell to its lowest level since November 2024. Selling prices increased at the slowest pace since June.
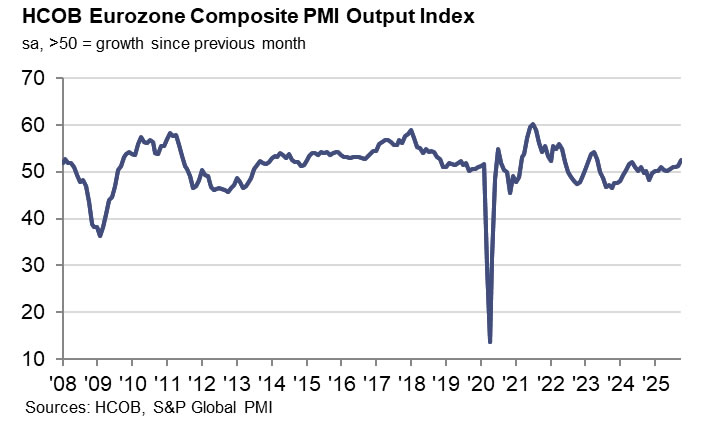
Eurozone composite PMI hits 29-month high as Germany leads recovery
Eurozone business activity accelerated strongly in October, with HCOB Services PMI finalized at 53.0, the highest in 17 months, up from 51.3 in September. Composite PMI also climbed to 52.5, a 29-month high, signaling the region’s strongest pace of expansion since early 2023. The rebound was broad-based across major economies, though notable divergences remain, with Spain and Germany leading the upturn while France continues to lag.
Among individual countries, Spain topped the rankings with a Composite PMI of 56.0, marking a 10-month high. Germany’s index surged to 53.9, its best in 29 months, followed by Ireland (53.7) and Italy (53.1). In contrast, France slipped further into contraction at 47.7, an eight-month low.
According to Cyrus de la Rubia, Chief Economist at Hamburg Commercial Bank, the services sector’s upswing was supported by the strongest growth in new business since May 2023. Rising orders encouraged firms to hire more staff, providing hope that the expansion could prove sustainable into year-end.
Cost inflation in services has eased slightly, though selling price inflation ticked up, suggesting companies are regaining some pricing power amid firmer demand. For the ECB, the PMI figures pose no immediate inflationary threat.
Full Eurozone PMI services final release here.
Gold Holds at October Lows Amid Shifting Rate Expectations
On Wednesday, gold traded around 3,940 USD per troy ounce, stabilising near its lowest levels since early October. The precious metal remains under pressure from a recalibration of interest rate expectations, as markets adopt a more cautious outlook on further easing by the Federal Reserve.
Several Fed officials have recently struck a neutral tone, aligning with Chair Jerome Powell's hawkish rhetoric last week, which suggested the October rate cut could be the final one for the year. Market-implied probabilities for a December rate cut have subsequently fallen to 69%, down sharply from 90% before the latest FOMC meeting.
With the release of official US data hampered by the ongoing government shutdown, investor attention is turning to private-sector labour market reports for guidance. Further headwinds for gold stem from easing trade tensions and China's decision to revoke tax incentives for certain jewellery retailers. This move could dampen physical demand in the world's largest gold market.
Nevertheless, a broader shift towards risk-off sentiment across global markets may renew the metal's appeal as a traditional safe-haven asset.
Technical Analysis: XAU/USD
H4 Chart:
On the H4 chart, XAU/USD is forming a consolidation range around 3,970 USD. A breakdown from this range is expected to trigger a decline toward 3,880 USD, potentially followed by a corrective rebound to 4,020 USD (testing the broken level from below). The subsequent resumption of selling pressure could drive the pair towards 3,660 USD, where the current correction may conclude, setting the stage for a new upward wave towards 4,400 USD. The MACD indicator supports this bearish near-term view, with its signal line below zero and pointing downward, confirming ongoing corrective momentum.

H1 Chart:
On the H1 chart, the market is consolidating around 3,971 USD. A break below this level could trigger a further decline towards 3,790 USD. The Stochastic oscillator aligns with this outlook, as its signal line hovers above 80 and appears poised to reverse downward toward 20, indicating building selling pressure.

Conclusion
Gold remains under pressure as expectations for a Fed cut are scaled back and concerns about physical demand emerge. While risk-off sentiment may provide intermittent support, the near-term technical structure favours further declines. A sustained break below 3,970 USD could accelerate the move towards 3,790–3,880 USD, although a deeper correction to 3,660 USD may ultimately offer a more compelling buying opportunity ahead of the next major rally.
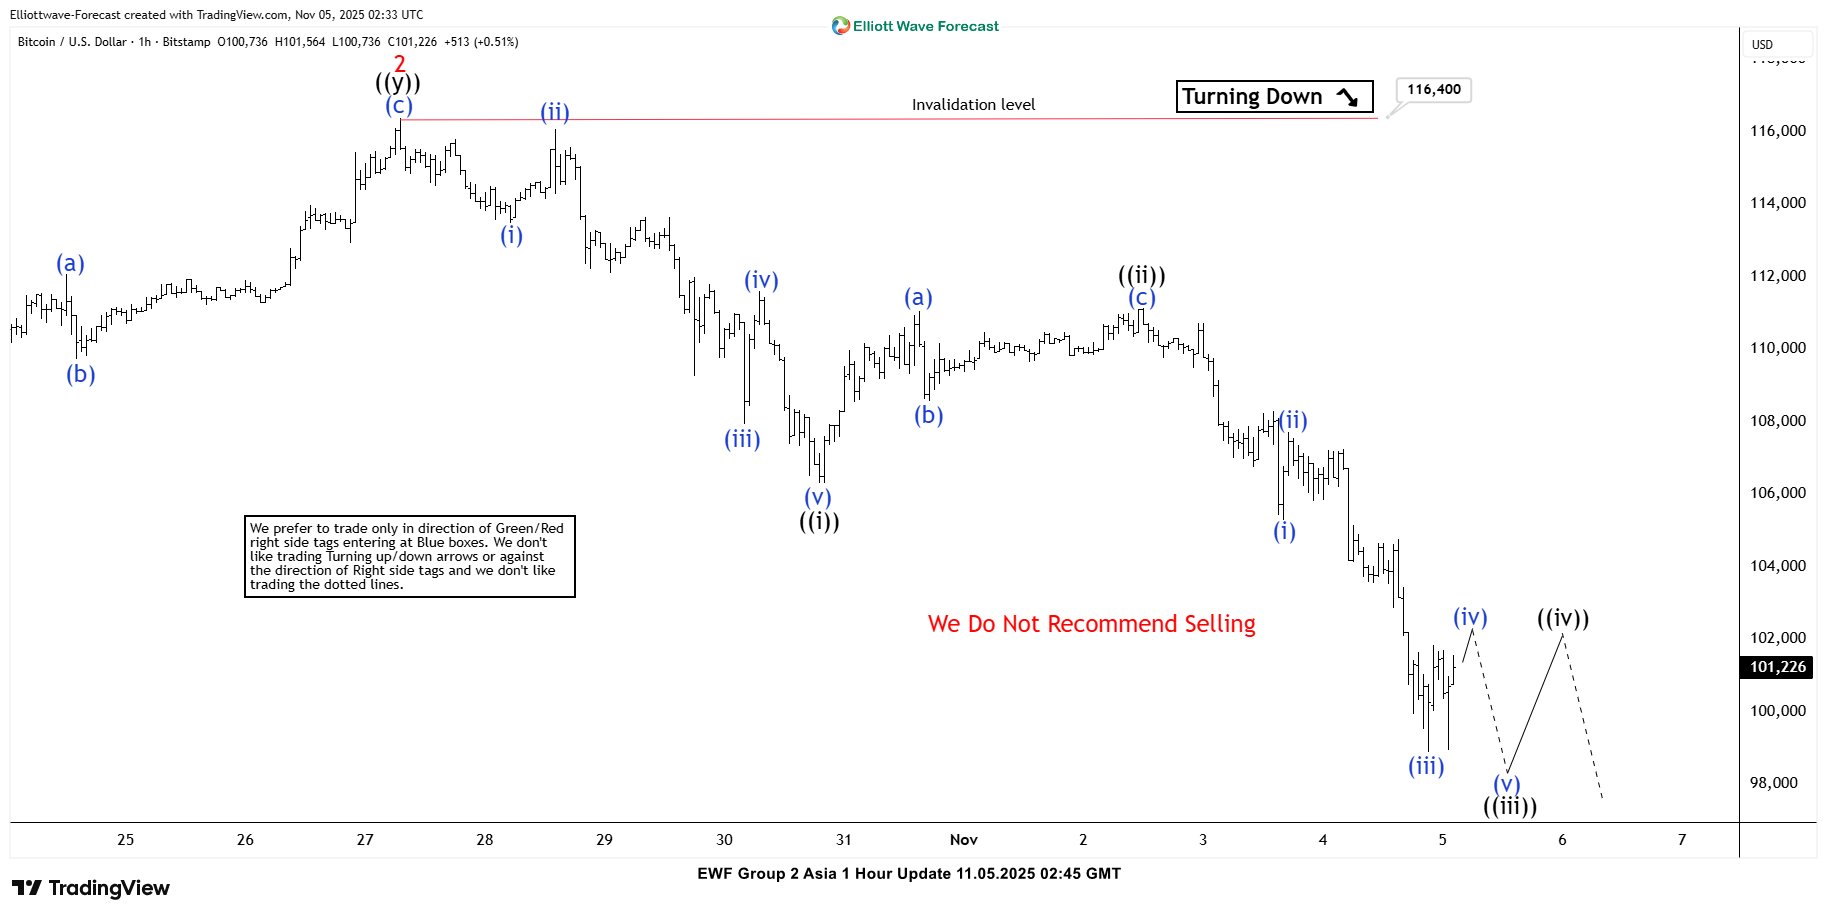
Elliott Wave Analysis: Bitcoin (BTCUSD) Bearish Pattern Signals Further Downside
The short-term Elliott Wave outlook for Bitcoin (BTCUSD) indicates that the bearish cycle originating from the October 6, 2025 peak remains incomplete. Price action continues to unfold within an impulsive Elliott Wave structure, suggesting further downside potential. From the October 6 high, wave 1 concluded at $103,530, followed by a corrective rally in wave 2 that terminated at $116,400, as illustrated in the accompanying one-hour chart.
Subsequently, Bitcoin extended its decline in wave 3, which itself subdivides into a smaller impulsive sequence. Within this leg, wave (i) ended at $113,487, and the corrective bounce in wave (ii) peaked at $116,077. The cryptocurrency then resumed its descent in wave (iii), reaching $107,948, followed by a brief recovery in wave (iv) to $111,603. The final push lower in wave (v) concluded at $106,313, thereby completing wave ((i)) of a higher degree.
A corrective rebound in wave ((ii)) ensued, forming a zigzag structure that peaked at $111,129. From there, Bitcoin turned lower again in wave ((iii)). Within this leg, wave (i) ended at $105,300, and wave (ii) retraced to $107,707. The market has since resumed its decline in wave (iii), which has extended towards $98,898. Looking ahead, wave (iv) is expected to provide a corrective bounce, retracing part of the decline from the November 3 peak. However, the broader trend remains bearish. As long as the pivot at $116,400 remains intact, any rally is anticipated to fail in a 3, 7, or 11 swing sequence, paving the way for further downside to complete wave ((iii)).
Bitcoin (BTCUSD) Latest 60 Minutes Elliott Wave Chart From 11.05.2025 Post market
Bitcoin (BTCUSD) Elliott Wave ChartBTCUSD Elliott Wave Video:
https://www.youtube.com/watch?v=bbG3XOBFF8w
Dollar Index Near a Key High
As shown on the Dollar Index (DXY) chart, the strength of the US currency is currently hovering near an important high reached in August. Market sentiment is being influenced by:
→ the ongoing government shutdown, which has already become the longest in history;
→ traders’ assessment of last week’s developments, including the Fed’s interest rate cut, the meeting between the US and Chinese presidents in South Korea, and quarterly earnings reports from major corporations.
Adding to the turbulence is the political factor: according to media reports, Democrats have achieved victories in several local elections. Notably, Zohran Mamdani – a Muslim candidate from the Democratic Party – has been elected Mayor of New York for the first time.
Technical Analysis of the DXY Chart
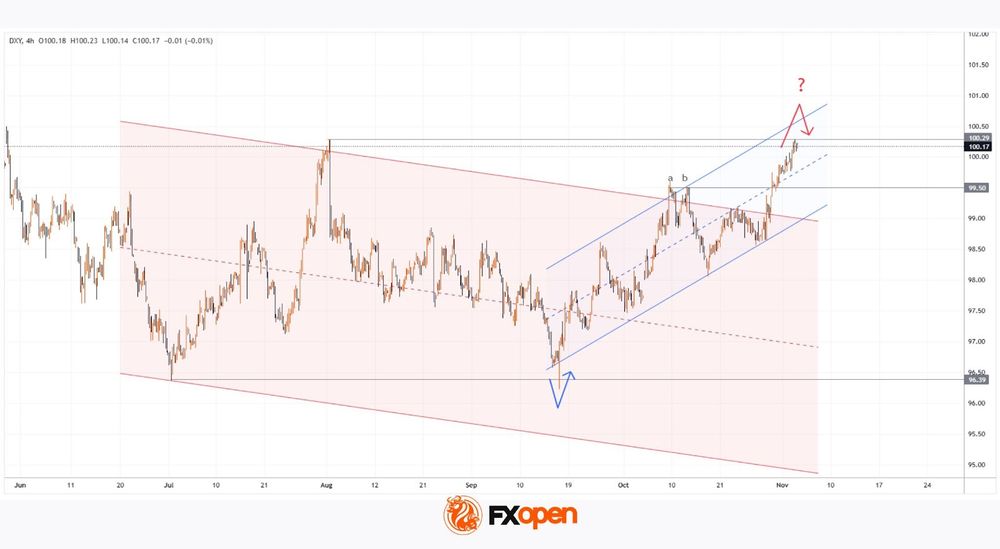
It is worth recalling that on 19 September we published an important analysis of the DXY chart, in which we:
→ highlighted the false breakout of the 1 July low;
→ suggested a bullish scenario.
Following this, the price rose to the upper boundary of the red channel. In our earlier analysis, we:
→ constructed an ascending channel;
→ anticipated that the upward trajectory would remain relevant.
That scenario played out – demand proved strong enough to overcome:
→ resistance around the 95-point level, where a double-top pattern (a–b) had previously formed;
→ the psychological barrier at 100 points.
It is possible that the 3.7% rise in the Dollar Index over roughly one and a half months could attract sellers. The main intrigue now lies in whether we will see an aggressive reversal accompanied by a false breakout – similar to what occurred in September, but this time in a downward direction.
Trade global index CFDs with zero commission and tight spreads. Open your FXOpen account now or learn more about trading index CFDs with FXOpen.
This article represents the opinion of the Companies operating under the FXOpen brand only. It is not to be construed as an offer, solicitation, or recommendation with respect to products and services provided by the Companies operating under the FXOpen brand, nor is it to be considered financial advice.