Sample Category Title
Dow Futures (YM) Eyeing Last Upside Push in Wave 5, Concluding April 2025 Cycle
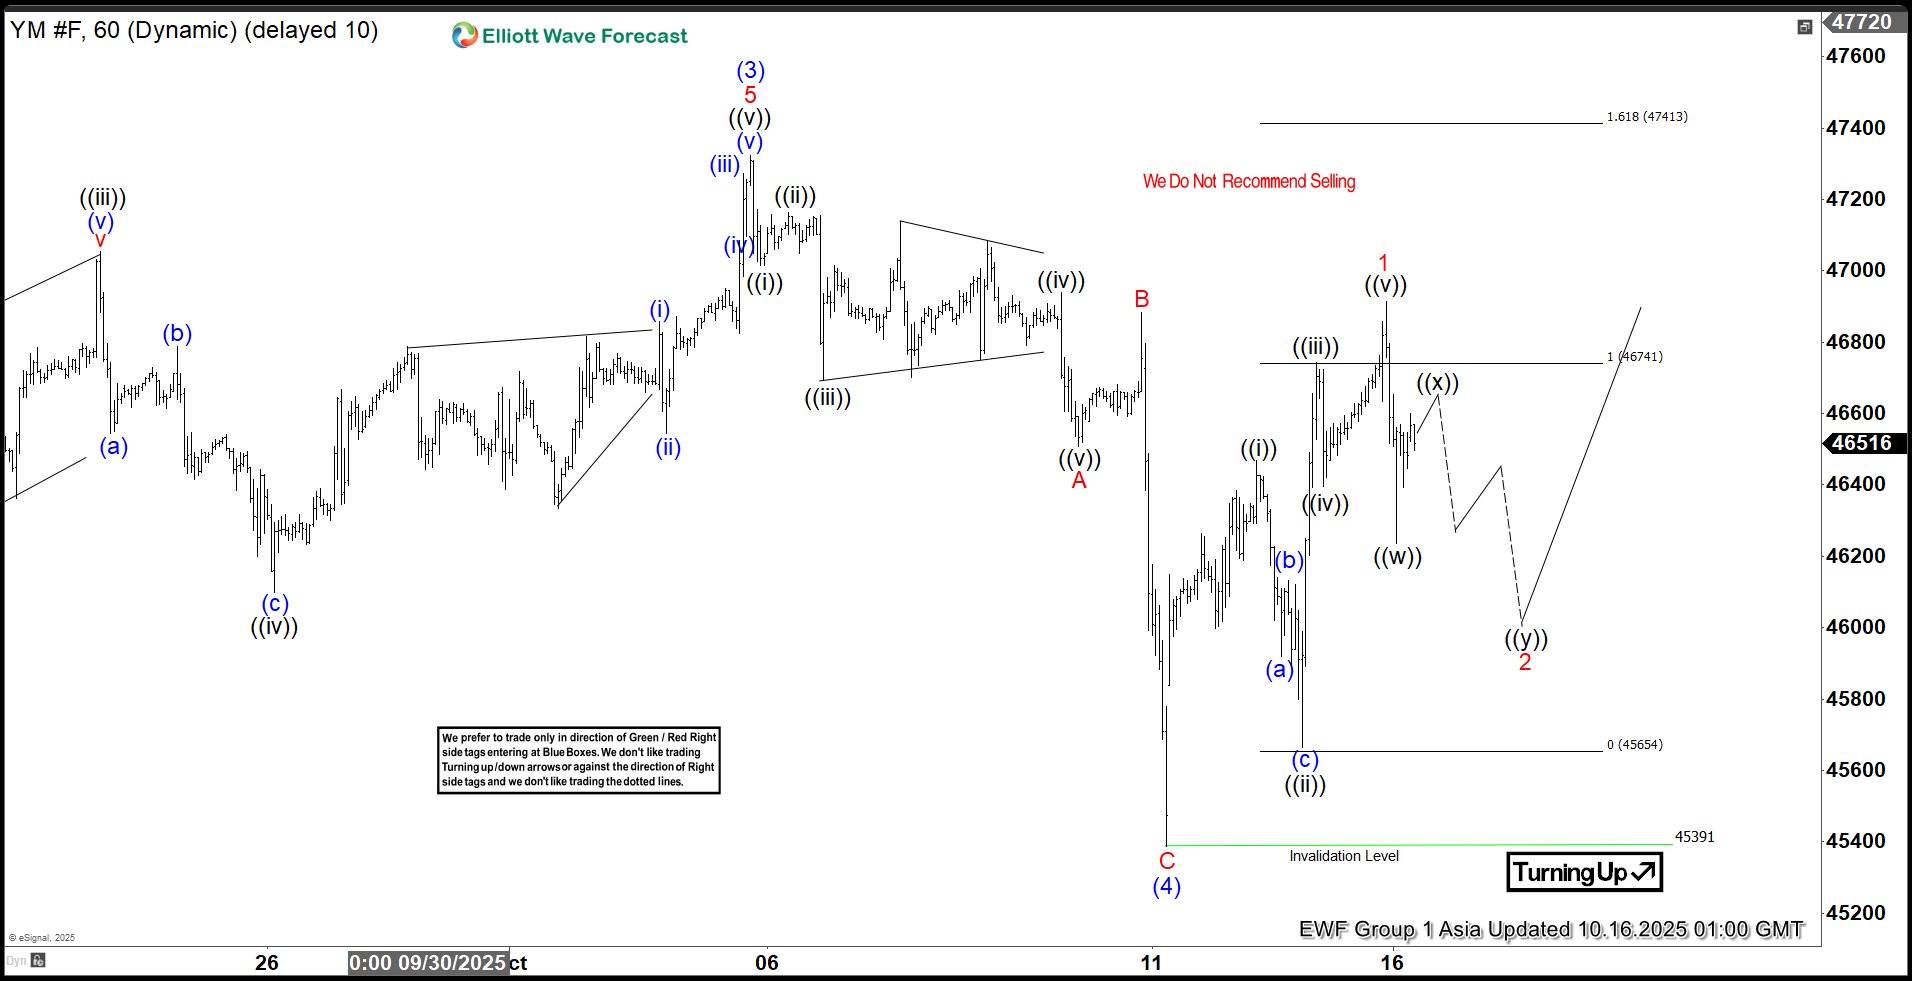
The short-term Elliott Wave outlook for Dow Futures (YM) indicates that the cycle from the April 2025 low continues as a five-wave impulse. As shown in the 1-hour chart, wave (3) of this impulse peaked at 47,323. The subsequent wave (4) pullback unfolded as a zigzag Elliott Wave structure. From wave (3), wave ((i)) declined to 47,014, followed by a wave ((ii)) rally to 47,162. Wave ((iii)) dropped to 46,693, wave ((iv)) rose to 46,938, and wave ((v)) concluded at 46,507, completing wave A. Wave B bounced to 46,883, and wave C extended lower to 45,391, finalizing wave (4) in the higher degree.
The Index has now turned higher in wave (5), but it must break above wave (3) at 47,323 to rule out a double correction. From wave (4), wave ((i)) reached 46,467, with wave ((ii)) pulling back to 45,663. Wave ((iii)) advanced to 46,743, wave ((iv)) dipped to 46,395, and wave ((v)) completed at 46,915, concluding wave 1. A wave 2 pullback is currently underway, correcting the cycle from the October 11 low before resuming higher. As long as the pivot low at 45,391 holds, expect the pullback to find support in a 3, 7, or 11-swing sequence, setting the stage for further upside.
Dow Futures (YM) – 60 Minute Elliott Wave Technical Chart:
YM – Elliott Wave Technical Video:
https://www.youtube.com/watch?v=83OWpBpM48g
EUR/USD: Recent Euro Weakness Stalled at 1.1530 Key Medium-Term Support with a Minor “Double Bottom” Bullish Breakout
Key takeaways
- Euro weakness stabilizes: EUR/USD’s recent 3.25% drop from its September high has stalled at the key 1.1530 medium-term support level.
- French political uncertainty eases: The reappointment of Prime Minister Lecornu and reduced sovereign risk premiums have helped calm Eurozone markets.
- Technical setup remains bullish: Price action forms an “Ascending Triangle” pattern, signaling a potential continuation of the medium-term uptrend.
- Short-term breakout confirmed: A minor “Double Bottom” bullish breakout above 1.1625 suggests upward momentum toward 1.1690 and 1.1760.
The euro has suddenly lost its sparkle ex-post September’s FOMC, after it hit a four-year high of 1.1919 against the US dollar on 17 September 2025. The EUR/USD dropped by 3.25% (high to low) to print an intraday low of 1.1542 on 9 October 2025.
This article will look at several key technical/momentum factors to argue that the recent weakness of the EUR/USD is likely a bullish consolidation phase within a medium-term uptrend phase that is still intact since 13 January 2025.
Before we jump straight into the technical analysis portion, let’s briefly highlight the main macro drivers that reinforced the recent softness seen in the EUR/USD.
Recent rise in Eurozone sovereign risk premium capped the euro's strength
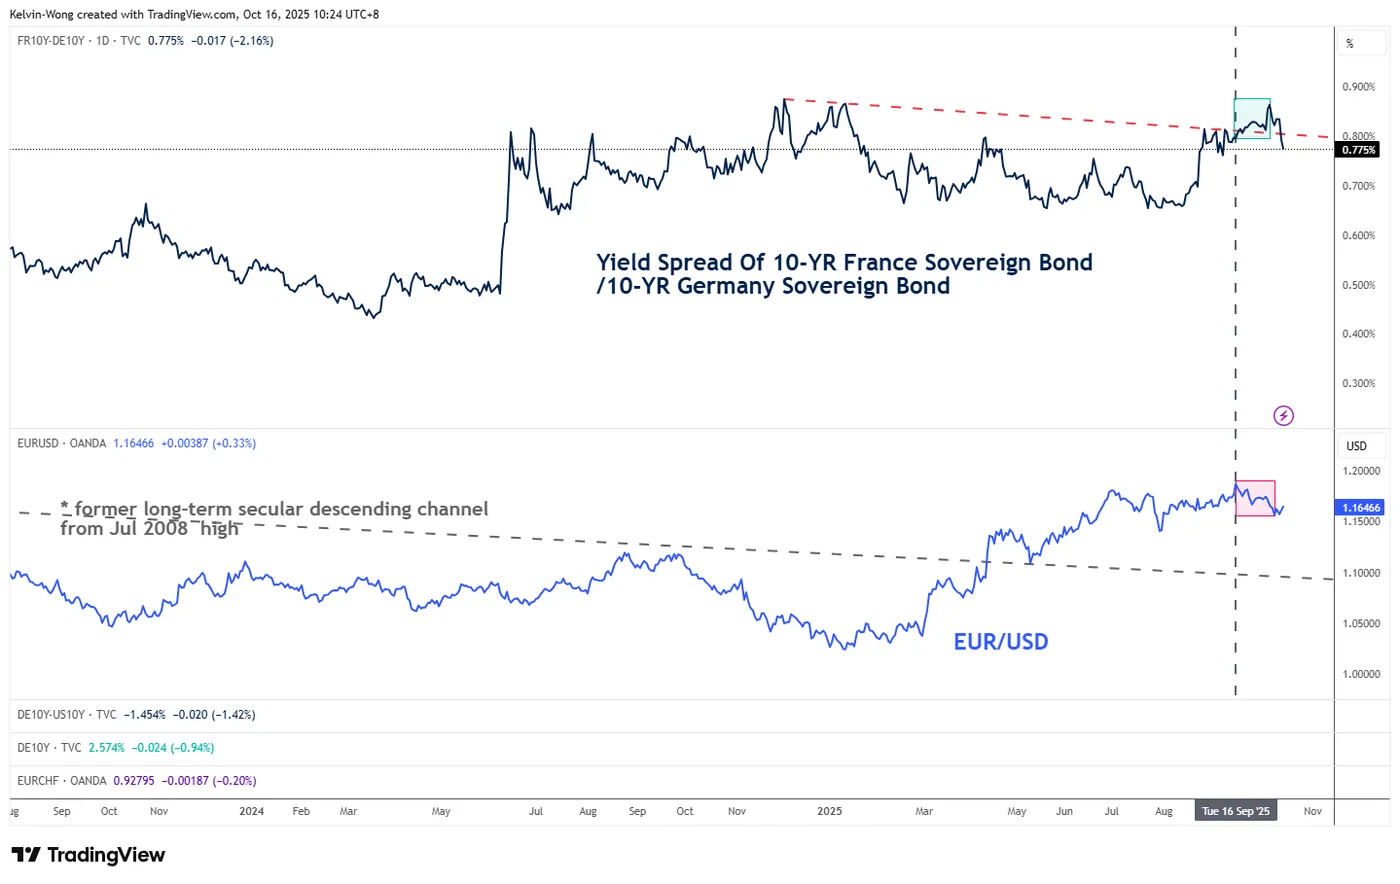
Fig. 1: 10-year yield spread of France sovereign bond/Germany Bund with EUR/USD as of 16 Oct 2025 (Source: TradingView)
Political uncertainties in France, the second-largest economy in the Eurozone, triggered higher sovereign risk premia in the Eurozone.
The newly appointed French Prime Minister, Sebastien Lecornu, resigned within hours of forming a cabinet, making it the shortest-lived government in modern French history. Also, the French government faces ongoing no-confidence threats and an inability to pass a credible budget.
An increase in sovereign risk premia in the Eurozone can be gauged by using the yield spread of the 10-year French sovereign bond over the 10-year Germany Bund. The yield spread has spiked from 0.80% to 0.86% during the period of 16 September 2025 to 7 October 2025, in turn, triggering a slide in the EUR/USD over the same period (see Fig. 1).
Interestingly, the 10-year yield spread between the French sovereign bond and the Germany Bund has started to compress to 0.77% as of 16 October 2025 at this time of writing, which suggests that sovereign risk premia in the Eurozone have been reduced as compared to two weeks ago, reinforced by the reappointment of the French Prime Minister Sebastien Lecornu proposed suspending a law to raise the retirement age in a bid to bring political stability to the country.
Let’s now focus on the medium-term technical outlook of the EUR/USD
Evolving within an “Ascending Triangle” range configuration since 1 July 2025
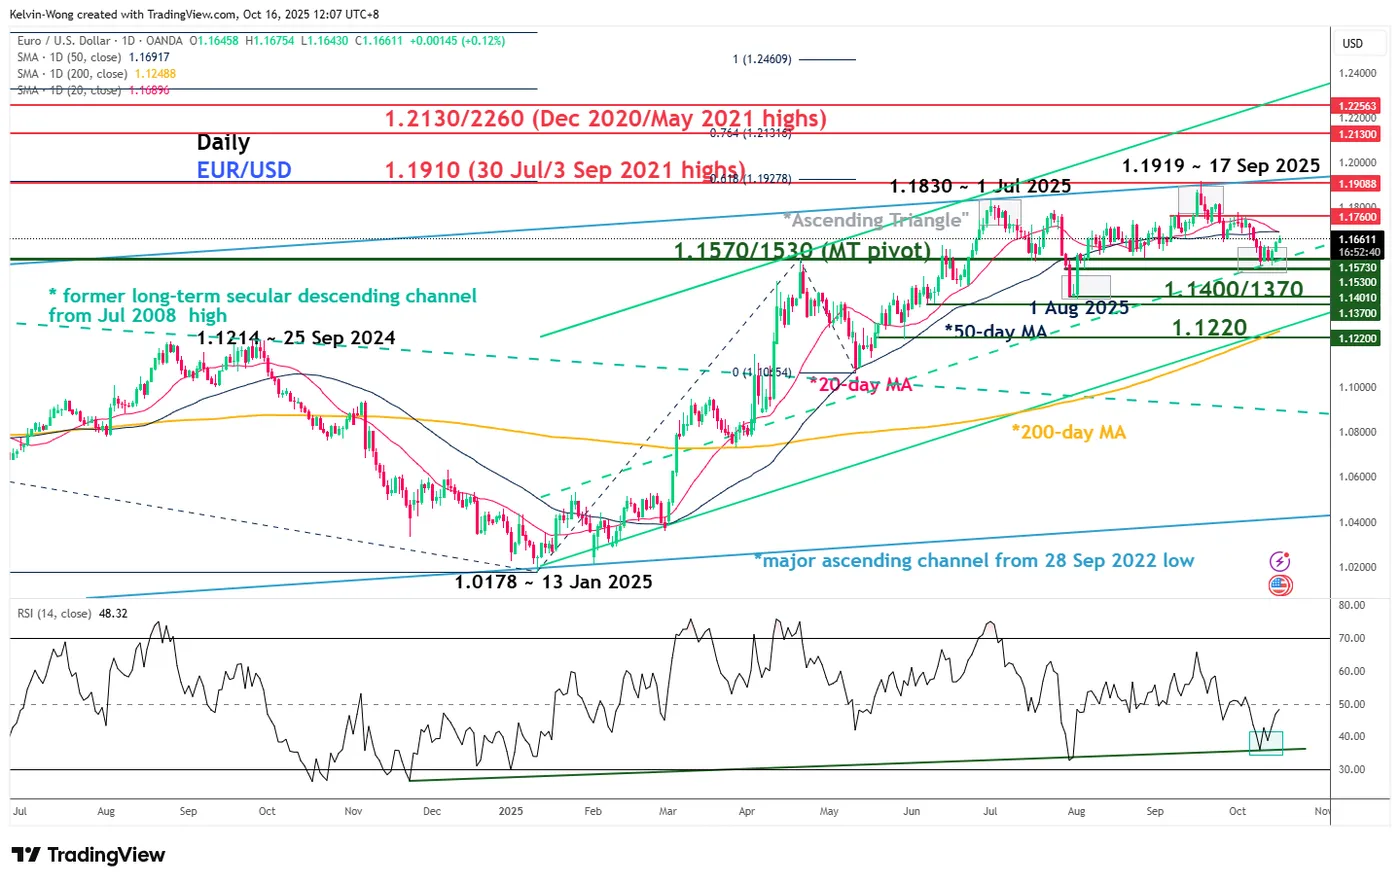
Fig. 2: EUR/USD medium-term & major trends as of 16 Oct 2025 (Source: TradingView)
Since hitting its 1 July 2025 high of 1.1830, the price actions of the EUR/USD have traced out “similar swing highs” and “higher swing lows” (depicted by the four grey shaded boxes on the chart).
These observations represent a potential bullish consolidation configuration called “Ascending Triangle” that represents a pause in EUR/USD’s impulsive up move sequences within its ongoing medium-term uptrend phase in place since 13 January 2025 low of 1.0178 (see Fig. 2).
Also, the daily RSI momentum indicator of the EUR/USD has managed to stage a rebound after a retest of its key ascending support on 9 October 2025, which supports the ongoing medium-term uptrend phase of the EUR/USD.
We will now examine its latest short-term (1 to 3 days) trajectory and key technical levels to watch on the EUR/USD.
Preferred trend bias (1-3 days) – Minor “Double Bottom” bullish breakout
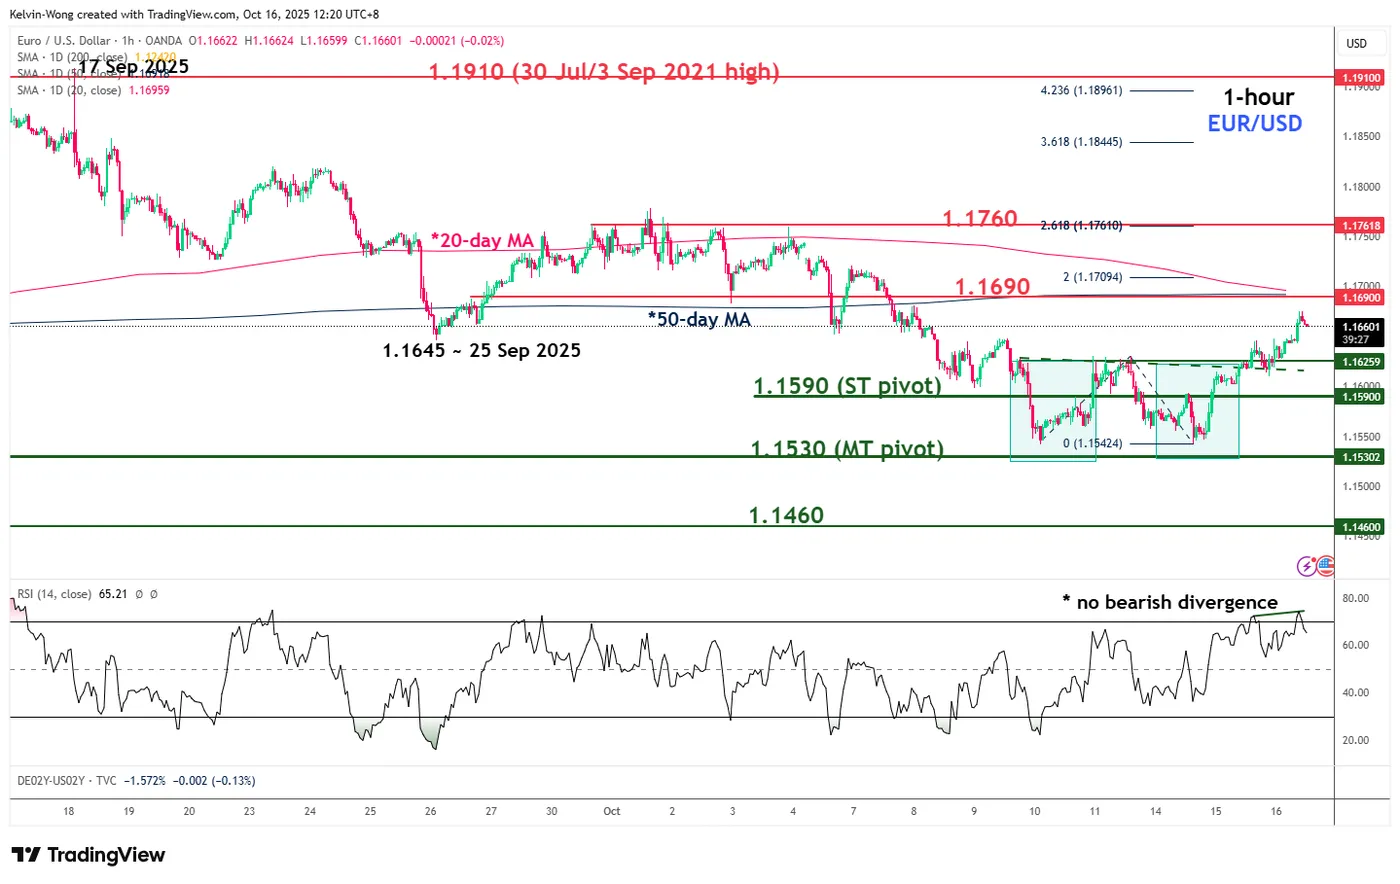
Fig. 3: EUR/USD minor trend as of 16 Oct 2025 (Source: TradingView)
Bullish bias with key short-term pivotal support at 1.1590 for the EUR/USD. A clearance above 1.1690 sees the next intermediate resistance coming in at 1.1760 (see Fig. 3).
Key elements
- The price actions of the EUR/USD have staged a bullish breakout on Wednesday, 15 October 2025, from the neckline resistance of a minor “Double Bottom” (depicted in the two green boxes shown in Fig. 3), now turns into an intermediate pull-back support at 1.1625
- The 1.1690 intermediate resistance confluences closely with the intersection point of the 20-day and 50-day moving averages.
- The hourly RSI momentum indicator of the EUR/USD has reached its overbought region, but no bearish divergence condition has been flashed out. These observations suggest a minor pull-back in the EUR/USD rather than a bearish reversal scenario.
Alternative trend bias (1 to 3 days)
A break below the 1.1590 key short-term support invalidates the minor bullish breakout scenario on the EUR/USD for a retest on the 1.1530 key medium-term pivotal support.
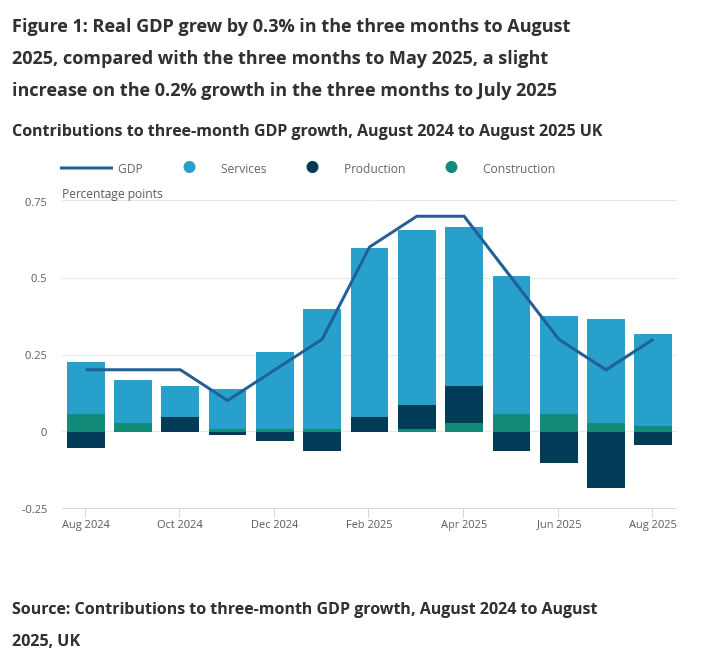
UK GDP expands 0.1% mom in August, growth patchy across sectors
The UK economy expanded modestly by 0.1% mom in August, in line with expectations, suggesting that activity remains subdued but stable. Industrial production rose 0.4% mom, helping to offset flat performance in the dominant services sector and a -0.3% mom contraction in construction.
On a three-month basis, GDP grew 0.3% in the period to August compared with the previous three months. The details were uneven: services output rose 0.4%, maintaining its role as the primary driver of growth, while production slipped -0.3% and construction gained -0.3%.
French PM Faces Two Votes of No Confidence
In focus today
In the UK, August GDP-data is released. After a strong Q1, the economy has slowed, which is bad news for the Labour government ahead of the November budget, where the fiscal wiggle room is very limited.
In France, Premier Lecornu will face two votes of no confidence in parliament starting at 9:00 CET called by the far-right and far-left, respectively. It is expected that he survives due to backing from the Socialists and Republican Party.
Economic and market news
What happened yesterday
In the US, a federal judge temporarily blocked mass layoffs of federal workers during the government shutdown, citing alleged political motivations behind the cuts. The Trump administration had planned to lay off over 10,000 workers, with 4,100 already notified. The case, brought by unions, challenges the legality of such layoffs during the shutdown.
In Sweden, final September inflation data confirmed earlier estimates, with CPIF at 3.1% year-on-year and CPIF excluding energy at 2.7%. Rental car prices and package holidays declined as expected, reflecting seasonal adjustments, while food prices fell by 0.8% month-on-month. The release offers no surprises, aligning with the Riksbank's signal of unchanged policy for now.
In China, credit data indicated aggregate financing beat expectations in September, but the credit impulse weakened, reflecting fading stimulus effects from earlier this year. Government issuance slowed, and private credit demand remained subdued.
In Norway, the government published the fiscal budget for 2026. The government expects to spend 2.8% of the value of the Petroleum Fund, exactly in line with Norges Bank's assumption from the September MPR. The budget effect on the economy is expected to be slightly expansionary, at 0.1% of GDP. Overall, this should be neutral for monetary policy outlook. Keep in mind that the minority government is dependent on four other parties to get the budget through the Parliament.
In Japan, coalition negotiations for forming a new government are ongoing, with no agreement yet on a date for the prime ministerial vote, which is unlikely before next week. Uncertainty remains as discussions continue.
Equities: Equities were mostly higher on Thursday - an impressive performance given that investors are effectively flying blind amid the government shutdown and the resulting lack of macroeconomic data. Nevertheless, markets continue to find alternative sources of information, with banks emphasising continued consumer resilience and generally positive takeaways for ASML. Sector and style trends continue to indicate a solid appetite for risk: cyclicals are outperforming defensives this week and small caps are beating large caps. Yesterday, the Russell 2000 rose 1%, the S&P 500 gained 0.4%, and the Stoxx 600 advanced 0.6%. Notably, performance broadened to include yield-sensitive sectors such as real estate and utilities, while value cyclicals - including materials, industrials, and banks - saw some profit-taking. Futures are little changed this morning.
FI and FX: US equity indices closed in green after a choppy session. European government bond yields continue to decline from the long end while the 10Y OAT-Bund spread tightens as PM Lecornu is seen to survive the vote of confidence. EURUSD adds to gains and trades slightly north on 1.1650. EUR/Scandies have had a wobbly week so far, though EURNOK and EURSEK remain within familiar ranges after they edged higher yesterday.
WTI Crude Oil Dives Below $60, Rebound Could Face Headwinds
Key Highlights
- WTI Crude Oil prices started a fresh decline below the $60.00 support.
- A key bearish trend line is forming with resistance at $61.00 on the 4-hour chart.
- Gold rallied further to a new all-time high above $4,200.
- Bitcoin is attempting to recover, but upside might be capped near $115,000.
WTI Crude Oil Price Technical Analysis
WTI Crude Oil price failed to stay above $62.50 against the US Dollar. There was a strong bearish reaction below $62.00 and $60.00.
Looking at the 4-hour chart of XTI/USD, the price settled below $60.00, the 100 simple moving average (red, 4-hour), and the 200 simple moving average (green, 4-hour). Finally, the bulls appeared near the $57.70 level.
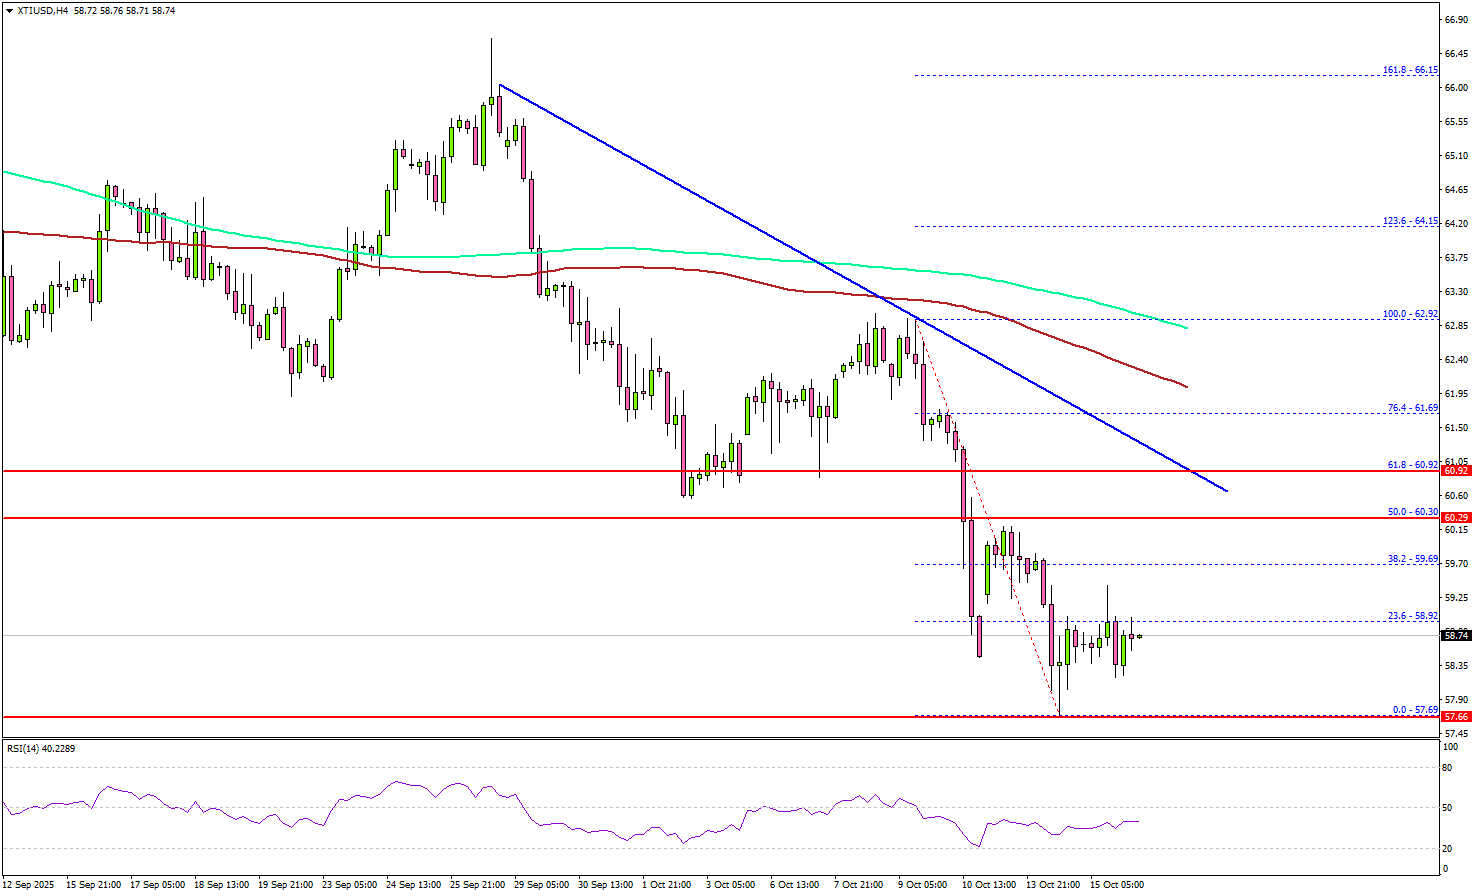
A low was formed at $57.69 before there was a minor recovery wave. However, the bears are still active below $60.00. On the upside, immediate resistance is near the $60.00 level.
The first key hurdle for the bulls could be $60.30 and the 50% Fib retracement level of the downward move from the $62.92 swing high to the $57.69 low. The main hurdle sits at $61.00. There is also a key bearish trend line forming with resistance at $61.00.
A close above $61.00 might send Oil prices toward the 100 simple moving average (red, 4-hour) at $62.40. Any more gains might call for a test of $63.50 in the near term.
On the downside, the first major support sits near the $58.00 zone. The next support could be $57.50. A daily close below $57.50 could open the doors for a larger decline. In the stated case, the bears might aim for a drop toward $55.00. Any more losses could open the doors for a test of the $50.00 handle.
Looking at Gold, the bulls remained in action, and they pushed the price to a new all-time high above the $4,200 level.
Economic Releases to Watch Today
- US Initial Jobless Claims - Forecast 223K, versus 218K previous.
- US Retail Sales for Sep 2025 (MoM) – Forecast +0.4%, versus +0.6% previous.
- US Producer Price Index for Sep 2025 (MoM) – Forecast +0.3%, versus -0.1% previous.
- US Producer Price Index for Sep 2025 (YoY) – Forecast +2.6%, versus +2.6% previous.
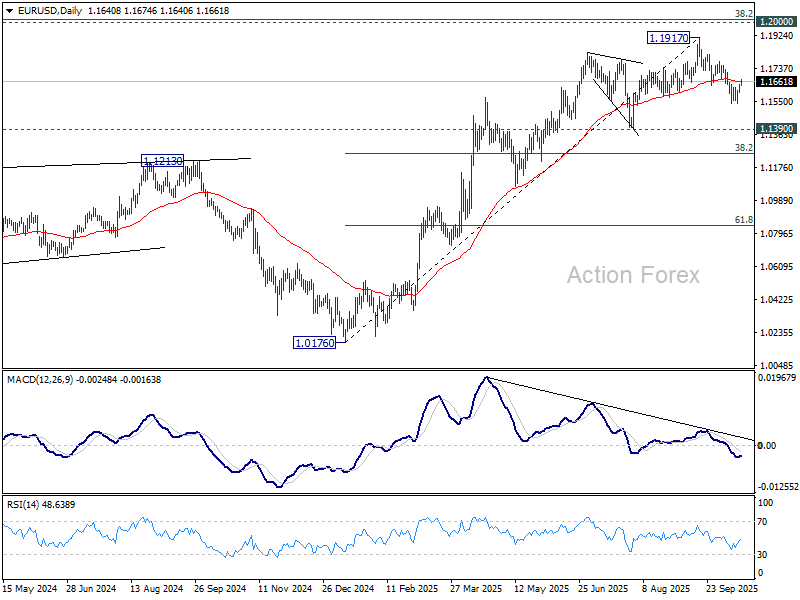
EUR/USD Daily Outlook
Daily Pivots: (S1) 1.1617; (P) 1.1632; (R1) 1.1663; More…
EUR/USD's recovery from 1.1540 extends higher but stays well below 1.7778 resistance. Intraday bias remains neutral and further decline is still expected. On the downside, break of 1.1540 will resume the fall from 1.1917 to 1.1390 , or further to 38.2% retracement of 1.0176 to 1.1917 at 1.1252.
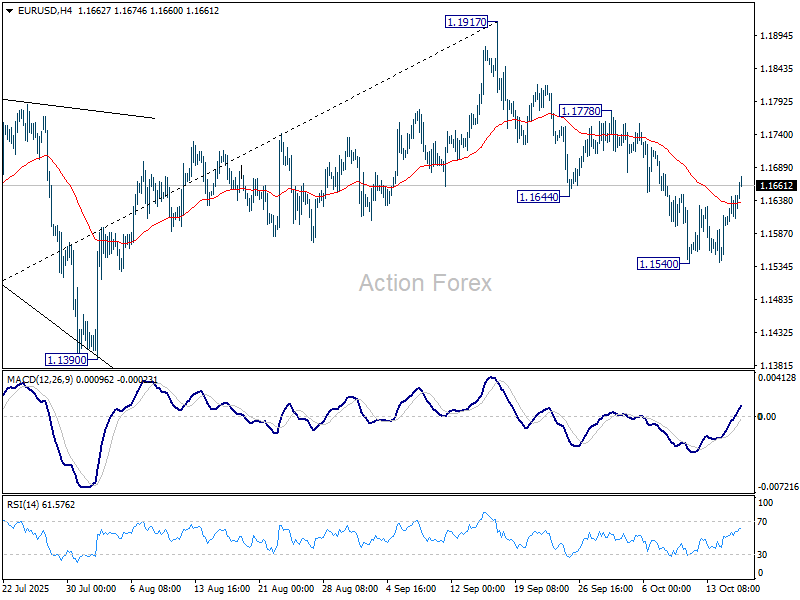
In the bigger picture, considering bearish divergence condition in D MACD, a medium term top is likely in place at 1.1917, just ahead of 1.2 key psychological level. As long as 55 W EMA (now at 1.1274) holds, the up trend from 0.9534 (2022 low) is still extended to continue. Decisive break of 1.2000 will carry larger bullish implications. However, sustained trading below 55 W EMA will argue that rise from 0.9534 has completed as a three wave corrective bounce, and keep outlook bearish.
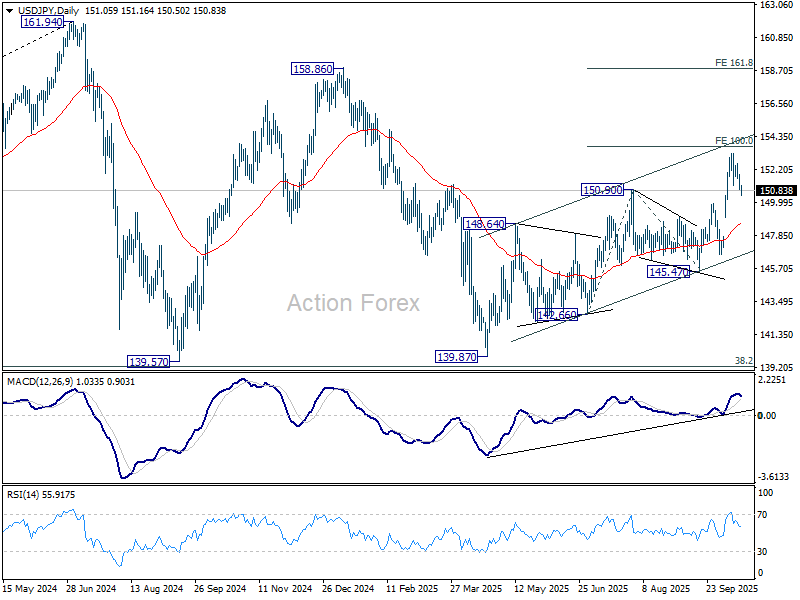
USD/JPY Daily Outlook
Daily Pivots: (S1) 150.68; (P) 151.28; (R1) 151.66; More...
USD/JPY is still staying in consolidations below 153.26 and intraday bias remains neutral. Downside should be contained by 149.95 resistance turned support. Break of 153.26 will target 100% projection of 142.66 to 150.90 from 145.47 at 153.71. Firm break there will pave the way to 161.8% projection at 158.80. However, decisive break of 149.95 will bring deeper pullback to 55 D EMA (now at 148.58) instead.
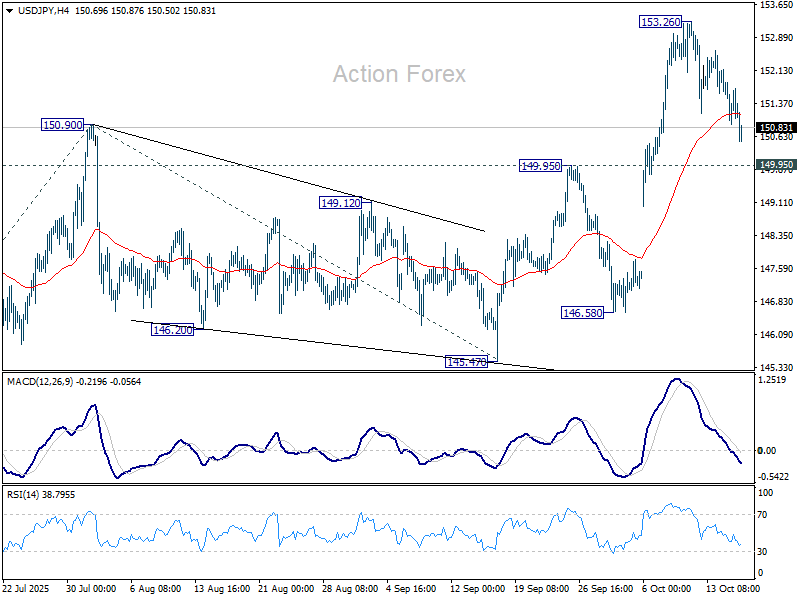
In the bigger picture, current development suggests that corrective pattern from 161.94 (2024 high) has completed with three waves at 139.87. Larger up trend from 102.58 (2021 low) could be ready to resume through 161.94 high. On the downside, break of 145.47 support will dampen this bullish view and extend the corrective pattern with another falling leg.
GBP/USD Daily Outlook
Daily Pivots: (S1) 1.3344; (P) 1.3376; (R1) 1.3435; More...
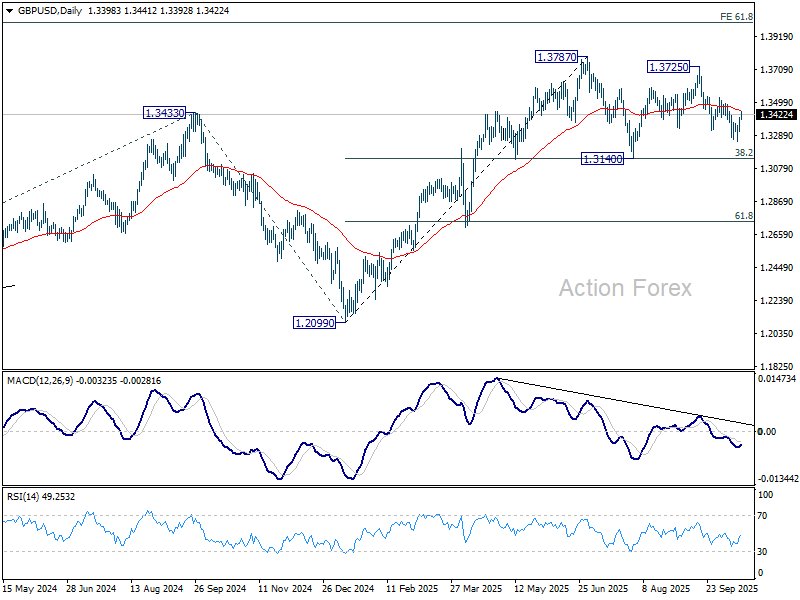
GBP/USD's rebound from 1.3247 extends higher today, but stays below 1.3526 resistance. Intraday bias remains neutral at this point. Fall from 1.3725 could still extend lower to 1.3140 cluster (38.2% retracement of 1.2099 to 1.3787 at 1.3142). Strong support is expected from there to complete the corrective pattern from 1.3787. On the upside, break of 1.3526 will bring stronger rally back to 1.3725/87 resistance zone.
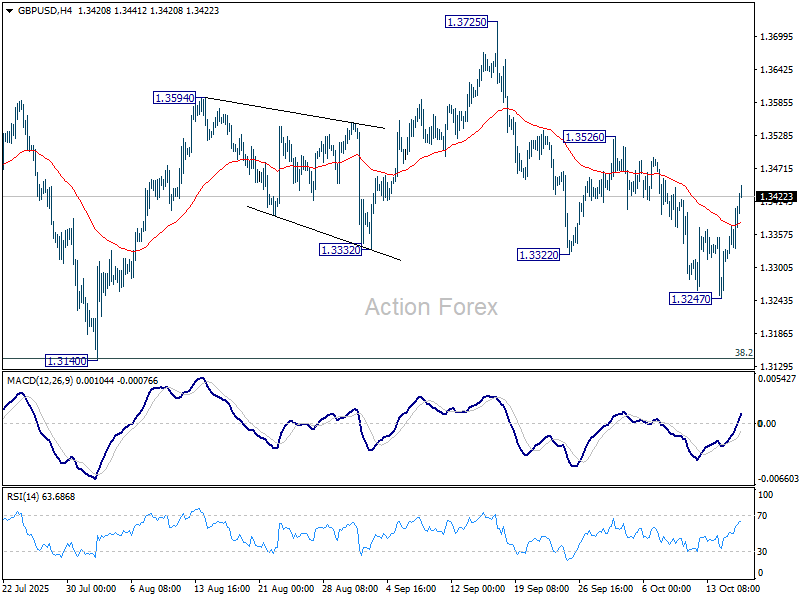
In the bigger picture, rise from 1.0351 (2022 low) is still seen as a corrective move. Further rally could be seen to 61.8% projection of 1.0351 to 1.3433 (2024 high) from 1.2099 (2025 low) at 1.4004. But strong resistance could emerge from 1.4248 (2021 high) to limit upside. Sustained break of 55 W EMA (now at 1.3173) will argue that a medium term top has already formed and bring deeper fall back to 1.2099.
USD/CHF Daily Outlook
Daily Pivots: (S1) 0.7944; (P) 0.7980; (R1) 0.8003; More…
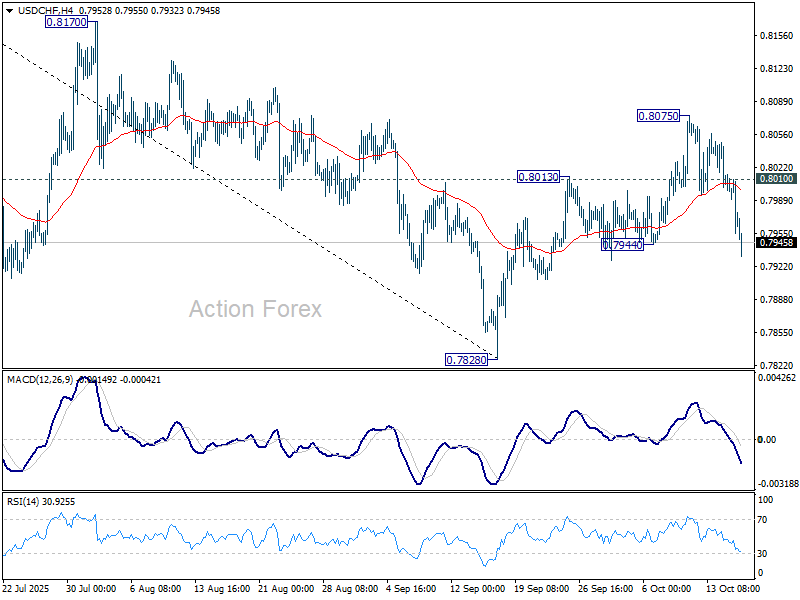
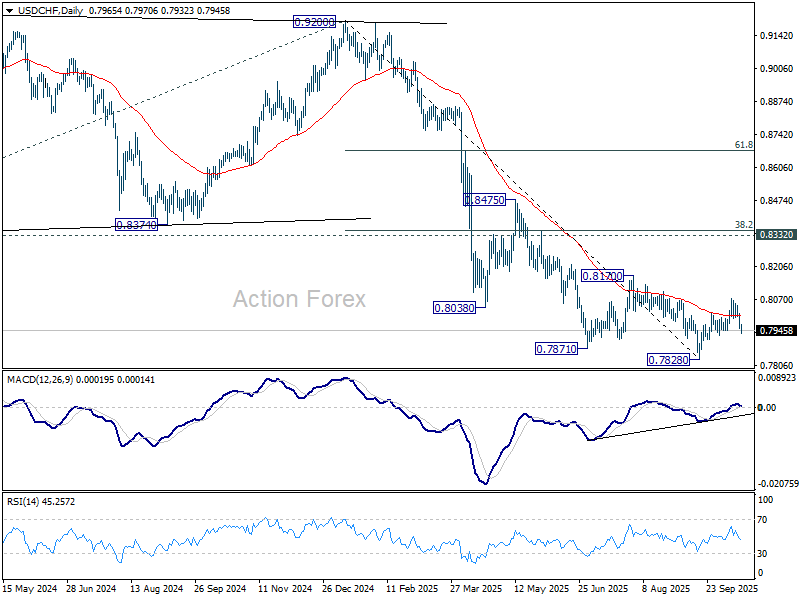
USD/CHF's break of 0.7944 support argues that rebound from 0.7828 has completed with three waves up to 0.8075. Intraday bias is back on the downside for retesting 0.7828 low. On the upside, above 0.8010 minor resistance will turn intraday bias neutral again first. Overall, price actions from 0.7828 are seen as a correction to fall from 0.9200 that could still extend for a while.
In the bigger picture, long term down trend from 1.0342 (2017 high) is still in progress. Next target is 100% projection of 1.0146 (2022 high) to 0.8332 from 0.9200 at 0.7382. In any case, outlook will stay bearish as long as 0.8332 support turned resistance holds (2023 low).
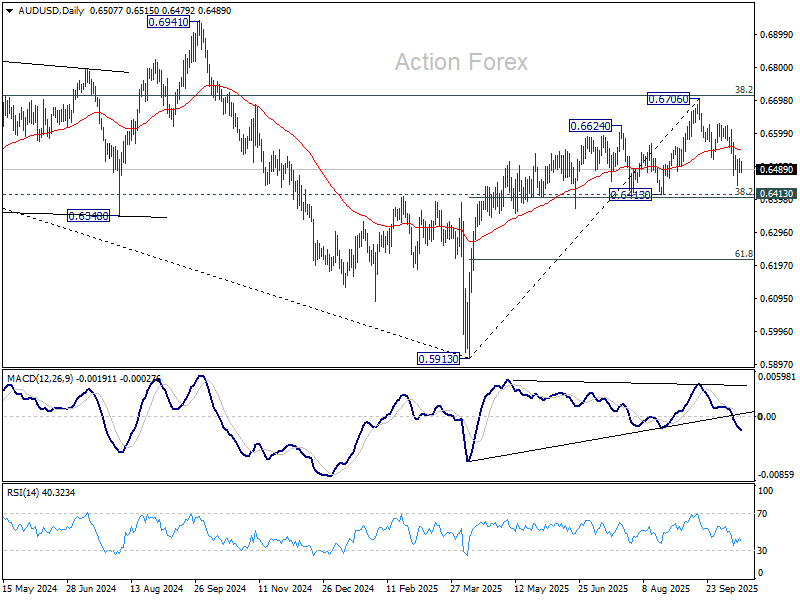
AUD/USD Daily Report
Daily Pivots: (S1) 0.6488; (P) 0.6506; (R1) 0.6529; More...
AUD/USD dips mildly today but stays above 0.6439 temporary low. Intraday bias remains neutral first. On the downside, break of 0.6439 will target 0.6413 cluster support (38.2% retracement of 0.5913 to 0.6706 at 0.6403). Sustained break there will pave the way to 61.8% retracement at 0.6216. Nevertheless, break of 0.6628 resistance will retain near term bullishness, and bring retest of 0.6706 high.
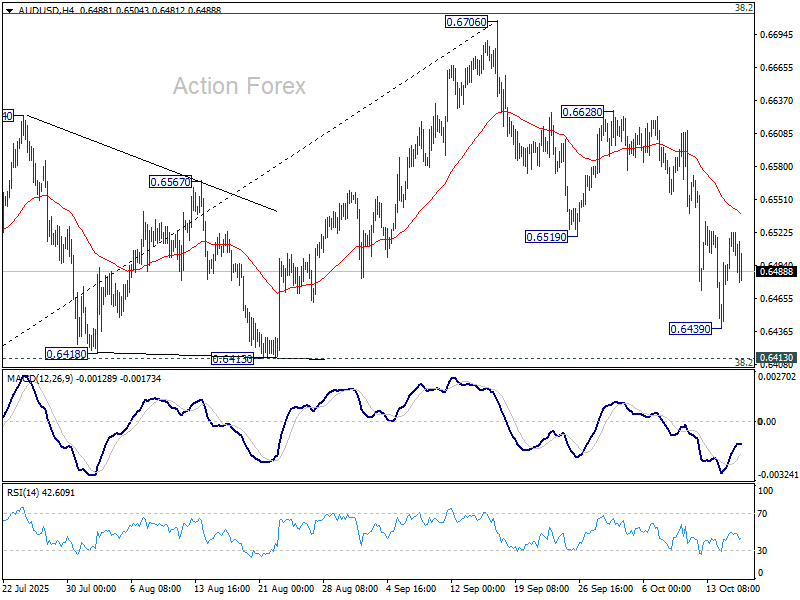
In the bigger picture, there is no clear sign that down trend from 0.8006 (2021 high) has completed. Rebound from 0.5913 is seen as a corrective move. Outlook will remain bearish as long as 38.2% retracement of 0.8006 to 0.5913 at 0.6713 holds. Nevertheless, considering bullish convergence condition in W MACD, sustained break of 0.6713 will be a strong sign of bullish trend reversal, and pave the way to 0.6941 structural resistance for confirmation.