
Sample Category Title
GBP/USD Mid-Day Outlook
Daily Pivots: (S1) 1.3344; (P) 1.3376; (R1) 1.3435; More...
Intraday bias in GBP/USD remains neutral first. Fall from 1.3725 could still extend lower. But even in that case, Strong support is expected from 1.3140 cluster (38.2% retracement of 1.2099 to 1.3787 at 1.3142) to complete the corrective pattern from 1.3787. On the upside, break of 1.3526 will bring stronger rally back to 1.3725/87 resistance zone.
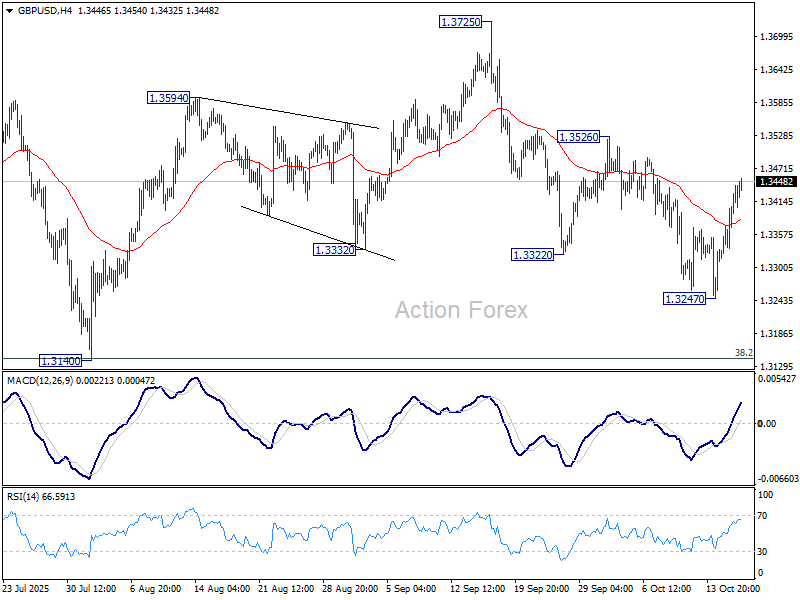
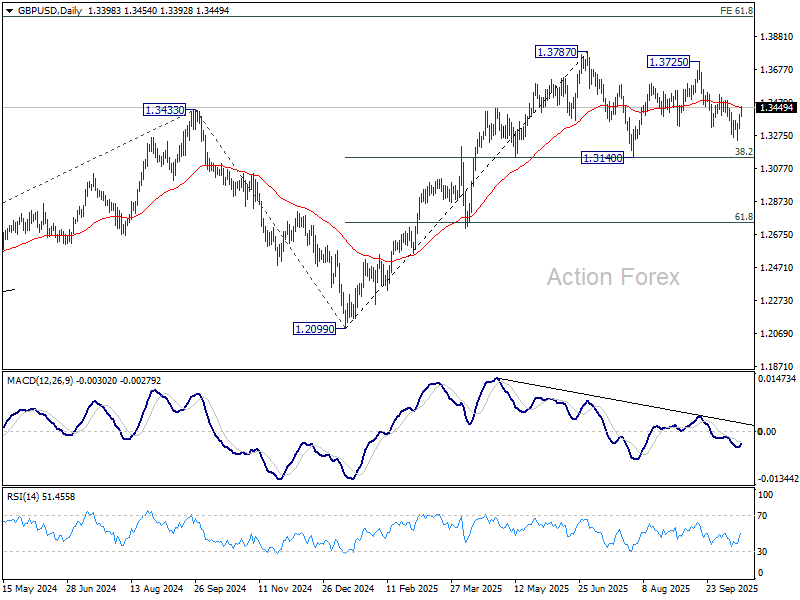
In the bigger picture, rise from 1.0351 (2022 low) is still seen as a corrective move. Further rally could be seen to 61.8% projection of 1.0351 to 1.3433 (2024 high) from 1.2099 (2025 low) at 1.4004. But strong resistance could emerge from 1.4248 (2021 high) to limit upside. Sustained break of 55 W EMA (now at 1.3173) will argue that a medium term top has already formed and bring deeper fall back to 1.2099.
Sterling Supported by Symbolic GDP Growth, Franc Under Pressure
Sterling traded slightly firmer as one of the day’s top performers. The modest 0.1% mom GDP growth in August confirmed that the UK economy continues to grind forward. While small, the uptick carries symbolic weight, reinforcing the notion that Britain’s slowdown is stabilizing heading into the final quarter of the year.
Markets are still divided over whether another rate cut is on the table for BoE's November 6 decision. Inflation data in the coming weeks will be pivotal in shaping expectations. Another key variable is the outcome of the Chancellor’s upcoming budget on November 26, which could alter the BoE’s policy calculus. Given the uncertainty, a “wait-and-see” approach at the November meeting is plausible, allowing policymakers to assess the fiscal backdrop before committing to the next step.
Meanwhile, Swiss Franc weakened after Bern lowered the country's 2026 growth forecast to 0.9%, citing U.S. tariffs as a “heavy burden” on its manufacturing and export sectors. The downgrade comes after Switzerland failed to secure a tariff exemption from Washington, leaving its goods subject to 39% duties—the steepest country-specific rate imposed under the Trump administration.
Trade headwinds have magnified downside risks for Switzerland’s export-reliant economy, where pharmaceuticals, machinery, and precision instruments dominate shipments abroad. sustained tariff exposure could dampen business confidence and delay investment decisions well into next year.
For the week so far, Sterling leads the major currencies, followed by the Aussie, which recovered despite soft labor data that boosted odds of a November RBA cut. Euro ranks third, supported by calmer political conditions in France. At the weaker end, Loonie, Dollar, and Yen lag, while Kiwi and Swiss Franc are trading in the middle of the pack.
In Europe, at the time of writing, FTSE is down -0.22%. DAX is up 0.15%. CAC is up 0.98%. UK 10-year yield is down -0.025 at 4.525. Germany 10-year yield is up 0.003 at 2.578. Earlier in Asia, Nikkei rose 1.27%. Hong Kong HSI fell -0.09%. China Shanghai SSE rose 0.10%. Singapore Strait Times fell -0.28%. Japan 10-year JGB yield rose 0.001 to 1.657.
Fed’s Waller favors cautious 25bp cuts amid weak hiring, uncertain outlook
Fed Governor Christopher Waller told Bloomberg that even without the official employment data, the available evidence points to a clear slowdown in hiring across the U.S. economy. He noted that private and survey-based indicators have been consistent in signaling weaker labor demand, reinforcing the view that the job market is losing momentum.
Waller argued that this backdrop supports the case for the Fed to continue with measured 25bps rate cuts, emphasizing caution amid high uncertainty.
“We don’t know which way this is going to break,” he said. “If the labor market rebounds, there is less pressure to cut rates—you don’t want to make a mistake.”
Fed’s Miran backs 50bp cut, warns trade war add to downside growth risks
Fed Governor Stephen Miran said today that he would support a 50bps rate cut at the upcoming policy meeting, arguing that monetary policy remains too restrictive given the heightened risks surrounding U.S.–China trade tensions.
Speaking to Fox Business, Miran said that the escalation in trade uncertainty adds downside risks to growth and that the Fed must act preemptively to cushion the economy.
“If monetary policy stays as restrictive as it is, and you have a shock like this hit the economy, it does materially increase the negative consequences of that shock,” he warned.
Miran added that the outlook for next year’s growth will depend heavily on whether trade risks are “realized or defused” in the weeks ahead.
Eurozone trade surplus narrows, as exports to the US down -22.2% yoy
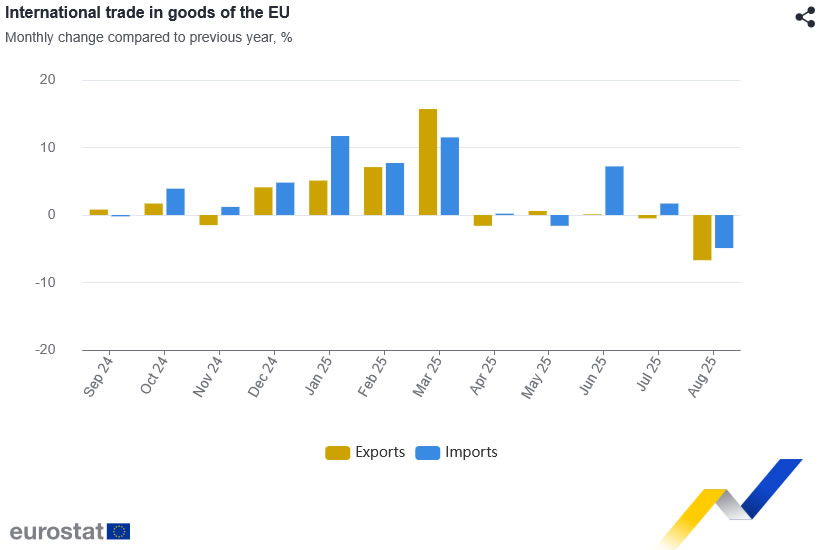
The Eurozone recorded a EUR 1.0B surplus in trade in goods with the rest of the world, down from EUR 3.0B a year earlier. Exports fell -4.7% yoy to EUR 205.9B, while imports declined -3.8% yoy to EUR 204.9B.
At the broader EU level, the picture was even weaker. The EU recorded a EUR- 5.8B deficit in August, widening from EUR -2.4B in the same month last year, as exports dropped -6.7% yoy and imports fell -4.9% yoy.
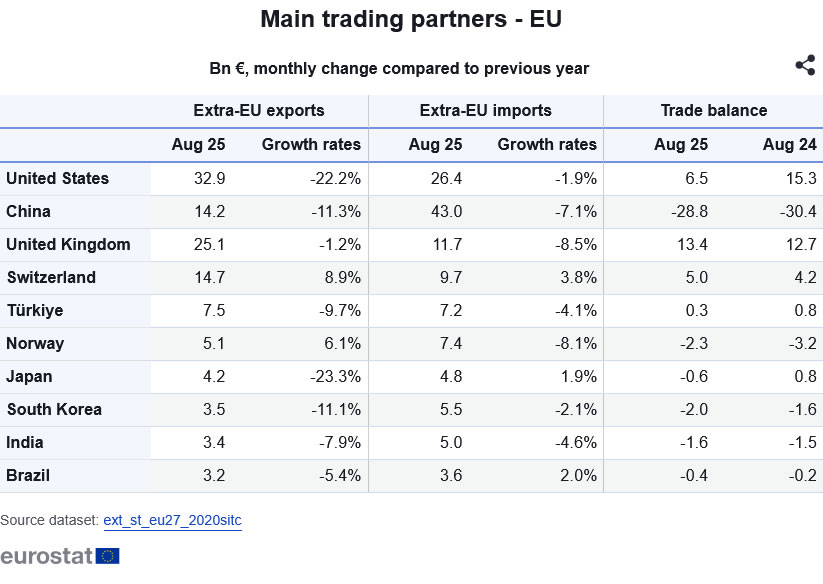
Looking at bilateral flows, EU's exports to the US plunged -22.2% yoy, while imports from the U.S. dipped just -1.9% yoy, reducing the EU’s trade surplus to EUR 6.5B from EUR 15.3B a year earlier.
Trade with China also weakened, with exports down -11.3% yoy and imports falling -7.1% yoy, though the EUR -28.8B deficit narrowed slightly.
In contrast, trade with the UK remained relatively resilient—exports edged only -1.2% yoy lower, while imports dropped -8.5% yoy, leaving the EU’s surplus with the UK relatively steady at EUR 13.4B.
UK GDP expands 0.1% mom in August, growth patchy across sectors
The UK economy expanded modestly by 0.1% mom in August, in line with expectations, suggesting that activity remains subdued but stable. Industrial production rose 0.4% mom, helping to offset flat performance in the dominant services sector and a -0.3% mom contraction in construction.
On a three-month basis, GDP grew 0.3% in the period to August compared with the previous three months. The details were uneven: services output rose 0.4%, maintaining its role as the primary driver of growth, while production slipped -0.3% and construction gained -0.3%.
Australia jobless rate rises to 4.5%, highest since 2021
Australia’s labor market showed further signs of cooling in September as hiring momentum eased and the jobless rate climbed from 4.2% to 4.5%, the highest since November 2021. The unemployment rate figure exceeded expectations for 4.3%, driven by a 5.2% jump in the number of unemployed persons, equivalent to an increase of 33.9k people.
Total employment rose by 14.9k, undershooting forecasts of 20.0k. The breakdown showed full-time positions up 8.7k and part-time jobs rising 6.3k. Despite slower hiring, the participation rate edged up by 0.1% to 67.0%, indicating that more Australians are re-entering the labor force even as job creation moderates.
At the same time, monthly hours worked increased 0.5% mom, showing that those employed are still working longer hours on average, cushioning some of the weakness in headline employment figures.
RBA’s Bullock warns markets too optimistic, says trade war effects to linger for years
RBA Governor Michele Bullock cautioned today that financial markets may be underestimating global economic risks, warning that investors have taken a “Goldilocks view” of the outlook. Speaking at a forum, Bullock said markets appear to be “discounting the bad macroeconomic risks,” even as trade and geopolitical tensions threaten to slow global growth. She emphasized that the effects of the trade war will “play out over the next few years,” as tariffs are maintained or expanded by multiple countries, dampening trade and investment.
Bullock said the unpredictability of government responses to tariffs—rather than the general uncertainty surrounding them—was the biggest risk to investors’ confidence. “You just don’t know what might come out tomorrow morning,” she said, noting that sudden policy shifts could easily destabilize the currently “rosy” market outlook.
Addressing China’s economic struggles directly, Bullock pointed to the country’s ongoing deflationary pressures and excess industrial capacity, saying that “competing provinces” are cutting prices to maintain output, effectively exporting deflation to the rest of the world. She suggested that Beijing could do more to stimulate domestic consumption to rebalance its economy, adding that China’s “massive population” provides untapped potential demand if policies shift toward supporting households.
BoJ’s Tamura urges faster move toward neutral rate, warns against falling behind the curve
BoJ board member Naoki Tamura, one of the central bank’s most hawkish policymakers, who voted for a 25bps hike at the September meeting, reiterated his call for a faster shift toward a neutral policy stance. In a speech today, he said the current stance remains “far away from the neutral interest rate” the impact of prior rate hikes on the domestic economy has been “extremely limited.” He warned that keeping policy too loose for too long could invite future instability.
Tamura explained that his dissent was based on “risks to prices being skewed to the upside”. He now sees it as “more likely that the price stability target will be achieved earlier than expected,” helped by the recent Japan–U.S. tariff policy agreement, which he believes will support growth while keeping price momentum intact.
He acknowledged that U.S. tariff measures could weigh on the American economy, with spillover effects on Japan. But he emphasized “It is important from a risk management perspective for the Bank to move closer to a neutral monetary policy stance”.
Delaying further moves, he warned, could lead to Japan “falling behind the curve,” forcing abrupt rate hikes later that might “inflict significant damage” on the economy.
GBP/USD Mid-Day Outlook
Daily Pivots: (S1) 1.3344; (P) 1.3376; (R1) 1.3435; More...
Intraday bias in GBP/USD remains neutral first. Fall from 1.3725 could still extend lower. But even in that case, Strong support is expected from 1.3140 cluster (38.2% retracement of 1.2099 to 1.3787 at 1.3142) to complete the corrective pattern from 1.3787. On the upside, break of 1.3526 will bring stronger rally back to 1.3725/87 resistance zone.
In the bigger picture, rise from 1.0351 (2022 low) is still seen as a corrective move. Further rally could be seen to 61.8% projection of 1.0351 to 1.3433 (2024 high) from 1.2099 (2025 low) at 1.4004. But strong resistance could emerge from 1.4248 (2021 high) to limit upside. Sustained break of 55 W EMA (now at 1.3173) will argue that a medium term top has already formed and bring deeper fall back to 1.2099.
Fed’s Waller favors cautious 25bp cuts amid weak hiring, uncertain outlook
Fed Governor Christopher Waller told Bloomberg that even without the official employment data, the available evidence points to a clear slowdown in hiring across the U.S. economy. He noted that private and survey-based indicators have been consistent in signaling weaker labor demand, reinforcing the view that the job market is losing momentum.
Waller argued that this backdrop supports the case for the Fed to continue with measured 25bps rate cuts, emphasizing caution amid high uncertainty.
“We don’t know which way this is going to break,” he said. “If the labor market rebounds, there is less pressure to cut rates—you don’t want to make a mistake.”
Fed’s Miran backs 50bp cut, warns trade war add to downside growth risks
Fed Governor Stephen Miran said today that he would support a 50bps rate cut at the upcoming policy meeting, arguing that monetary policy remains too restrictive given the heightened risks surrounding U.S.–China trade tensions.
Speaking to Fox Business, Miran said that the escalation in trade uncertainty adds downside risks to growth and that the Fed must act preemptively to cushion the economy.
“If monetary policy stays as restrictive as it is, and you have a shock like this hit the economy, it does materially increase the negative consequences of that shock,” he warned.
Miran added that the outlook for next year’s growth will depend heavily on whether trade risks are “realized or defused” in the weeks ahead.
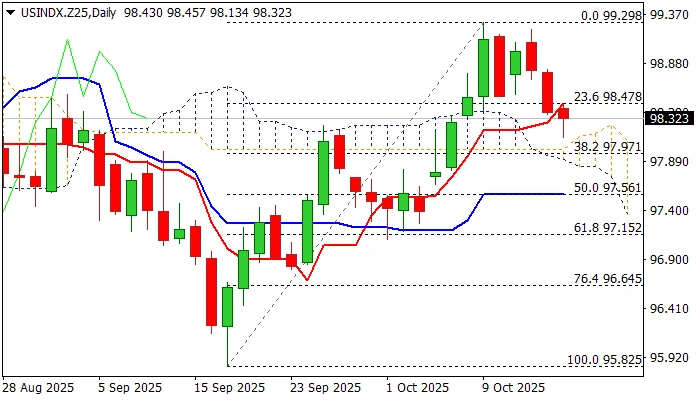
Dollar Index: Pullback Faces Headwinds from Important Technical Support
The dollar holds in red for the third consecutive day, weighed by escalation of US-China trade conflict and recent dovish remarks from Fed chair Powell that add to strong expectations for two Fed rate cuts by the end of the year.
Pullback from a multiweek highs (99.22/29) where larger bulls from new 2025 low (95.82) got trapped at Fibo 76.4% of 100.04/95.82 descend, faced headwinds from 98.00 support zone (top of thickening daily Ichimoku cloud/Fibo 38.2% of 95.82/99.29 upleg).
Reaction at these points is likely to define near-term direction, with sustained break lower to sideline bulls and open way for deeper correction and expose targets at 97.56 (50% retracement/daily Kijun-sen) and 97.15 (Fibo 61.8%) in extension.
Conversely, failure at 98.00 would generate initial signal that pullback is running out of steam, though bounce and close above daily Tenkan-sen (98.48) will be a minimum requirement to generate initial reversal signal and point to scenario of healthy correction before broader bulls regain control.
The second scenario is supported by predominantly bullish technical picture on daily chart, however, dollar’s action will also depend on behavior of the largest index components – Euro and Japanese yen.
The single currency holds positive stance and remains mainly intact from deepening political crisis in France, while USDJPY started to gain traction after a two-day drop.
Res: 98.48; 98.82; 99.00; 99.29.
Sup: 98.00; 97.79; 97.56; 97.15.
Crypto Market Tests the Strength of Three-Month Support
Market Overview
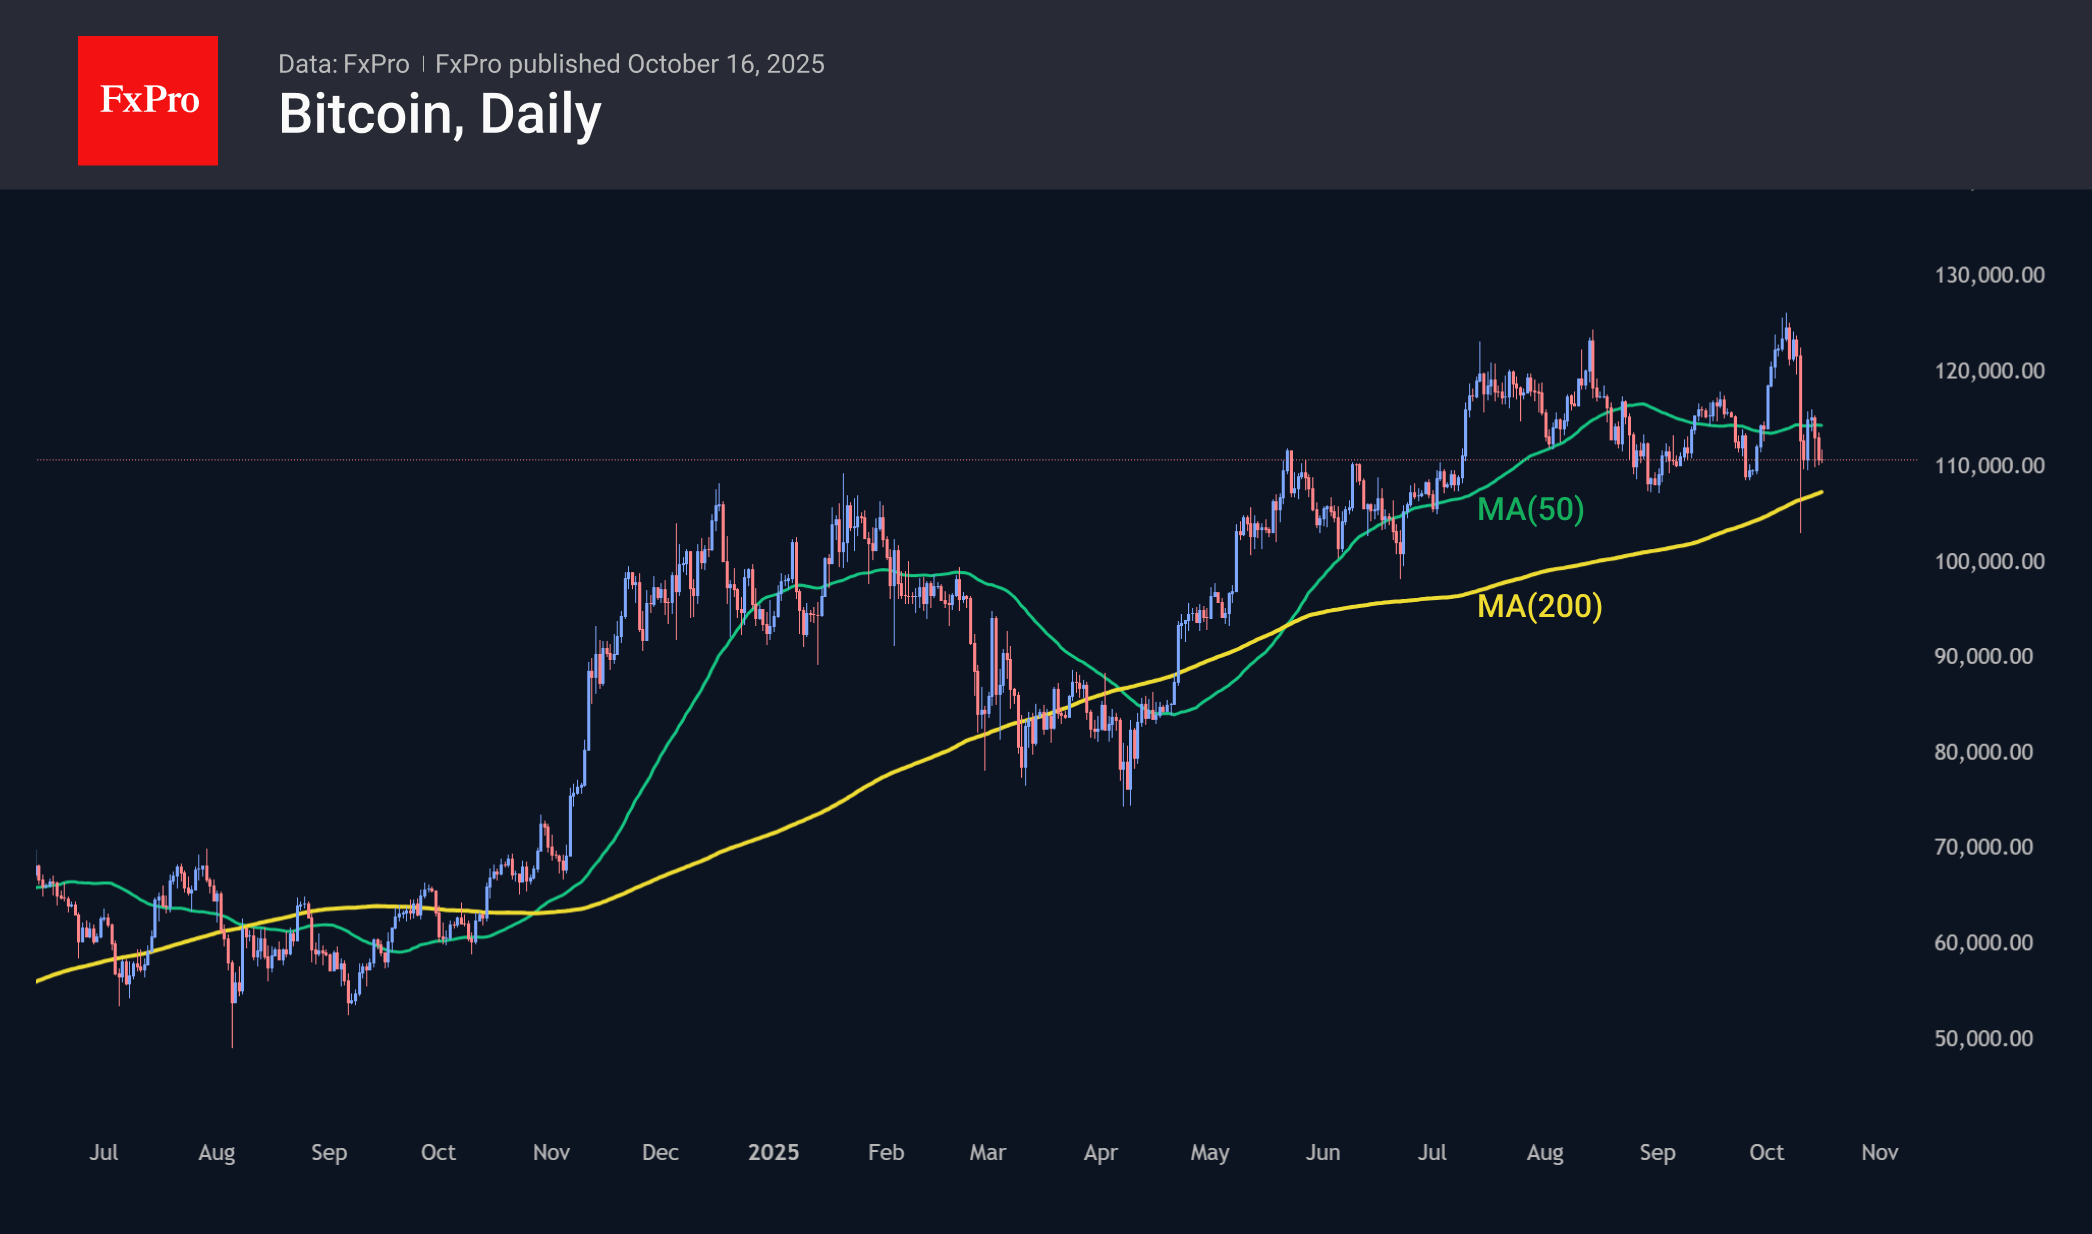
The crypto market capitalisation lost 2.3% from the previous day’s level to $3.75 trillion. The rebound on Sunday and Monday did not develop, and the 50-day moving average acted as local resistance. The market is again testing the strength of 3-month support near current levels. Such persistence from the bears suggests that the next stage will be a test of the 200-day average, which passes through $3.5 trillion. The market broke above this line in May; touching it at the end of July triggered strong buying.
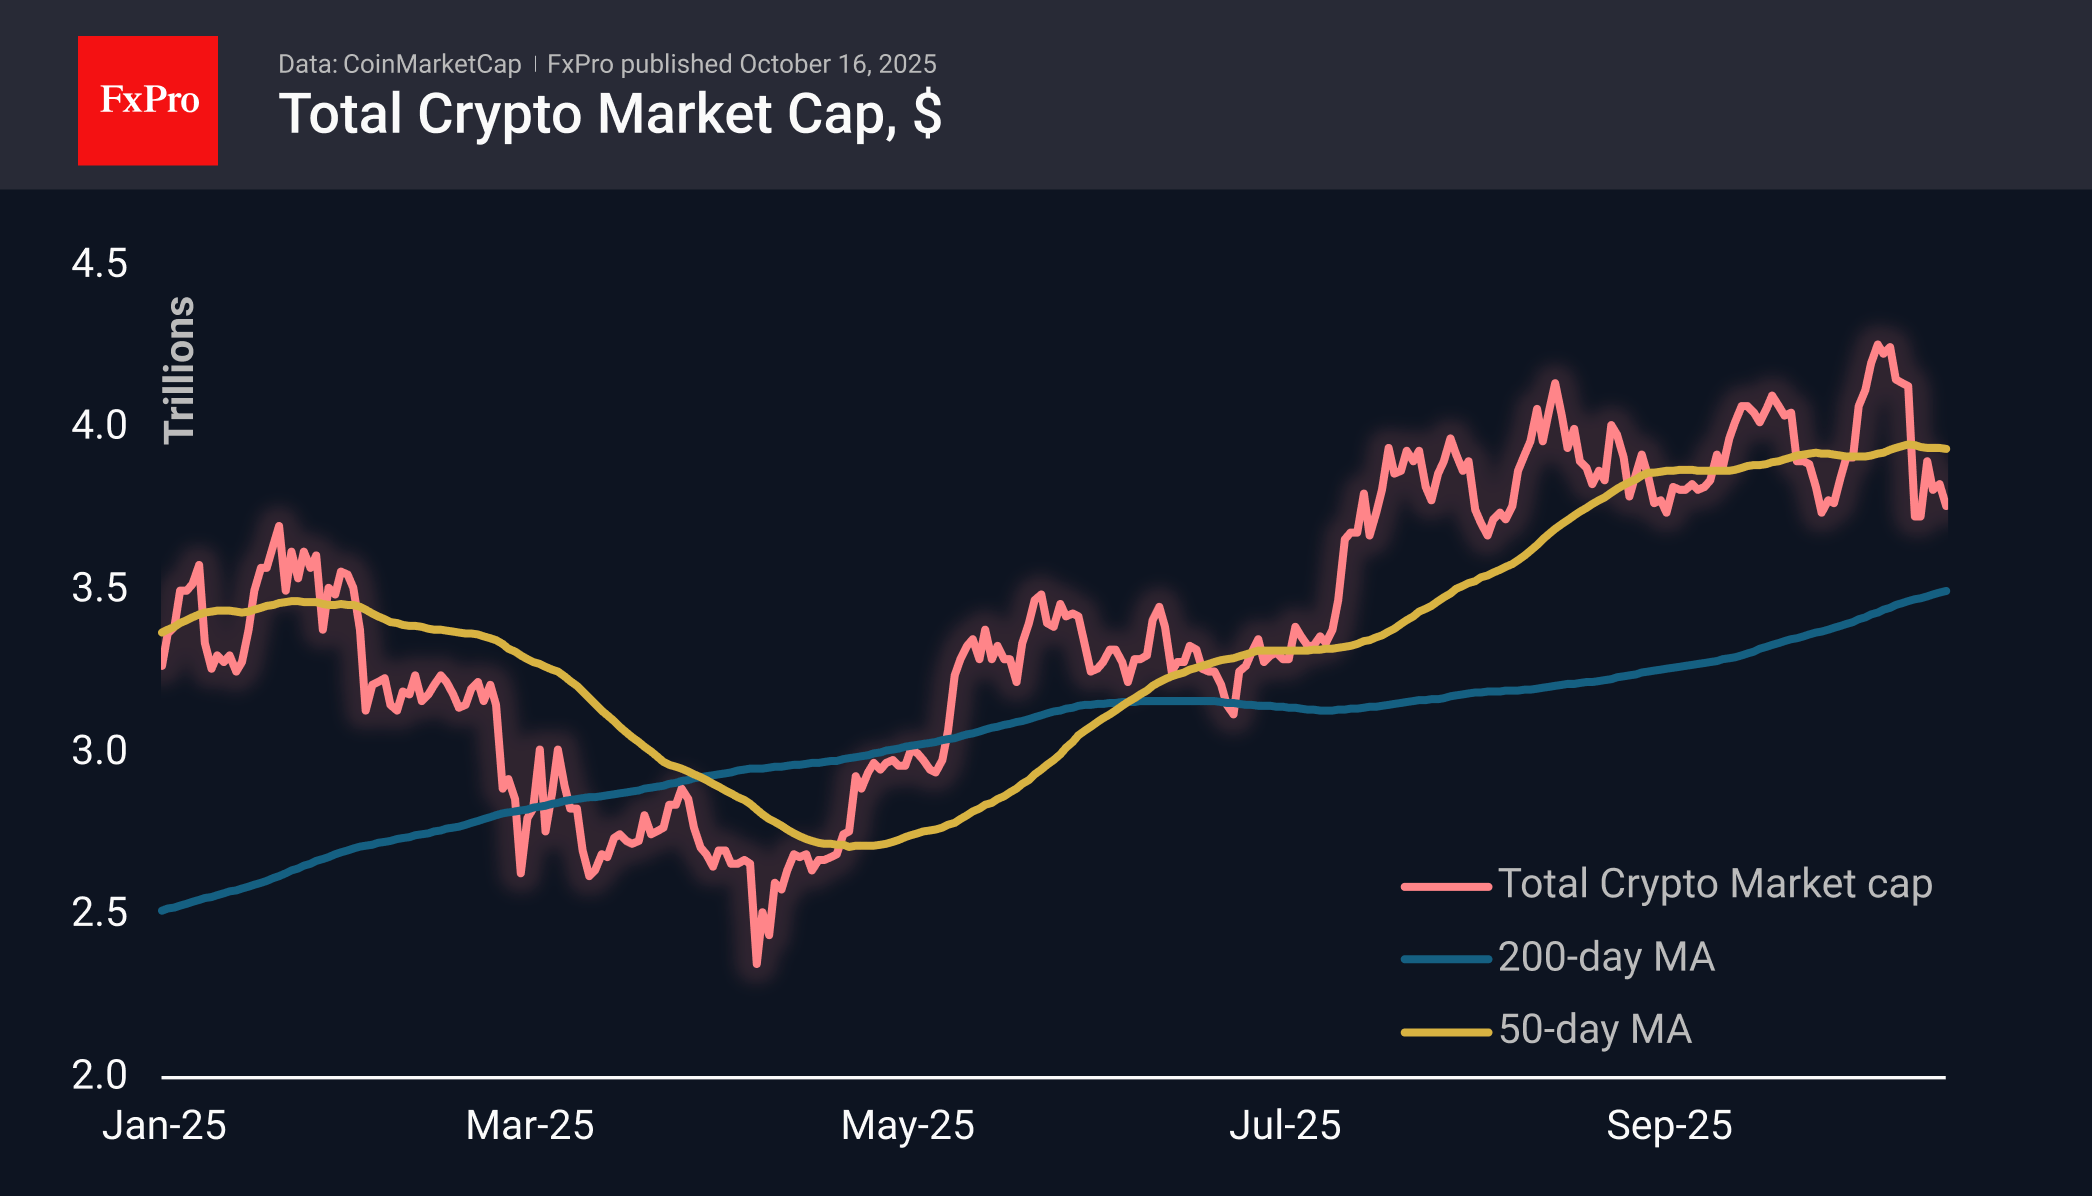
Bitcoin is trading above $110K, as is the entire market, approaching the support level of the last three months. Several facts reinforce the importance of the current moment: BTC is trading near a crucial milestone, which was also the resistance area in the first half of the year, and the 200-day moving average is approaching this level, currently at $107.4K but heading towards $109K by the end of the month.
News Background
Bitcoin has entered a ‘speculative phase,’ and new major players are taking control of it, according to XWIN Research. This means that long-term investors are taking profits, and less experienced market participants are taking their place.
An opportunity to buy has emerged in the crypto market, said former BitMEX CEO Arthur Hayes, citing Fed Chair Jerome Powell’s comments that the quantitative tightening programme may soon be completed.
K33 also sees current levels attractive for building spot BTC positions, as ‘leverage has been aggressively reduced.’ The options market points to further growth in BTC to the $115K-$130K range, Glassnode notes.
Trading veteran Peter Brandt presented two scenarios. According to the first, Bitcoin could renew its historic high after the current correction ends. Otherwise, a drop to $50K-60K is possible.
According to Bitwise, forty-eight new companies began accumulating Bitcoin reserves in the third quarter. In three months, the number of Bitcoin treasuries grew to 172 with combined reserves of over 1 million BTC (more than $110 billion).
About 40% of the total volume of Ethereum has been removed from active circulation, which is a record high in history, notes analyst Crypto Gucci. BitMine CEO Tom Lee confirmed his forecast for ETH to grow to $10,000 by the end of this year.
Eurozone trade surplus narrows, as exports to the US down -22.2% yoy
The Eurozone recorded a EUR 1.0B surplus in trade in goods with the rest of the world, down from EUR 3.0B a year earlier. Exports fell -4.7% yoy to EUR 205.9B, while imports declined -3.8% yoy to EUR 204.9B.
At the broader EU level, the picture was even weaker. The EU recorded a EUR- 5.8B deficit in August, widening from EUR -2.4B in the same month last year, as exports dropped -6.7% yoy and imports fell -4.9% yoy.
Looking at bilateral flows, EU's exports to the US plunged -22.2% yoy, while imports from the U.S. dipped just -1.9% yoy, reducing the EU’s trade surplus to EUR 6.5B from EUR 15.3B a year earlier.
Trade with China also weakened, with exports down -11.3% yoy and imports falling -7.1% yoy, though the EUR -28.8B deficit narrowed slightly.
In contrast, trade with the UK remained relatively resilient—exports edged only -1.2% yoy lower, while imports dropped -8.5% yoy, leaving the EU’s surplus with the UK relatively steady at EUR 13.4B.
USD/CHF Falls to Two-Week Low
This morning, the USD/CHF exchange rate slipped below 0.7944 for the first time since 1 October, as demand for safe-haven assets intensified — a trend also reflected in yesterday’s record gold price above $4,200.
The traditionally stable Swiss franc is strengthening amid rising global uncertainty and risk aversion:
→ In Japan, the upcoming prime ministerial election could significantly impact monetary policy, while France faces ongoing political turmoil.
→ In the United States, the government shutdown continues, and traders are closely watching developments around a potential trade deal with China, possibly to be discussed during an expected meeting between the two countries’ leaders.
Technical Analysis of the USD/CHF Chart
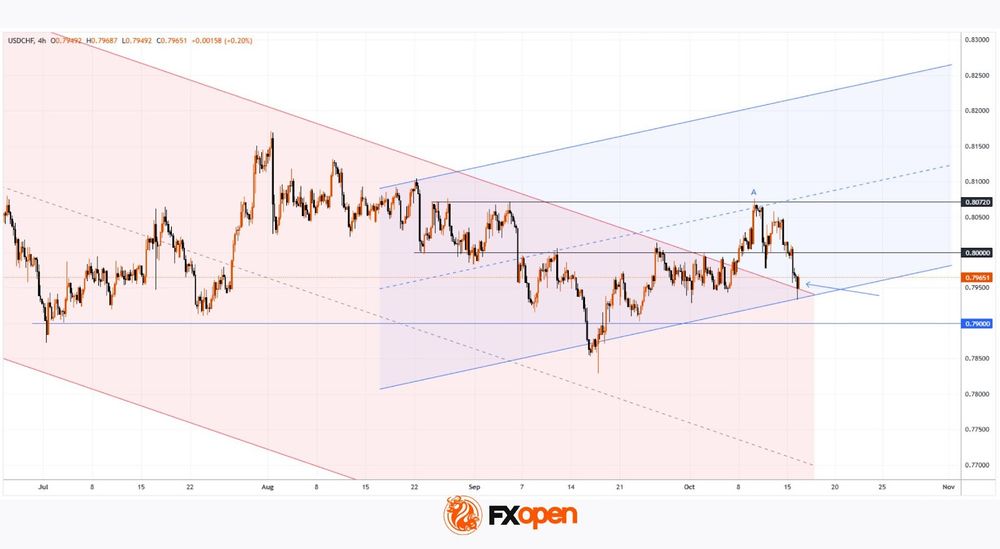
As noted in our 25 September analysis, the Swiss franc has appreciated through 2025 amid elevated geopolitical and macroeconomic risks, forming a downward channel on the USD/CHF chart (shown in red).
We also highlighted:
→ the possibility of a trend reversal around the 0.7900 support area;
→ potential breakout targets (shown in blue).
Since then, the bulls have indeed made progress, driving the price up towards point A and:
→ breaking above the red channel’s upper boundary;
→ overcoming the psychological 0.8000 level.
However, that progress has not been sustained. Among the bearish signals:
→ the median line of the blue channel acted as resistance;
→ the brief move above local highs around 0.8072 resembles a bearish liquidity grab.
From the bullish perspective, USD/CHF has now retreated into a zone that could act as support:
→ the upper boundary of the red channel;
→ the lower boundary of the blue channel.
The arrow highlights signs of a bullish engulfing pattern, suggesting that buyers may be using these support zones to stage a rebound within the blue channel. The 0.8000 psychological mark could serve as the first key test of their resolve.
Trade over 50 forex markets 24 hours a day with FXOpen. Take advantage of low commissions, deep liquidity, and spreads from 0.0 pips. Open your FXOpen account now or learn more about trading forex with FXOpen.
This article represents the opinion of the Companies operating under the FXOpen brand only. It is not to be construed as an offer, solicitation, or recommendation with respect to products and services provided by the Companies operating under the FXOpen brand, nor is it to be considered financial advice.
Australia September Labour Force: Unemployment Lifts
Employment: +14.9k (from –11.9k). Unemployment Rate: 4.5% (from 4.3%). Participation Rate: 67.0% (from 66.9%).
- Unemployment rate jumps to a new cycle high of 4.5%, driven by stronger-than-expected labour force participation.
- Employment growth slips to a below-average pace of 1.5%yr amid an underlying slowdown in ‘care economy’ jobs growth.
- Today’s data lends weight to our view that there is still a good chance the RBA will cut rates in November; Q3 CPI data (due October 29) will be the decider.
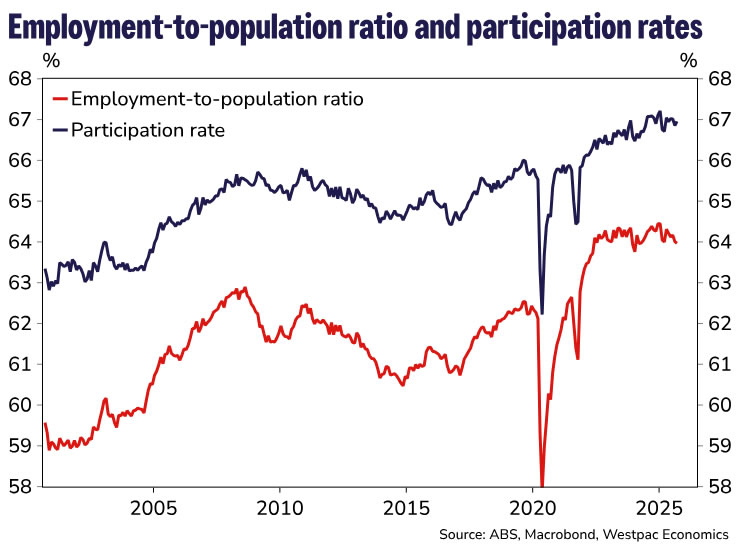
Employment rose by +14.9k (+0.1%) in September, virtually spot on Westpac’s forecast (+15k) but below the market consensus (+20k). On a three-month average basis, employment growth has now slowed to 1.5%yr, down from 2.2%yr six months ago and now well below the long-run average pace of 1.9%yr. This is currently weaker than population growth, seeing the employment-to-population continue to track a downtrend, currently at 64.0% in September.
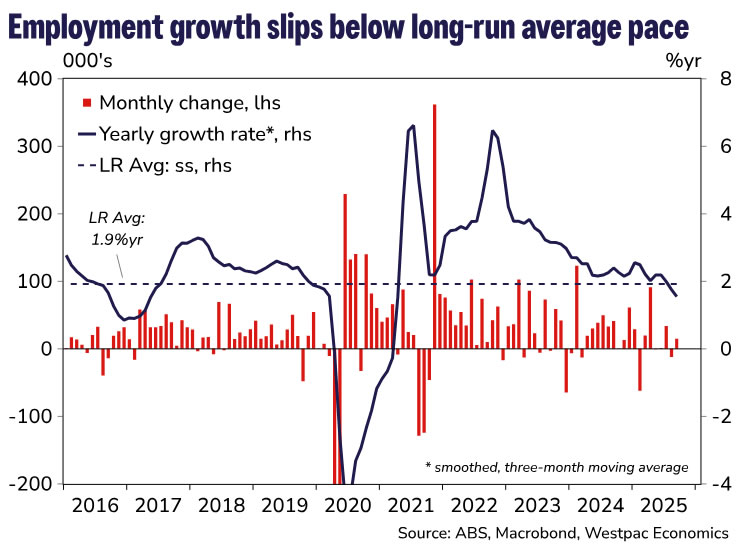
Underlying this slowdown in employment growth is a rebalancing across industries, with the contribution from the job-intensive ‘care economy’ falling while the market sector stages a gradual and ‘patchy’ recovery. We will not have the complete detail on how the industry mix fared for the September quarter until the next instalment of the Labour Account (due 5 December), but we suspect a continuation of these broad trends.
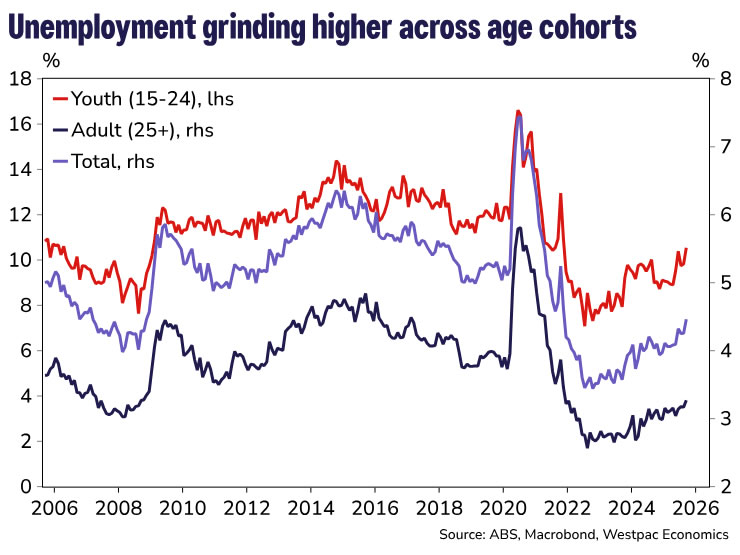
What really caught the market’s attention, though, was the jump up in the unemployment rate from an upwardly revised 4.3% in August to 4.5% in September, the highest recorded so far in this cycle (though at 4.46%, it was close to the rounding barrier). It is also worth noting that youth unemployment also rose +0.8ppts to 10.5%, a new cycle high as well. This echoes the large increase back in June, when we flagged that sharp jumps in cyclically sensitive youth unemployment often precede a grind higher in total unemployment. We are now starting to see this unfold, with ‘adult’ unemployment also moving to a cycle high of 3.3%.
Higher participation, combined with softer hiring, opened up a bit more labour market slack in September. The participation rate lifted to 67.0% from 66.9% (revised up from 66.8%), in line with the year-average to date. There are competing forces underlying the trend for participation – easing cost-of-living pressures and cooling labour demand is driving a cyclical unwind, while demographic factors still look to be driving a structural increase in labour supply. The mix may continue to see ‘bumpy’ moves month-to-month – there is a risk that October could see a partial unwind, which may see the unemployment rate round back down, but we are still confident in our base case that unemployment will continue to trend higher for the rest of the year.
Another part of the data we are closely watching is underemployment, which largely captures part-time individuals who desire more hours in this part of the survey (although there are broader ‘analytical’ measures which expand the scope). The underemployment rate ticked up from 5.7% to 5.9% in September, though it has tracked a gradual downtrend over the past year. We suspect that this can largely be explained by the pull-back in part-time employment growth from its peak of around 6%yr to 2%yr currently, meaning there are relatively fewer part-time workers entering the workforce and seeking extra hours of work. The easing in part-time employment growth has slowed somewhat but there are no clear-cut signs that the downtrend is over just yet.
Conclusion
Today’s data is yet another instalment in a series of readings that clearly indicate the labour market is softening again. Employment growth is already tracking a slightly weaker pace than the RBA had pencilled in for Dec-25 (1.5%yr vs 1.6%yr), and the unemployment rate looks likely to overshoot the RBA’s flat-as-a-pancake projection of 4.3% through to Dec-27. This is a clear challenge to the RBA’s most recent assessments, the Monetary Policy Board describing the labour market as “broadly steady” and “a little tight” at its October meeting.
We are unlikely to see the MPB suddenly embrace a more downbeat view on the labour market – especially given the RBA’s ‘sticky’ NAIRU assumption that is higher than that of most market economists. Today’s data could see the language start to pivot, however. The market reaction has lent weight to our view that a 25bp cut in November is a good chance. Swaps markets now pricing in roughly a 75% chance of a cut versus 40% prior to the data. Still, the Q3 CPI (due 29 October) will be the ultimate deciding factor.
Gold Extends Its Rally as Safe-Haven Demand Builds
The gold market continues to attract strong inflows, underscoring its appeal as a premier defensive asset. Growing anxieties over a potential US government shutdown are fuelling investor nervousness, with Congress once again at a budget impasse. This political deadlock is prompting a flight to safety, benefiting traditional havens like gold and the Swiss franc.
Further pressure on the US dollar stems from the escalation of the trade war, as Donald Trump's rhetoric grows increasingly assertive. Proposals for higher tariffs, a overhaul of import flows, and fresh threats against China are being factored into market expectations for future inflation and Federal Reserve policy.
Amid this backdrop, the yield on 10-year US Treasuries has dipped below 4.2%, while the DXY dollar index struggles for direction. Markets are progressively pricing in a more dovish Fed stance by year-end, creating a solid fundamental base for gold.
Investors are increasingly turning to XAU/USD as a hedge against mounting political and economic uncertainty, viewing the metal as a reliable insurance policy.
Technical Analysis: XAU/USD
H4 Chart:
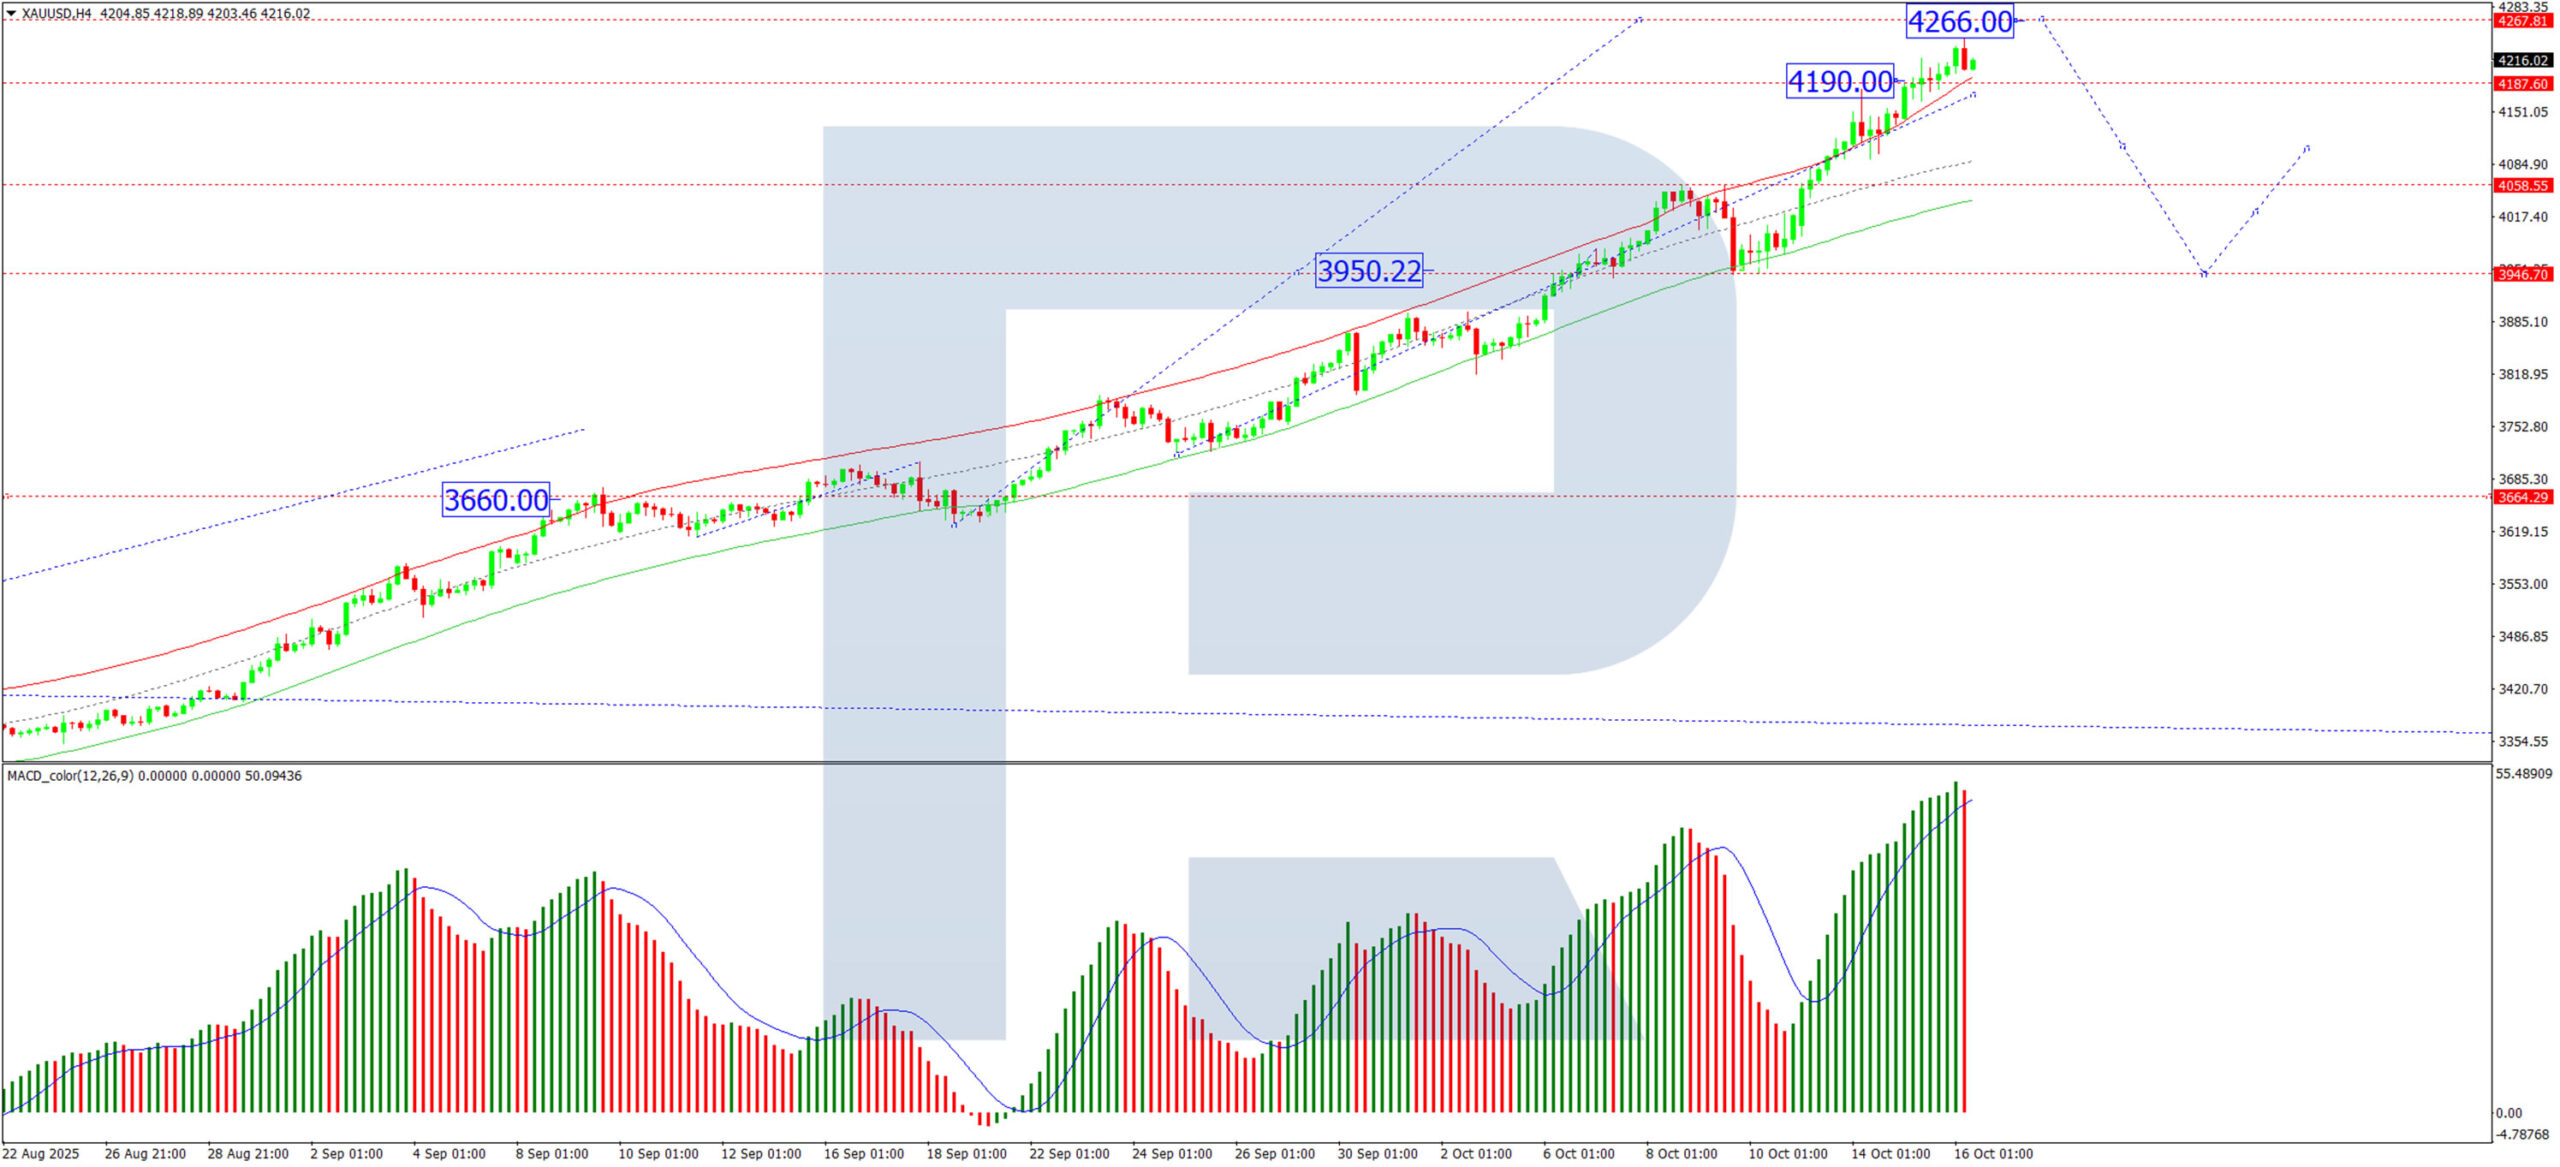
On the H4 chart, gold found strong support at 4,190 USD and is advancing towards an initial target of 4,266 USD. Upon reaching this level, a corrective pullback towards 4,100 USD is anticipated. Provided the broader bullish structure holds, this could establish a foundation for a subsequent upward wave, with potential targets at 4,300 – 4,400 USD. The MACD indicator corroborates this constructive outlook. Its signal line is firmly above zero and trending higher, confirming the current dominance of buyers.
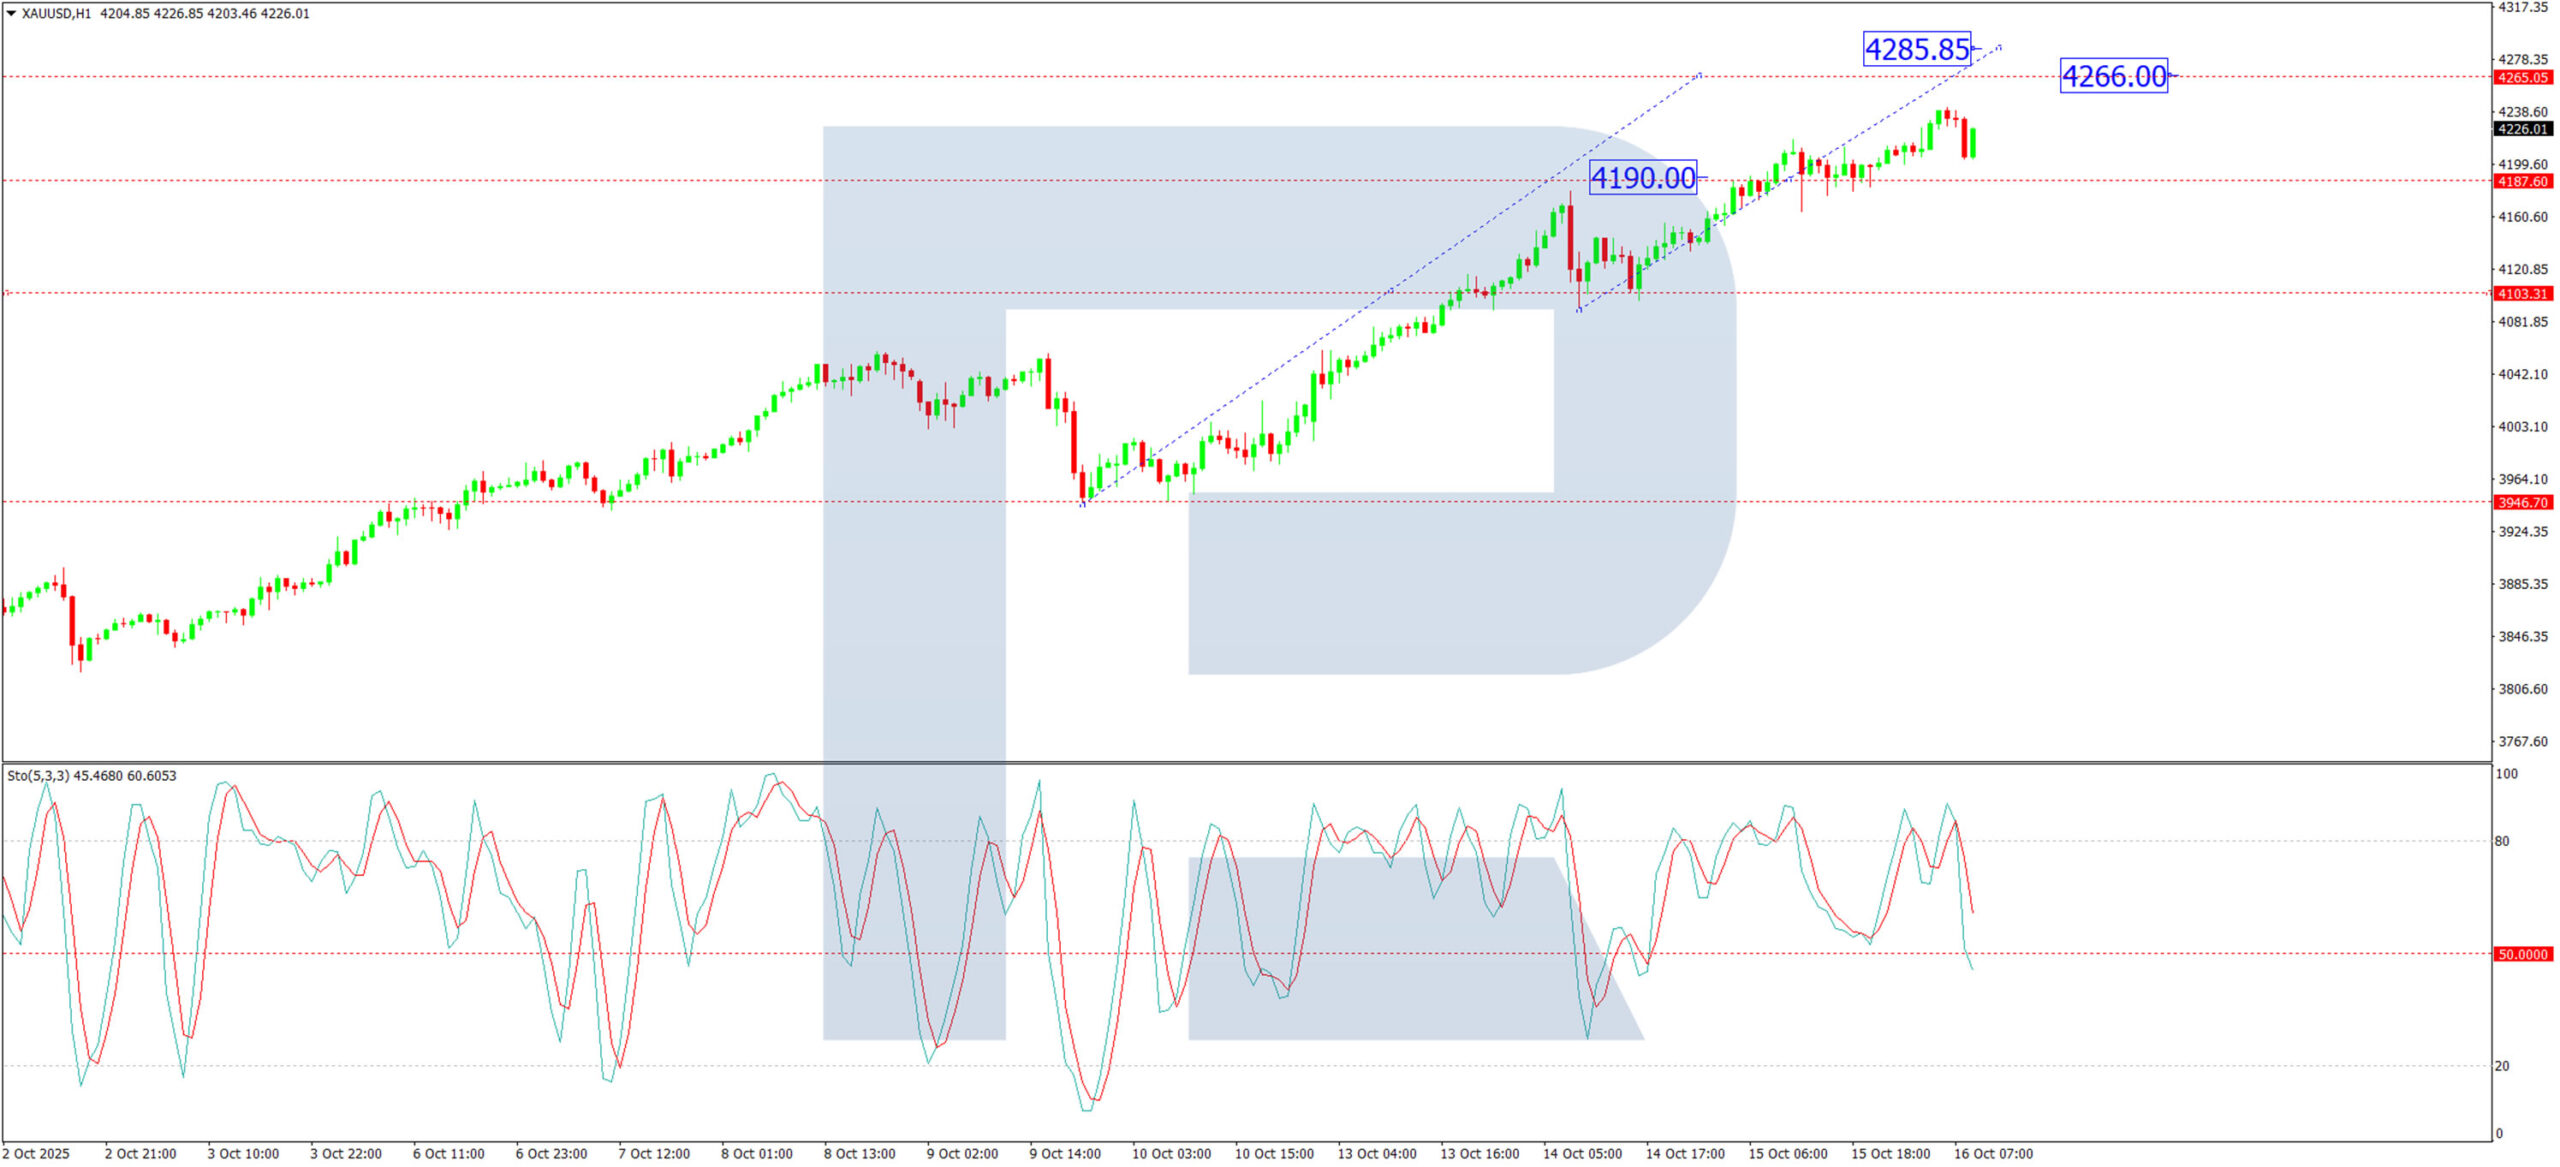
H1 Chart:
On the H1 chart, the instrument decisively broke above the 4,190 USD resistance, consolidating around this level before extending its gains towards 4,266 USD. A period of profit-taking is expected here, likely triggering a retracement to retest 4,190 USD as support. A successful hold above this level could signal a resumption of the uptrend, targeting 4,300 – 4,400 USD. The Stochastic oscillator aligns with this view, with its signal line positioned above 50 and advancing towards 80, reflecting sustained bullish momentum.
Conclusion
Gold's rally is being driven by a powerful confluence of political uncertainty, trade war escalation, and shifting monetary policy expectations. While a short-term technical correction is likely as profits are taken, the fundamental and technical backdrop remains decidedly bullish.