Sample Category Title
Greene says BoE should skip some rounds of rate cuts to tame inflation
BoE policymaker Megan Greene sounded a hawkish note today, warning that interest rates may need to stay elevated for an extended period to ensure inflation is fully subdued. She said monetary policy is “less restrictive than it had been,” a worrying sign given that price growth has shown renewed momentum over the past year.
While Greene believes the disinflation process “remains intact,” she expressed concern that it is losing pace, adding that inflation’s earlier spike above 11% has likely reshaped consumer and business behavior.
Ahead of Tuesday’s key U.K. wage and jobs data, Greene said the labor market appears to be stabilizing after a mild slowdown, having avoided the sharp deterioration some had feared earlier in the year. That resilience, combined with lingering inflation pressures, supports the case for patience before cutting rates again.
To ensure inflation is fully defeated, Greene argued that the Bank Rate should be “more restrictive than the market curve”, but without undermining the BoE’s credibility by alternating between hikes and cuts. Instead, she said the preferable path would be to keep rates "higher for longer", and "skipping some rounds in terms of rate cuts."
GBP/AUD in focus ahead of key UK, Australia events; Near-term upside bias holds
GBP/AUD will be a pair to watch this week as a string of key economic releases from both the U.K. and Australia promise to inject volatility. There will be RBA meeting minutes and U.K. labor market data on Tuesday, followed by Australian employment and U.K. GDP figures on Thursday. The cross has already shown renewed strength, rebounding firmly after a period of weakness, and traders are positioning for fresh direction from the incoming data.
Australian Dollar endured a setback late last week after the U.S.–China trade war flared up again, sending risk sentiment tumbling. Yet, the currency has stabilized on Monday, suggesting that markets are refocusing on domestic fundamentals rather than external shocks. Attention now turns to whether the RBA’s November policy meeting will bring another rate cut, a decision clouded by conflicting economic signals.
Recent data indicate that Australia’s economy is regaining momentum, supported by stronger consumer spending and rising house prices. However, this recovery has been accompanied by slower employment growth and upside surprises in inflation, leaving the RBA in a delicate position. Policymakers must weigh whether the rebound is sustainable enough to delay further easing, or if lingering labor market slack warrants additional stimulus. Tomorrow’s employment report and the Q3 CPI later in the month could tip the balance either way.
In the U.K., the policy outlook is equally nuanced. The BoE’s Monetary Policy Committee remains split, though the hawkish voices have grown louder in recent weeks. Chief Economist Huw Pill underscored that monetary policy should stay “resolutely focused on price stability,” while MPC member Catherine Mann argued for keeping rates restrictive despite weak consumption, warning that high inflation continues to weigh heavily on households.
Still, policymakers have stressed that their stance will remain data-dependent, placing a spotlight on Tuesday’s labor data—particularly wage growth—as a key input ahead of the next meeting. A firmer set of figures could reinforce the BoE’s cautious approach toward easing, lending further support to Sterling against the Aussie.
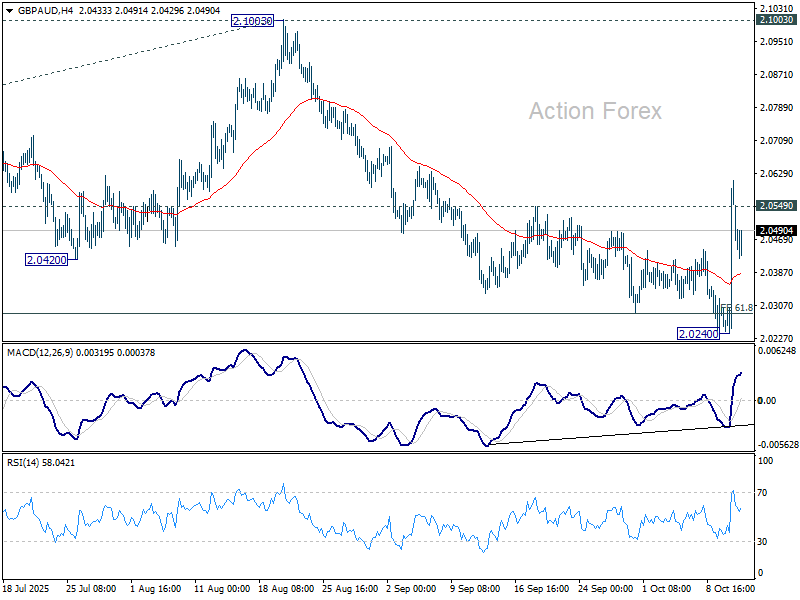
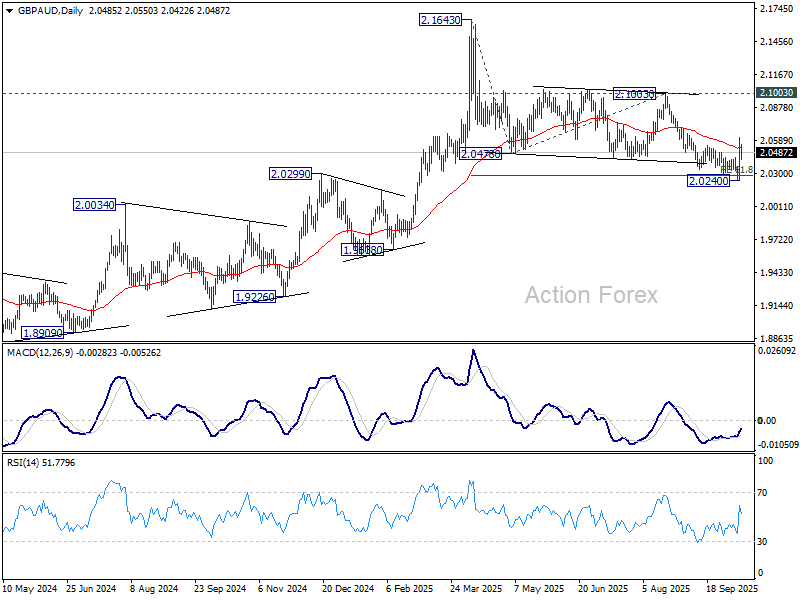
Technically, GBP/AUD's rebound and break of 2.0549 resistance suggests that a short term bottom was already formed at 2.0240, on bullish convergence condition in 4H MACD. It's also possibly that fall from 2.6143 (April high) has completed as a three-wave correction after hitting 61.8% projection of 2.1643 to 2.0478 from 2.1003 at 2.0283. For now, risk will stay mildly on the upside as long as 2.0240 support holds. Sustained trading above 55 D EMA (now at 2.0524) will affirm this bullish case, and target 2.1003 resistance for confirmation.
Bitcoin Regains Ground and Reverses More Than Half of Latest Sharp Fall
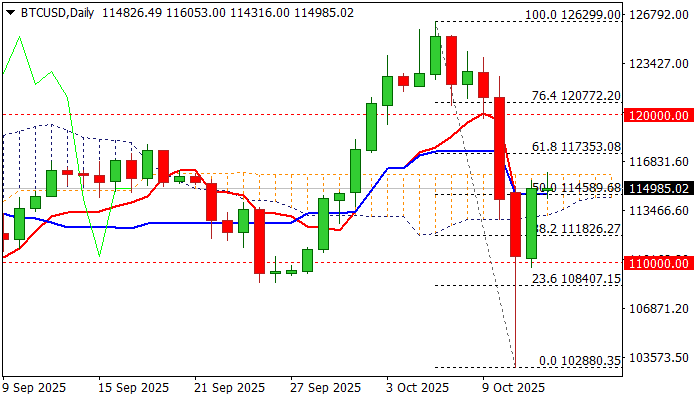
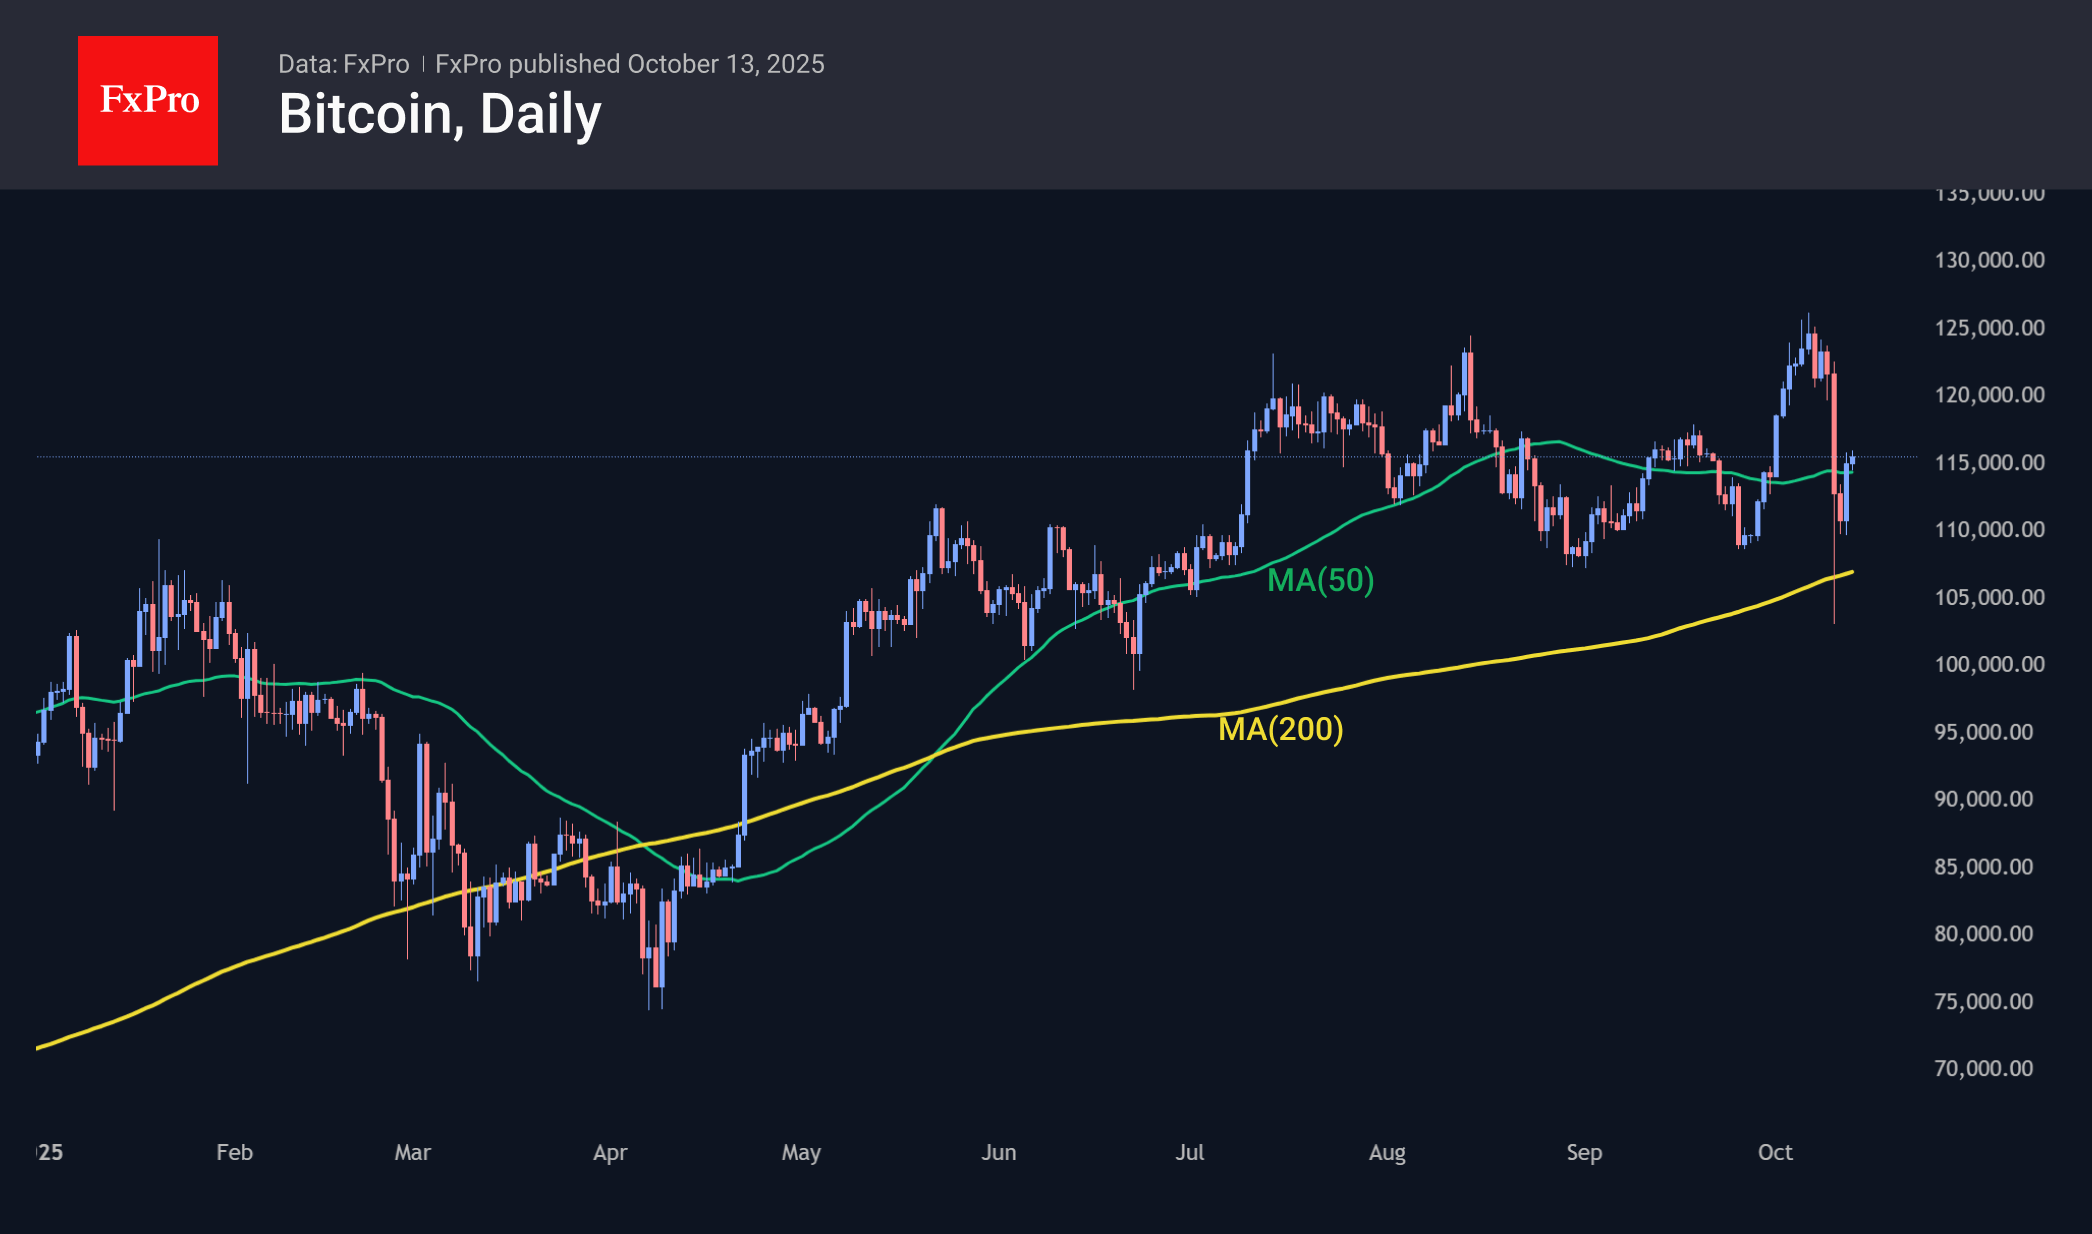
BTCUSD kept firm tone on Monday and attempts to extend recovery from new 3 ½ month low (102880) hit after the biggest drop in 2025 on Friday and Saturday, when bitcoin lost near 10% of its value.
Announcement of President Trump’s plan to raise tariffs on Chinese goods by 100% sparked a sharp sell-off, as bitcoin did not act as digital safe-haven asset, but was sold in risk aversion along with stocks.
Technical picture on daily chart has improved after strong downside rejection on Saturday that left daily candle with very long tail, pointing to strong downside rejection and formation of bear-trap under 200DMA.
Subsequent recovery on Sunday generated another positive signal on completion of bullish engulfing pattern, with fresh extension higher on Monday, probing through daily cloud top (115900).
Today’s close above 55DMA and 50% retracement of 126299/102880 fall (114330/114589 respectively) is needed to keep fresh bulls intact, with close above cloud top to confirm signal and expose targets at 117.353 (Fibo 61.8%) and 120000 (psychological) in extension).
Caution on return and close below daily cloud base (113169).
Res: 116053; 117353; 117980; 120000
Sup: 114589; 113169; 111826; 110000
GBP/USD Dips Again While EUR/GBP Holds Support
GBP/USD failed to climb above 1.3500 and corrected some gains. EUR/GBP started a decent increase and might aim for more gains above 0.8710.
Important Takeaways for GBP/USD and EUR/GBP Analysis Today
- The British Pound is showing bearish signs below the 1.3400 support.
- There is a key bearish trend line forming with resistance near 1.3370 on the hourly chart of GBP/USD at FXOpen.
- EUR/GBP is gaining pace and trading above the 0.8700 handle.
- There is a connecting bullish trend line forming with support at 0.8695 on the hourly chart at FXOpen.
GBP/USD Technical Analysis
On the hourly chart of GBP/USD at FXOpen, the pair failed to stay above the 1.3450 pivot level. As a result, the British Pound started a fresh decline below 1.3420 against the US Dollar.
There was a clear move below 1.3400 and the 50-hour simple moving average. The bears pushed the pair below 1.3300. Finally, there was a spike below the 1.3280 support zone. A low was formed near 1.3261 and the pair is now consolidating losses.
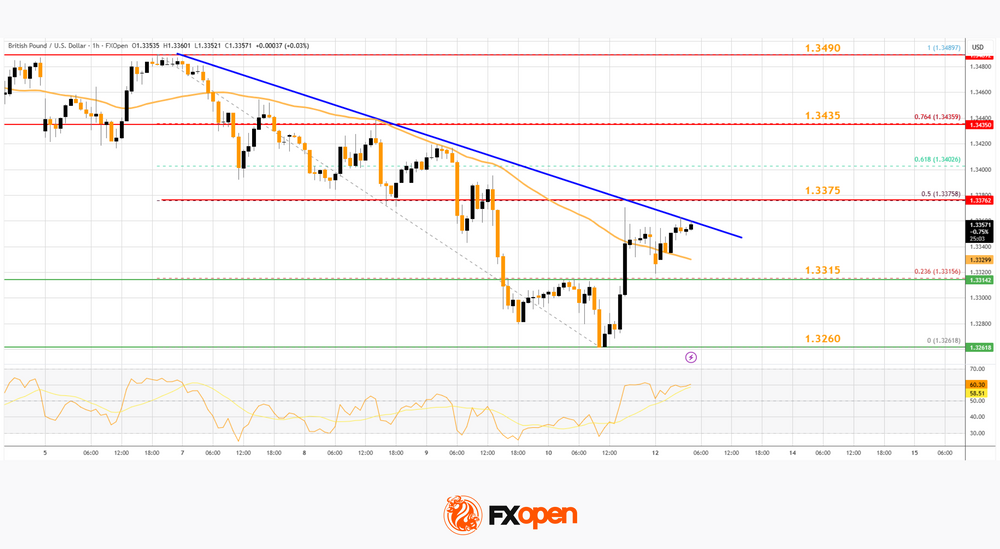
There was a minor move above 1.3315 and the 23.6% Fib retracement level of the downward move from the 1.3489 swing high to the 1.3261 low. On the upside, the GBP/USD chart indicates that the pair is facing resistance near a key bearish trend line at 1.3370 and 1.3375.
The 50% Fib retracement is also at 1.3375. A close above the trend line and then 1.3375 might start a decent increase. In the stated case, the pair might rise toward 1.3435. Any more gains might send GBP/USD to 1.3500.
On the downside, there is a key support forming near 1.3315. If there is a downside break below 1.3315, the pair could accelerate lower. The next key interest area might be 1.3260, below which the pair could test 1.3220. Any more losses could lead the pair toward 1.3150.
EUR/GBP Technical Analysis
On the hourly chart of EUR/GBP at FXOpen, the pair started a decent increase from 0.8650. The Euro traded above 0.8675 to enter a positive zone against the British Pound.
The pair settled above the 50-hour simple moving average and 0.8700. The pair traded as high as 0.8725 before there was a downside correction. There was a move below the 23.6% Fib retracement level of the upward move from the 0.8656 swing low to the 0.8725 high.
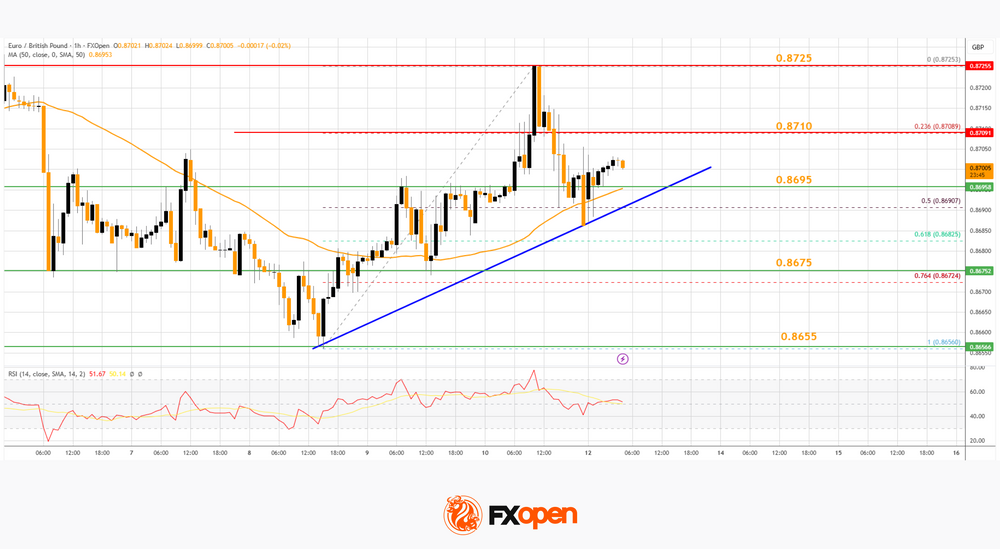
However, the pair is stable above 0.8675 and the 50% Fib retracement. Besides, there is a connecting bullish trend line forming with support at 0.8695.
A downside break below the 0.8695 support might call for more downsides. In the stated case, the pair could drop toward 0.8675. Any more losses might call for an extended drop toward the 0.8655 pivot zone.
The EUR/GBP chart suggests that the pair is facing hurdles near 0.8710. A close above 0.8710 might accelerate gains. In the stated case, the bulls may perhaps aim for a test of 0.8725. Any more gains might send the pair to 0.8750.
Trade over 50 forex markets 24 hours a day with FXOpen. Take advantage of low commissions, deep liquidity, and spreads from 0.0 pips. Open your FXOpen account now or learn more about trading forex with FXOpen.
This article represents the opinion of the Companies operating under the FXOpen brand only. It is not to be construed as an offer, solicitation, or recommendation with respect to products and services provided by the Companies operating under the FXOpen brand, nor is it to be considered financial advice.
XTI/USD Chart Analysis: Oil Price Falls Below $60
Friday’s comments from President Trump about the potential introduction of 100% tariffs on trade with China pushed WTI crude oil below the $60 level for the first time in four months. The bearish sentiment stemmed from fears of a global economic slowdown amid escalating trade tensions between the world’s two largest economies.
The decline was further supported by news of peace efforts in the Middle East, which reduced the impact of geopolitical risk on oil prices.
As the XTI/USD chart shows, WTI is currently trading below $60. How might the situation unfold next?
Technical Analysis of the XTI/USD Chart
In the long-term view, oil price movements (following the flare-up in the Middle East in June) have formed a descending channel shown in red — notably, the current price has fallen below its lower boundary.
In the shorter term, we can observe an acceleration of the decline, emphasised by the purple trajectory lines.
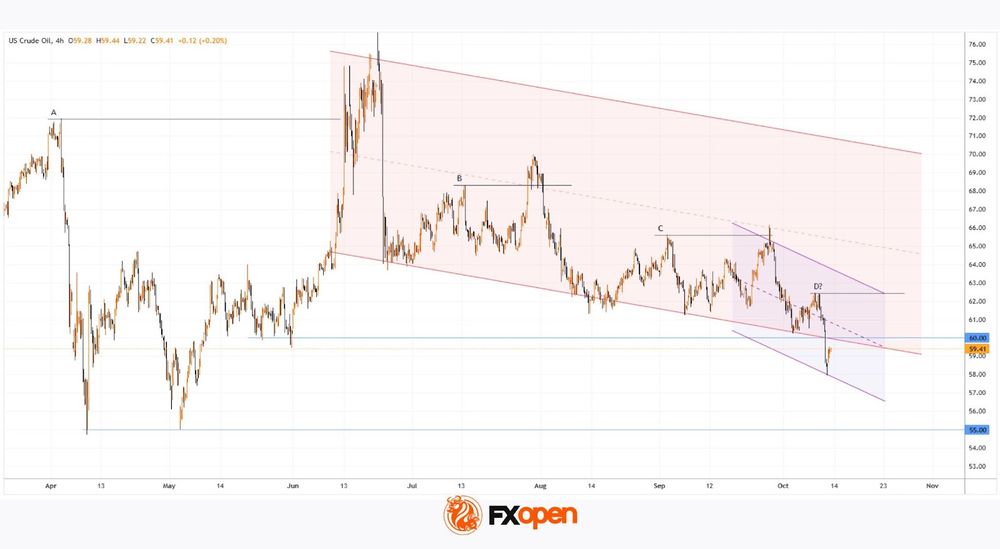
These observations suggest that selling pressure remains dominant, while any recovery attempts are likely to meet resistance near:
→ the psychological level of $60;
→ the lower boundary of the red channel;
→ the purple median line.
Given that the White House is reportedly in favour of lower oil prices (as a means of stimulating the US economy and exerting pressure on geopolitical rivals), WTI crude could drift towards the year’s low around $55.
However, from the demand-side perspective, it cannot be ruled out that the oil market, known for its false breakouts above previous highs (A, B, C), may repeat a similar move above peak D — a pattern that, in Smart Money Concept terms, would represent a liquidity grab.
Start trading commodity CFDs with tight spreads. Open your trading account now or learn more about trading commodity CFDs with FXOpen.
This article represents the opinion of the Companies operating under the FXOpen brand only. It is not to be construed as an offer, solicitation, or recommendation with respect to products and services provided by the Companies operating under the FXOpen brand, nor is it to be considered financial advice.
EUR/USD Stages a Correction Amid Sustained Pressure
The euro remains under pressure as escalating trade risks fuel market anxiety. A sharp sell-off was triggered by Donald Trump's announcement of a potential 100% tariff on Chinese goods, spurring a flight to safe-haven assets and boosting demand for the US dollar. This initiative is seen as a significant escalation in trade confrontation, posing a substantial threat to global exporters—particularly the eurozone economy, which is deeply integrated with China through complex supply chains and industrial exports.
Macroeconomic data from Europe continues to send mixed signals. While Germany's industrial production index shows tentative signs of stabilisation, business activity in the services sector is contracting. Given the mounting risks to external demand and signs of cooling domestic consumption, markets are increasingly pricing in the prospect of more dovish rhetoric from the European Central Bank in its upcoming communications.
Conversely, the United States maintains steady economic momentum, underscored by robust labour market data and resilient consumer spending. This strength reinforces market expectations that the Federal Reserve will keep interest rates at their current levels for longer than previously anticipated. The widening monetary policy divergence between the ECB and the Fed remains a primary anchor on the euro.
Amid the prevailing political and trade turbulence, EUR/USD is experiencing heightened volatility. Any further escalation in protectionist rhetoric from Washington or a flare-up of geopolitical tensions in Asia could precipitate a further decline in the pair towards 1.1520 and below.
Technical Analysis: EUR/USD
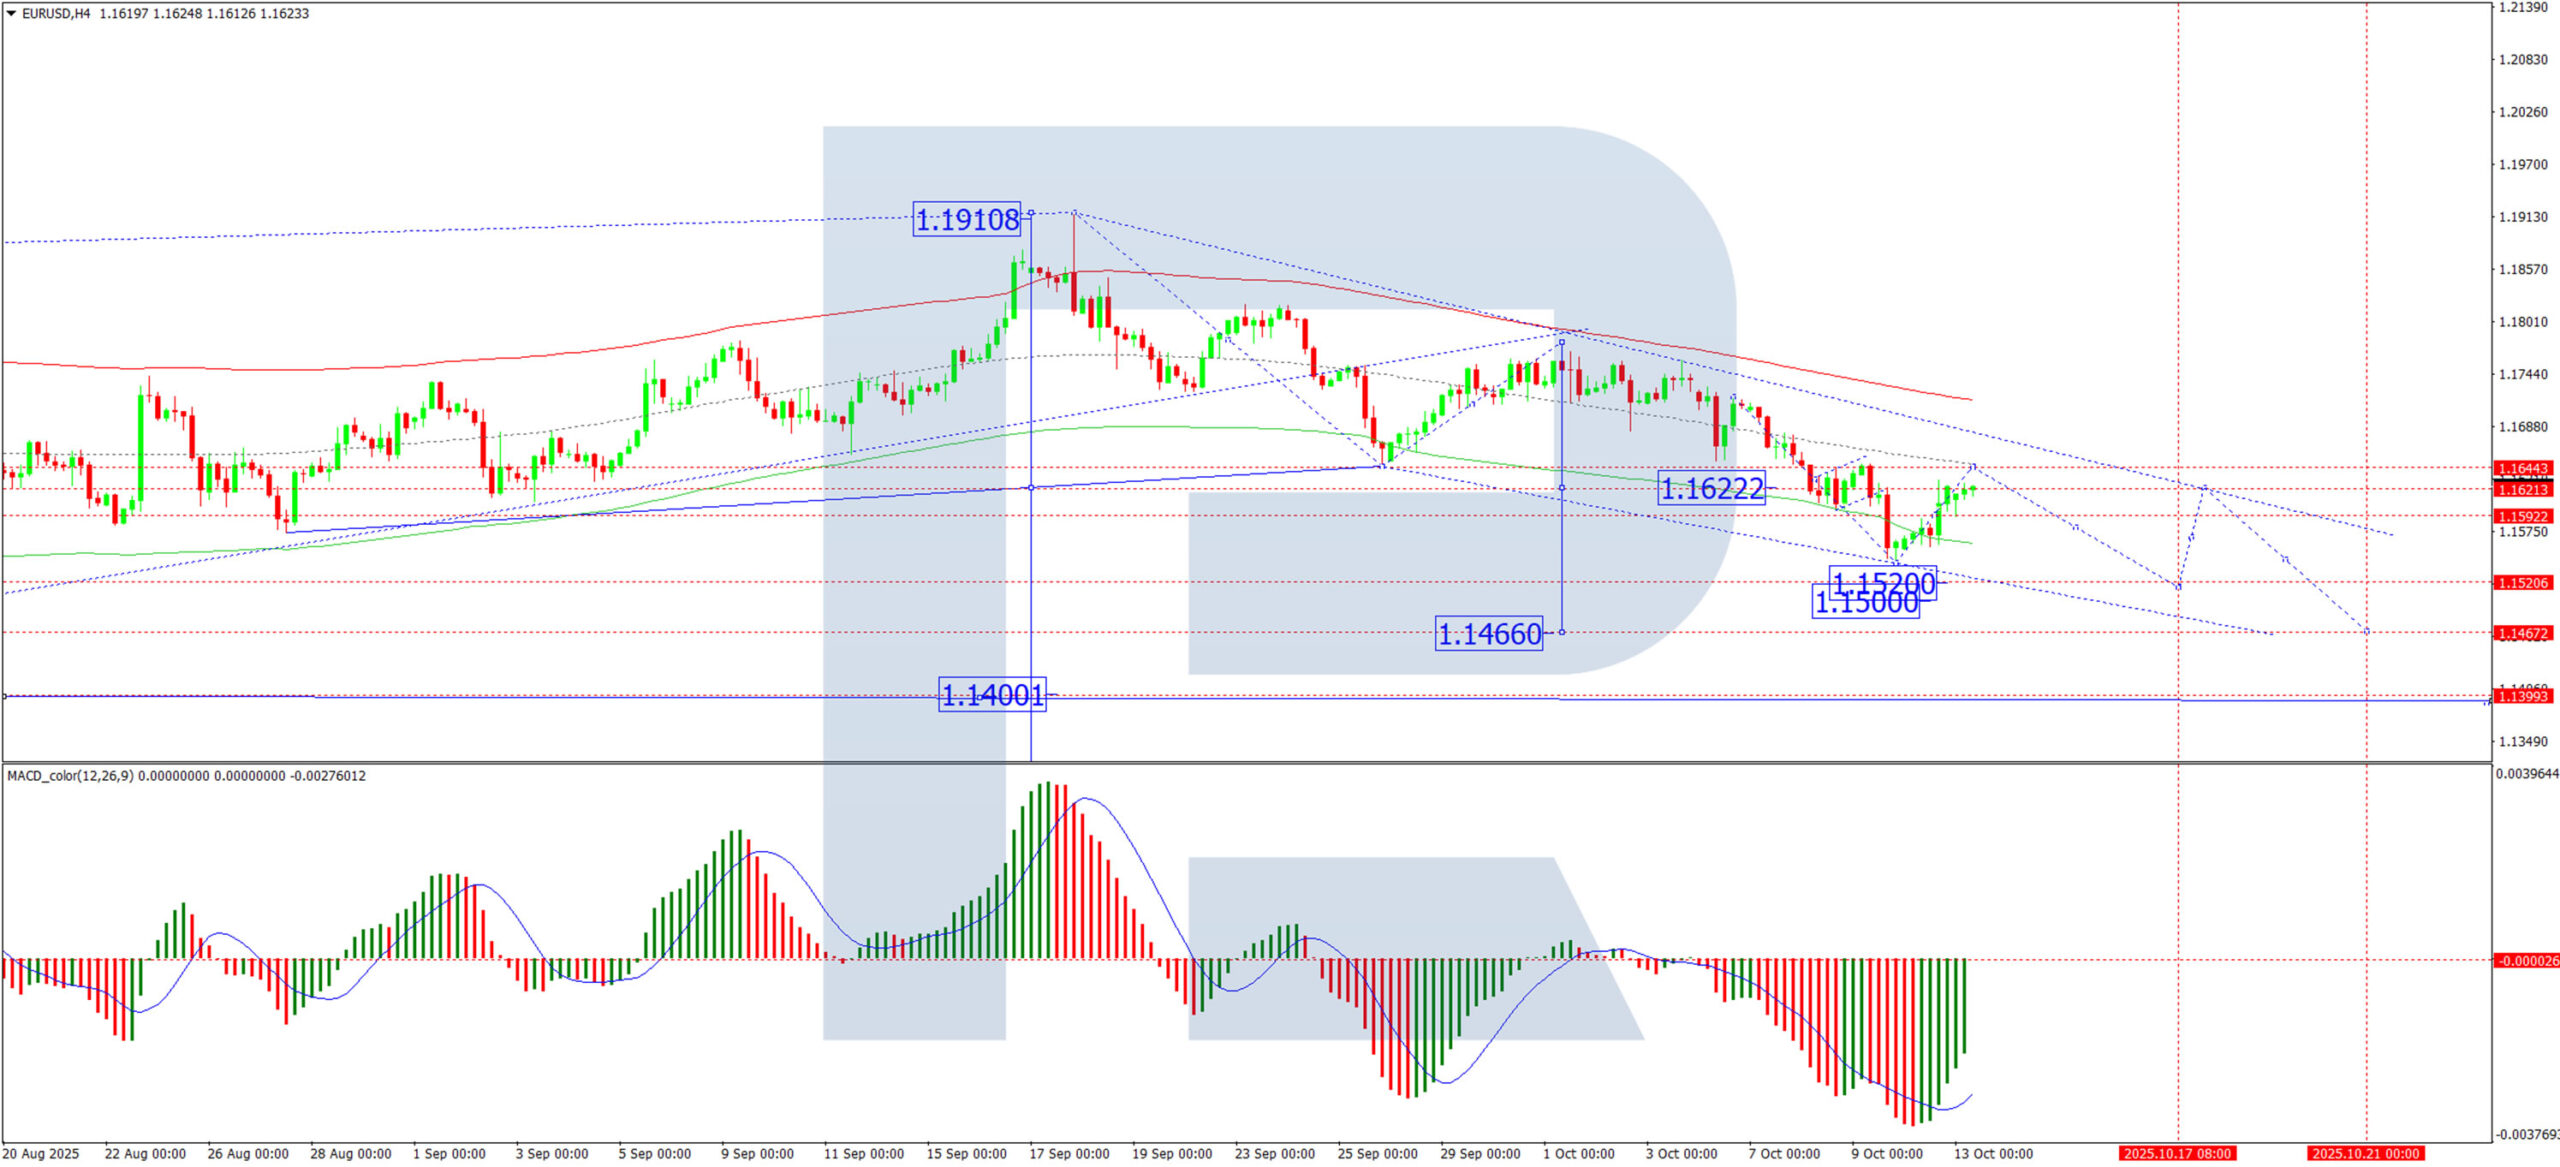
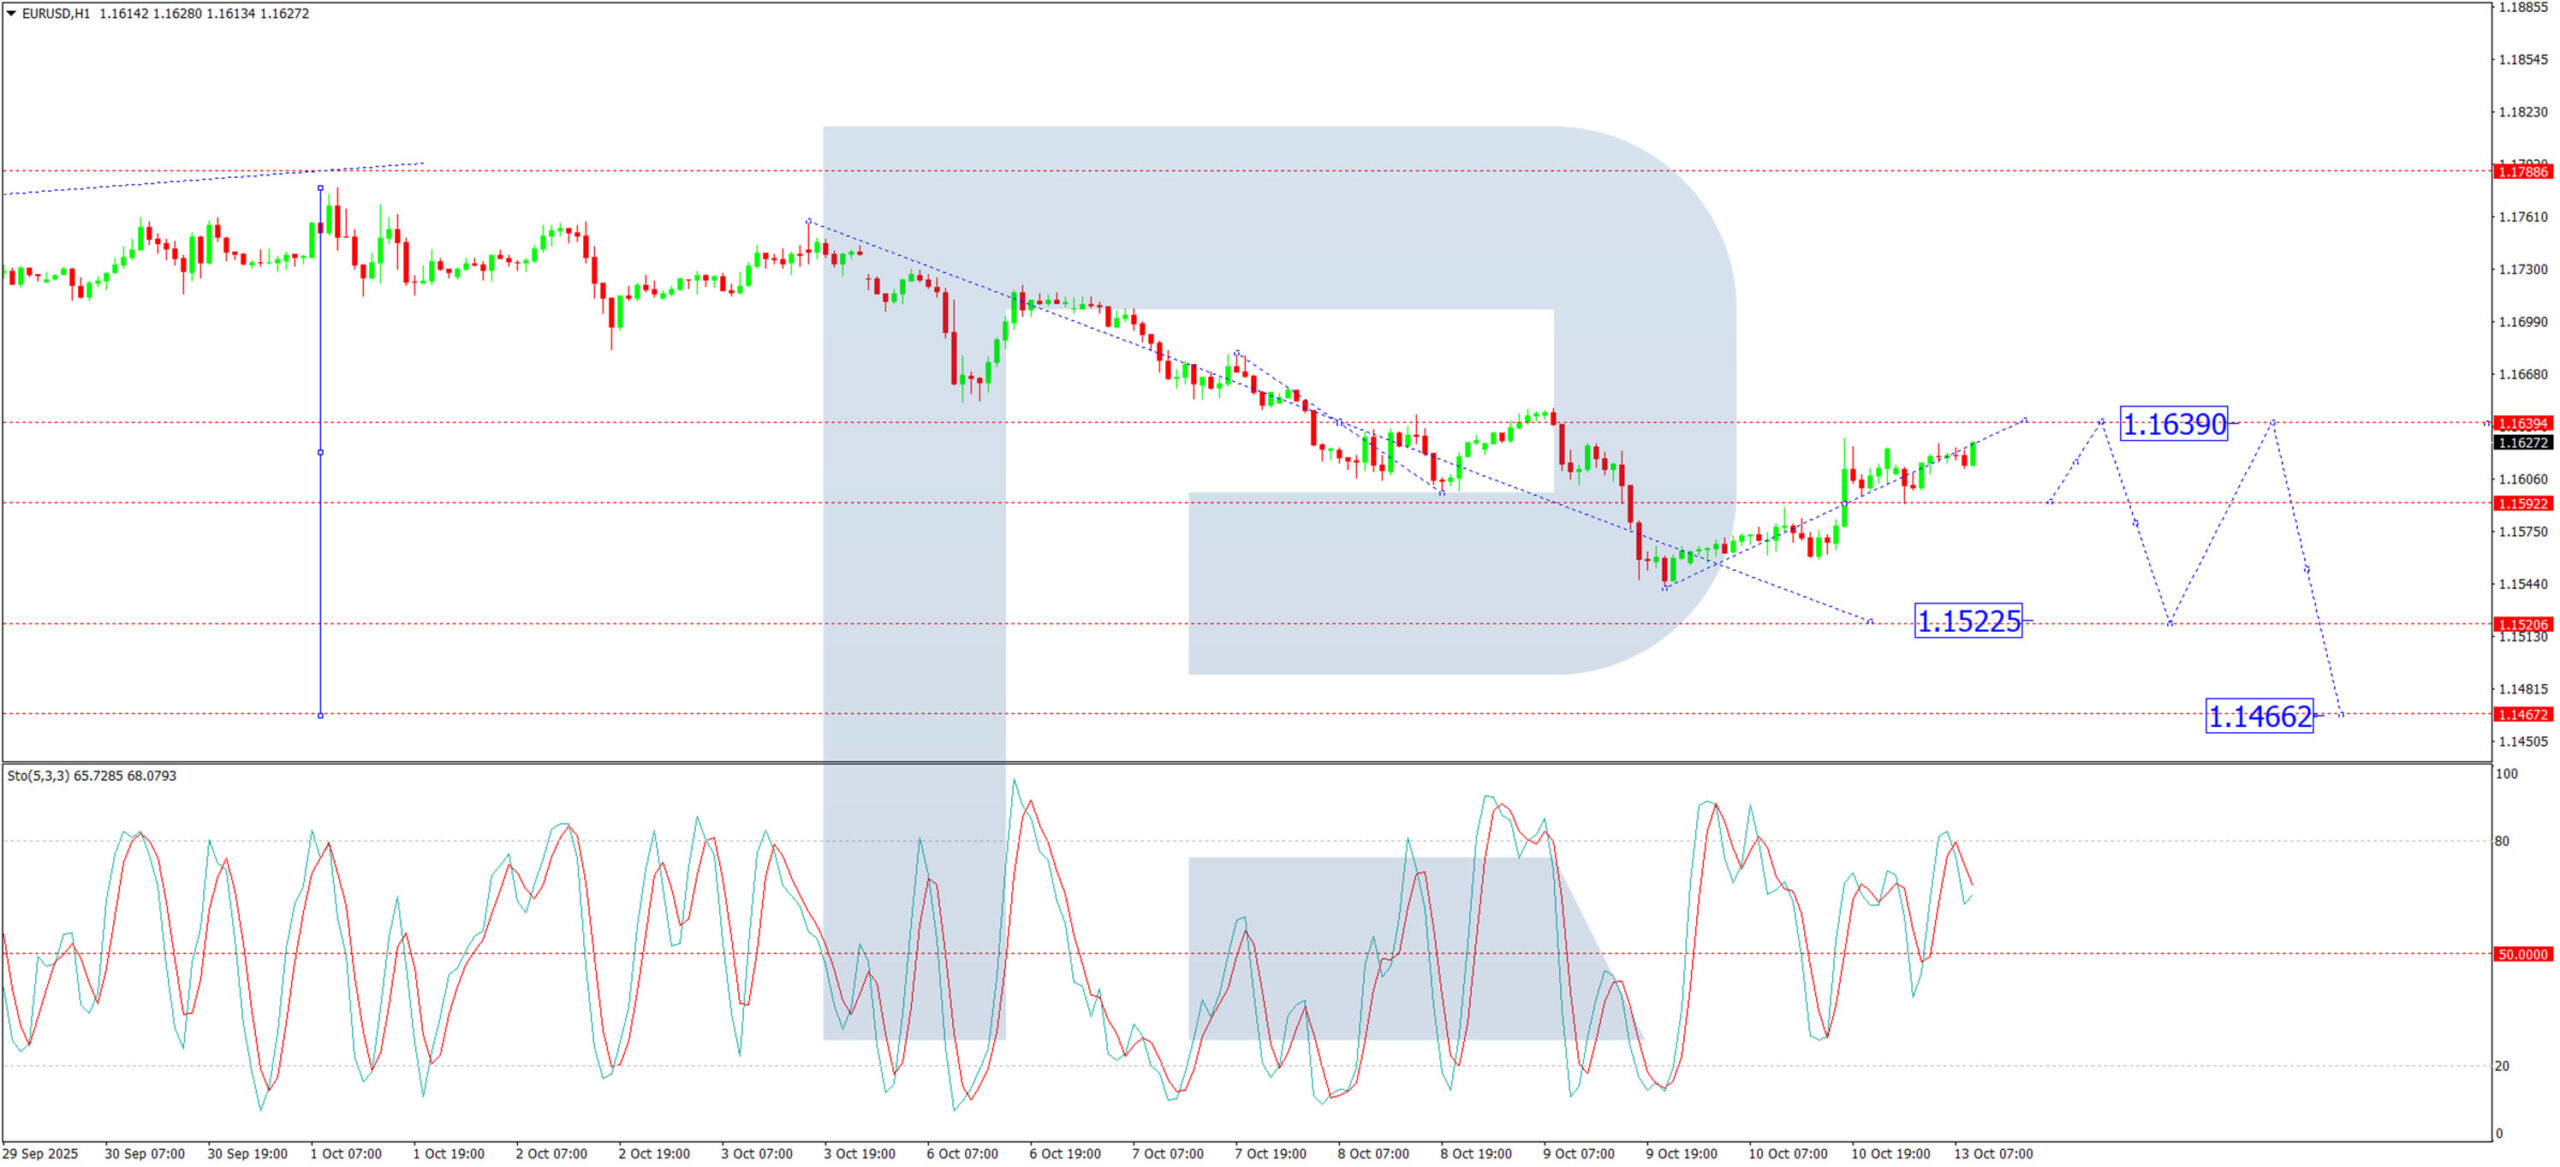
H4 Chart:
Having found a support base at 1.1592, EUR/USD is currently unfolding a corrective wave towards 1.1644. We anticipate this correction concluding today, paving the way for a new declining wave targeting 1.1520. The bearish move has the potential to extend further towards 1.1500 and 1.1466. This scenario is technically confirmed by the MACD indicator, whose signal line, while below zero, is currently pointing upwards, indicating the ongoing corrective nature of the move.
H1 Chart:
The pair formed a consolidation range around 1.1592, which subsequently expanded to 1.1629. Following a retest of 1.1592 from above, the market is now correcting. We expect this upward move to reach at least 1.1639 today. It is crucial to view this entire upswing as a correction within the broader downtrend. Once this correction is complete, we anticipate the initiation of a new downward wave towards a minimum target of 1.1522. Technically, this outlook is supported by the Stochastic oscillator, with its signal line above 50 and pointing firmly upwards towards 80.
Conclusion
While the EUR/USD is experiencing a technical correction, the fundamental backdrop of trade risks and central bank policy divergence continues to favour the US dollar. The path of least resistance remains downward, with key support levels at 1.1520 and 1.1500 in focus once the current corrective bounce exhausts itself.
Crypto Market Recovers from Tariff Shock
Market Picture
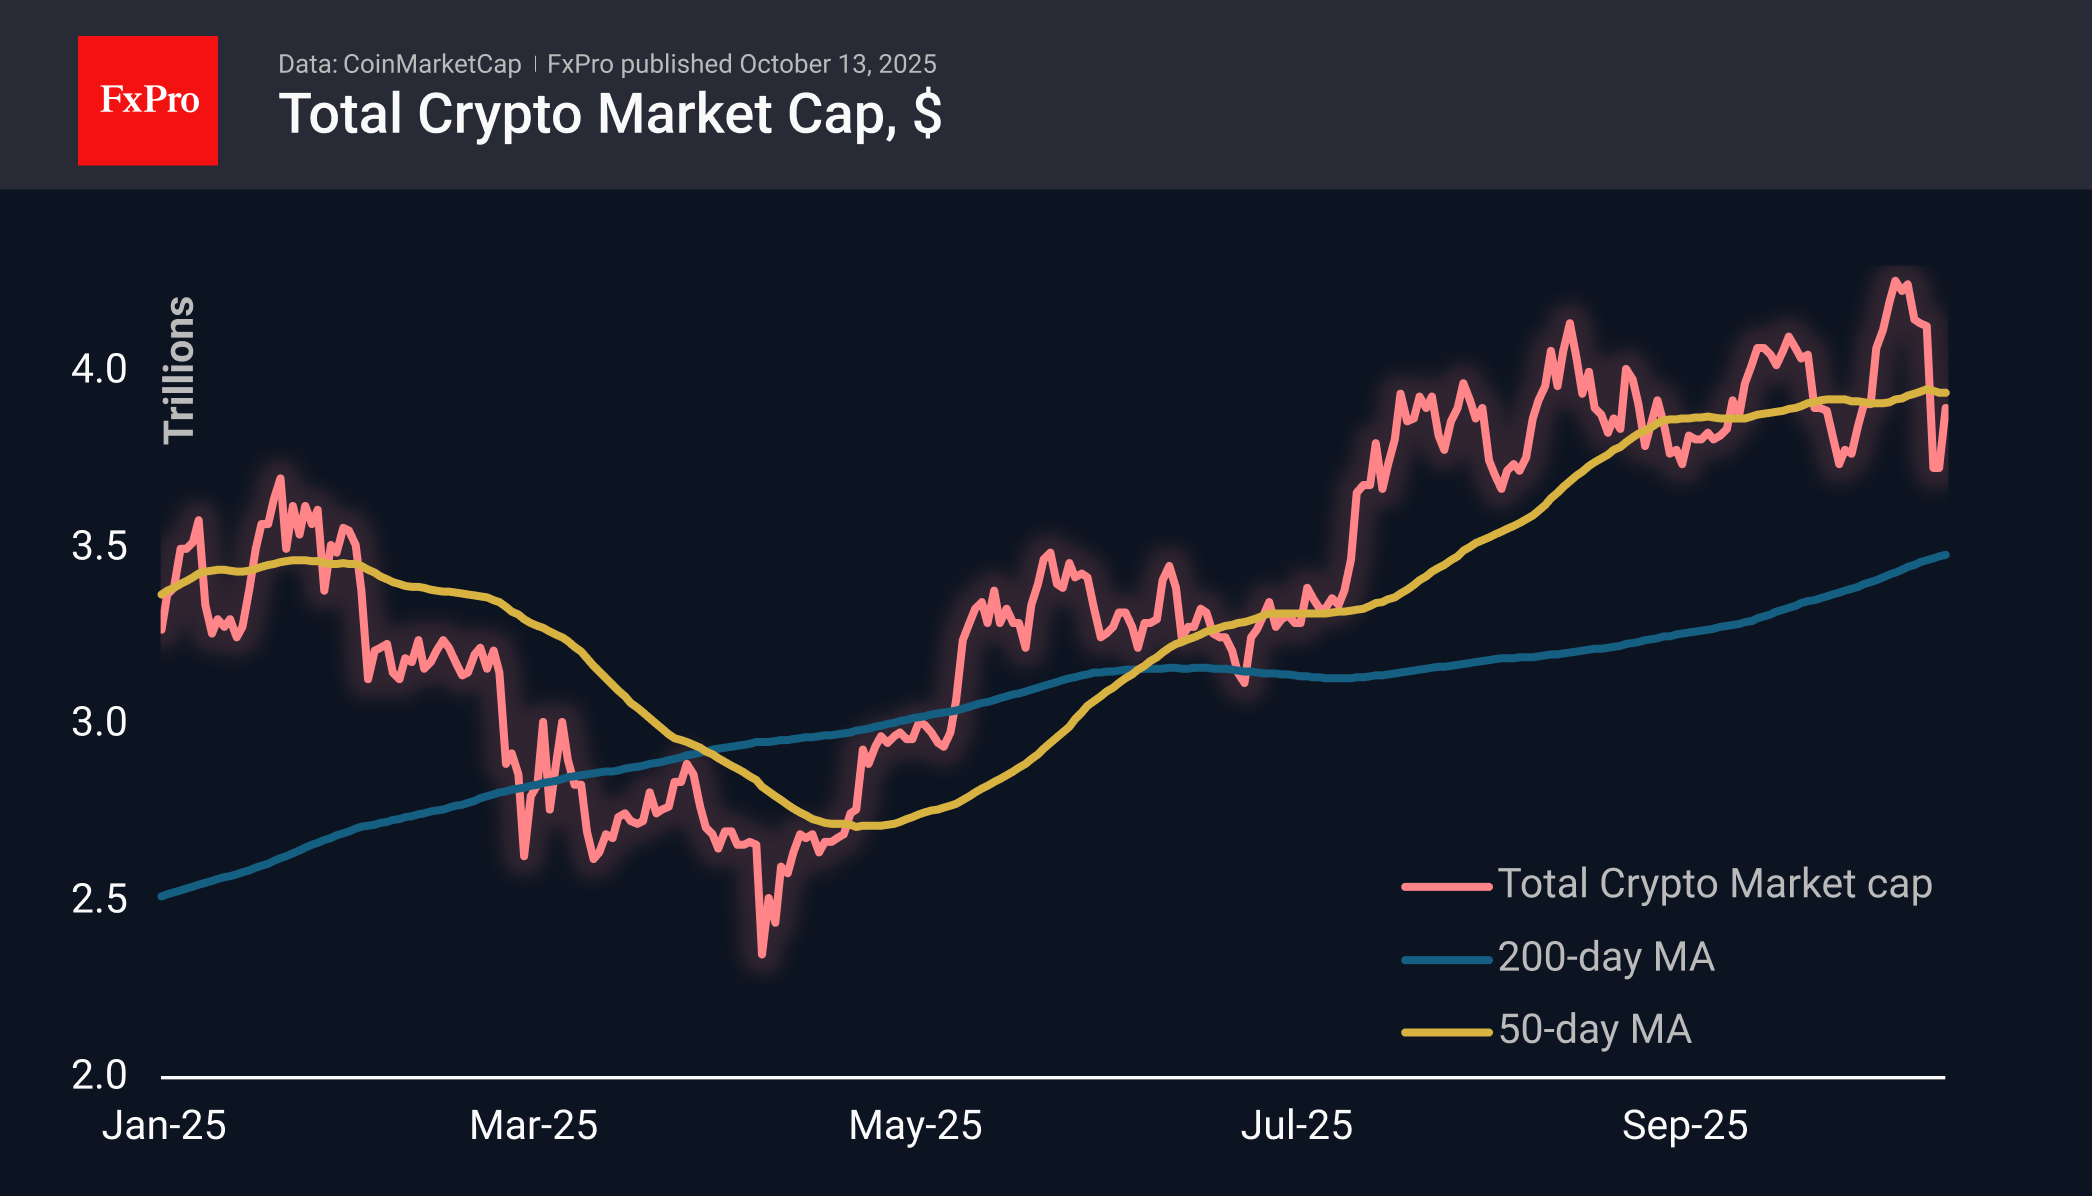
The crypto market capitalisation stood at $3.9 trillion on Monday, up 4.4% from the previous day but down 6% from pre-Friday crash levels. On Friday, the US stock market saw its biggest drop since April but recovered some of its losses on Monday. Since Sunday, the crypto market has been attempting to rebound after a sell-off that began as an emotional reaction to tariff initiatives by China and the US but escalated into massive margin calls and stop orders being triggered.
The sentiment index stood at 38 (fear) on Monday morning, down from 24 (extreme fear) the day before. The level of sentiment we saw over the weekend was last seen in April under similar circumstances — when tough trade tariffs were announced.
Bitcoin approached $115K on Monday, while Ethereum exceeded $4,200. Cryptocurrencies are recovering after Friday’s sharp decline. The movement on Friday and in the early hours of Saturday swept the ‘weak hands’ out of the market, taking the price of BTC below the 50—and 200-day moving averages and below the August and September lows.
Such sweeping liquidations often set the bottom of the market, but it may take time for the wounds to heal. In 2020, 2021 and 2024, it took a couple of weeks for the rally to start, although the market did not rewrite the lows. But in 2022, the turnaround to growth after the crash began after about six months. Relying on these statistics is encouraging for bargain hunters in crypto. Still, it would be too hasty to say that the recovery will be just as quick and will begin immediately.
News Background
Wall Street crashed on Friday after US President Donald Trump escalated the trade conflict with China following Beijing’s tightening of restrictions on trade in rare earth metals, Reuters reports.
Cryptocurrencies and stock indices fell sharply on Friday.
Some softening of tone from Trump and Xi has led to the probability of 100% tariffs against China by 1 November being estimated at 8% on Polymarket, down from 26% at the end of Friday.
Santiment notes that bitcoin remains extremely sensitive to risk appetite and behaves more like a risky asset than a safe haven.
The Kobeissi Letter notes that the collapse of cryptocurrencies on 11 October will not have long-term fundamental consequences and was caused by a combination of technical factors. The market crash triggered a record cascade of liquidations worth $19.3 billion.
Analyst Frank Fetter, citing technical indicators, said the cryptocurrency market is still far from overbought, which means there is still potential for the rally to continue.
Bound to See Sentiment-Driven Trading in a Daily Perspective
Markets
US president Trump did on Friday what he does best: spice up a trading session. China announced tighter export controls on rare earths and other critical materials earlier in the week. Trump responded amongst others with an additional 100% tariff hike starting November 1. That would bring the effective rate to around 140%, killing off trade between the two major economies and shattering a months-long trade truce. Stock markets, lulled to sleep by the recent extremely low volatility, paid the biggest price. The tech-heavy Nasdaq lost about 3.5%. European equities responded to the news in their final trading hour by tumbling up to 1.7% (EuroStoxx50). Core bonds rallied with US Treasuries outperforming Bunds. US yields dropped between 9.1 and 11.1 bps across the curve. German rates eased 3.8-5.9 bps. The US dollar lost ground, unable to profit from the risk aversion. EUR/USD clawed back to north of 1.16, the trade-weighted index retreated to 98.98. The yen outperformed and punched USD/JPY lower to 151.2. We should add that the greenback had a strong run earlier in the week though. With the first important resistance levels either nearby (USD/JPY 153.4) or effectively under attack (EUR/USD 1.1573, DXY 99.51) conditions were ripe for a technically-inspired pullback as well, particularly going into a long weekend. The US is (partially) closed for Columbus Day today, with the exception of the stock exchanges. With Japanese market shut as well and an empty economic calendar, we’re bound to see sentiment-driven trading in a daily perspective with some distraction coming from the annual IMF/World Bank meeting kickoff. Asian markets still suffer from Trump’s latest tariff threat, despite the US administration late yesterday signalling it remains open to a deal. European (and US, for what it’s worth) equity futures seem keen to buy into it, suggesting a 0.5% open. The US dollar fluctuates north of EUR/USD 1.16. From the European side of the equation all attention is going to France once more. French president Macron reappointed Lecornu as prime minister after trading desks closed on Friday. There’s already a new cabinet, be it with the same ministers in key positions (finance, budget, foreign affairs) as in Lecornu 1.0. The former caretaking new prime minister is running extremely short on time to present a budget in time to have it approved before the end of the year. He has until today/tomorrow.In a sign of fragility, those from Les Républicains that have been appointed as minister are being ousted from the party. The far-right Rassemblement National already said they would table a vote of no confidence today, with a vote probably taking place on Wednesday. The fate of the then three-days old government will be decided by the Socialist Party. The risk of yet another collapse is very high, after which new parliamentary elections become all but unavoidable.
News & Views
Rating agency Moody’s on Friday completed a periodic review of Belgium’s credit ratings. They didn’t announce a credit rating action, with the sovereign still at Aa3 with a negative outlook. The review merely summarizes Moody’s current views on Belgium. The negative outlook reflects the risk that the government will be unable to implement measures that would stabilize the government debt burden. In the absence of a large fiscal consolidation programme, debt will continue to rise due to the material structural increase in expenditures in recent years and persistent spending pressure. Structural headwinds to fiscal consolidation and the lack of intergovernmental coordination mechanisms to achieve such effort at all level of government further hamper deficit and debt reduction. Evidence that Belgium's competitiveness is being permanently weakened by recent high wage increases and/or energy costs would also be credit negative, as well as a marked deterioration in the geopolitical risks in Europe that yields tangible evidence of weakened support from key allies, in particular the US.
Chinese export growth rose from 4.4% Y/Y in August to 8.3% Y/Y in September in USD-terms. They are now 6.1% higher YTD 2025, compared with 5.8% over the same period of last year. Export growth to non-US destinations accelerated to the fastest pace since March 2023 (+14.8% Y/Y) while shipments to the US slumped for a sixth consecutive month, dropping by -27% Y/Y. Import growth increased from1.3% Y/Y to 7.4% Y/Y with the trade balance shrinking from $102.33bn in August to $90.45bn in September.
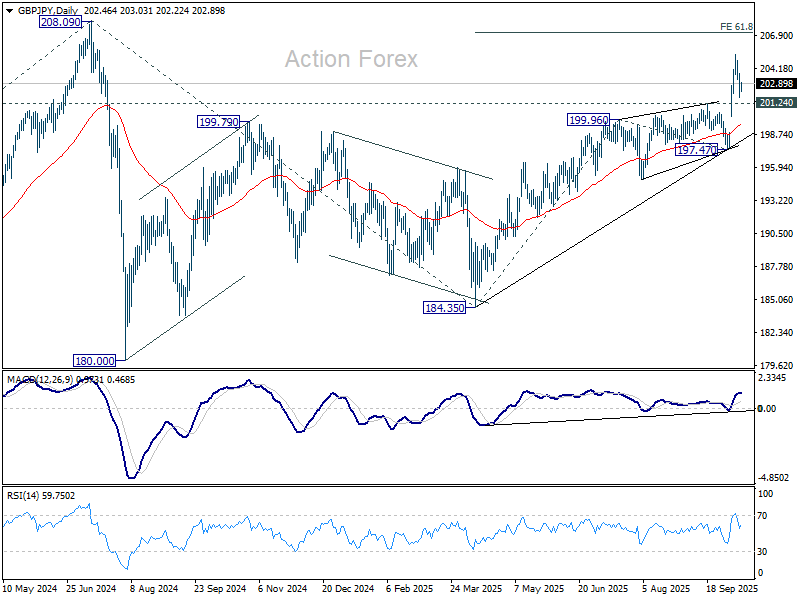
GBP/JPY Daily Outlook
Daily Pivots: (S1) 201.30; (P) 202.53; (R1) 203.20; More...
Intraday bias in GBP/JPY remains neutral and more consolidations could be seen. With 201.24 resistance turned support intact, further rally is still in favor. Break of 205.30 will target 61.8% projection of 184.35 to 199.96 from 197.47 at 207.11. However, firm break of 201.24 will confirm short term topping and bring deeper fall back to 197.47 support instead.
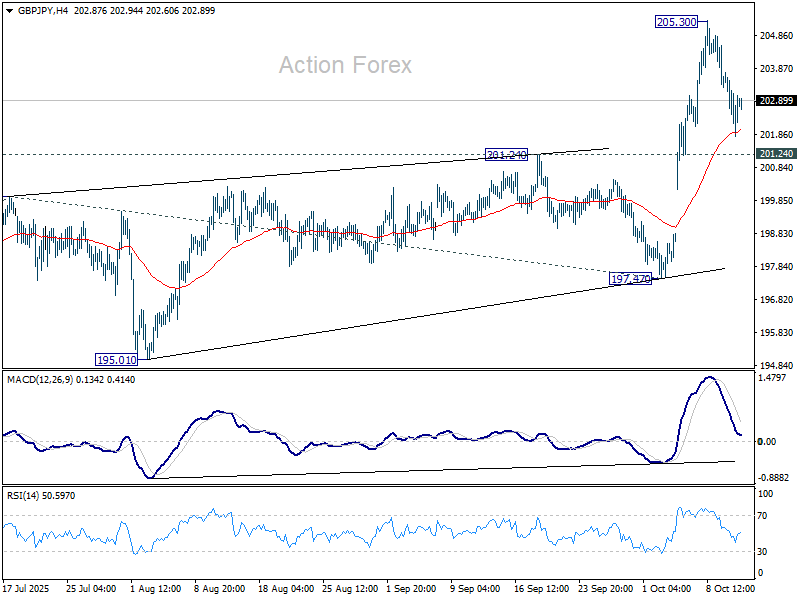
In the bigger picture, price actions from 208.09 (2024 high) are seen as a corrective pattern which might have completed at 184.35. Firm break of 208.09 high will resume the up trend from 123.94 (2020 low). Next target is 61.8% projection of 148.93 to 208.09 from 184.35 at 220.90. However, firm break of 197.47 will dampen this view and could extend the corrective pattern with another fall.
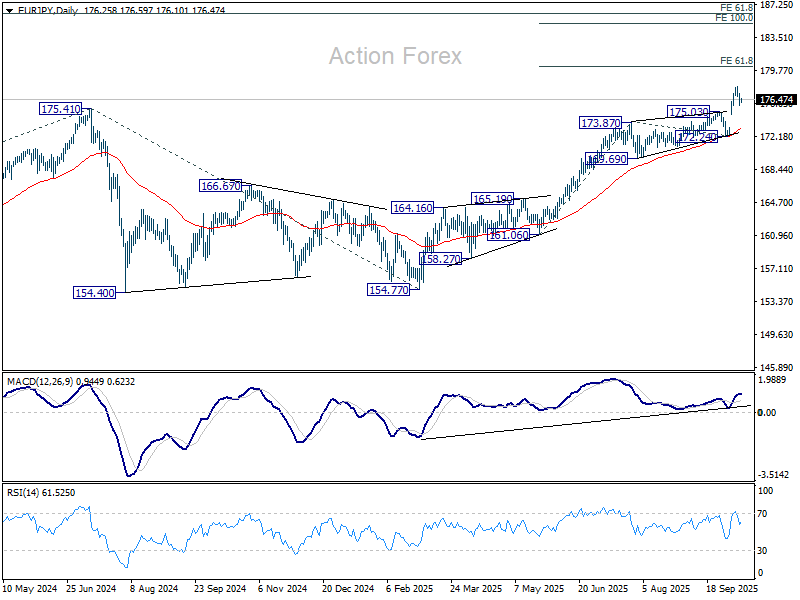
EUR/JPY Daily Outlook
Daily Pivots: (S1) 175.20; (P) 176.21; (R1) 176.74; More...
Intraday bias in EUR/JPY remains neutral for the moment and some consolidations could be seen. Further rise is expected as long as 175.03 resistance turned support holds. On the upside, break of 177.91 will target 61.8% projection of 161.06 to 173.87 from 172.24 at 180.15 next. However, firm break of 175.03 will confirm short term topping and bring deeper fall back to 172.24 support.
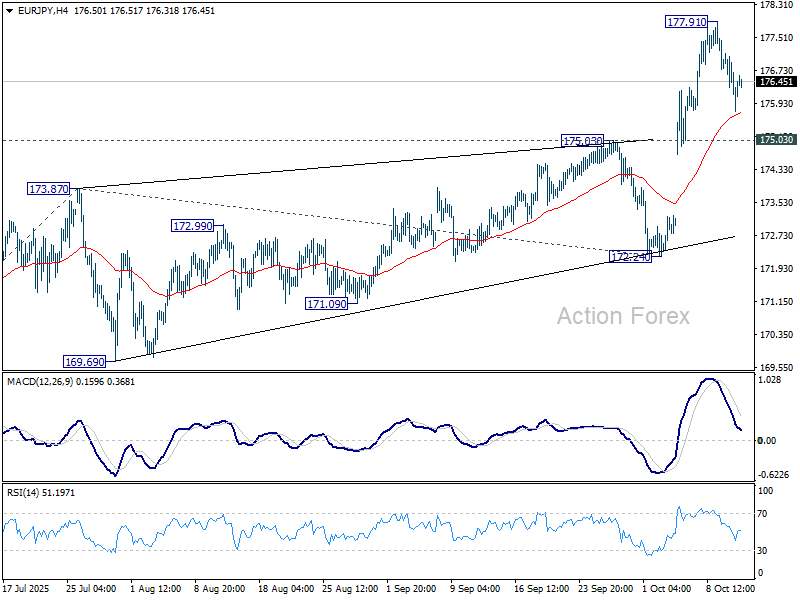
In the bigger picture, up trend from 114.42 (2020 low) is in progress and should target 61.8% projection of 124.37 to 175.41 from 154.77 at 186.31. Firm break of 172.24 support will suggests that it has turned into consolidations again. But still, outlook will continue to stay bullish as long as 55 W EMA (now at 167.16) holds, even in case of deep pullback.