Sample Category Title
U.S.–China War of Words Jolts Asia, Yet U.S. Futures Signal Contained Fallout
Asian equities started the week sharply lower after renewed flare-up in U.S.–China trade tensions, though signs from U.S. futures suggested that sentiment hadn’t worsened materially beyond last Friday’s selloff. Hong Kong’s Hang Seng Index slumped nearly -3.5% by midday, leading regional loss. The declines came after Beijing recently tightened export controls on rare earth minerals, prompting US President Donald Trump to retaliate with a threat of 100% tariffs on all Chinese imports starting November 1.
China’s Ministry of Commerce struck a combative tone over the weekend, saying the country was “not afraid of” a trade war and accusing Washington of a “textbook double standard.” The tit-for-tat rhetoric revived fears of a deeper standoff between the world’s two largest economies, though investors were quick to note that the broader risk mood had not deteriorated further. U.S. stock futures traded higher, signaling that Wall Street was stabilizing after last week’s sharp drop and that the Asian session was largely a delayed reaction rather than fresh panic selling.
Trump appeared to soften his stance on Sunday, posting online that “Don’t worry about China, it will all be fine!” and calling President Xi “highly respected.” He added that neither side wanted a depression, emphasizing that “the U.S.A. wants to help China, not hurt it.” The conciliatory tone contrasted sharply with his tariff threat days earlier and helped reassure investors that negotiations remain possible.
Vice President JD Vance echoed this calibrated approach in an interview with Fox News, saying the U.S. “will negotiate if Beijing is willing to be reasonable,” while reminding that Washington still “holds more cards.” Together, their remarks were interpreted as an attempt to de-escalate market fears without undermining the U.S. negotiating position.
Some observers see this exchange as part of a tactical phase rather than a reversion to the full-scale trade war. Both sides appear to be hardening their rhetoric strategically ahead of a potential Trump–Xi meeting at the APEC summit in South Korea later this month. Such posturing allows both governments to project strength domestically, and is more about negotiation leverage than policy action. For now, traders are watching for signs of follow-through, but few expect immediate disruption to trade flows.
In currencies, risk sentiment remained mixed but orderly. Aussie led gains for the day so far, followed by Kiwi and Loonie. Yen and Swiss Franc weakened while Euro dipped modestly. Sterling and Dollar traded mid-range. Overall, the currency markets are signaling unease, but not alarm.
In Asia, Japan is on holiday. At the time of writing, Hong Kong HSI is down -3.49%. China Shanghai SSE is down -1.17%. Singapore Strait Times is down -1.19%.
China trade in September, exports and imports surge, surplus narrows
China’s trade figures for September delivered a mixed picture. Exports rose 8.3% yoy, well above forecasts of 6.0% and marking the fastest pace in six months. Imports jumped 7.4% yoy, the strongest gain since April 2024 and far exceeding expectations of 1.5%.
However, the details showed signs of strain beneath the surface. Exports of rare earths—a key strategic material—fell -30.9% from August to 4,000 tonnes, the lowest level since February, amid tighter export restrictions. Meanwhile, soybean imports surged to the second-highest level on record, boosted by heavy purchases from South America as buyers avoided U.S. supplies in response to the escalating trade conflict.
Overall, China’s trade surplus narrowed to USD 90.5B from USD 102.3B, undershooting expectations of USD 98.5B. The surplus with the U.S. widened to USD 22.8B, even as total bilateral trade continued to shrink—exports to the U.S. fell nearly -17% in the first three quarters, while imports declined -11.6%. At the same time, trade deficit with Russia expanded to its widest level in six months at USD 2.1B.
NZ BNZ services at 48.3, contracts for 19th month as signs of strain persist
New Zealand’s services sector remained mired in contraction in September, with BNZ Performance of Services Index edging up modestly from 47.6 to 48.3. While the improvement marks a slight lift in momentum, the index has now stayed below the 50-point expansion threshold for 19 consecutive months.
Activity and sales rose to 47.8, and new orders improved to 49.6, but both remained in negative territory. Employment slipped to 47.8, reflecting ongoing caution among firms facing soft sales and squeezed margins.
BNZ reported that 58% of survey comments were negative, only marginally below August’s 59.6%. Respondents cited weak consumer confidence, rising living costs, and reduced discretionary spending as key drags. Many businesses also noted clients delaying projects and contracts amid broader economic uncertainty.
EUR/CAD: Euro pullback and Loonie resilience could amplify downside risks
Canadian Dollar is holding its ground as one of the month’s best-performing currencies so far, supported by surprisingly strong domestic data despite a slump in oil prices. WTI crude’s drop through 60 last week would normally pressure the Loonie, but September’s upbeat employment figures more than offset that drag.
The standout feature of the report was rebound in manufacturing jobs — the sector’s first monthly gain since January — signaling renewed momentum in an area hard-hit by global trade tensions. The improvement was particularly welcome after a weak summer stretch that had driven the BoC’s 25bps rate cut in September.
Markets are now looking to the October 21 CPI report for confirmation. Inflation would probably need to print well below expectations to confirm the case for another cut on October 29. For now, the data flow leans toward a pause.
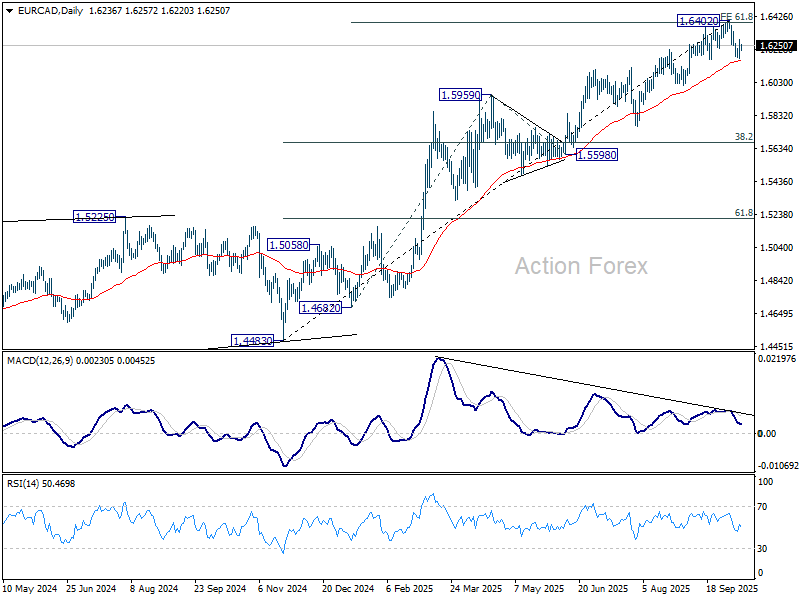
Technically, EUR/CAD shows early signs of exhaustion after meeting upside target of 61.8% projection 1.4682 to 1.5959 from 1.5598 at 1.6387. Visible bearish divergence on D MACD reinforces the case that upward momentum is fading.
Sustained break below the 55 D EMA (now at 1.6160) should indicate medium term topping at 1.6402. Deeper decline could then be seen to correct whole five-wave rally from 1.4483 (Nov 2024 low), and target 38.2% retracement of 1.4483 to 1.6402 at 1.5669. Nevertheless, strong bounce from 55 D EMA will retain near term bullishness and set up another rally through 1.6402 instead.
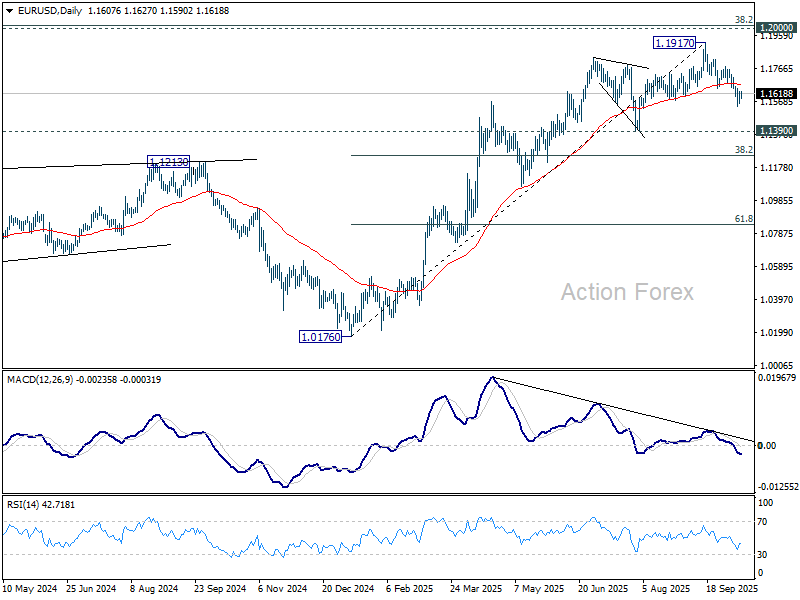
Also, it should be noted that cross-currency dynamics point to growing downside risk for EUR/CAD. EUR/USD has failed to break through the key 1.2000 cluster resistance and has since retreated from 1.1917. Deeper pullback or even a shift toward bearish reversal could be underway.
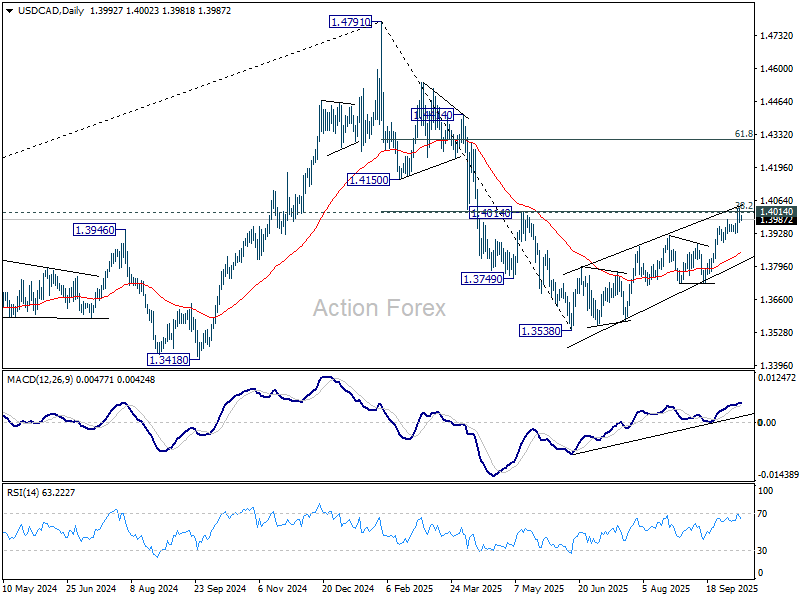
At the same time, USD/CAD is testing strong cluster resistance near 1.4000, where a corrective dip appears likely after months of steady advance.
Should both patterns materialize—Euro weakening against Dollar while Loonie strengthens versus the Greenback—EUR/CAD would accelerate its decline, reinforcing the view that a medium-term top is in place. However, sustained strength in USD/CAD or stabilization in EUR/USD would shift the odds away from this bearish case in EUR/CAD.
UK and Australia take focus as shutdown delays U.S. CPI
It’s set to be a relatively quiet week in terms of data releases. The US calendar is near empty due to ongoing government shutdown. The most notable casualty is September’s CPI report, originally slated for Wednesday, which is now postponed. It's reported that the Bureau of Labor Statistics confirmed that it will “promptly resume” work, with CPI now scheduled for October 24 — nine days later than planned. The timing ensures the Fed will have the data in hand ahead of its October 28–29 policy meeting.
In the UK, labor market and GDP readings will be the main event. Speculation has already grown that the BoE’s easing cycle may be near its end, with policymakers keen to avoid reigniting inflationary pressures amid still-firm labor costs. Stronger wages or activity data this week would strengthen the case for the BoE to hold policy steady in November.
In the Asia-Pacific region, attention turns to Australia, where the RBA’s meeting minutes and September employment report will be closely watched. The November policy meeting remains live, with markets divided over whether another rate cut is warranted. The labor figures will be pivotal in shaping that debate, as resilient household spending has so far kept the RBA cautious about over-stimulating demand. The RBA’s minutes may offer some color on the internal balance of views but are unlikely to reveal new signals ahead of the more decisive Q3 CPI report later this month.
Here are some highlights for the week:
- Monday: New Zealand BNZ services index; China trade balance.
- Tuesday: RBA minutes, NAB business confidence; UK employment; Swiss PPI; German ZEW economic sentiment, CPI final; US NFIB small business index; Canada building permits.
- Wednesday: China CPI, PPI; Eurozone industrial production; Canada manufacturing sales, wholesale sales; US Empire state manufacturing, Fed's Beige Book.
- Thursday: Japan machine orders; Australia employment; Japan tertiary industry index; UK GDP, trade balance; Swiss SECO economic forecasts; Eurozone trade balance; US Philly Fed survey, NAHB housing index.
- Friday: Eurozone CPI final.
AUD/USD Daily Report
Daily Pivots: (S1) 0.6442; (P) 0.6508; (R1) 0.6542; More...
AUD/USD recovered notably today and intraday bias is turned neutral first. Still, risk will remain on the downside as long as 0.6628 resistance holds. Current development suggests rejection by 0.6713 fibonacci resistance. Below 0.6472 will resume the fall from 0.6706 to 0.6413 cluster support (38.2% retracement of 0.5913 to 0.6706 at 0.6403).
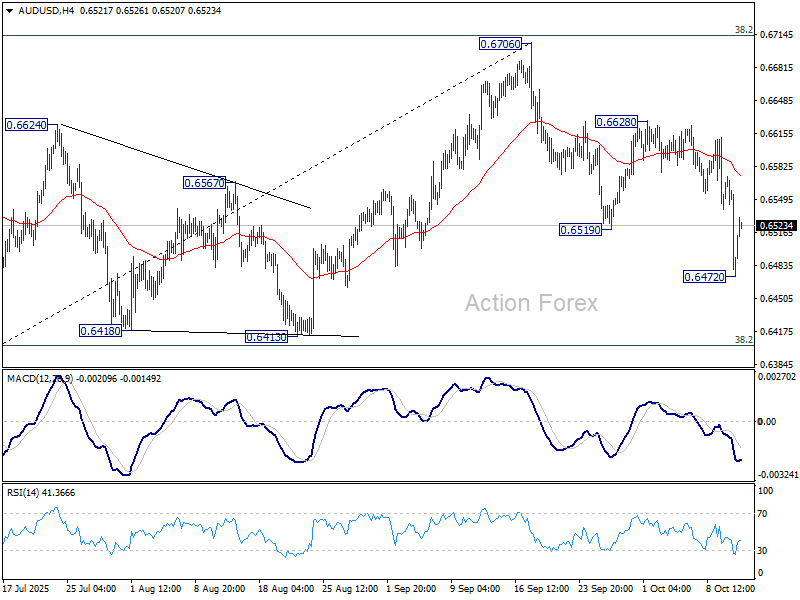
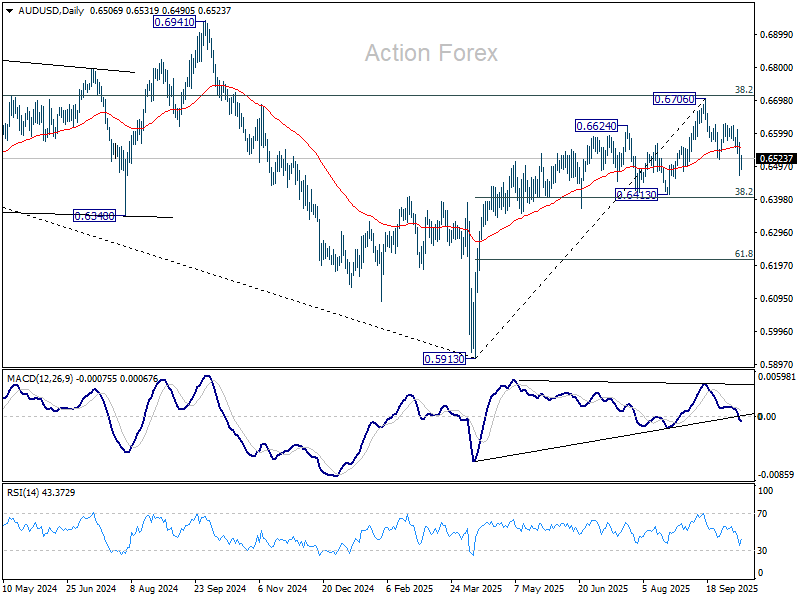
In the bigger picture, there is no clear sign that down trend from 0.8006 (2021 high) has completed. Rebound from 0.5913 is seen as a corrective move. Outlook will remain bearish as long as 38.2% retracement of 0.8006 to 0.5913 at 0.6713 holds. Nevertheless, considering bullish convergence condition in W MACD, sustained break of 0.6713 will be a strong sign of bullish trend reversal, and pave the way to 0.6941 structural resistance for confirmation.
US-China Trade: New Trade Escalation Turns Focus to Xi-Trump Meeting
On Friday, Trump threatened China with 100% tariffs on top of the existing rates as a retaliation against China's new export control measures on rare earth minerals. However, comments received over the weekend appear to downplay the risk of trade war escalation.
Focus now turns to a Xi-Trump meeting at the end of the month, where the two sides can dial back the escalation. We see a more than 50% chance for this.
While the 100% tariff hike would push the pre-substitution US average tariff rate to around 28%, or close to the highs seen last May, the effective increase would be more modest due to re-routing of trade.
Both importers and exporters have adapted to the new tariff landscape which alleviates downside risks to both US and Chinese economies even if the higher tariffs go into effect. We expect the Fed to cut rates by 25bp later this month irrespective of the near-term trade war outcome.
China trade in September, exports and imports surge, surplus narrows
China’s trade figures for September delivered a mixed picture. Exports rose 8.3% yoy, well above forecasts of 6.0% and marking the fastest pace in six months. Imports jumped 7.4% yoy, the strongest gain since April 2024 and far exceeding expectations of 1.5%.
However, the details showed signs of strain beneath the surface. Exports of rare earths—a key strategic material—fell -30.9% from August to 4,000 tonnes, the lowest level since February, amid tighter export restrictions. Meanwhile, soybean imports surged to the second-highest level on record, boosted by heavy purchases from South America as buyers avoided U.S. supplies in response to the escalating trade conflict.
Overall, China’s trade surplus narrowed to USD 90.5B from USD 102.3B, undershooting expectations of USD 98.5B. The surplus with the U.S. widened to USD 22.8B, even as total bilateral trade continued to shrink—exports to the U.S. fell nearly -17% in the first three quarters, while imports declined -11.6%. At the same time, trade deficit with Russia expanded to its widest level in six months at USD 2.1B.
EUR/USD Stuck Below Resistance – Can Bulls Push Through?
Key Highlights
- EUR/USD declined further below 1.1600 and tested 1.1545.
- A major bearish trend line is forming with resistance at 1.1700 on the 4-hour chart.
- GBP/USD extended losses below 1.3400 and 1.3360.
- Gold is consolidating gains above the $4,000 pivot level.
EUR/USD Technical Analysis
The Euro started a major decline below 1.1650 against the US Dollar. EUR/USD dropped below the 1.1650 and 1.1600 levels to enter a bearish zone.
Looking at the 4-hour chart, the pair settled below the 100 simple moving average (red, 4-hour) and the 200 simple moving average (green, 4-hour). The pair even tested the 1.1545 zone and recently started a recovery wave.
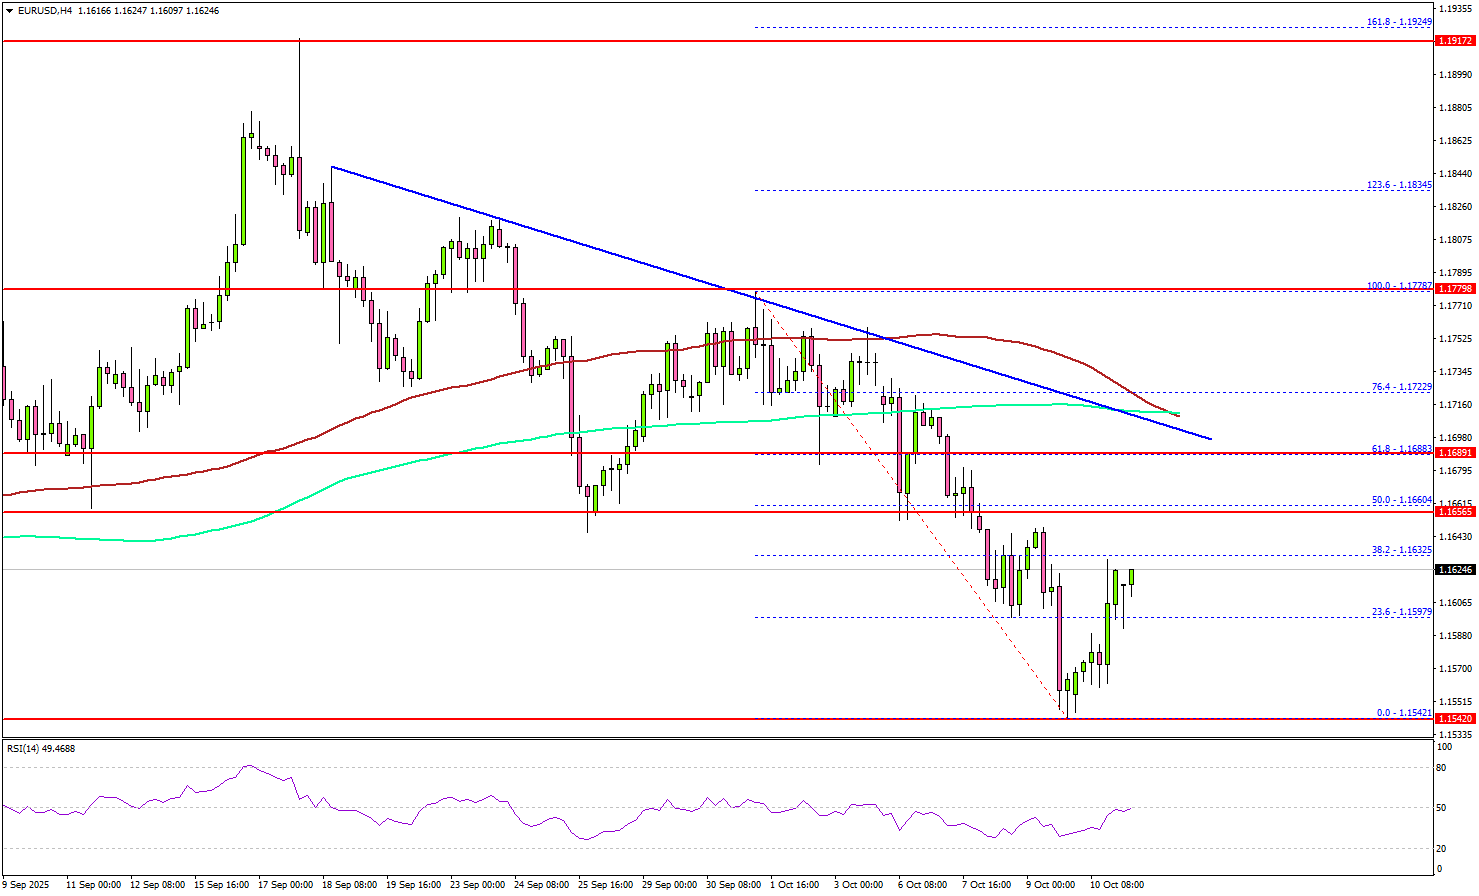
The pair climbed above the 1.1620 level and the 23.6% Fib retracement level of the recent decline from the 1.1728 swing high to the 1.1542 low. On the upside, the pair faces resistance near the 1.1660 level.
The main hurdle could be 1.1690 and the 61.8% Fib retracement level of the recent decline from the 1.1728 swing high to the 1.1542 low. There is also a major bearish trend line forming with resistance at 1.1700 on the same chart.
On the downside, the pair might find support at 1.1580. The main hurdle could be 1.1550. A close above 1.1550 could start a steady increase to 1.1500.
Looking at GBP/USD, the pair faced an increase in selling pressure, resulting in a drop below the 1.3400 support zone.
Upcoming Key Economic Events:
- Fed's Paulson speech.
- Monthly Budget Statement (Sep).
EUR/CAD: Euro pullback and Loonie resilience could amplify downside risks
Canadian Dollar is holding its ground as one of the month’s best-performing currencies so far, supported by surprisingly strong domestic data despite a slump in oil prices. WTI crude’s drop through 60 last week would normally pressure the Loonie, but September’s upbeat employment figures more than offset that drag.
The standout feature of the report was rebound in manufacturing jobs — the sector’s first monthly gain since January — signaling renewed momentum in an area hard-hit by global trade tensions. The improvement was particularly welcome after a weak summer stretch that had driven the BoC’s 25bps rate cut in September.
Markets are now looking to the October 21 CPI report for confirmation. Inflation would probably need to print well below expectations to confirm the case for another cut on October 29. For now, the data flow leans toward a pause.
Technically, EUR/CAD shows early signs of exhaustion after meeting upside target of 61.8% projection 1.4682 to 1.5959 from 1.5598 at 1.6387. Visible bearish divergence on D MACD reinforces the case that upward momentum is fading.
Sustained break below the 55 D EMA (now at 1.6160) should indicate medium term topping at 1.6402. Deeper decline could then be seen to correct whole five-wave rally from 1.4483 (Nov 2024 low), and target 38.2% retracement of 1.4483 to 1.6402 at 1.5669. Nevertheless, strong bounce from 55 D EMA will retain near term bullishness and set up another rally through 1.6402 instead.
Also, it should be noted that cross-currency dynamics point to growing downside risk for EUR/CAD. EUR/USD has failed to break through the key 1.2000 cluster resistance and has since retreated from 1.1917. Deeper pullback or even a shift toward bearish reversal could be underway.
At the same time, USD/CAD is testing strong cluster resistance near 1.4000, where a corrective dip appears likely after months of steady advance.
Should both patterns materialize—Euro weakening against Dollar while Loonie strengthens versus the Greenback—EUR/CAD would accelerate its decline, reinforcing the view that a medium-term top is in place. However, sustained strength in USD/CAD or stabilization in EUR/USD would shift the odds away from this bearish case in EUR/CAD.
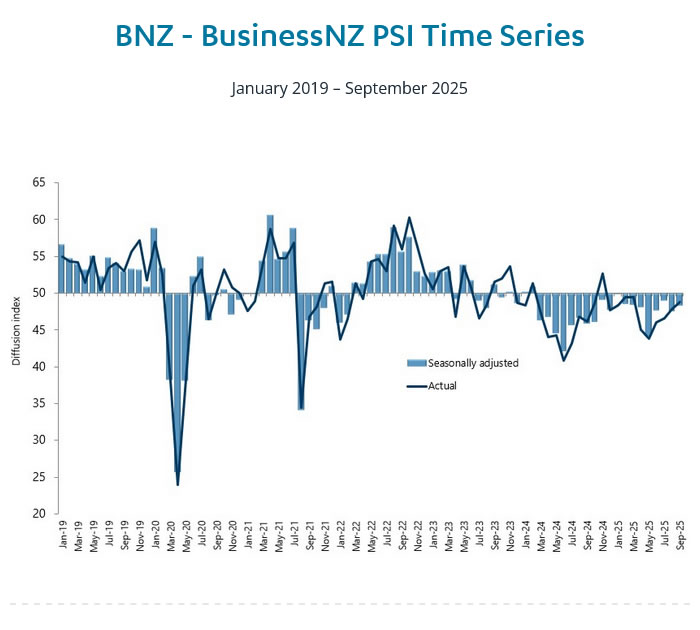
NZ BNZ services at 48.3, contracts for 19th month as signs of strain persist
New Zealand’s services sector remained mired in contraction in September, with BNZ Performance of Services Index edging up modestly from 47.6 to 48.3. While the improvement marks a slight lift in momentum, the index has now stayed below the 50-point expansion threshold for 19 consecutive months.
Activity and sales rose to 47.8, and new orders improved to 49.6, but both remained in negative territory. Employment slipped to 47.8, reflecting ongoing caution among firms facing soft sales and squeezed margins.
BNZ reported that 58% of survey comments were negative, only marginally below August’s 59.6%. Respondents cited weak consumer confidence, rising living costs, and reduced discretionary spending as key drags. Many businesses also noted clients delaying projects and contracts amid broader economic uncertainty.
Gold Breaks Record While Yen Slides After Japan’s Political Shift
It was a busy week in global markets. The Japanese yen weakened sharply after Sanae Takaichi won the ruling party leadership vote. In the U.S., the Federal Reserve’s meeting minutes showed that most officials support more interest rate cuts in 2025 because of a weaker job market. Fed Chair Jerome Powell said inflation is still too high to move faster, and the U.S. government shutdown continued with little market impact.
Gold surged above $4,000, hitting new record highs as investors rushed to safe assets. Central bank buying and expectations of easier global monetary policy helped keep the bull run going. The shutdown continues to delay major U.S. economic reports, including employment data, leaving traders with limited fresh information.
Markets were shocked on Friday when Donald Trump reignited the trade war with China. He announced a 100% tariff on all Chinese imports, on top of the existing 30%, starting November 1, 2025—or sooner if China escalates. The move was a response to China’s tighter export restrictions on rare earth materials, key components in electronics and technology manufacturing. All risk assets fell sharply after the announcement as traders rushed to exit positions and reduce exposure.
Markets This Week
U.S. Stocks
The Dow reversed all of its gains from the past two months last Friday after Donald Trump announced new tariffs on China, sparking heavy selling. Markets now hope Trump will strike a quick deal as he has in the past, but with U.S. equities still up strongly this year, more downside remains possible. Predicting Trump’s next move is difficult, but a short-term rebound could occur if the market holds above Friday’s lows. For medium-term traders, buying remains an option since prices are still above July’s record highs, though caution is advised—any new negative headlines could trigger fresh selling. Resistance is now at 46,000, 46,500, 47,000, and 48,000, with support at 45,000, 44,000, and 43,000.
Japanese Stocks
The Nikkei 225 is likely to come under pressure this week following Monday’s public holiday, as markets react to the U.S.–China trade war and growing political uncertainty after the Komeito Party’s exit from the LDP coalition. Given how far the index has risen recently, there is potential for further weakness if investors panic. In the short term, traders can look for intra-day opportunities in either direction, but with a bias toward selling on large moves. For medium-term traders, it’s best to avoid new buying positions for now and wait until there is progress on U.S.–China trade talks or the LDP forms a new coalition partner. Resistance is at 47,000円 and 48,000円, while support lies at 45,000円, 44,000円, and 43,500円.
USD/JPY
The USD/JPY jumped higher last week after Sanae Takaichi won the LDP leadership, as she is seen as dovish and supportive of more stimulus, reducing the chance of rate hikes in Japan. The yen weakened quickly, causing some concern among officials. Later in the week, renewed U.S.–China trade tensions led to a short sell-off, but the pair still finished with strong gains. With uncertainty over whether Takaichi will become prime minister, the market could stay volatile, and some further weakness is possible. Traders may look to buy around 150 with a small stop and sell above 152. Resistance is at 152 and 153, while support is at 150, 149, 148, and 146.
Gold
Gold extended its winning streak, surging above $4,000 as investors continued to buy it as an alternative to holding U.S. dollars. Just when it seemed the market had reached a temporary peak, Trump’s announcement of new tariffs on China pushed prices back above $4,000 again. Looking for higher levels remains the best strategy as long as prices stay above the 10-day moving average. However, there could be short-term selling opportunities if Trump reaches a deal with China and prices drop below the moving average. Resistance is now at $4,100 and $4,200, while support stands at $4,000, $3,900, and $3,800.
Crude Oil
WTI crude fell below $60 support as renewed U.S.–China trade tensions raised concerns about global growth and future oil demand. With the dispute unlikely to be resolved quickly, WTI is expected to stay under pressure, with the next target near $55. For now, selling into strength below the downward-sloping moving average looks like the best strategy. Key resistance is at $60, $66.5, $70, and $75, while support lies at $55 and $50.
Bitcoin
After reaching record highs early in the week on expectations of lower U.S. interest rates, Bitcoin reversed sharply lower as U.S.–China trade tensions flared up again. The sell-off was quick and heavy, bringing prices back to the lows from August 2025. In the short term, Bitcoin may see a rebound as long as the market holds above key support at $107,000. Resistance is at $117,000, $120,000, and $125,000, while support stands at $107,000, $105,000, and $100,000.
This Weeks Focus Image
This Week’s Focus
- Monday: China Trade Balance, U.S. Construction Spending
- Tuesday: Australia RBA Meeting Minutes, U.K. Unemployment Rate, E.U. ZEW Economic Sentiment, U.S. Fed Chair Powell Speaks
- Wednesday: China CPI and PPI, Japan Industrial Production, E.U. Industrial Production, U.S. CPI, NY Empire State Manufacturing Index and Beige Book
- Thursday: Australia Unemployment Rate, U.K. GDP, Industrial Production and Trade Balance, E.U. Trade Balance, U.S. PPI, Retail Sales and Business Inventories
- Friday: E.U. CPI, U.S. Building Permits, Housing Starts and Industrial Production
This week could be very volatile as markets watch how China reacts and whether Donald Trump can reach a deal or if this is the start of the trade war investors have feared all year. Japanese politics will also draw attention as the ruling party looks for partners to stay in power. In the U.S., important data such as inflation and retail sales will be released, giving clues about the next Fed rate cut and likely causing big moves in currencies, stocks, and commodities.
AUDUSD Wave Analysis
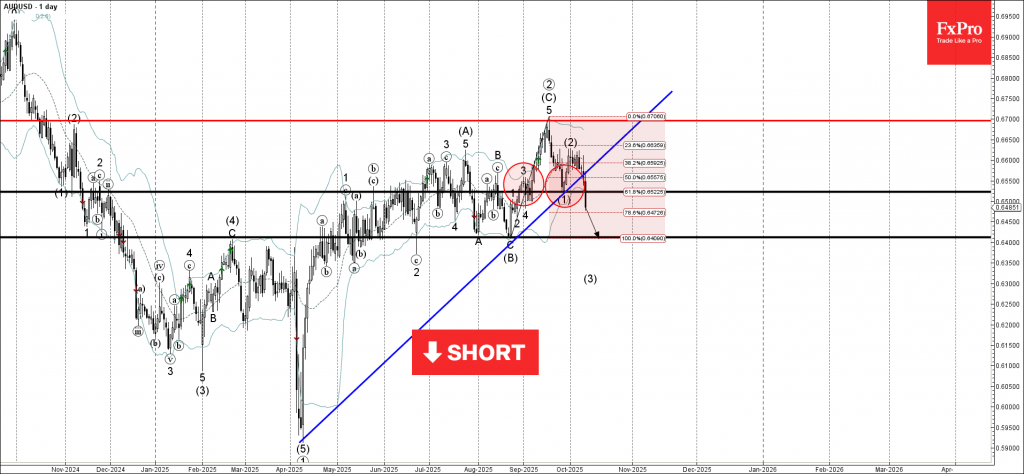
AUDUSD: ⬇️ Sell
- AUDUSD broke support level 0.6525
- Likely to fall to support level 0.6410
AUDUSD currency pair recently broke the support zone between the support level 0.6525 (low of wave (1) from September), 61.8% Fibonacci correction of the upward impulse (C) from August and the support trendline from April.
The breakout of this support zone accelerated the active intermediate impulse wave (3).
Given the strongly bullish US dollar sentiment seen today, AUDUSD currency pair can be expected to fall to the next support level 0.6410 (former low of wave (B) from August).
NZDUSD Wave Analysis
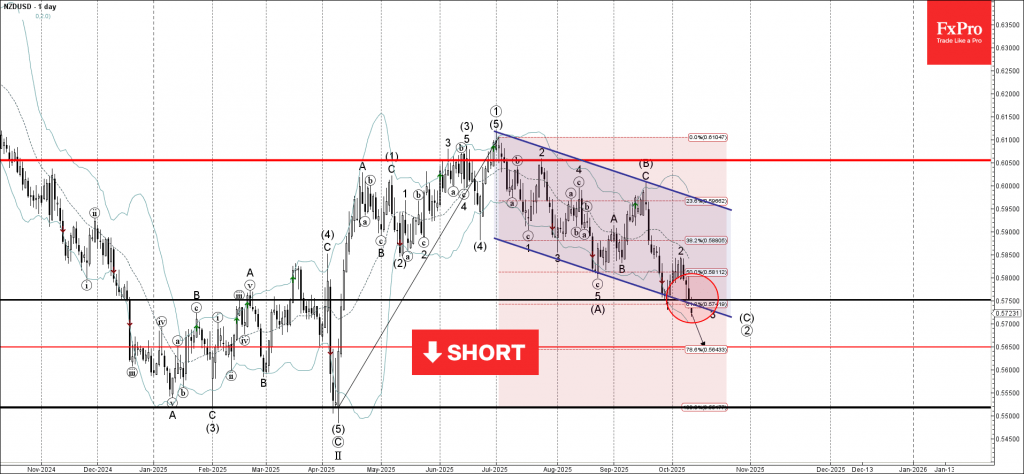
NZDUSD: ⬇️ Sell
- NZDUSD broke support zone
- Likely to fall to support level 0.5660
NZDUSD currency pair recently broke the support zone between the support level 0.5750 (which reversed the price in September) and the support trendline of the daily down channel from June.
The breakout of this support zone should accelerate the active impulse waves 3 and (C).
NZDUSD currency pair can be expected to fall to the next support level 0.5660 (target price for the completion of the active impulse wave (C)).
Dow Jones Index Wave Analysis
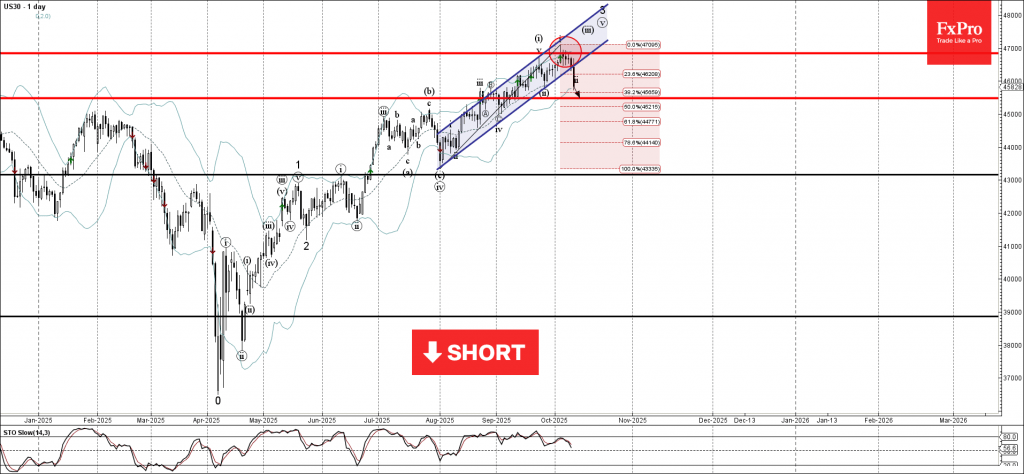
Dow Jones index: ⬇️ Sell
- Dow Jones index broke daily up channel from
- Likely to fall to support level 45470.00
Dow Jones index recently broke the daily up channel from end of July – which was preceded by the downward reversal from the key resistance level 46775.00 (former monthly high from last month).
The breakout of this up channel from accelerated the active short-term downward correction ii from the start of October from resistance level 46775.00.
Given the strength of the resistance level 46775.00 and the bearish divergence on the daily Stochastic indicator, Dow Jones index can be expected to fall to the next support level 45470.00 (target price for the completion of the active correction (ii)).