Sample Category Title
Trade War Shock Roils Markets in a Politically Charged Week
It was a week dominated by politics — both domestic and international — as shifting power dynamics and fresh policy risks rippled through global markets. In Japan, optimism surged after Sanae Takaichi’s victory in the ruling LDP leadership race, clearing the way for her to become the country’s first female prime minister. Investors welcomed her Abenomics-style agenda of fiscal stimulus and pro-growth policies, propelling the Nikkei to record highs. At same time, Yen plunged sharply, prompting verbal intervention from officials worried about “one-sided” market moves.
Takaichi’s early momentum was tested as the LDP’s long-time coalition partner, Komeito, abruptly withdrew support after failed negotiations, citing unresolved issues over a political funding scandal. Still, Komeito's move should be seen as a tactical standoff rather than a lasting rupture. Given the backing for Takaichi from senior LDP figures such as former Prime Minister Taro Aso, the expectation remains that she will secure parliamentary approval later this month.
Across Europe, France’s political crisis deepened. President Emmanuel Macron reappointed Sébastien Lecornu as prime minister—just days after his resignation—hoping the loyalist can rally enough support to pass a 2026 budget through a fractured legislature. Markets remain skeptical, however: another failure could trigger snap elections, heightening fiscal uncertainty and weighing on the Euro.
Meanwhile in the Middle East, the long-awaited ceasefire in Gaza was finally implemented after Israel approved the first phase of a peace deal involving the withdrawal of troops and a hostage-prisoner exchange. The agreement sent WTI crude below 60, its lowest since May, as geopolitical risk premiums unwound.
Yet all of these developments were ultimately overshadowed by a late-week shock from Washington. US President Donald Trump reignited the U.S.–China trade war, announcing plans for 100% tariffs on all Chinese imports starting Nov 1 and threatening to impose sweeping export controls. The escalation triggered a sharp sell-off in U.S. equities and a flight into Treasuries, erasing weeks of calm.
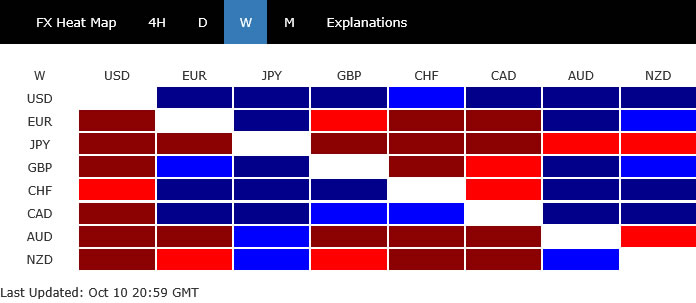
By week’s end, Dollar reigned as the strongest major currency, followed by the Loonie—lifted by robust Canadian jobs data, and Swiss Franc. At the bottom, Yen’s collapse left it the weakest performer, though the worst may be over after recent intervention talk, and risk-off bounce. Aussie and Kiwi lagged amid risk aversion, while Euro and Sterling held mid-table.
Trump’s 100% Tariff Threat Reignites Full-Scale US–China Trade War Fears
The week’s closing hours were dominated by sharp escalation in U.S.–China tensions. In a surprise announcement late Friday, Trump said the U.S. will impose 100% tariffs on all Chinese imports starting November 1, “over and above any tariff that they are currently paying.” Trump further declared that export controls will be applied on “any and all critical software” from the same date, signaling a widening scope of decoupling beyond physical goods.
The move marks a return to hardline trade policy, undoing months of tentative diplomatic progress and rattling financial markets already uneasy over the ongoing U.S. government shutdown.
The escalation came after Beijing introduced new controls on rare earth exports earlier in the week, requiring foreign entities to obtain licenses to export goods containing even trace amounts of strategic minerals. Trump accused China of holding the world “captive” through its dominance in these materials and said the U.S. would no longer tolerate this economic blackmail.
The shift was abrupt. Earlier in the week, Trump had been expected to meet Chinese President Xi Jinping at the upcoming APEC summit in South Korea, but he later suggested the meeting would be canceled. The announcement effectively swept away expectations for a trade deal, sparking heavy risk aversion across global markets.
Wall Street responded violently. The DOW dropped nearly 2%, the S&P 500 lost 2.7%, and the NASDAQ plunged 3.6%—its steepest decline since early summer. Treasury yields tumbled as investors rushed into safe-haven assets, with the 10-year yield breaking below 4.1%.
The renewed confrontation came against a backdrop of growing domestic dysfunction. The U.S. government shutdown, now stretching into its 10th day, showed no signs of resolution after repeated failed Senate votes. Reports that federal worker layoffs had begun added to investor unease about near-term economic disruption.
By the week’s end, markets were again on full alert: the risk of a full-blown trade and fiscal crisis is now back on the table, and its impact will likely dictate global market direction in the days ahead
NASDAQ Hit Hard by Tariff Shock, 55-Day EMA Crucial to Keeping Uptrend Intact
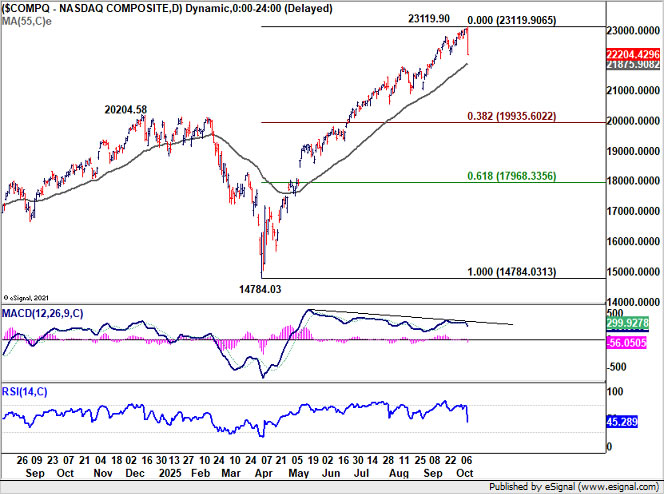
NASDAQ’s record-setting rally came to an abrupt pause on Friday as the index tumbled -3.56% from its all-time high of 23,119.90, hit earlier in the session. While the magnitude of the drop was striking, the broader structure remains bullish—no decisive break of key trend levels has occurred yet.
For now, 55 D EMA at 21,875.90 serves as the immediate line of defense. Strong bounce from that region would preserve the index’s near term bullishness, suggesting that Friday’s selloff was a temporary reaction to geopolitical shocks rather than the start of a prolonged downturn.
However, considering bearish divergence condition in D MACD, sustained break of 55 D EMA will indicate that a medium term top has already formed. Fall from 23,119.90 would then be seen as correcting whole rise from 14,784.03. Deeper decline would be seen back to 20k psychological level, which is close to both 20,204.58 resistance turned support and 38.2% retracement of 14,784.03 to 23,119.90 at 19,935.60.
U.S. 10-Year Yield Slides as Safe-Haven Demand Surges
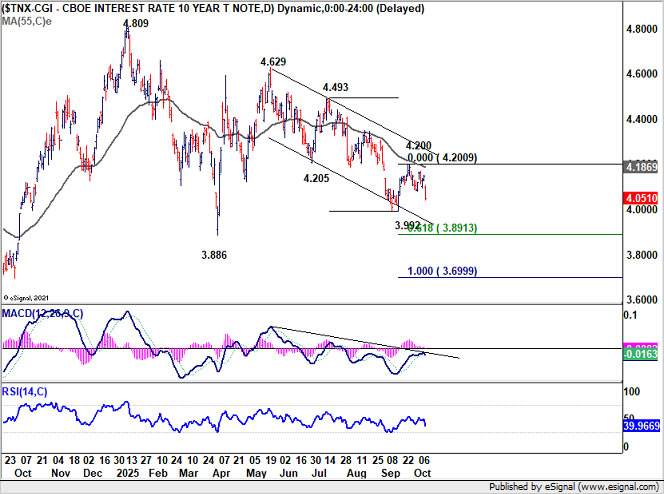
The recovery in U.S. 10-year yields proved short-lived, with the benchmark ending the week sharply lower at 4.051, as investors rushed back into bonds amid renewed trade tensions and equity market turbulence. The move erased nearly all of last week’s recovery and reaffirmed that the downtrend remains firmly intact.
Technically, the yield continues to trade well below falling 55 D EMA (now at 4.186%) and comfortably within the descending channel that has guided the decline since May. Further fall should be seen to retest 3.992 low first, and break there will target 61.8% projection of 4.493 to 3.992 from 4.200 at 3.891 next.
Dollar Index Extends Rebound as EUR/USD Struggles Below 1.20 Barrier
Dollar Index extended the rebound from 96.21 last week, climbing to 98.97. Technically, current rise is still viewed as correcting the five wave decline from 110.17 (2025 high). As long as support holds at 97.47, further upside is expected toward 100.25 resistance and possibly above.
Though, significant hurdles remain higher up at 38.2% retracement of 110.17 to 96.21 at 101.54. Strong resistance could emerge there to limit upside to complete the corrective bounce.
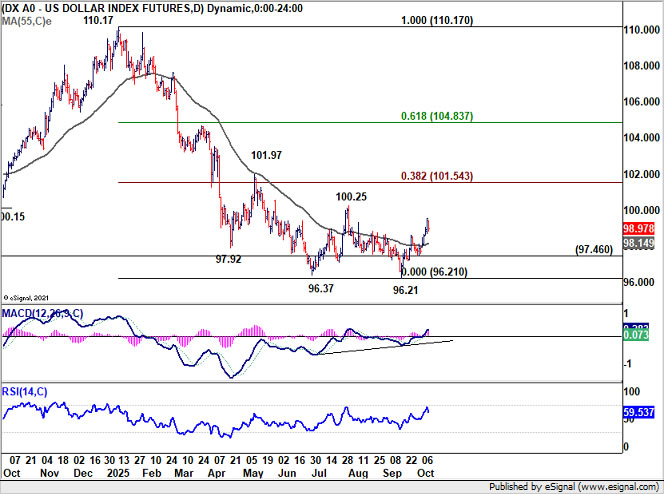
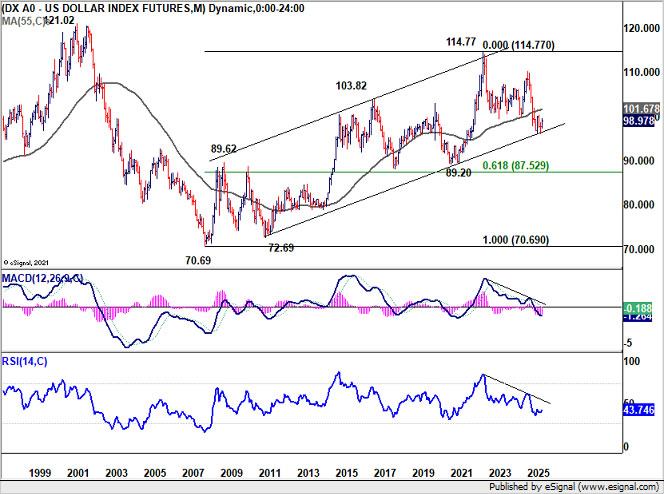
However, it should be emphasized that Dollar Index continues to draw background support from its long-term rising trend channel that defines the multi-decade rise from 2008 low at 70.69. Hence, it cannot be ruled out that Dollar Index is at the onset of medium-term bullish reversal.
The strength of the current rally in Dollar Index would ultimately depending on whether EUR/USD's current rejection by 1.2000 psychological level will turn into a medium term bearish trend reversal, or just a corrective pullback.
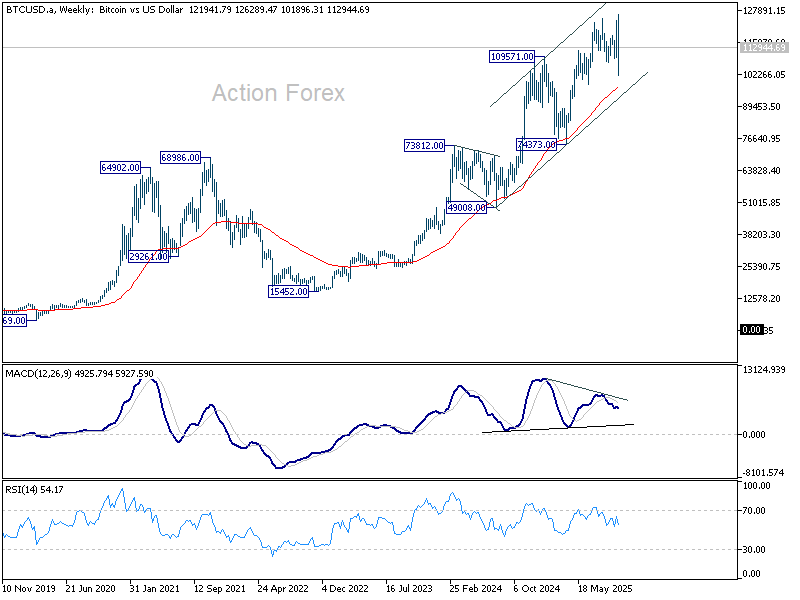
Bitcoin Hit Hard, 100K Level Becomes Crucial Battle Line
The late development also sparked violent moves in the cryptocurrencies markets. Bitcoin was no exception. Bitcoin extended the plunge from its recent record high of 126,289 to as low as 101,896, before stabilizing into the weekend.
So far, the selloff is seen as a correction within to the broader five-wave uptrend that started from 74,373 (March low). There should be some support around 100k psychological level to contain downside to set the range for consolidations.
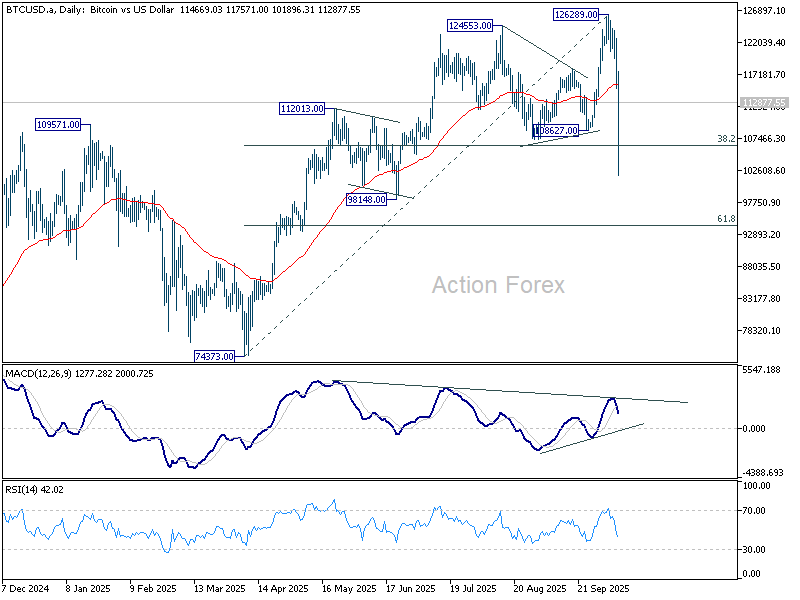
However, it should be emphasized that sustained break of 55 W EMA (now at 96831) will argue that Bitcoin is indeed correcting the whole up trend from 15452 (2022 low). In this bearish case, Bitcoin could dive further to 74373 support before finding a bottom.
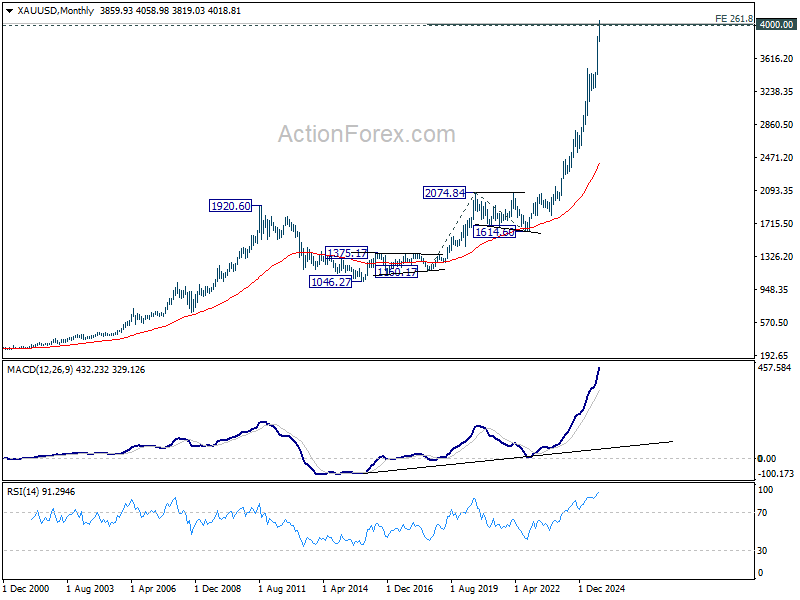
Gold Pauses at 4000 in Calm Despite Heightened Market Turmoil
Gold’s record-breaking surge above 4,000 has given way to a quieter tone, with the precious metal showing little reaction to Friday’s sharp risk-off wave. The lack of follow-through suggests that bids may have run its course, at least temporarily, as traders lock in profits.
Technically, Gold has met a major target zone, reaching 261.8% projection of 1160.17 to 2074.84 from 1614.60 at 4009.20. The rally’s parabolic nature leaves it vulnerable to profit-taking, and the immediate focus now turns to 3819.03, where a break would confirm that a short-term top is in place. Deeper pullback could then follow toward 55 D EMA (now at 3625.49).
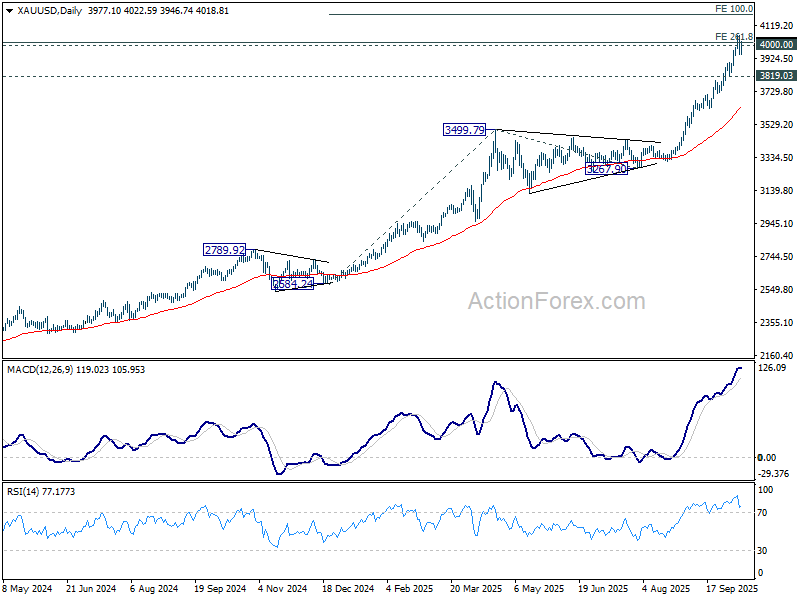
Another brief extension higher cannot be totally ruled out. But stiff resistance is expected below 100% projection of 2584.24 to 3499.79 from 3267.90 at 4183.45 to limit upside and bring the overdue correction.
Focus will remain emergence of topping signals ahead.
EUR/USD Weekly Outlook
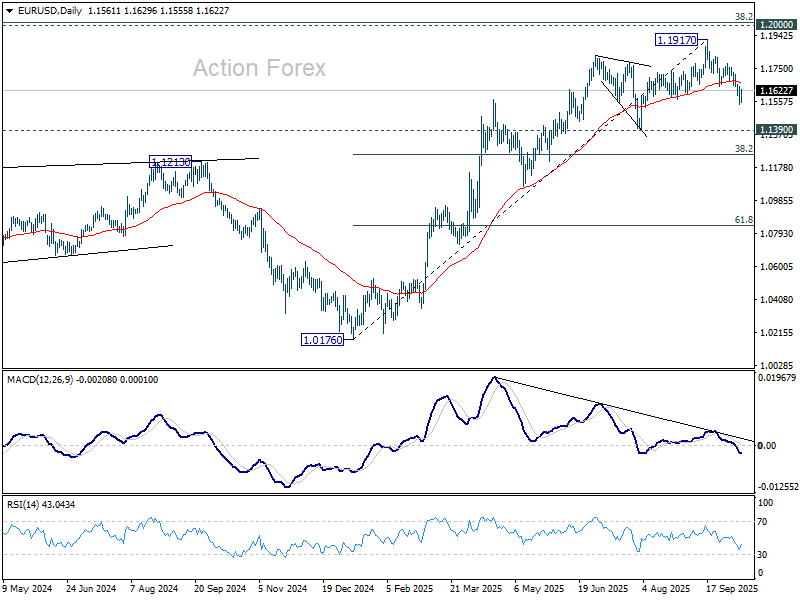
EUR/USD's fall from 1.1917 resumed last week, but recovered after hitting 1.1540. Initial bias is turned neutral this week for consolidations. Deeper decline is expected as long as 1.1778 resistance holds. Below 1.1540 will target 1.1390 support or further to 38.2% retracement of 1.0176 to 1.1917 at 1.1252.
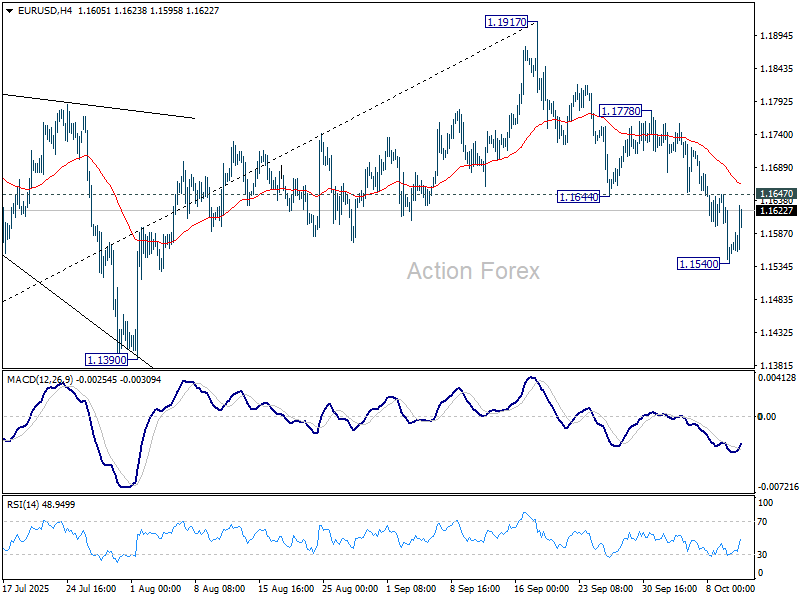
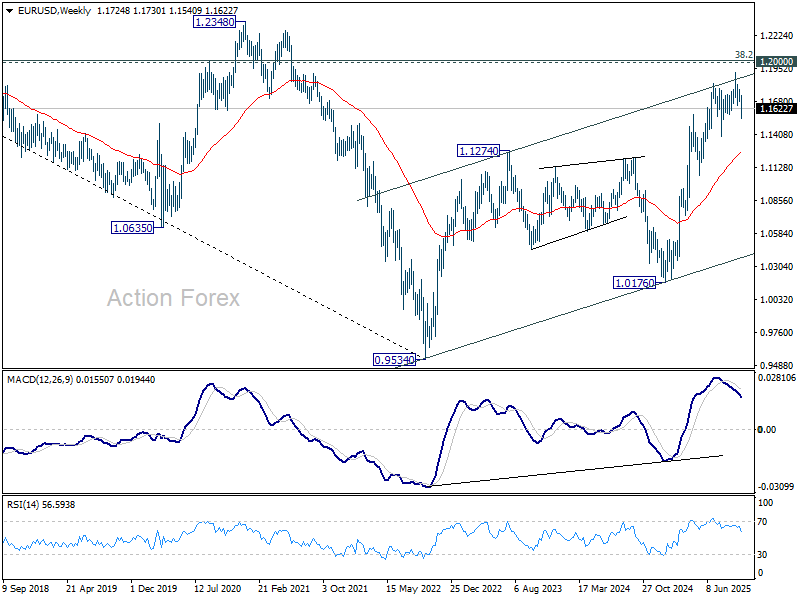
In the bigger picture, considering bearish divergence condition in D MACD, a medium term top is likely in place at 1.1917, just ahead of 1.2 key psychological level. As long as 55 W EMA (now at 1.1247) holds, the up trend from 0.9534 (2022 low) is still extended to continue. Decisive break of 1.2000 will carry larger bullish implications. However, sustained trading below 55 W EMA will argue that rise from 0.9534 has completed as a three wave corrective bounce, and keep outlook bearish.
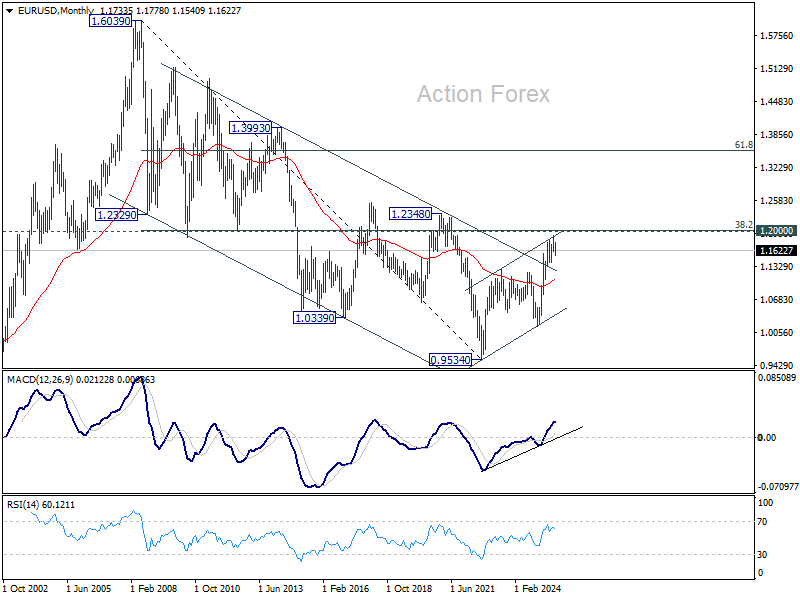
In the long term picture, 38.2% retracement of 1.6039 to 0.9534 at 1.2019, which is close to 1.2000 psychological level is the key for the outlook. Rejection by this level will keep the multi decade down trend from 1.6039 (2008 high) intact, and keep outlook neutral at best. However, decisive break of 1.2000/19, will suggest long term bullish trend reversal, and target 61.8% retracement at 1.3554.
EUR/USD Weekly Outlook
EUR/USD's fall from 1.1917 resumed last week, but recovered after hitting 1.1540. Initial bias is turned neutral this week for consolidations. Deeper decline is expected as long as 1.1778 resistance holds. Below 1.1540 will target 1.1390 support or further to 38.2% retracement of 1.0176 to 1.1917 at 1.1252.
In the bigger picture, considering bearish divergence condition in D MACD, a medium term top is likely in place at 1.1917, just ahead of 1.2 key psychological level. As long as 55 W EMA (now at 1.1247) holds, the up trend from 0.9534 (2022 low) is still extended to continue. Decisive break of 1.2000 will carry larger bullish implications. However, sustained trading below 55 W EMA will argue that rise from 0.9534 has completed as a three wave corrective bounce, and keep outlook bearish.
In the long term picture, 38.2% retracement of 1.6039 to 0.9534 at 1.2019, which is close to 1.2000 psychological level is the key for the outlook. Rejection by this level will keep the multi decade down trend from 1.6039 (2008 high) intact, and keep outlook neutral at best. However, decisive break of 1.2000/19, will suggest long term bullish trend reversal, and target 61.8% retracement at 1.3554.
USD/JPY Weekly Outlook
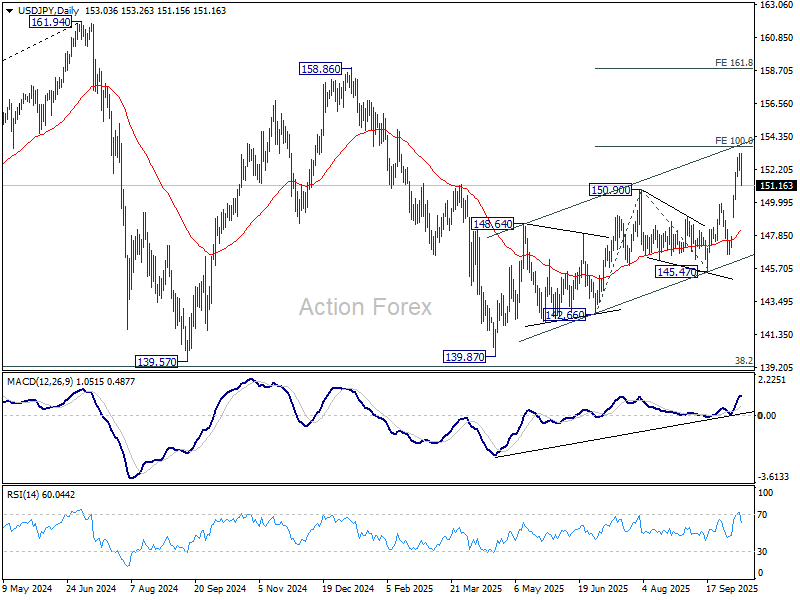
USD/JPY surged sharply to as high as 153.26 last week but retreated from there. Initial bias stays neutral for consolidations, and downside should be contained above 149.95 resistance turned support. Break of 153.26 will target 100% projection of 142.66 to 150.90 from 145.47 at 153.71. Firm break there will pave the way to 161.8% projection at 158.80. However, decisive break of 149.95 will bring deeper pullback to 55 D EMA (now at 148.22) instead.
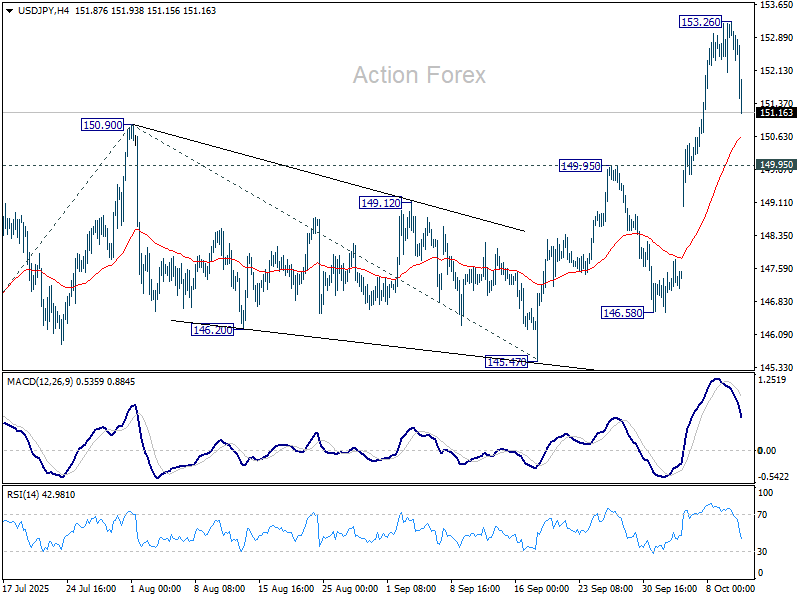
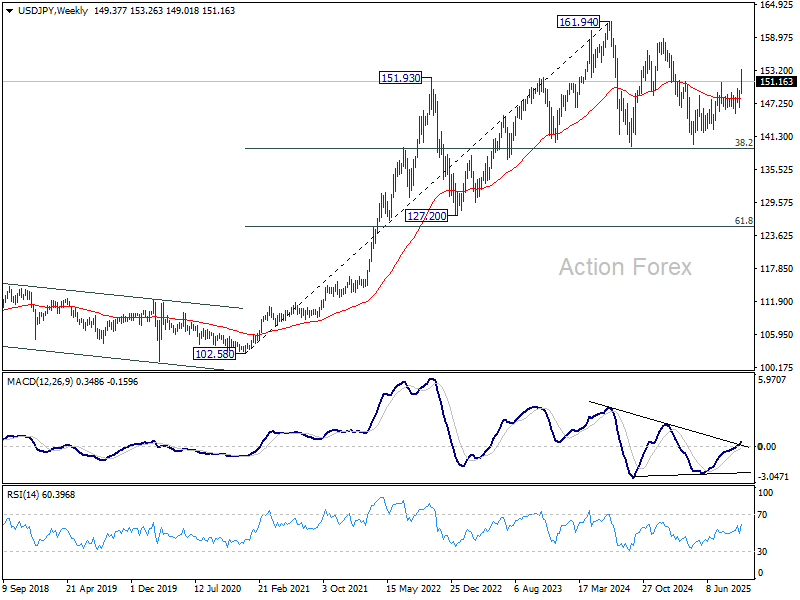
In the bigger picture, current development suggests that corrective pattern from 161.94 (2024 high) has completed with three waves at 139.87. Larger up trend from 102.58 (2021 low) could be ready to resume through 161.94 high. On the downside, break of 145.47 support will dampen this bullish view and extend the corrective pattern with another falling leg.
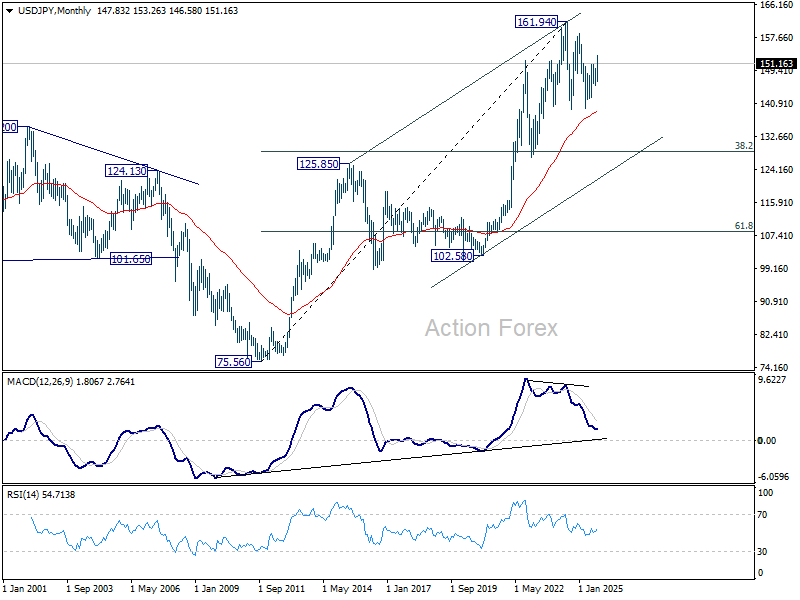
In the long term picture, there is no sign that up trend from 75.56 (2011 low) has completed. But then, firm break of 161.94 is needed to confirm resumption. Otherwise, more medium term range trading could still be seen.
GBP/USD Weekly Outlook
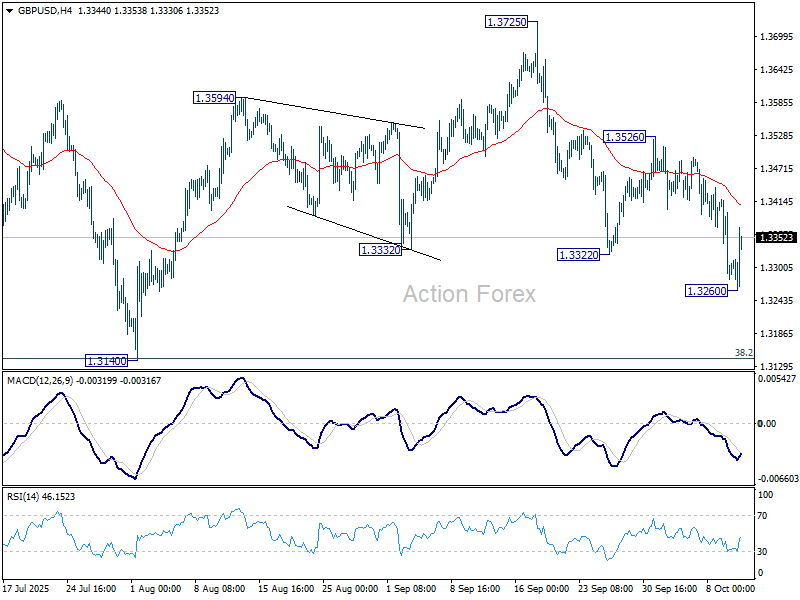
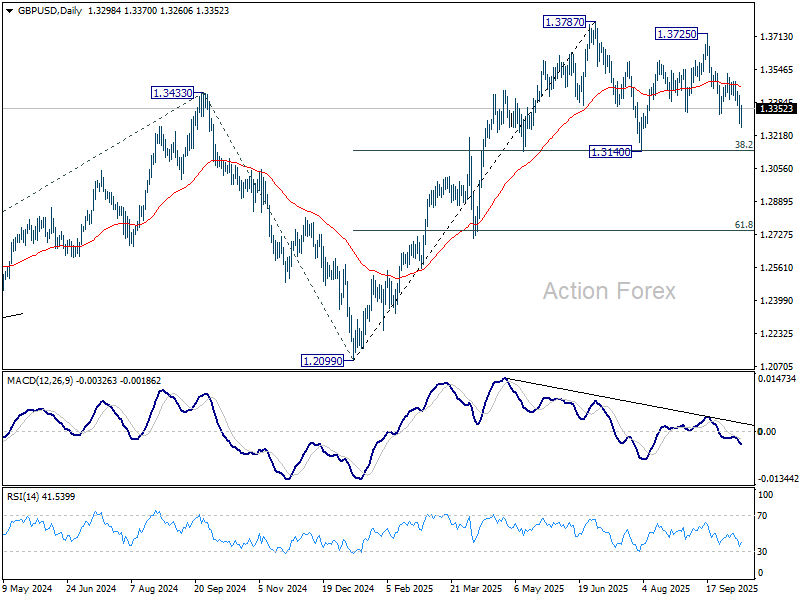
GBP/USD's fall from 1.3725 resumed last week but recovered after hitting 1.3260. Initial bias is turned neutral this week first. Overall outlook is unchanged that corrective pattern from 1.3787 is extending. Below 1.3260 will bring deeper decline but strong support should be seen from 1.3140 cluster (38.2% retracement of 1.2099 to 1.3787 at 1.3142) to contain downside. On the upside, break of 1.3526 will bring stronger rally back to retest 1.3728/87 resistance zone.
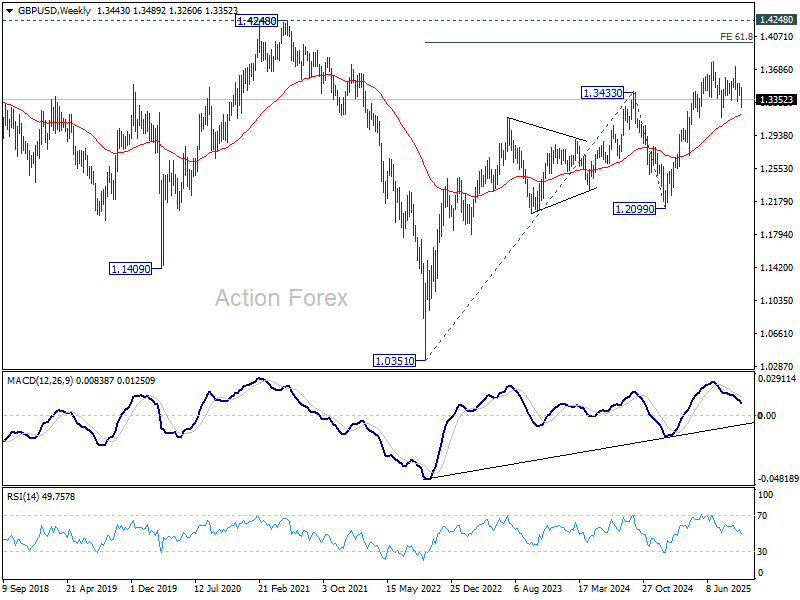
In the bigger picture, rise from 1.0351 (2022 low) is still seen as a corrective move. Further rally could be seen to 61.8% projection of 1.0351 to 1.3433 (2024 high) from 1.2099 (2025 low) at 1.4004. But strong resistance could emerge from 1.4248 (2021 high) to limit upside. Sustained break of 55 W EMA (now at 1.3173) will argue that a medium term top has already formed and bring deeper fall back to 1.2099.
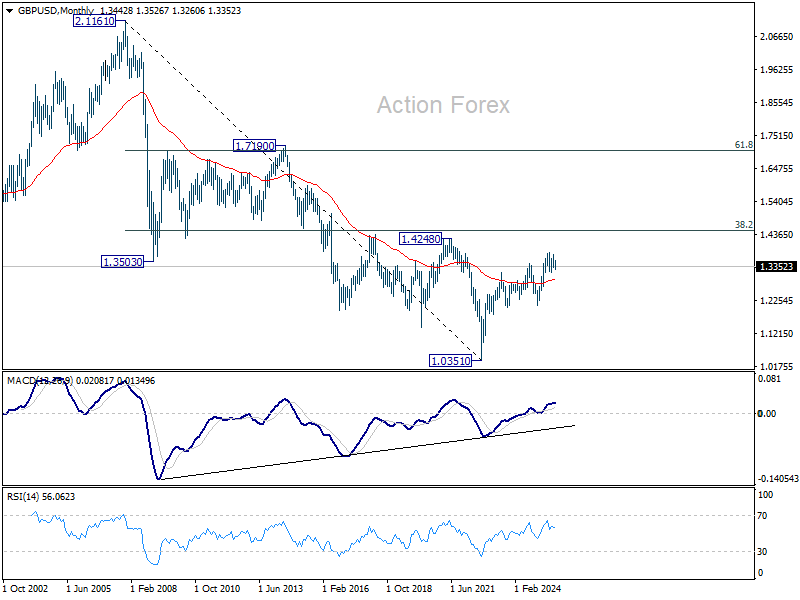
In the long term picture, as long as 1.4248/4480 resistance holds (38.2% retracement of 2.1161 to 1.0351 at 1.4480), the long term outlook will remain bearish. That is, price actions from 1.3051 are seen as a corrective pattern to the long term down trend from 2.1161 (2007 high) only. Nevertheless, decisive break of 1.4248/4480 will be a strong sign of long term bullish reversal.
USD/CHF Weekly Outlook
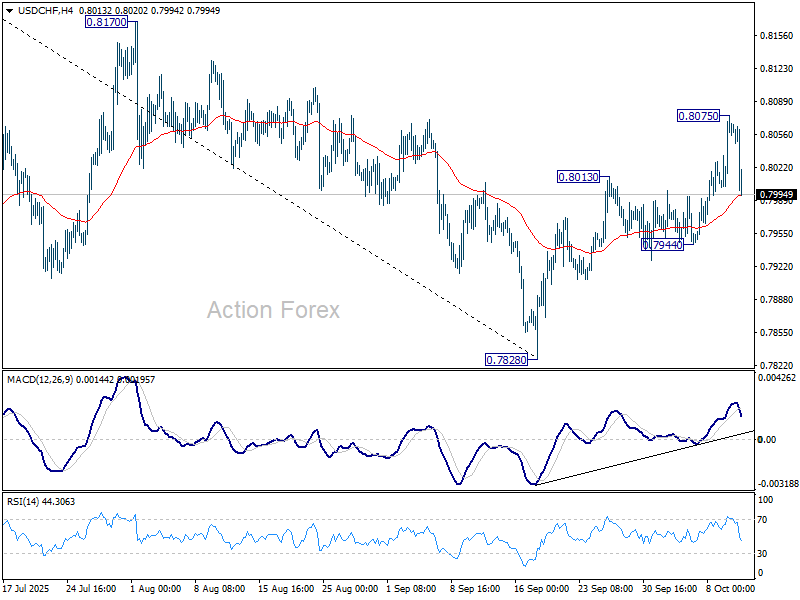
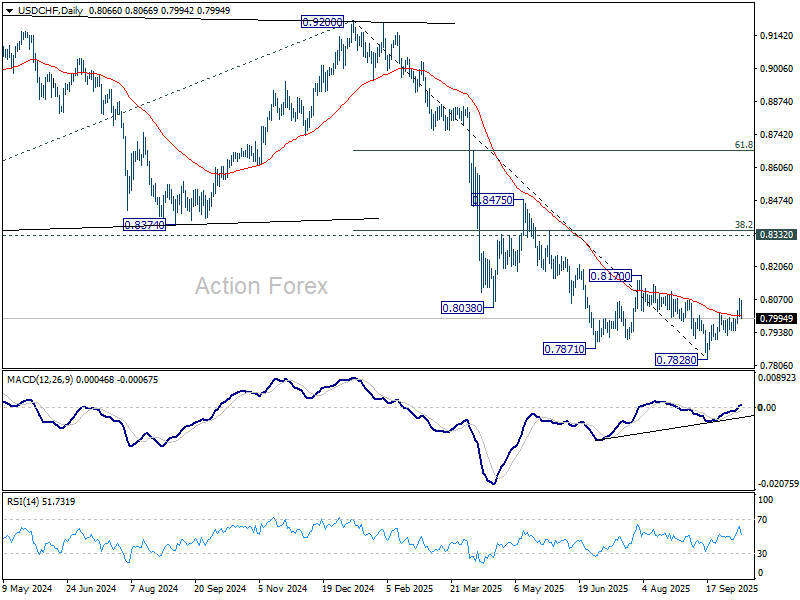
USD/CHF's rebound from 0.7828 resumed last week, but retreated after hitting 0.8075. Initial bias is turned neutral this week first. Price actions from 0.7828 are currently seen as correcting whole fall from 0.9200. Above 0.8075 will target 0.8170 resistance next. On the downside, though, break of 0.7944 support will bring retest of 0.7828 low.
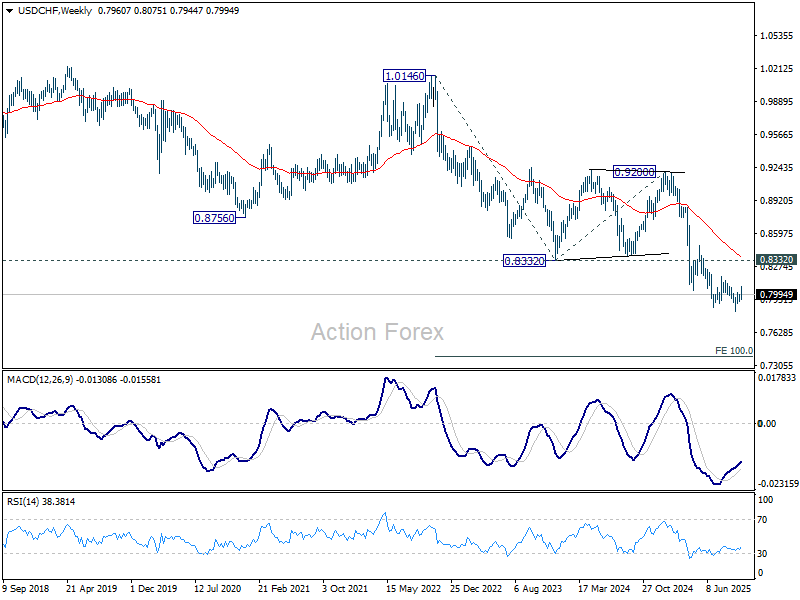
In the bigger picture, long term down trend from 1.0342 (2017 high) is still in progress. Next target is 100% projection of 1.0146 (2022 high) to 0.8332 from 0.9200 at 0.7382. In any case, outlook will stay bearish as long as 0.8332 support turned resistance holds (2023 low).
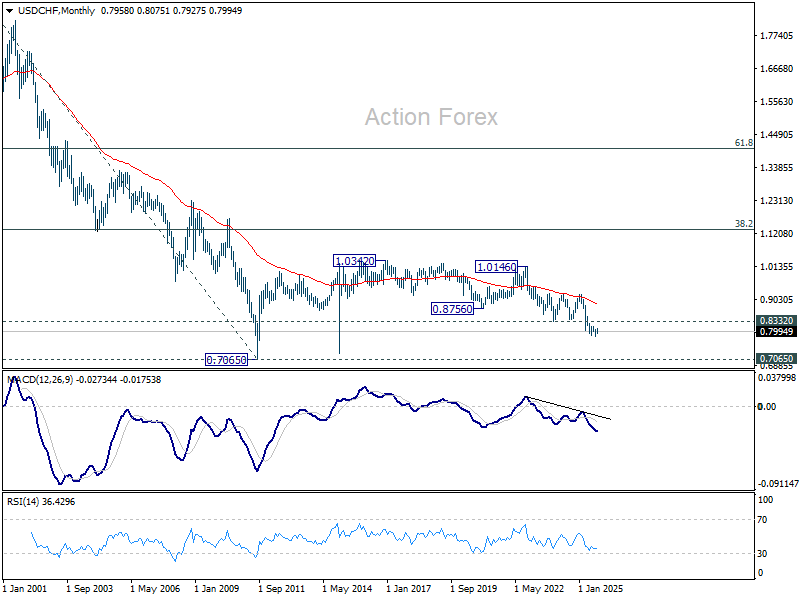
In the long term picture, price action from 0.7065 (2011 low) are seen as a corrective pattern to the multi-decade down trend from 1.8305 (2000 high). It's uncertain if the fall from 1.0342 is the second leg of the pattern, or resumption of the downtrend. But in either case, outlook will stay bearish as long as 0.8756 support turned resistance holds (2021 low). Retest of 0.7065 should be seen next.
AUD/USD Weekly Report
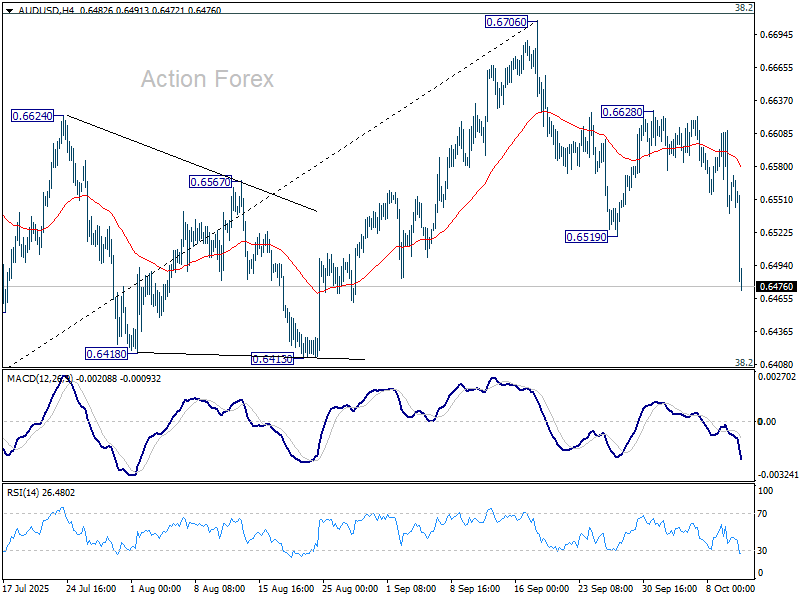
AUD/USD's fall from 0.6706 resumed last week by late break of 0.6519 support. Current development suggests rejection by 0.6713 fibonacci resistance. Initial bias is back on the downside this week for 0.6413 cluster support (38.2% retracement of 0.5913 to 0.6706 at 0.6403). For now, risk will stay on the downside as long as 0.6628 resistance holds, in case of recovery.
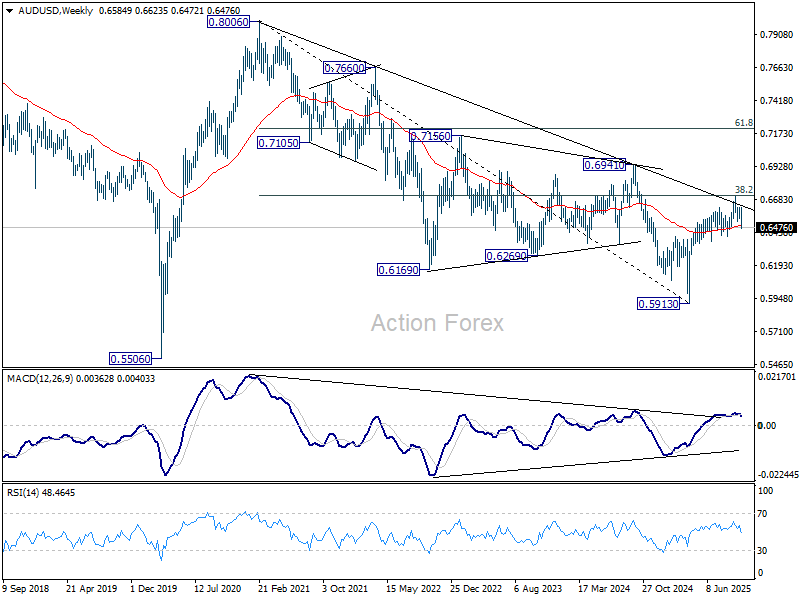
In the bigger picture, there is no clear sign that down trend from 0.8006 (2021 high) has completed. Rebound from 0.5913 is seen as a corrective move. Outlook will remain bearish as long as 38.2% retracement of 0.8006 to 0.5913 at 0.6713 holds. Nevertheless, considering bullish convergence condition in W MACD, sustained break of 0.6713 will be a strong sign of bullish trend reversal, and pave the way to 0.6941 structural resistance for confirmation.
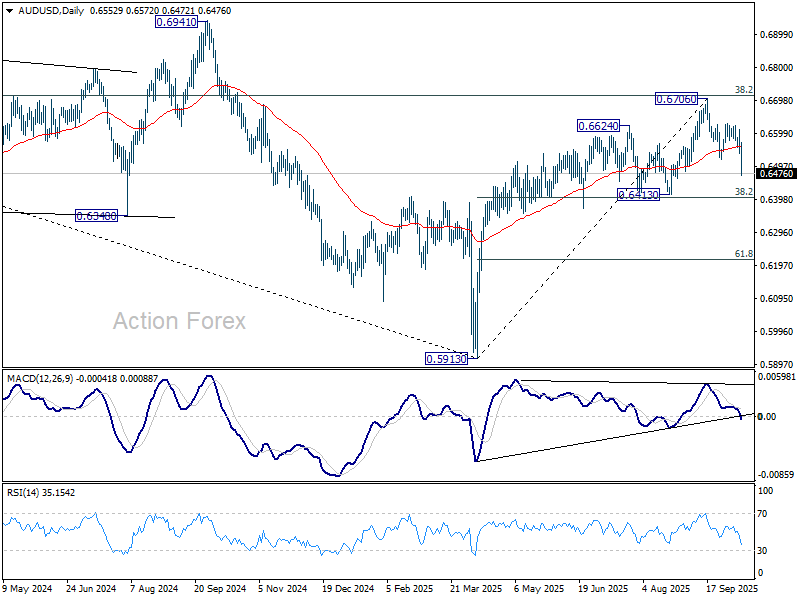
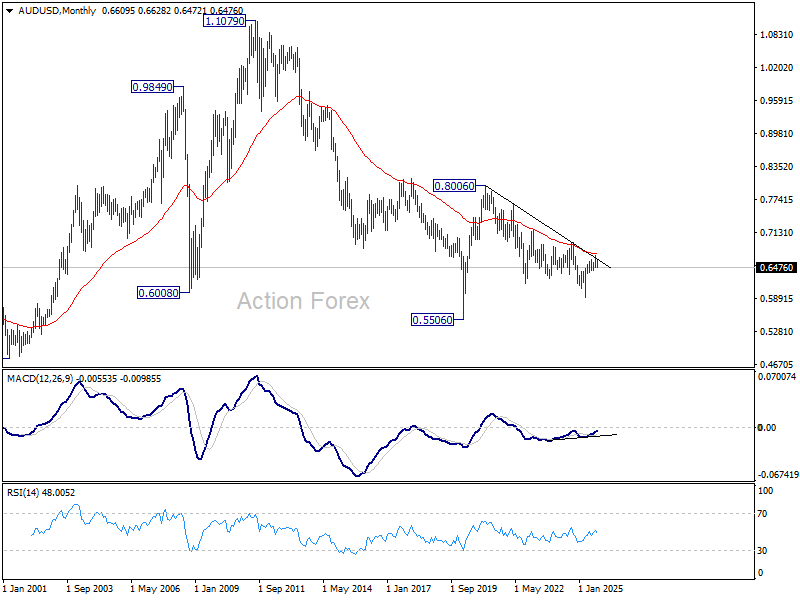
In the long term picture, fall from 0.8006 is seen as the second leg of the corrective pattern from 0.5506 long term bottom (2020 low). Hence, in case of deeper decline, strong support should emerge above 0.5506 to contain downside to bring reversal. On the upside, firm break of 0.6941 will argue that the third leg has already started back to 0.8006.
USD/CAD Weekly Outlook
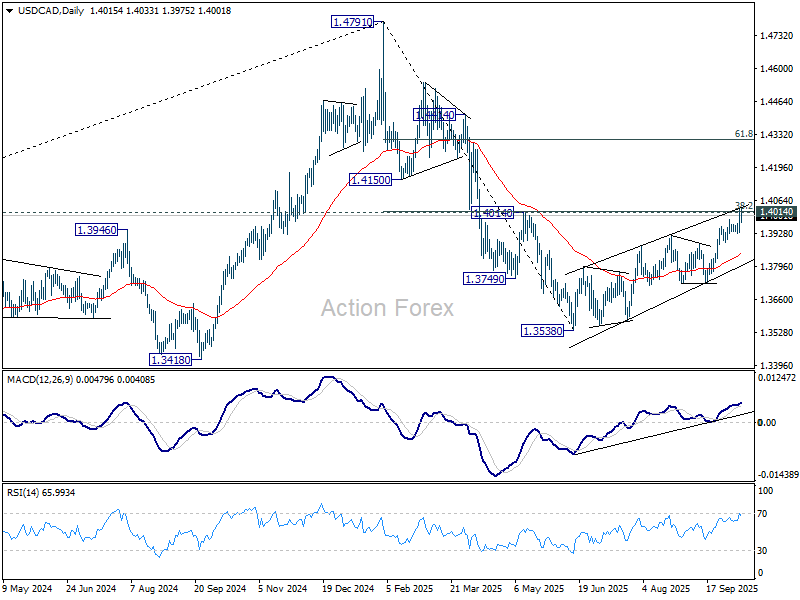
USD/CAD's rise from 1.3538 resumed last week and reached as high as 1.4033. However, it couldn't sustain above 1.4014/7 key cluster resistance and retreated. Initial bias remains neutral this week first. On the upside, sustained break of 1.4014/7 will suggest that USD/CAD is already reversing the whole fall from 1.4719, and target 61.8% retracement at 1.4312. On the downside, firm break of 1.3930 support will indicate rejection by 1.4014/7 cluster resistance. That would keep the rebound from 1.3538 corrective, and turn bias to the downside for 1.3725 support.
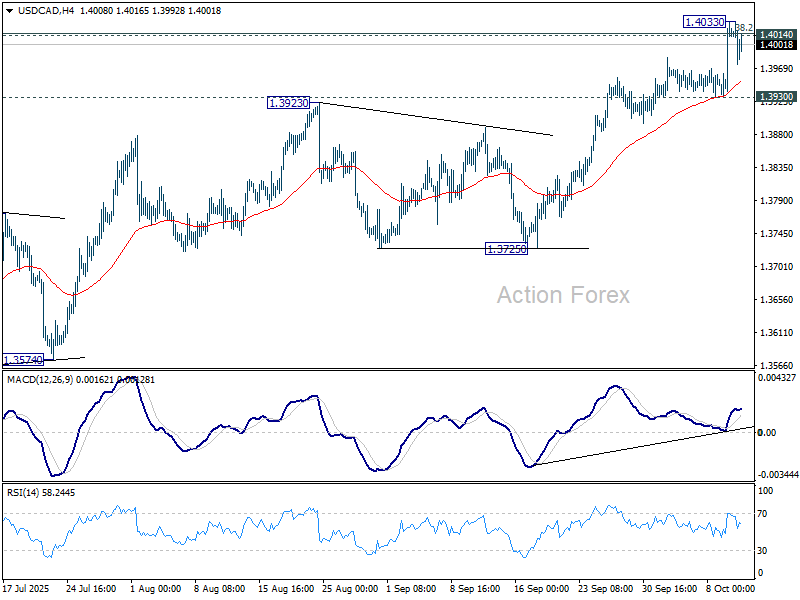
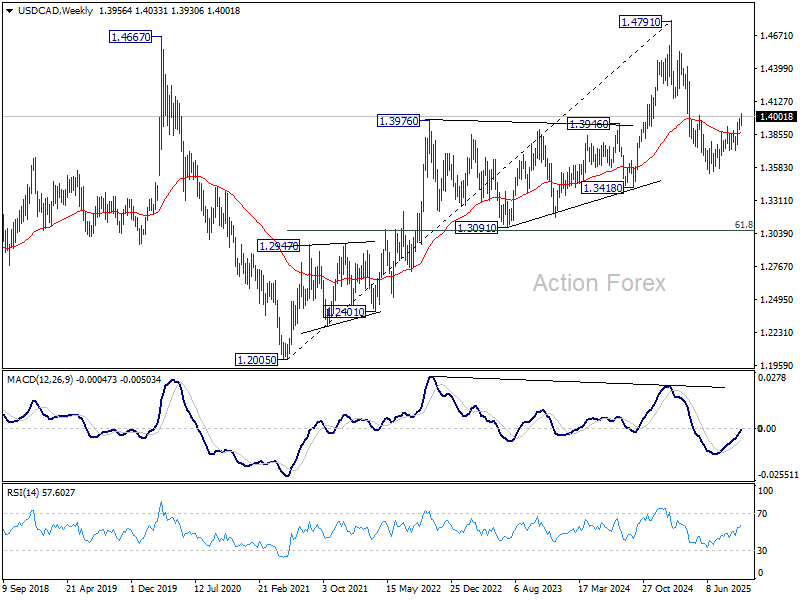
In the bigger picture, price actions from 1.4791 medium term top could either be a correction to rise from 1.2005 (2021 low), or trend reversal. In either case, further decline is expected as long as 1.4014 cluster resistance (38.2% retracement of 1.4791 to 1.3538 at 1.4017) holds. However sustained trading above 1.4014 will suggest that it's more likely just a correction, and the larger up trend would be in favor to resume through 1.4791 at a later stage.
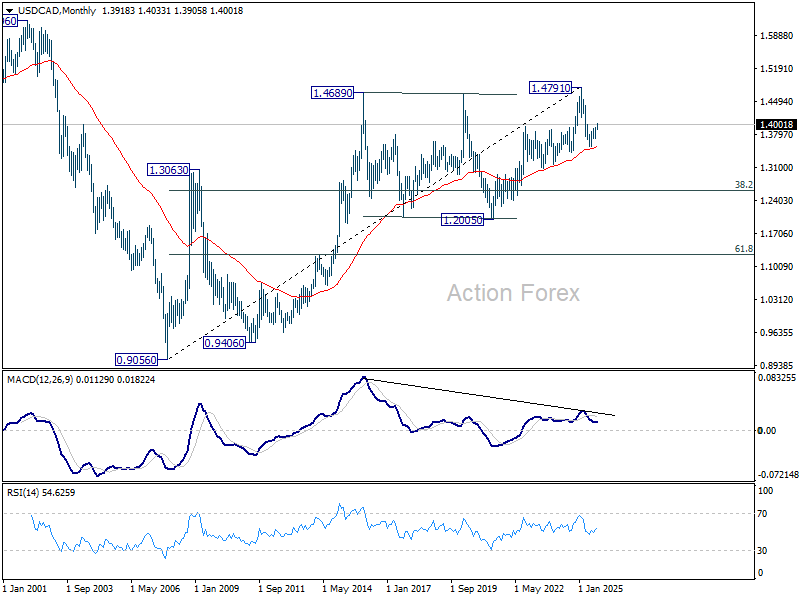
In the long term picture, considering bearish divergence condition in M MACD, up trend from 0.9506 (2027 low) might have completed with five waves up to 1.4791. Sustained trading below 55 M EMA (now at 1.3542) will solidify this case and bring deeper medium term fall to 38.2% retracement of 0.9056 to 1.4791 at 1.2600, even as a correction. Nevertheless, strong rebound from the 55 M EMA will retain bullishness for up trend resumption through 1.4791 later.
GBP/JPY Weekly Outlook
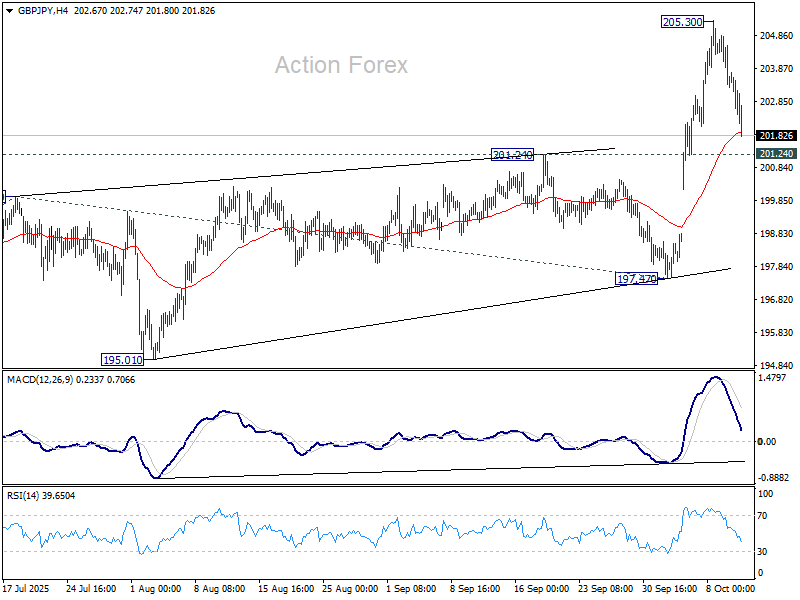
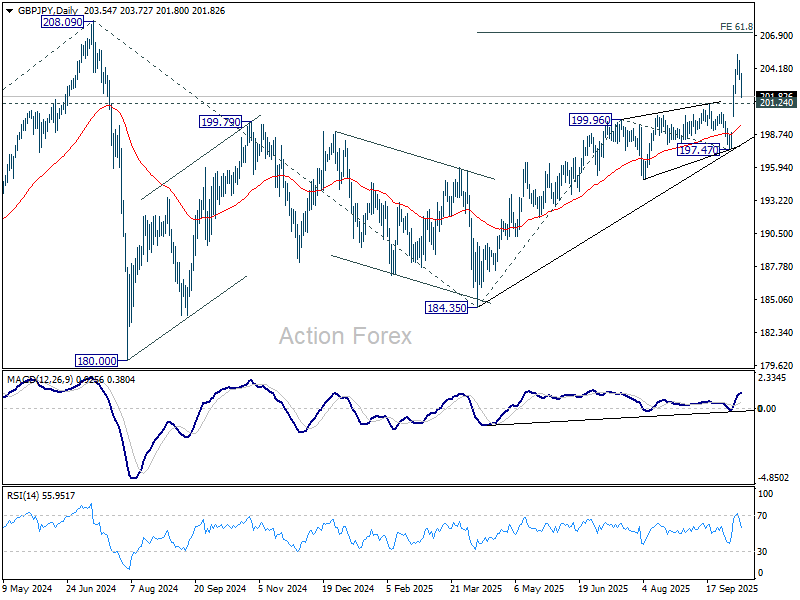
GBP/JPY's rally resumed last week and surged to as high as 205.30, but retreated sharply since then. With 201.24 resistance turned support intact, initial bias remains neutral this week and further rally is still in favor. Break of 205.30 will target 61.8% projection of 184.35 to 199.96 from 197.47 at 207.11. However, firm break of 201.24 will confirm short term topping and bring deeper fall back to 197.47 support instead.
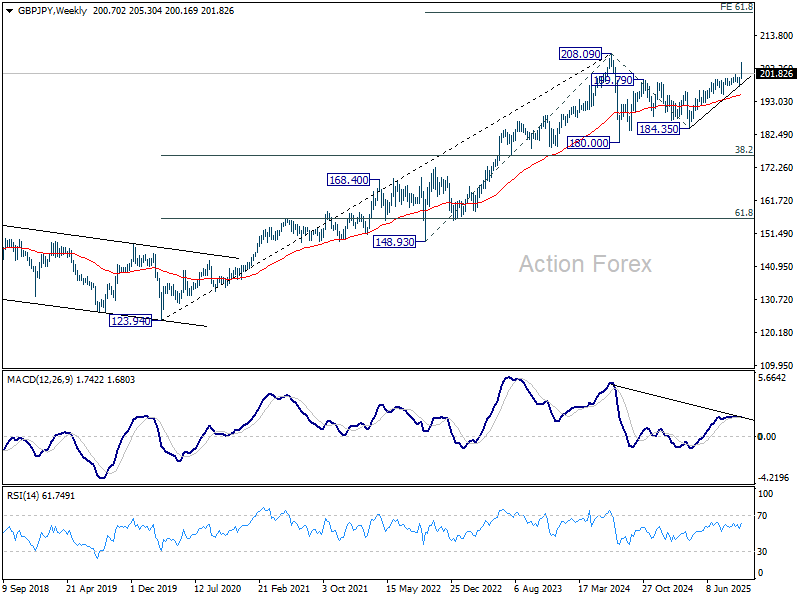
In the bigger picture, price actions from 208.09 (2024 high) are seen as a corrective pattern which might have completed at 184.35. Firm break of 208.09 high will resume the up trend from 123.94 (2020 low). Next target is 61.8% projection of 148.93 to 208.09 from 184.35 at 220.90. However, firm break of 197.47 will dampen this view and could extend the corrective pattern with another fall.
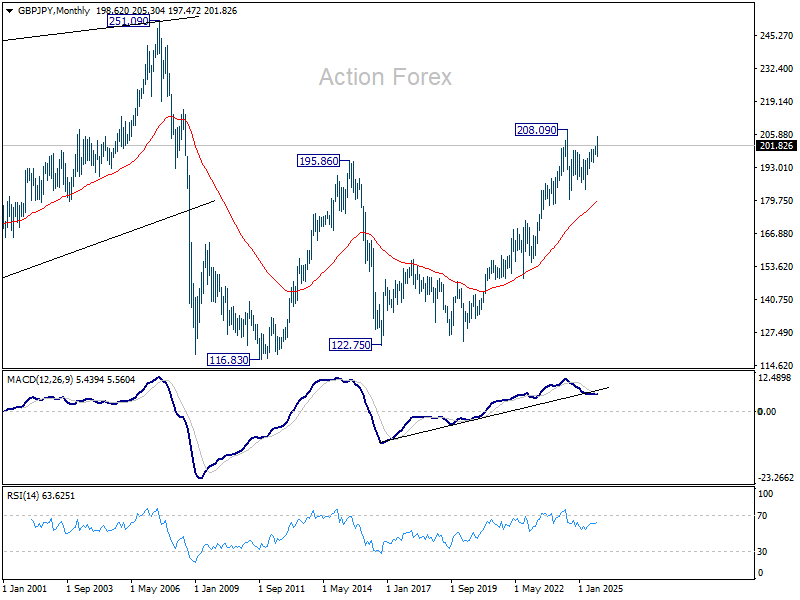
In the long term picture, there is no sign that the long term up trend from 122.75 (2016 low) has concluded. But firm break of 208.09 is needed to confirm resumption. Otherwise, more medium term range trading could still be seen.
EUR/JPY Weekly Outlook
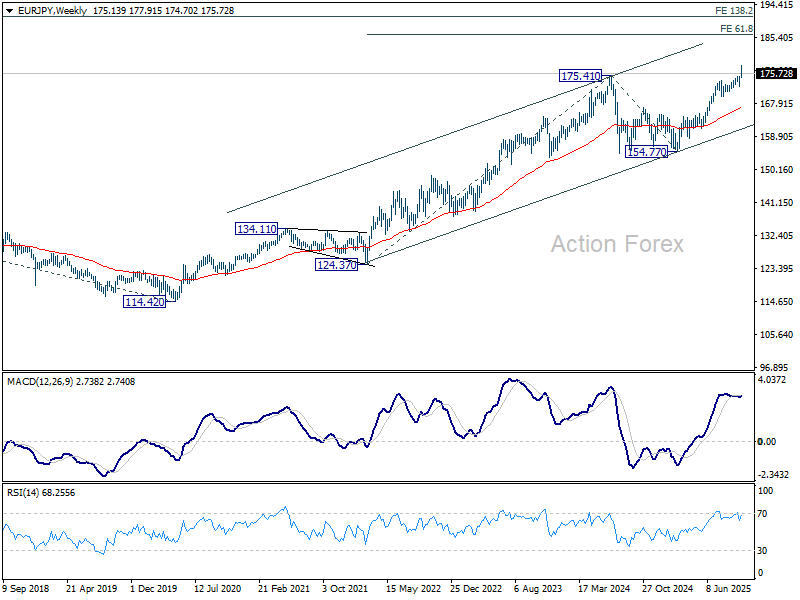
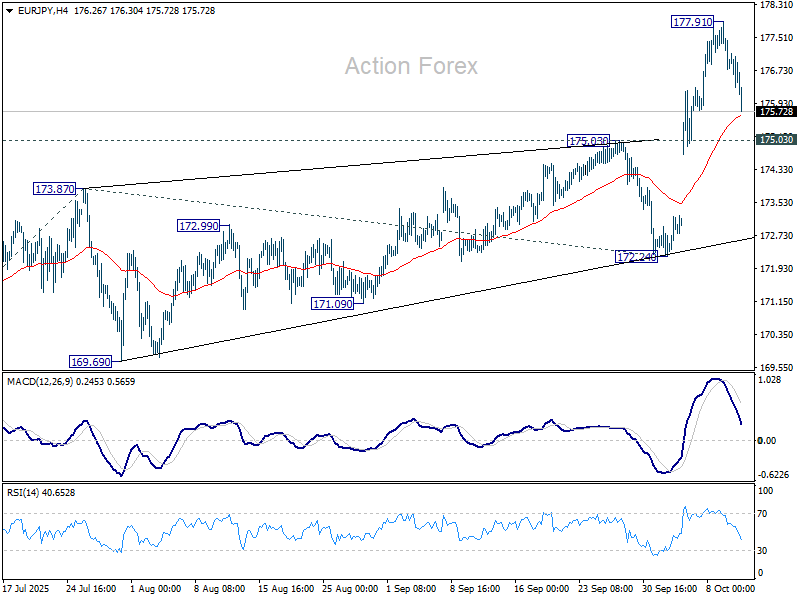
EUR/JPY's up trend resumed last week and surged to as high as 177.91, but retreated sharply since then. Though, downside is contained above 175.03 resistance turned support. Initial bias stays neutral this week and another rise remains in favor. On the upside, break of 177.91 will target 61.8% projection of 161.06 to 173.87 from 172.24 at 180.15 next. However, firm break of 175.03 will confirm short term topping and bring deeper fall back to 172.24 support.
In the bigger picture, up trend from 114.42 (2020 low) is in progress and should target 61.8% projection of 124.37 to 175.41 from 154.77 at 186.31. Firm break of 172.24 support will suggests that it has turned into consolidations again. But still, outlook will continue to stay bullish as long as 55 W EMA (now at 166.82) holds, even in case of deep pullback.
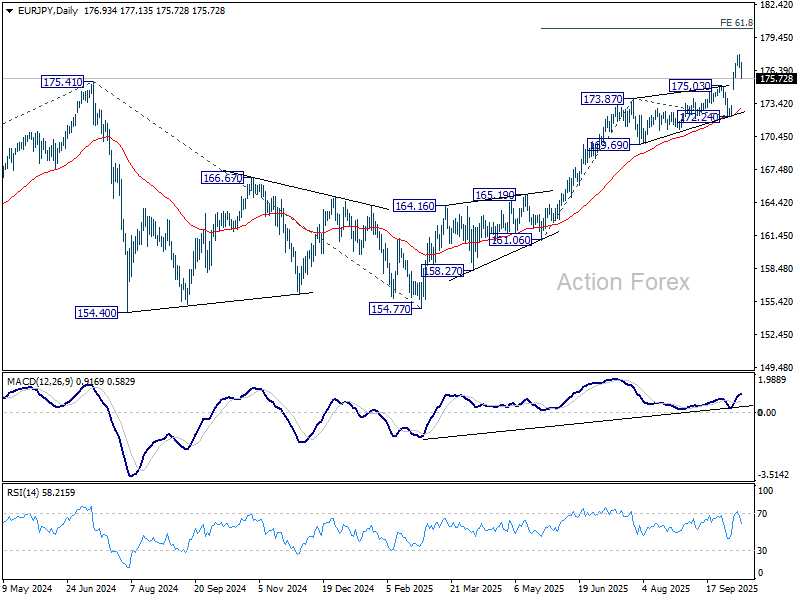
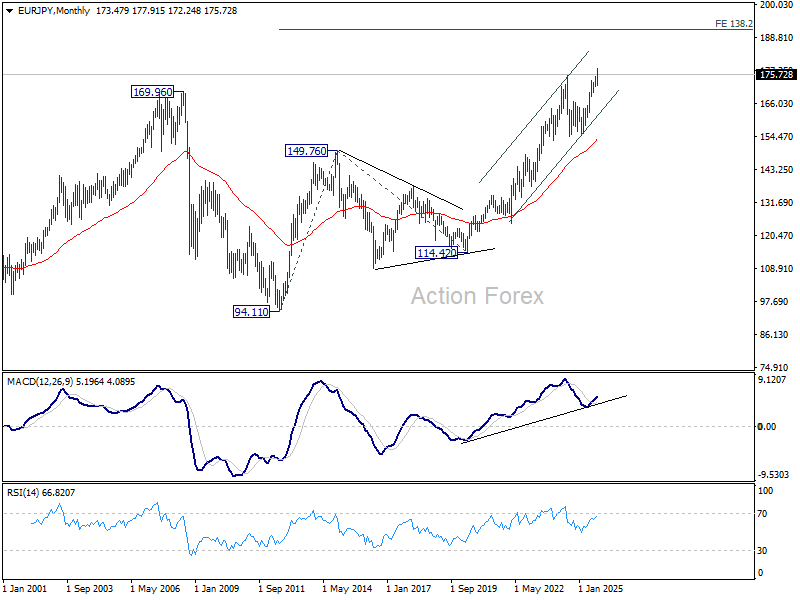
In the long term picture, up trend from 94.11 (2021 low) is in progress. Next target is 138.2% projection of 94.11 to 149.76 (2014 high) from 114.42 (2020 low) at 191.32. This will remain the favored case as long as 154.77 support holds.