Sample Category Title
Ethereum Wave Analysis
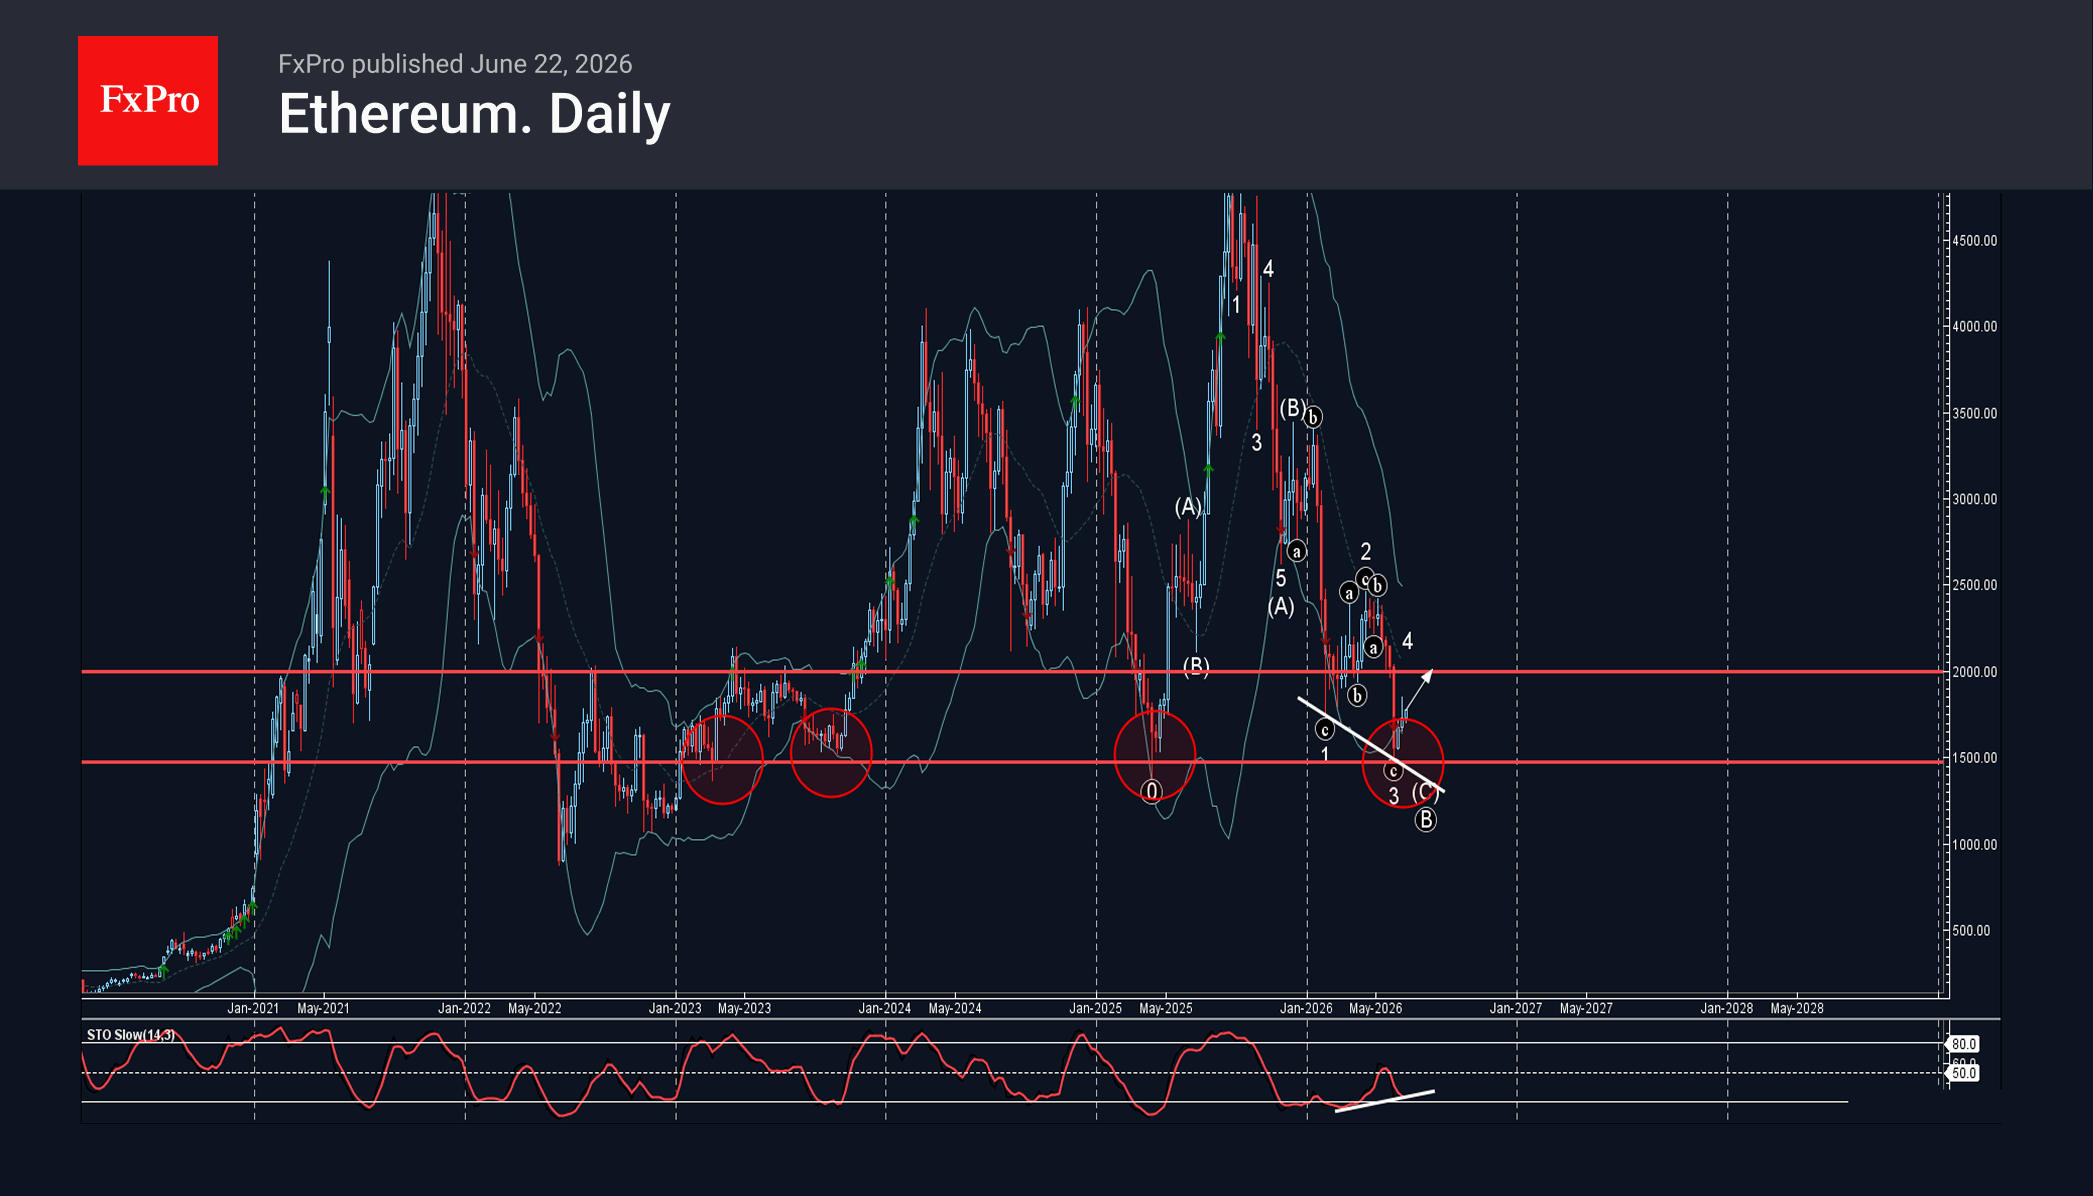
Ethereum: ⬆️ Buy
– Ethereum reversed from support zone
– Likely to rise to resistance level 2000.00
Ethereum cryptocurrency recently reversed from the support zone between the round support level 1500.00 (former powerful support from May) and the lower daily Bollinger Band.
The upward reversal from the support level 1500.00 stopped the previous short-term impulse wave 3.
Given the strength of the support level 1500.00 and the bullish divergence on the daily Stochastic indicator, Ethereum can be expected to rise to the next round resistance level 2000.00.
Eco Data 6/23/26
| GMT | Ccy | Events | Act | Cons | Prev | Rev |
|---|---|---|---|---|---|---|
| 23:00 | AUD | Manufacturing PMI Jun P | 51.2 | 50.7 | ||
| 23:00 | AUD | Services PMI Jun P | 49.9 | 48.7 | ||
| 00:30 | JPY | Manufacturing PMI Jun P | 54.9 | 54.5 | 54.5 | |
| 00:30 | JPY | Services PMI Jun P | 51.8 | 50 | ||
| 07:15 | EUR | France Manufacturing PMI Jun P | 50.7 | 50.4 | 49.7 | |
| 07:15 | EUR | France Services PMI Jun P | 47.4 | 45.9 | 44.3 | |
| 07:30 | EUR | Germany Manufacturing PMI Jun P | 50 | 50.2 | 50.1 | |
| 07:30 | EUR | Germany Services PMI Jun P | 46.8 | 48.7 | 48.1 | |
| 08:00 | EUR | Eurozone Manufacturing PMI Jun P | 51.3 | 51.2 | 51.6 | |
| 08:00 | EUR | Eurozone Services PMI Jun P | 48.9 | 48.1 | 47.7 | |
| 08:30 | GBP | Manufacturing PMI Jun P | 53.1 | 53.6 | 53.9 | |
| 08:30 | GBP | Services PMI Jun P | 48.7 | 50 | 49.3 | |
| 13:45 | USD | Manufacturing PMI Jun P | 55.7 | 54.6 | 55.1 | |
| 13:45 | USD | Services PMI Jun P | 51.3 | 51.1 | 50.7 |
| 23:00 | AUD |
| Manufacturing PMI Jun P | |
| Actual | 51.2 |
| Consensus | |
| Previous | 50.7 |
| 23:00 | AUD |
| Services PMI Jun P | |
| Actual | 49.9 |
| Consensus | |
| Previous | 48.7 |
| 00:30 | JPY |
| Manufacturing PMI Jun P | |
| Actual | 54.9 |
| Consensus | 54.5 |
| Previous | 54.5 |
| 00:30 | JPY |
| Services PMI Jun P | |
| Actual | 51.8 |
| Consensus | |
| Previous | 50 |
| 07:15 | EUR |
| France Manufacturing PMI Jun P | |
| Actual | 50.7 |
| Consensus | 50.4 |
| Previous | 49.7 |
| 07:15 | EUR |
| France Services PMI Jun P | |
| Actual | 47.4 |
| Consensus | 45.9 |
| Previous | 44.3 |
| 07:30 | EUR |
| Germany Manufacturing PMI Jun P | |
| Actual | 50 |
| Consensus | 50.2 |
| Previous | 50.1 |
| 07:30 | EUR |
| Germany Services PMI Jun P | |
| Actual | 46.8 |
| Consensus | 48.7 |
| Previous | 48.1 |
| 08:00 | EUR |
| Eurozone Manufacturing PMI Jun P | |
| Actual | 51.3 |
| Consensus | 51.2 |
| Previous | 51.6 |
| 08:00 | EUR |
| Eurozone Services PMI Jun P | |
| Actual | 48.9 |
| Consensus | 48.1 |
| Previous | 47.7 |
| 08:30 | GBP |
| Manufacturing PMI Jun P | |
| Actual | 53.1 |
| Consensus | 53.6 |
| Previous | 53.9 |
| 08:30 | GBP |
| Services PMI Jun P | |
| Actual | 48.7 |
| Consensus | 50 |
| Previous | 49.3 |
| 13:45 | USD |
| Manufacturing PMI Jun P | |
| Actual | 55.7 |
| Consensus | 54.6 |
| Previous | 55.1 |
| 13:45 | USD |
| Services PMI Jun P | |
| Actual | 51.3 |
| Consensus | 51.1 |
| Previous | 50.7 |
Sunset Market Commentary
Markets
UK Prime Minister Keir Starmer announced to step down as leader of the Labour Party and Prime Minister. After his party lost big in the early May elections, the UK PM faced ever further erosion of political backing within his party. Last week, the main challenger to become PM, Andy Burnham, in a by-election obtained the Lower House seat necessary to formally start the procedure. PM Starmer took the inevitable conclusion. He today asked the party to open the nomination procedure for a new leadership with candidacies to be made between 9 and 16 July. However, chances for such a contest have declined substantially as one of the main opponents to rival Burnham, former health Secretary Wes Streeting, already gave his support to Burnham. In case of no contest, Burnham can be PM mid next month. The market reaction to the expected leadership change is benign even as Burnham initially was seen as open to more spending and potentially a less strict fiscal framework. UK yields after some volatility around Starmer's announcement even ease 4-5 bps. Sterling also reacts orderly, even constructive. After trading in the 0.8680 area early this morning, sterling returned to the EUR/GBP 0.863 area. Maybe markets draw some comfort that in case of no formal contest, chances/risks have declined for candidates to make 'costly promises'. We don't draw firm conclusions yet. The new UK PM anyway will face the same fiscal limits and market scrutiny as was the case for his predecessor.
US and EMU yields today show a divergent picture. US yield markets after being closed on Friday, gain 3-4 bps to at least partially catch up with Friday's rise in the EA. German yields at the same time are easing 4.5-2.5 bps in what we basically see as technically inspired trading. ECB president Lagarde before the EU Parliament repeated that more forceful action currently isn't needed and that the Bank is confident that inflation will return to target with appropriate monetary policy action. Headlines from the negotiations between the US and Iran give no clear market guidance. After a flaring up of tensions during the weekend (comments from President Trump; ongoing attacks between Israel and Hezbollah in Lebanon) Brent oil briefly jumped to $82 p/b just to ease back to currently at <$79 p/b as Iran indicated that mediators Qatar and Pakistan had facilitated 'major progress' in the talks. European equities show modest gains (EuroStoxx 50 +0.4%) US indices open little changed (S&P 500 +0.2%). Also no outsized moves in the major USD cross rates. At EUR/USD 1.143 and DXY 101, the US currency quite easily holds last week's gain as markets assess concrete Fed action as the MPC statement said it will deliver on its price stability mandate.
News & Views
A batch of Polish economic data for May largely surprised to the downside today and kept the zloty in the defensive, including against regional peers (CZK, HUF). EUR/PLN rose towards 4.27, on track for the highest close since early-April. Polish swap yields lose over 3 bps across the curve. Even so, money markets keep erring (slightly) to the side of policy rate hikes rather than cuts. Retail sales grew 4.4% y/y last month, up from 2.8% in April but well short of the 6.7% expected. Corrected for inflation, sales dropped 1.7% on a monthly basis (vs -0.9% consensus) coming after an 0.8% drop in April. Wages fell by 3.8% m/m, pulling up the annual reading from April's five-year low (of 5.4%) to a less than anticipated 5.8%. Labour market data printed more or less in line with consensus but offered little reasons to cheer. Employment dropped 0.1% m/m (-0.9% y/y). In the past two years, monthly employment effectively grew on just three occasions. PPI inflation flatlined in May, undershooting views of a 0.3% increase.
Canadian inflation rose by a more-than-expected 1% m/m in May, pushing up the yearly figure from 2.8% to 3.2%. That's the quickest pace since December 2023 and above the 1-3% target range of the BOC. Higher prices for gasoline (33.2% y/y) continued to drive the acceleration. But even without that, CPI still quickened from 2% to 2.2% in May, Statistics Canada said. Core inflation excluding food and energy rose 1.6% vs 1.5% in April. The BoC's preferred gauge, trimmed mean core CPI, matched April's near five-and-half-year low of 2%. Today's numbers were in line with to slightly above expectations. The Canadian dollar marginally strengthens to USD/CAD 1.416. The pair was nearing the 1.42 mark earlier in the day, a level last seen in April 2025. The Bank of Canada at the June meeting showed little hurry to react to the current inflation uptick, citing the trend of underlying inflation and the view that the economy is operating below potential. Canadian money markets price a 70% chance for hike end-2026.
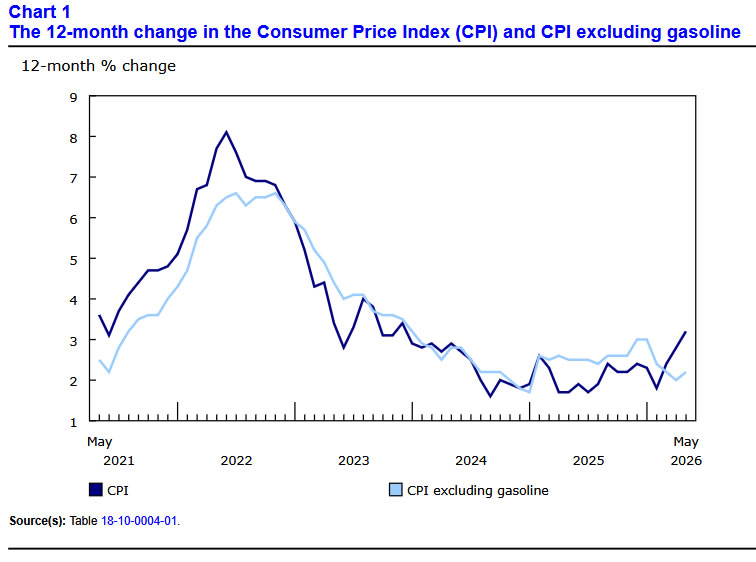
Canadian Inflation Likely Peaked in May
- Headline CPI inflation jumped up to 3.2% year-on-year (y/y) in May up from 2.8% in April, above consensus expectations. Higher prices at the pump were the main culprit, with inflation ex-gasoline up a more modest 2.2% y/y.
- Prices at the pump were up 33.2% y/y in May reaching their highest levels since June 2022. Food inflation also picked up to 3.8% y/y, from 3.5% in April, driven by prices for fresh fruits and veggies (+9.0% y/y).
- Shelter inflation gave back April's uptick and is now 1.7% y/y in May. Overall services inflation was 2% y/y in May, up slightly from April, but still well below its pace over the prior four years. Core goods inflation cooled very slightly to 1.4% y/y from 1.6% y/y in April.
- The AI boom is showing up in Canadian inflation now too as prices for computer equipment, software and supplies rose 3.9% y/y, after being basically flat in April, putting upward pressure on prices for durable goods (+1.9% y/y).
- Core inflation was steady. The Bank of Canada's preferred core inflation metrics (median and trim) averaged 2.1% in May, unchanged from April. However, both measures have risen above 2% on a three-month annualized basis, in line with the uptick in core inflation in our recent quarterly forecast.
Key Implications
- Oil prices are down significantly since a tentative peace deal between Iran and the U.S. was reached, and gasoline prices have been following suit. We expect May to mark the peak for headline inflation this year. We expect May to mark the peak for headline inflation this year. As expected, we are seeing somewhat higher core inflation in recent months, but we don’t expect it to rise to a level that raises alarm bellow for the Bank of Canada.
- Apart from energy costs and some emerging tech price pressures inflation remains very well behaved in Canada, as a relatively soft demand backdrop leans against sellers raising prices. We expect this to keep the Bank of Canada on the sidelines for quiet some time. Bond markets yields are so far little moved by today's numbers.
Markets Reward Stability as Burnham Rises and Iran Talks Progress
Sterling led gains in today as investors responded positively to signs of increasing political clarity in the UK, while improving prospects for a broader Middle East settlement supported risk sentiment more generally. Aussie followed as the second-strongest performer, with Canadian Dollar also finding support after stronger-than-expected inflation data. On the other side of the spectrum, Yen and Swiss Franc lagged as demand for traditional safe-haven assets softened.
The initial market reaction to Prime Minister Keir Starmer's resignation was relatively muted, reflecting the widespread expectation that his departure was only a matter of time. However, Sterling gained traction as the political succession picture became clearer. Manchester mayor Andy Burnham confirmed he will run for Labour leader, while his most prominent potential rival, Wes Streeting, ruled himself out and endorsed Burnham's candidacy. The developments significantly reduce the risk of a prolonged leadership contest and provide markets with greater visibility regarding the UK's political direction.
Additional support for Sterling may have come from reports that Burnham would replace Chancellor Rachel Reeves if he becomes prime minister. Reeves has become associated with a highly constrained fiscal approach amid limited room for public spending. Some investors appear to be interpreting Burnham's emergence as raising the possibility of a somewhat more growth-supportive fiscal stance, without abandoning overall fiscal discipline. While it is too early to draw firm conclusions about future policy, Sterling's rebound suggests markets are at least willing to entertain a more constructive economic outlook under a Burnham-led government.
Meanwhile, geopolitical developments offered another source of encouragement for risk assets. The US and Iran made further progress during talks in Switzerland aimed at reaching a comprehensive agreement within 60 days. Mediators Qatar and Pakistan described the discussions as "positive and constructive" and announced the establishment of a High Level Committee to oversee negotiations on nuclear issues, sanctions and dispute resolution. The parties also agreed to create a de-confliction mechanism involving the US, Iran and Lebanon to facilitate the termination of military hostilities in Lebanon.
The combination of improving political visibility in the UK and continued progress in Middle East diplomacy helped support risk appetite across markets. Nevertheless, the broader FX picture remains heavily influenced by monetary policy expectations. Sterling's rebound is notable, but it does not yet signal a decisive shift in the broader trend, particularly against a Dollar still underpinned by increasingly hawkish Federal Reserve expectations. For now, markets are rewarding stability, but the larger battle between Fed strength and improving global sentiment remains unresolved.
GBP/JPY Daily Outlook
Intraday bias in GBP/JPY is turned neutral first with current rebound. On the downside, below 212.36 will affirm the case that rebound form 210.43 has completed as a correction. Deeper fall would be seen to 211.23 support first. However, break of 215.59 will resume the rebound from 210.43 to retest 216.58.
In the bigger picture, there is no clear sign of trend reversal yet. The long term up trend could still extend to 61.8% projection of 148.93 (2022 low) to 208.09 (2024 high) from 184.35 at 220.90 on resumption. However, sustained break of 55 W EMA (now at 207.11) will argue that it's already in medium term down trend for 184.35 support.
Canada CPI Accelerates to 3.2% as Gasoline Prices Extend Surge
Canada's inflation accelerated more than expected in May, with headline CPI rising from 2.8% yoy to 3.2% yoy, above market expectations of 3.0% yoy. On a monthly basis, consumer prices increased 1.0%. The latest rise was driven primarily by another sharp increase in gasoline prices, reflecting ongoing energy market disruptions linked to tensions in the Middle East.
Gasoline prices climbed 33.2% yoy in May, up from 28.6% yoy in April, marking the third consecutive month of upward pressure from supply uncertainty surrounding the closure of the Strait of Hormuz. Statistics Canada noted that consumers paid the highest gasoline prices since June 2022, when Russia's invasion of Ukraine disrupted global energy markets. However, inflationary pressures were not limited to fuel. Excluding gasoline, CPI accelerated from 2.0% yoy to 2.2% yoy, indicating broader price pressures across the economy.
The core inflation picture was mixed but generally firm. CPI median held steady at 2.1% yoy and CPI trimmed remained unchanged at 2.0% yoy, both matching expectations. However, CPI common, which measures common price movements across categories, accelerated from 2.5% yoy to 2.7% yoy, exceeding expectations.
| Indicator | April | May | Consensus |
|---|---|---|---|
| Headline CPI YoY | 2.8% | 3.2% | 3.0% |
| Headline CPI MoM | - | 1.0% | 0.70% |
| CPI ex-Gasoline YoY | 2.0% | 2.2% | - |
| Gasoline Prices YoY | 28.6% | 33.2% | - |
| CPI Median YoY | 2.1% | 2.1% | 2.1% |
| CPI Trimmed YoY | 2.0% | 2.0% | 2.0% |
| CPI Common YoY | 2.5% | 2.7% | 2.5% |
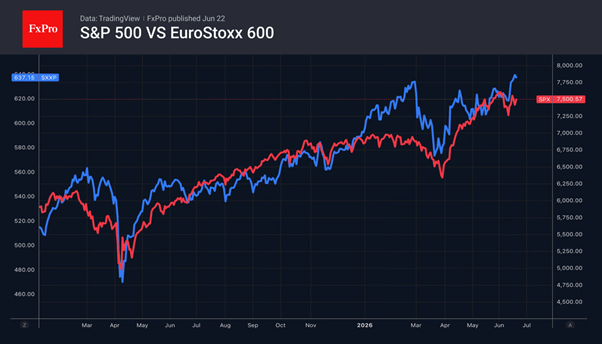
S&P 500: the Higher It Climbs, the Greater the Fear
- Inflows into US equity funds are heading towards a record high.
- Geopolitical and other fears continue to weigh on the S&P 500.
Corporate earnings are rising, the economy is on a solid footing, and interest in AI shows no sign of waning. What else is needed to convince investors of a bright future for the S&P 500? Unsurprisingly, according to Bank of America, investors poured $119.2 billion into US equity funds in the week ending 17 June. The figure for 2026 stands at $739 billion and is heading towards a record high. However, several sharp falls in the broad stock index in recent weeks suggest that investors are feeling very nervous.
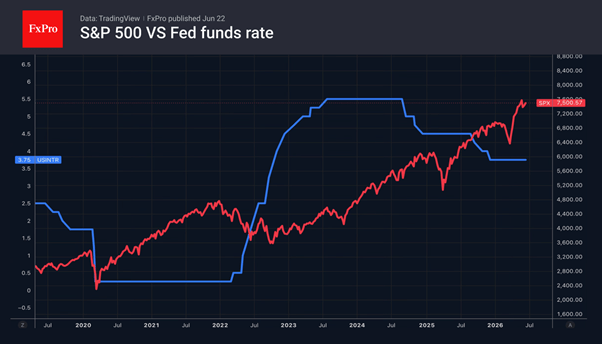
An overly prolonged rally, overvalued fundamentals, a potential rise in Fed rates and the fallout from the conflict in the Middle East are unsettling the US stock market. Since the start of 2026, the S&P 500 has gained just under 10 per cent, following double-digit rallies in each of the previous three years. But nothing lasts forever. The higher the broad stock index climbs, the greater the fear of a pullback.
Strong corporate earnings have pushed down fundamental valuations. Many multiples have moved away from their multi-year highs, particularly the P/E ratio. Nevertheless, a number of financial ratios remain a cause for concern. The CAPE ratio, which compares the return on the S&P 500 to that of US Treasury bonds, has fallen to 1.3 per cent, its lowest level in a decade. If Treasury yields continue to rise, this could act as a headwind for equities.
Bond yields are rising on expectations of a tightening of the Fed’s monetary policy in September. Should the run of strong reports on the state of the US economy continue, expectations of a federal funds rate hike will shift to July. This would deal a serious blow to the S&P 500.
The US and Iran may have struck a deal, but the escalation of the conflict between Hezbollah and Israel has cast doubt on it. The adversaries are once again threatening air strikes and the closure of the Strait of Hormuz. Even if mediators manage to ease tensions, renewed clashes remain likely. That continuing uncertainty is enough to keep the S&P 500 on edge.
The Dollar Outperforms Its Rivals
- Geopolitics is once again bolstering the US dollar.
- Rising political risks in the UK are weighing on the pound.
The US dollar opened the week with a gap up against the backdrop of escalating geopolitical tensions in the Middle East, expectations of accelerating inflation in the US and weakness in rival currencies. The pound is falling due to the imminent change of prime minister. Speculators are actively selling the yen, testing the government’s patience. Will the Japanese authorities return to currency interventions?
One of the points of the US-Iran agreement was peace in Lebanon. However, Tehran-backed Hezbollah has no intention of honouring it. An enraged Donald Trump promised to resume hostilities if the Islamic Republic did not rein in its ‘dog’. Iran responded by derailing negotiations on its nuclear programme and threatening to close the Strait of Hormuz once again. The mediators – Qatar and Pakistan – managed to put out the fire. Their statement on progress has eased geopolitical tensions.
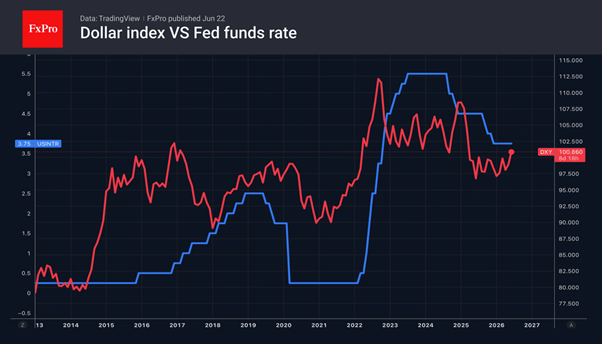
The fallout from the armed conflict in the Middle East will continue to support the greenback. However, a far more significant driver of its rally is the futures market’s expectations regarding the Fed’s interest rates. CME derivatives indicate a 59 per cent probability of two rounds of monetary tightening in 2026. The chances of a monetary policy tightening in September are estimated at 77%.
Data releases on US PMIs, durable goods orders, GDP and PCE could cause these figures to change. Bringing forward the Fed’s rate hike from September to July would lead to a strengthening of the US dollar. Conversely, if futures market pricing aligns with FOMC forecasts of a single round of monetary tightening, this would weaken the greenback.
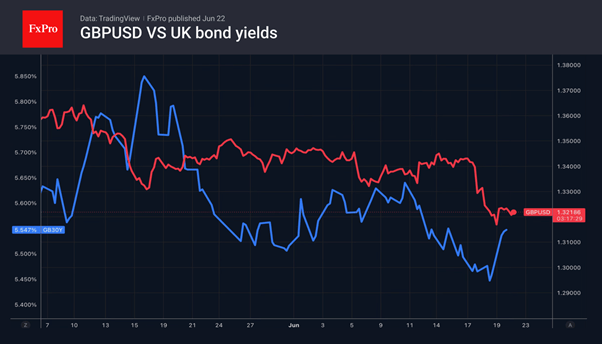
GBP/USD briefly touched a low of 2026 due to escalating political risks. The replacement of Prime Minister Keir Starmer by Andy Burnham could take place in the coming days. Markets are concerned that this will lead to a more expansionary fiscal policy. Fears of increased bond issuance are fuelling a sell-off in bonds and putting pressure on cable.
USD/JPY continues to trade very close to 40-year highs. Investors remain unimpressed by Finance Minister Sakuki Katayama’s comments regarding the government’s bold actions. Speculators are betting on the strength of the US dollar. They believe that the fundamental backdrop will deter the authorities from intervening in the currency market.
EUR/USD Daily Outlook
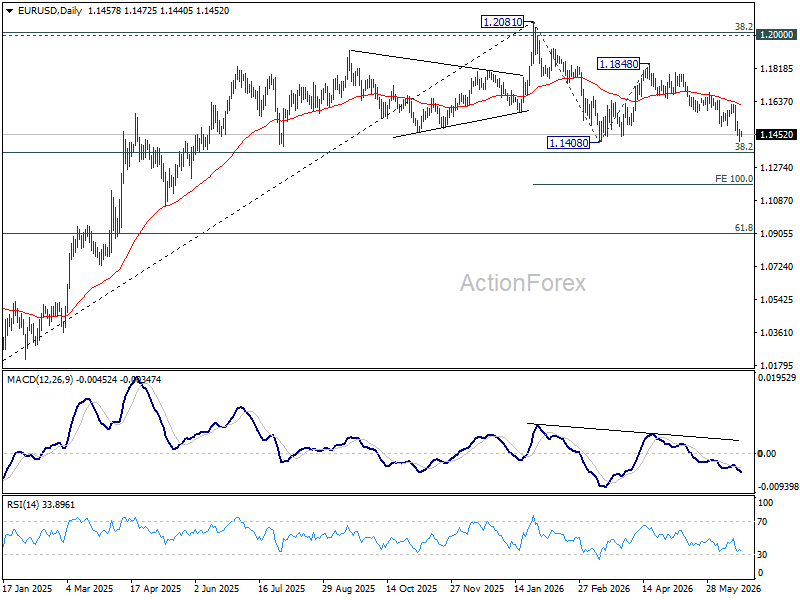
Intraday bias in EUR/USD is turned neutral first with current recovery. Further decline is expected as long as 1.1621 resistance holds. Firm break of 1.1408 support will resume whole fall from 1.2081 and target 100% projection of 1.2081 to 1.1408 from 1.1848 at 1.1175.
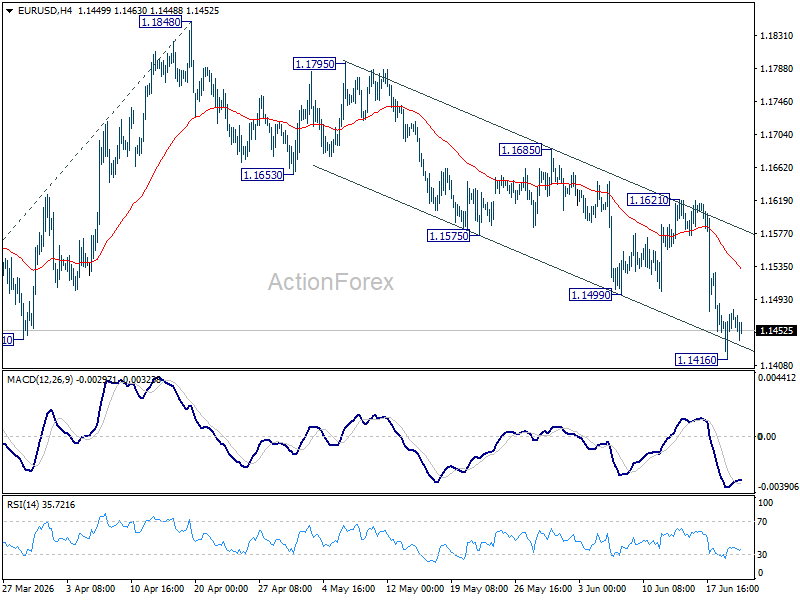
In the bigger picture, focus is back on 38.2% retracement of 1.0176 to 1.2081 at 1.1353. Decisive break there will revive the case of medium term bearish trend reversal after rejection by 1.2 key cluster resistance level. Further fall should be seen to 61.8% retracement at 1.0904. Nevertheless, strong rebound from 1.1353, followed by break of 1.1621 resistance, will retain medium term bullishness.
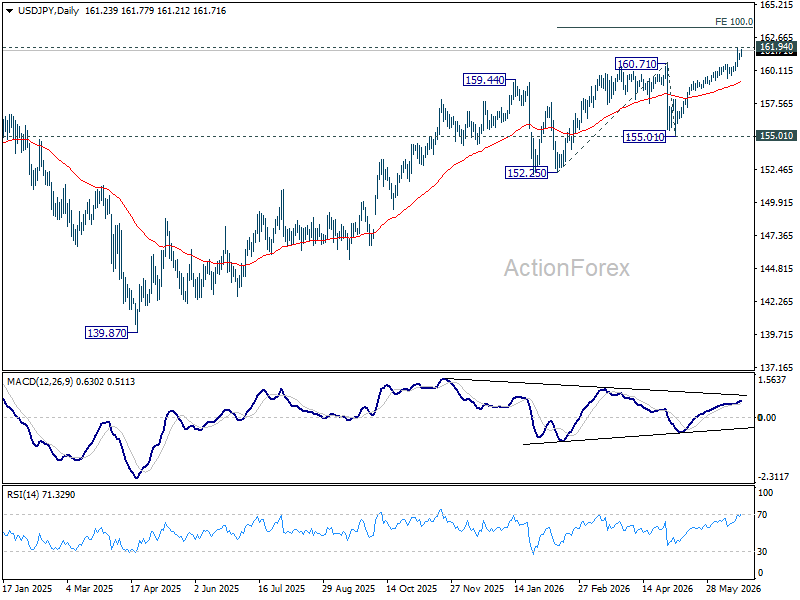
USD/JPY Daily Outlook
Intraday bias in USD/JPY remains on the upside for the moment. Decisive break of 161.94 high will resume the larger up trend to 100% projection of 152.25 to 160.71 from 155.01 at 163.47 next. On the downside, break of 160.58 minor support will turn intraday bias neutral first.
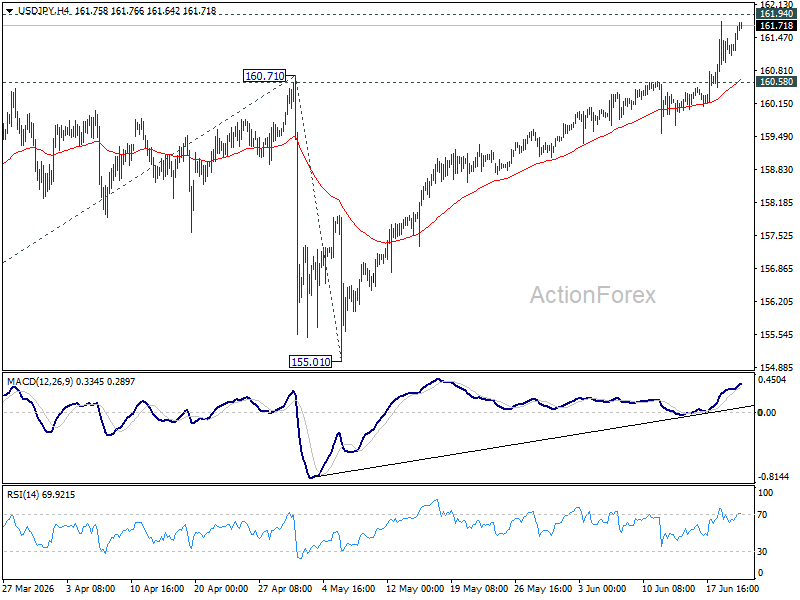
In the bigger picture, for now, corrective pattern from 161.94 (2024 high) is still seen as completed at 139.87. Rise from there is seen as resuming the long term up trend. This will remain the favored case as long as 55 W EMA (now at 155.17) holds.