Sample Category Title
GBP/USD Daily Outlook
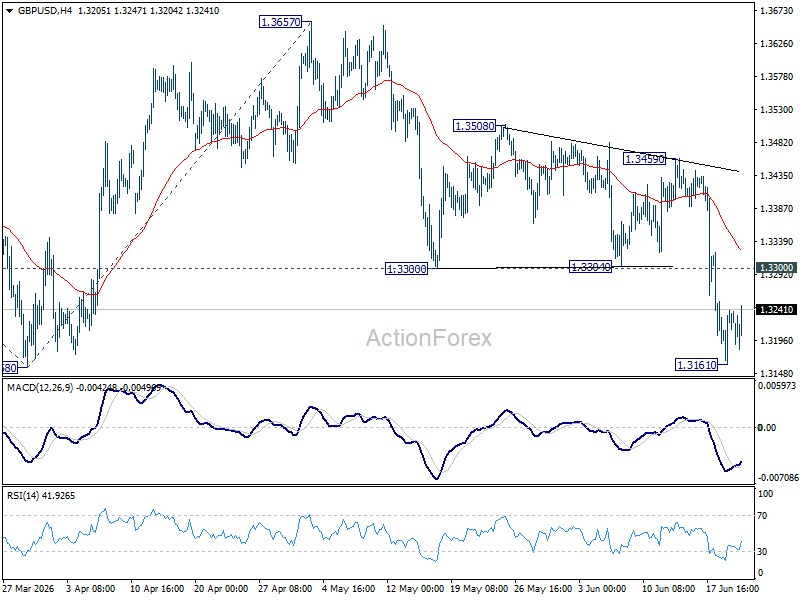
Intraday bias in GBP/USD is turned neutral first with current recovery. Further fall is expected as long as 1.3300 support turned resistance holds. On the downside, decisive break of 1.3158 support will resume whole fall from 1.3867 to 100% projection of 1.3867 to 1.3158 from 1.3657 at 1.2948.
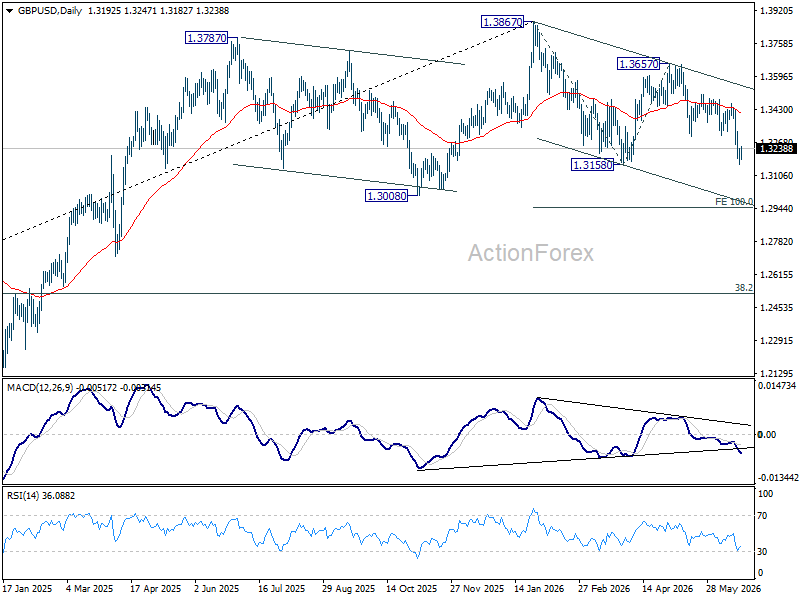
In the bigger picture, price actions from 1.3867 are a corrective pattern within the broader up trend from 1.0351 (2022 low). With 1.3008 support intact, medium term bullishness is maintained and break of 1.3867 is in favor for a later stage, towards 1.4248 key resistance (2021 high). However, firm break of 1.3008 will at least bring deeper fall to 38.2% retracement of 1.0351 to 1.3867 at 1.2524, with increased risk of bearish reversal.
USD/CHF Daily Outlook
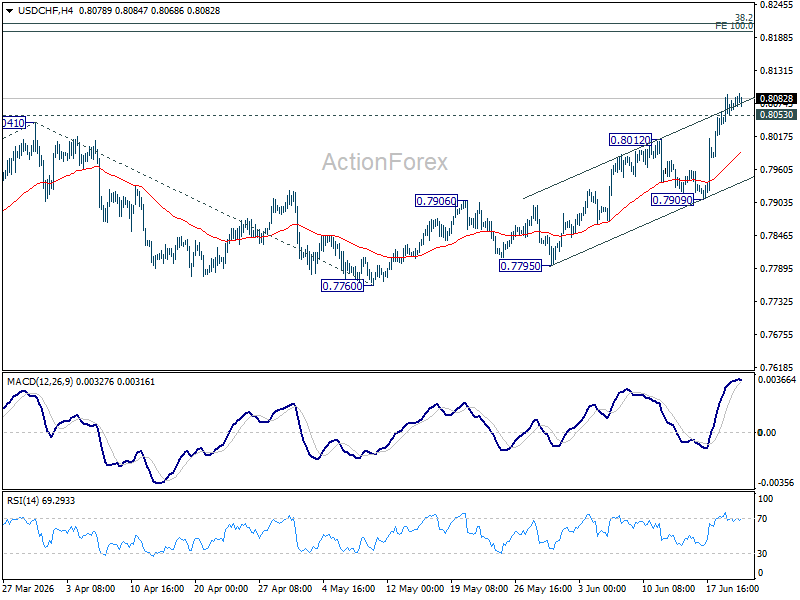
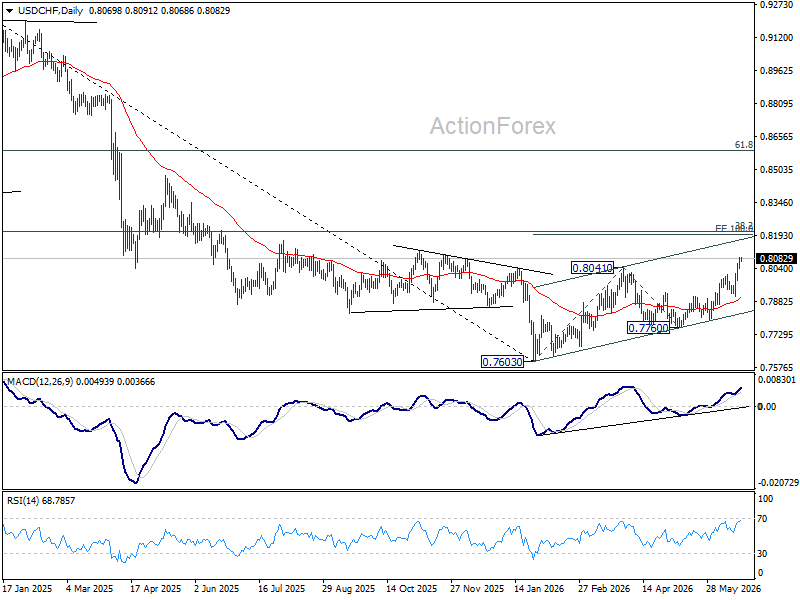
Intraday bias in USD/CHF remains on the upside at this point. Current rally should target 100% projection 0.7603 to 0.8041 from 0.7600 at 0.8198 next. On the downside, below 0.8053 minor support will turn intraday bias neutral and bring consolidations first before staging another rise.
In the bigger picture, while a medium term bottom was formed at 0.7603, it's still early to call for bullish trend reversal. As long as 38.2% retracement of 0.9200 (2025 high) to 0.7603 at 0.8213 holds, the larger down trend could still continue through 0.7603 at a later stage. However, firm break of 0.7603 will argue that the trend has reversed and turn focus to 0.8332 support turned resistance (2023 low) for confirmation.
AUD/USD Daily Report
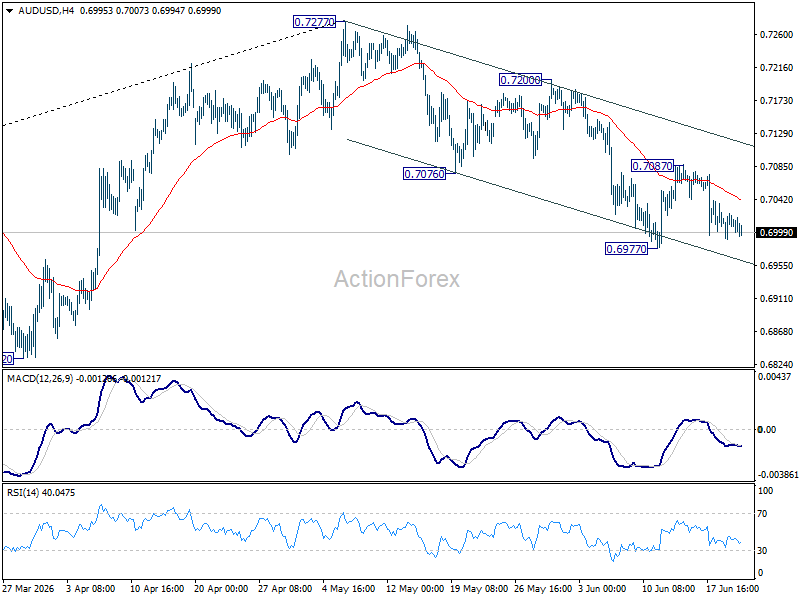
Intraday bias in AUD/USD remains neutral as range trading continues. On the downside, break of 0.6977 will resume the fall from 0.7277 towards 0.6832 support. On the upside, break of 0.7087 will bring stronger rebound to 0.7200 resistance.
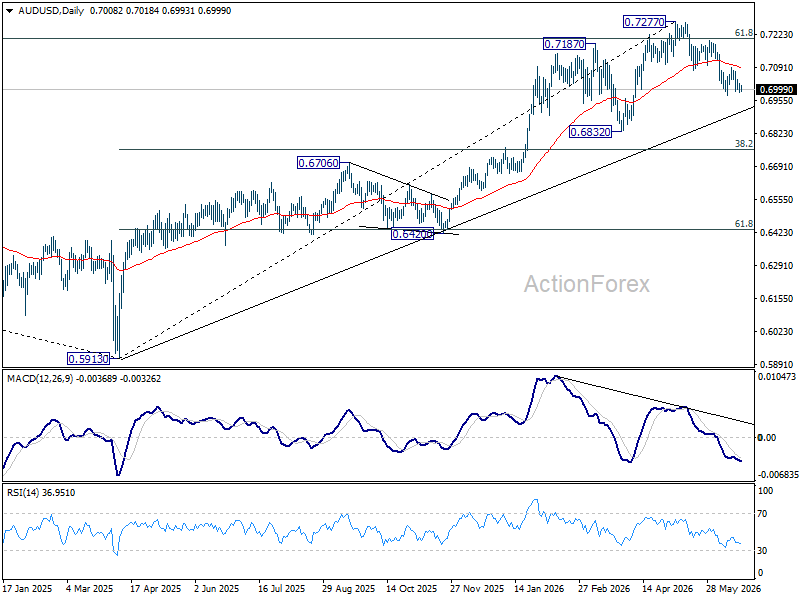
In the bigger picture, considering bearish divergence condition in D MACD, a medium term top could be formed at 0.7277 after failing to sustain above 61.8% retracement of 0.8006 (2021 high) to 0.5913 (2024 low) at 0.7206). Deeper fall could be seen to 38.2% retracement of 0.5913 to 0.7277 at 0.6756 as a correction. But strong support should be seen there to bring rebound. Consolidations would continue below 0.7277 for a while.
USD/CAD Daily Outlook
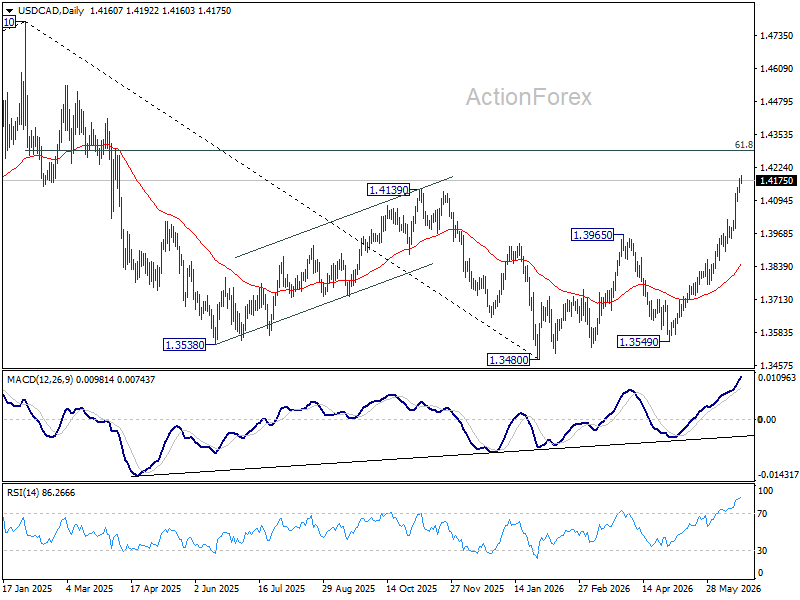
Intraday bias in USD/CAD remains on the upside at this point. Current rise from 1.3480 should target 61.8% retracement of 1.4791 to 1.3480 at 1.4290. On the downside, below 1.4092 minor support will turn intraday bias neutral and bring consolidations first, before staging another rally.
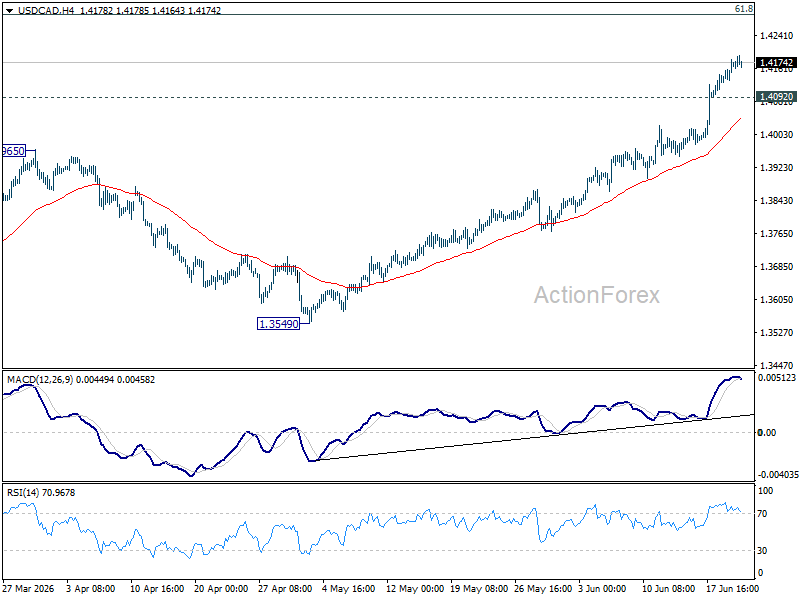
In the bigger picture, current development suggests that fall from 1.4791 has completed as a three wave correction to 1.3480. It's still early to judge if rise from there a corrective bounce, or resumption of the larger up trend from 1.2005 (2021 low). But in either case, retest of 1.4791 high should be seen next.
GBP/JPY Daily Outlook
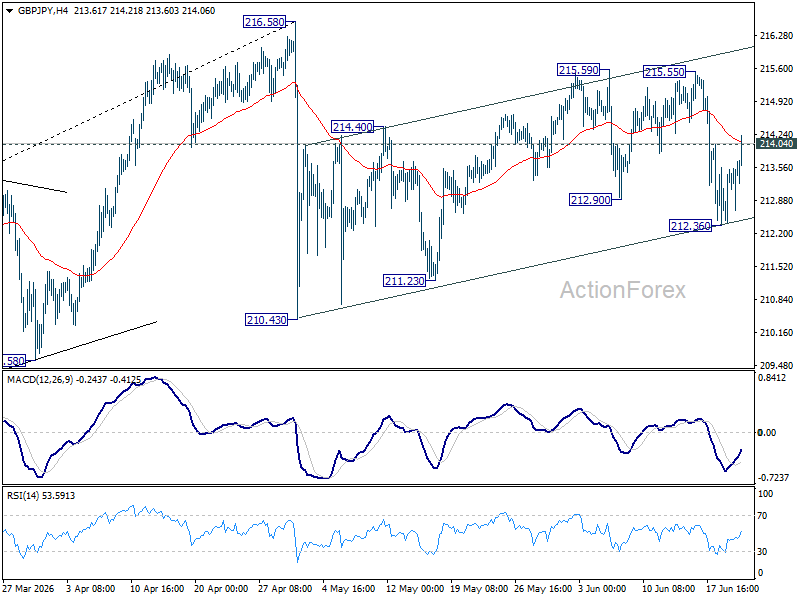
Intraday bias in GBP/JPY is turned neutral first with current rebound. On the downside, below 212.36 will affirm the case that rebound form 210.43 has completed as a correction. Deeper fall would be seen to 211.23 support first. However, break of 215.59 will resume the rebound from 210.43 to retest 216.58.
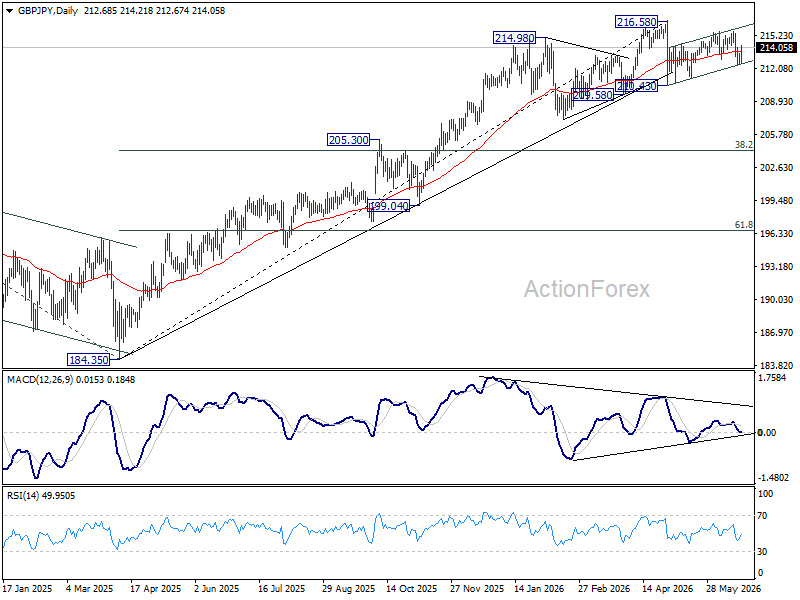
In the bigger picture, there is no clear sign of trend reversal yet. The long term up trend could still extend to 61.8% projection of 148.93 (2022 low) to 208.09 (2024 high) from 184.35 at 220.90 on resumption. However, sustained break of 55 W EMA (now at 207.11) will argue that it's already in medium term down trend for 184.35 support.
EUR/JPY Daily Outlook
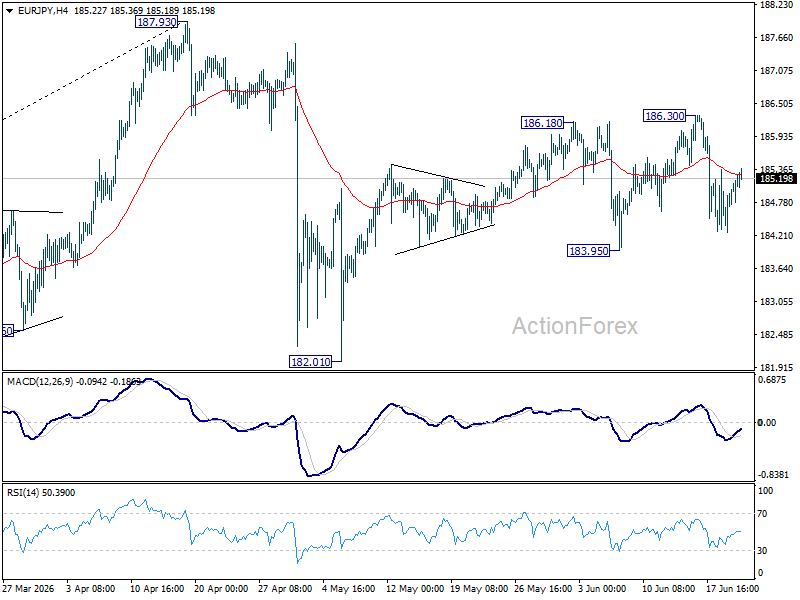
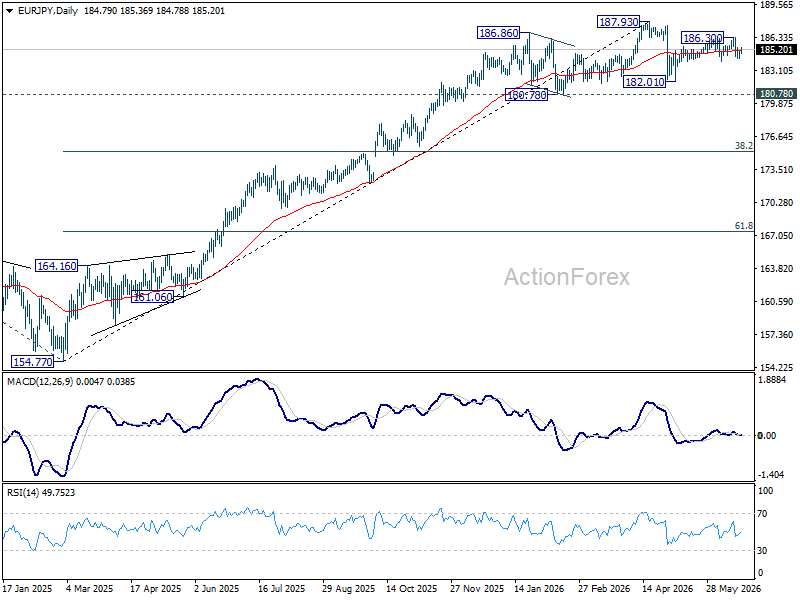
Intraday bias in EUR/JPY remains neutral for the moment. On the downside, firm break of 183.95 will argue that rebound from 182.01 has completed, and bring deeper fall back to this support. Nevertheless, break of 186.30 will resume the rise to retest 187.93 high instead.
In the bigger picture, there is no sign of reversal yet. Uptrend from 114.42 (2020 low) is still expected to resume at a later stage to 78.6% projection of 124.37 (2022 low) to 175.41 (2025 high) from 154.77 at 194.88. However, sustained break of 55 W EMA (now at 179.41) will argue that it's already in a medium term down trend to 175.41 resistance turned support and below.
EUR/GBP Daily Outlook
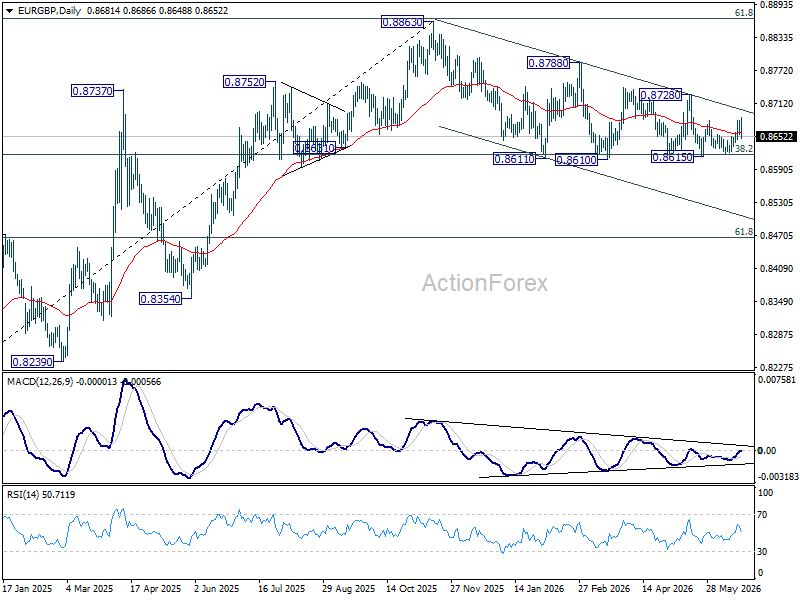
Intraday bias in EUR/GBP stays neutral as range trading continues. On the upside, firm break of 0.8680 will bring further rally back to 0.8278 resistance. Decisive break there will argue that fall from 0.8863 has completed already. On the downside, however, decisive break of 0.8610 support will revive the case of bearish trend reversal.
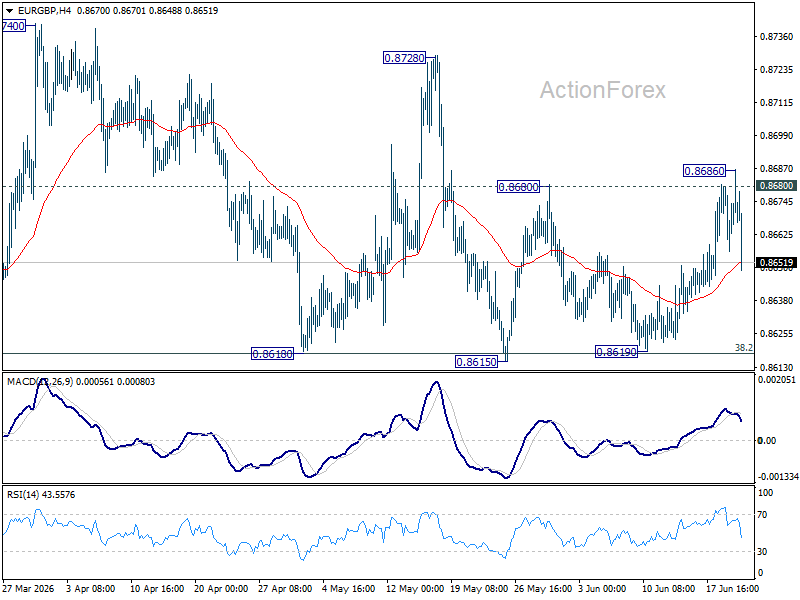
In the bigger picture, focus is staying on 38.2% retracement of 0.8221 to 0.8863 at 0.8618. Strong rebound from there will retain medium term bullishness. Rise from 0.8221 should resume through 0.8863 at a later stage. Nevertheless, sustained break of 0.8618 will confirm that whole rise from 0.8221 has completed at 0.8863. Deeper decline should then be seen to 61.8% retracement at 0.8466 at least.
EUR/AUD Daily Outlook
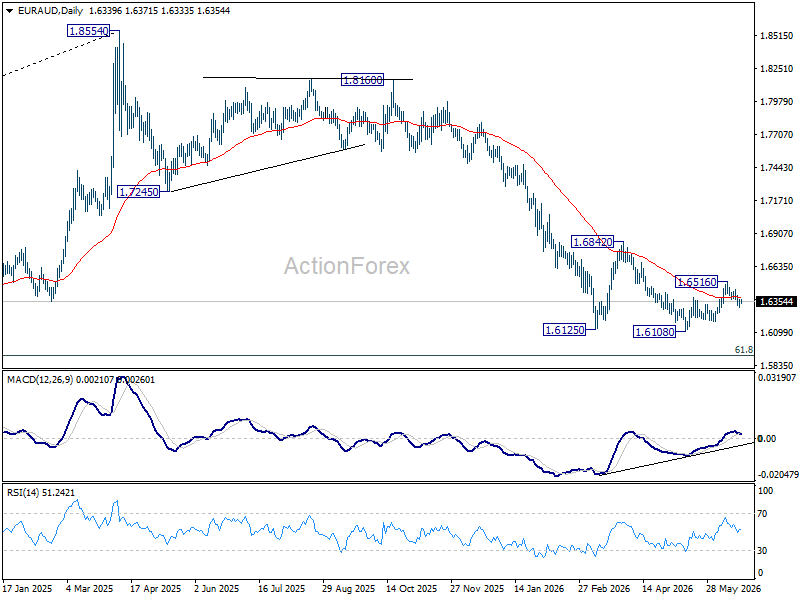
Intraday bias in EUR/AUD is turned neutral first with current recovery. But risk will stay on the downside as long as 1.6453 resistance holds. Rebound from 1.6108 could have completed as a three wave corrective move to 1.6516. Below 1.6306 will target 1.6186 support first. Break will target retest of 1.6108 low. On the upside, above 1.6453 will turn bias back to the upside, and resume the rise from 1.6108 through 1.6516 instead.
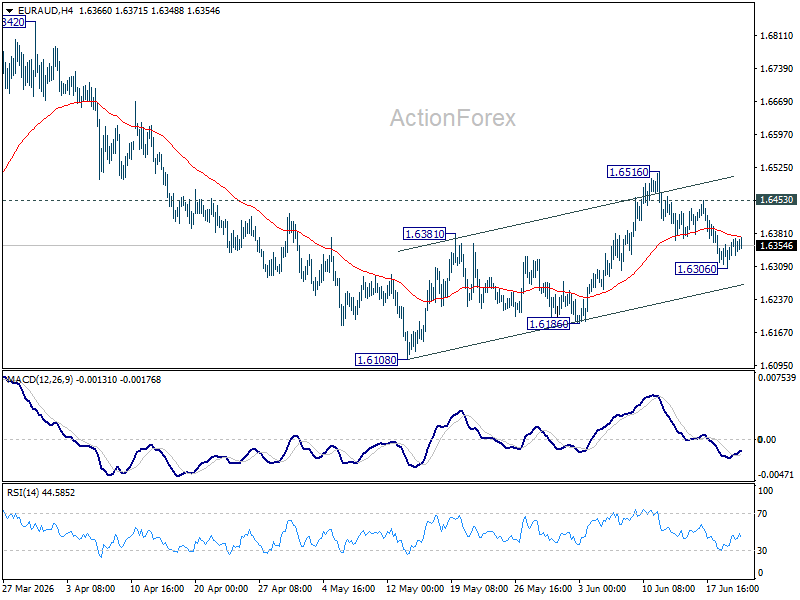
In the bigger picture, outlook will stay bearish as long as 1.6842 resistance holds. Fall from 1.8554 (2025 high) is expected to continue to 61.8% retracement of 1.4281 to 1.8554 at 1.5913. Decisive break there will pave the way back to 1.4281 (2022 low). However, firm break of 1.6842 should confirm medium term bottoming, and bring stronger rally.
EUR/CHF Daily Outlook
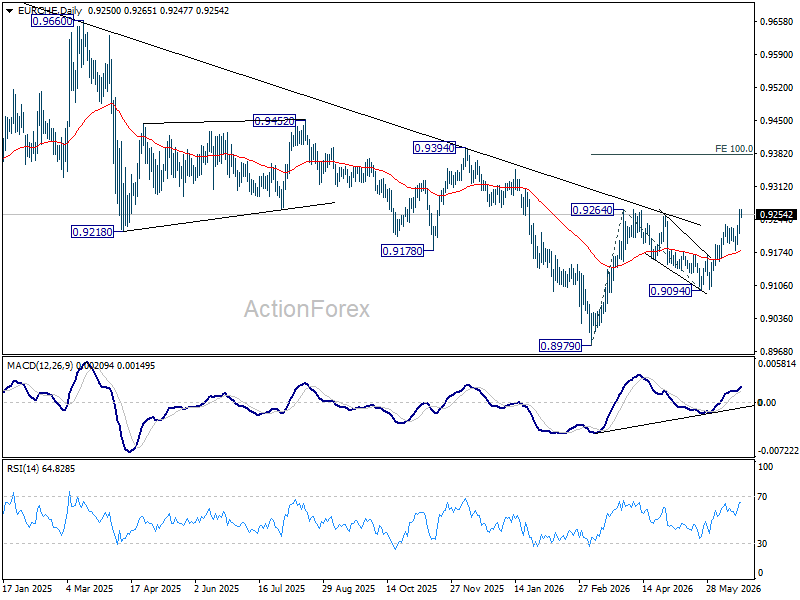
Intraday bias in EUR/CHF remains on the upside at this point. Decisive break of 0.9264 resistance will resume the rally from 0.8979 to 100% projection of 0.8979 to 0.9264 from 0.9094 at 0.9379. Outlook will now remain bullish as long as 0.9179 support holds, in case of retreat.
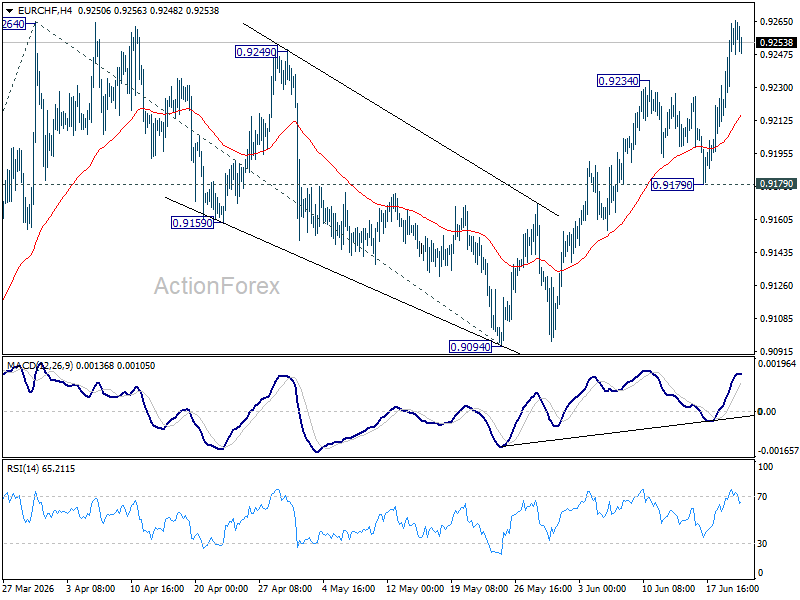
In the bigger picture, the break of medium term falling trend line resistance indicate that 0.8979 is already on medium term bottom. Considering bullish convergence condition in W MACD, rise from there should at least be reversing the fall from 0.9928, with prospect of developing into a medium term up trend. Firm break of 0.9394 resistance will add more credence to this case. For now rise will remain on the upside as long as 0.9094 support holds, in case of retreat.
GBPUSD – Bears Face Increased Headwinds from 2026 Low
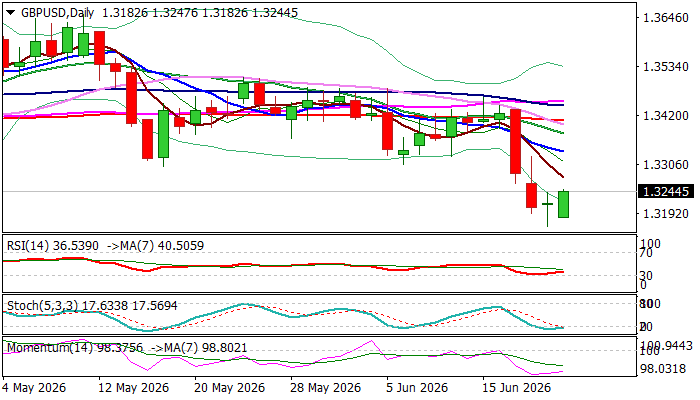
Cable continues to trade near 2026 low (1.3159, posted on March 31 and last Friday’s low / trendline support at 1.3163) following news of resignation of UK PM Starmer.
Growing uncertainty about how the new Prime Minister (likely to be in place in early September) will run the economy, burdened by prolonged weak economic growth, high debt and the highest borrowing cost in G7 group, with demands to cut spending and increase investments, particularly in defense sector.
All these factors continue to pressure pound, along with stronger dollar, underpinned by Fed’s hawkish steer.
Bearish daily studies contribute to negative short-term outlook, though oversold conditions suggest that near-term action may consolidate above strong supports at 1.3163/59 before larger bears regain control.
Solid resistances at 1.3300 zone (former range floor) and 1.3335 (falling 10DMA) should cap upticks, while potential break higher would put bears on hold and unmask next strong barriers at 1.3408 (daily cloud base / 200DMA).
Res: 1.3278; 1.3300; 1.3335; 1.3377
Sup: 1.3159; 1.3080; 1.3009; 1.2984