Sample Category Title
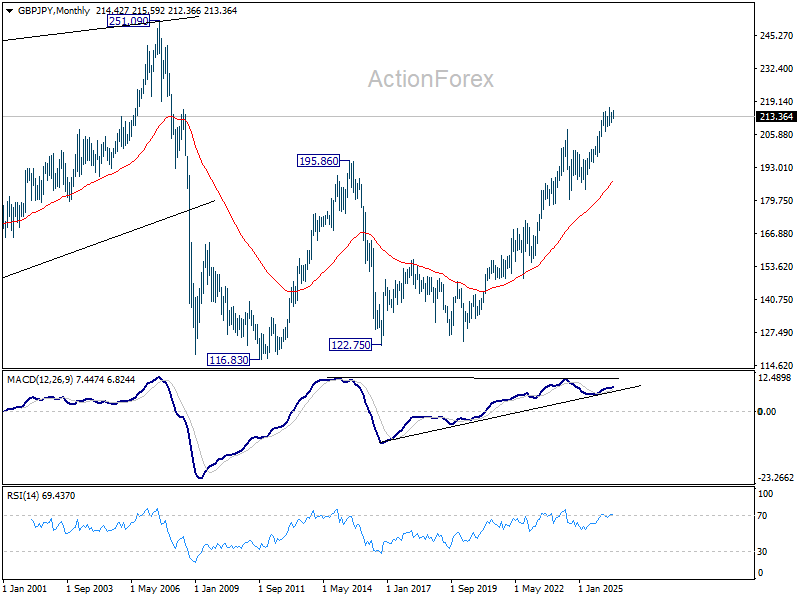
GBP/JPY Weekly Outlook
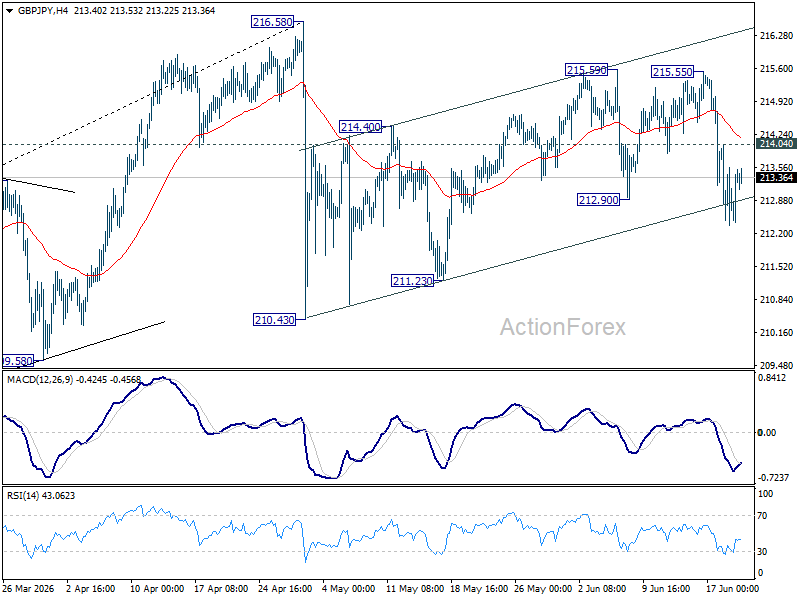
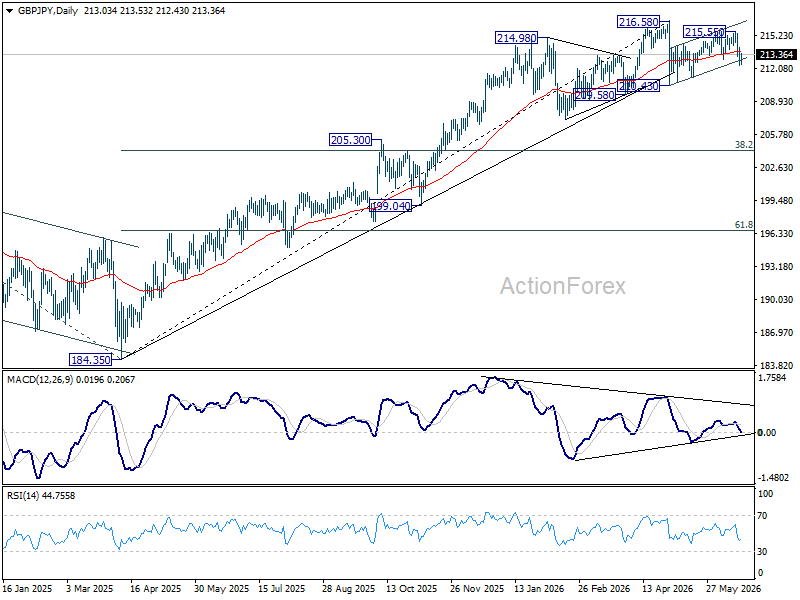
GBP/JPY's extended decline last week suggests that rebound from 210.43 could have completed at 215.59 already. Initial bias stays mildly on the downside this week for 211.23 support first. Firm break there will target 210.43. On the upside, above 214.04 minor resistance will turn intraday bias neutral again.
In the bigger picture, there is no clear sign of trend reversal yet. The long term up trend could still extend to 61.8% projection of 148.93 (2022 low) to 208.09 (2024 high) from 184.35 at 220.90 on resumption. However, sustained break of 55 W EMA (now at 207.11) will argue that it's already in medium term down trend for 184.35 support.
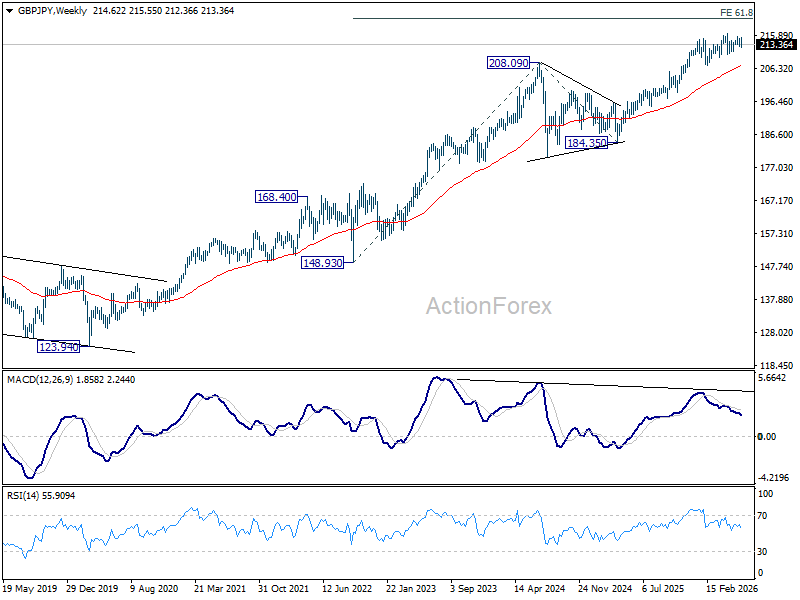
In the long term picture, up trend from 116.83 (2011 low) is in progress. Next target is 251.09 (2007 high). This will remain the favored case as long as 55 M EMA (now at 186.82) holds.
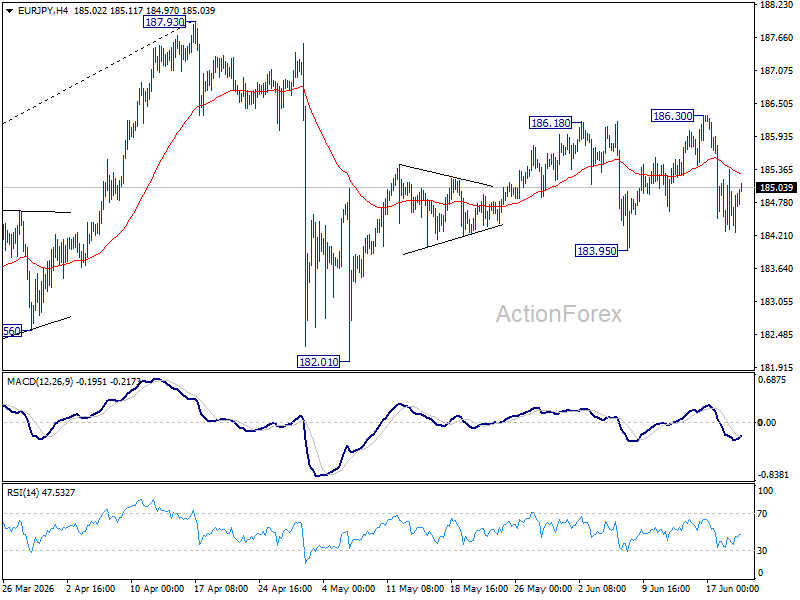
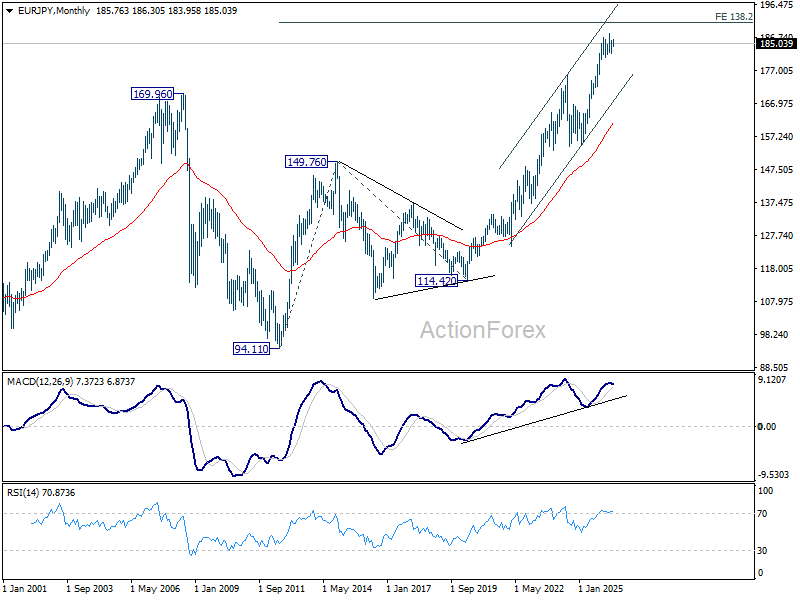
EUR/JPY Weekly Outlook
EUR/JPY reversed after edging higher to 186.30 last week, but failed to break through 183.95 support. Initial bias remains neutral this week first. On the downside, firm break of 183.95 will argue that rebound from 182.01 has completed, and bring deeper fall back to this support. Nevertheless, break of 186.30 will resume the rise to retest 187.93 high instead.
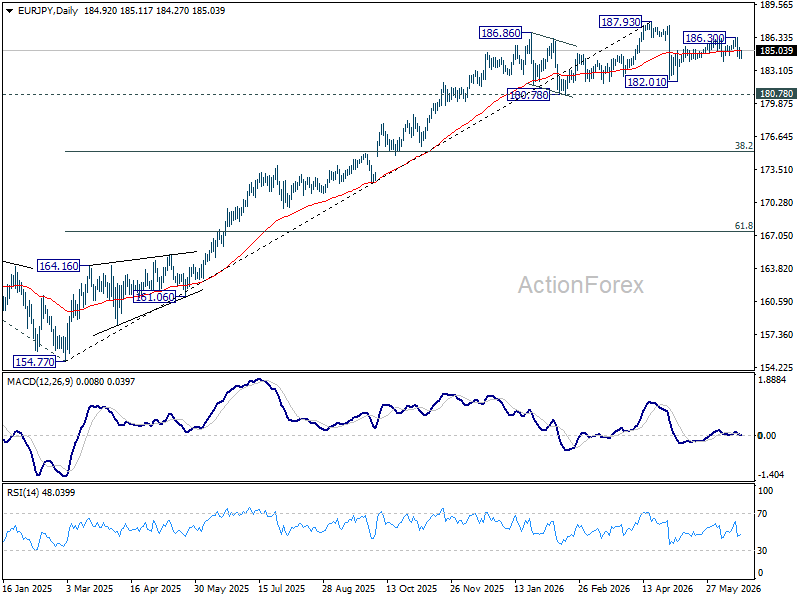
In the bigger picture, there is no sign of reversal yet. Uptrend from 114.42 (2020 low) is still expected to resume at a later stage to 78.6% projection of 124.37 (2022 low) to 175.41 (2025 high) from 154.77 at 194.88. However, sustained break of 55 W EMA (now at 179.23) will argue that it's already in a medium term down trend to 175.41 resistance turned support and below.
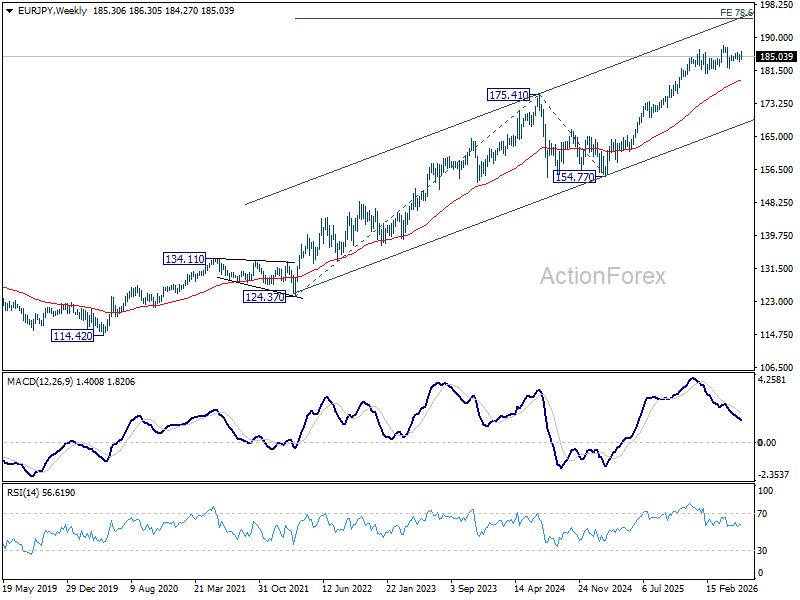
In the long term picture, up trend from 94.11 (2021 low) is in progress. Next target is 138.2% projection of 94.11 to 149.76 (2014 high) from 114.42 (2020 low) at 191.32. This will remain the favored case as long 55 W EMA (now at 178.98) holds.
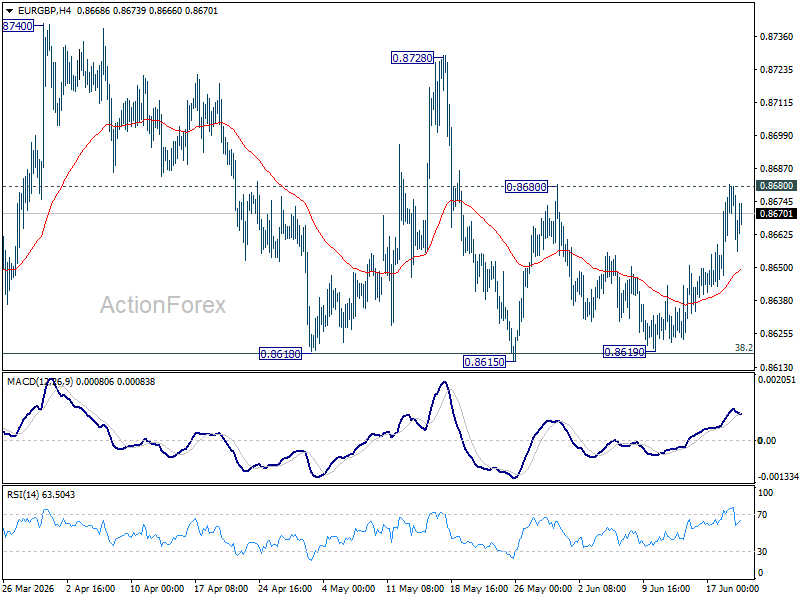
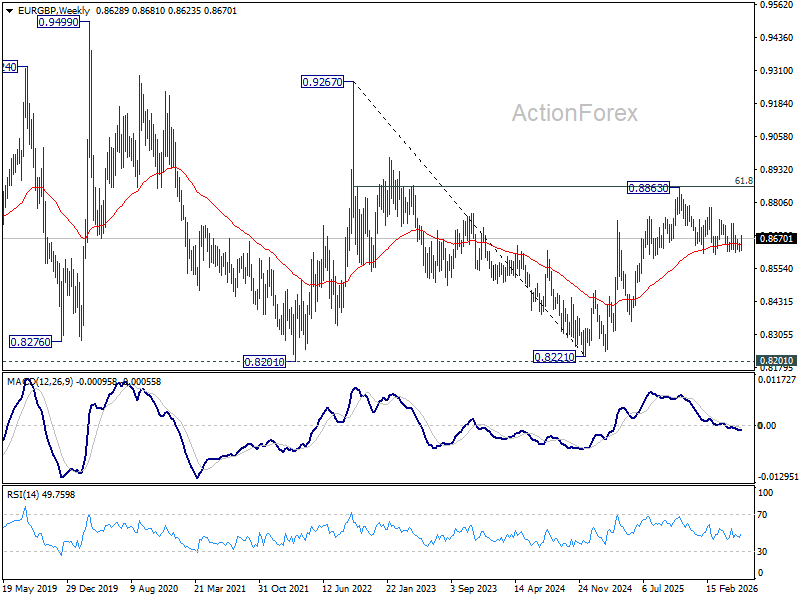
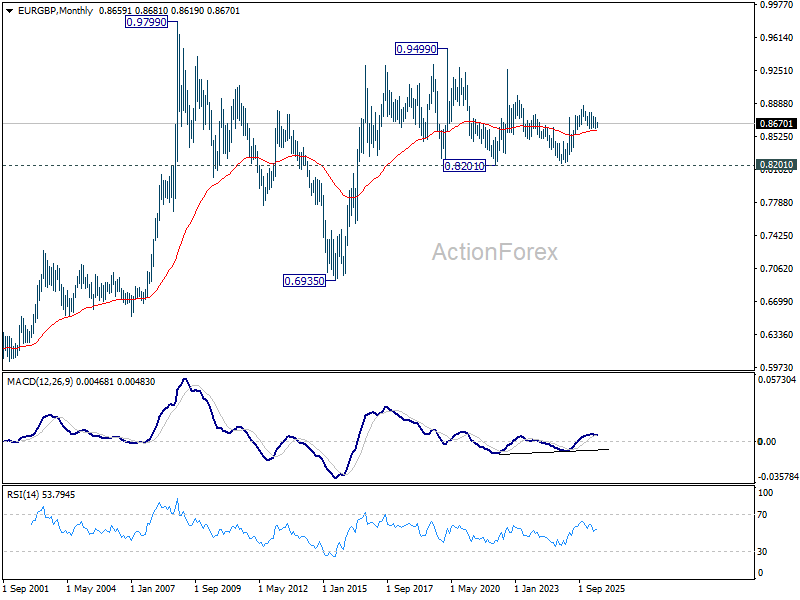
EUR/GBP Weekly Outlook
EUR/GBP rebounded last week, but failed to sustain above 0.8680 resistance. Initial bias remains neutral this week first. On the upside, firm break of 0.8680 will bring further rally back to 0.8278 resistance. Decisive break there will argue that fall from 0.8863 has completed already. On the downside, however, decisive break of 0.8610 support will revive the case of bearish trend reversal.
In the bigger picture, focus is staying on 38.2% retracement of 0.8221 to 0.8863 at 0.8618. Strong rebound from there will retain medium term bullishness. Rise from 0.8221 should resume through 0.8863 at a later stage. Nevertheless, sustained break of 0.8618 will confirm that whole rise from 0.8221 has completed at 0.8863. Deeper decline should then be seen to 61.8% retracement at 0.8466 at least.
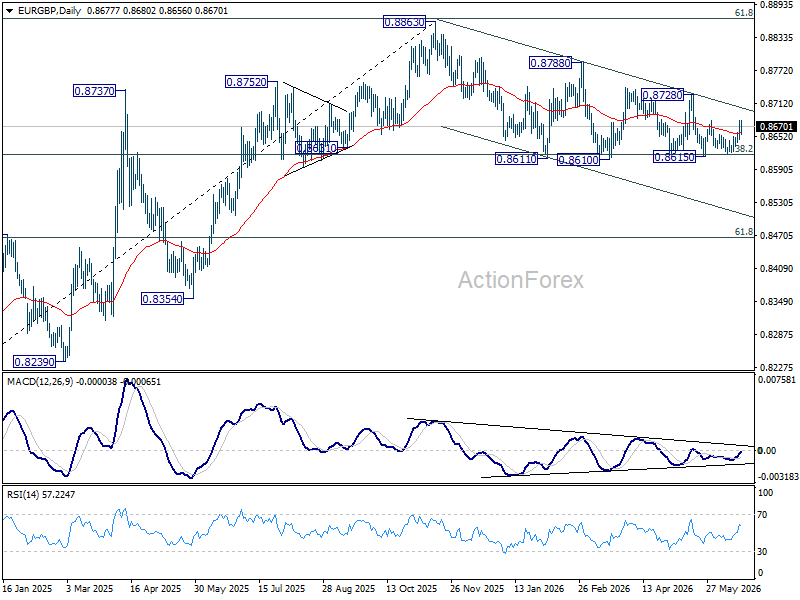
In the long term picture, price action from 0.9499 (2020 high) is seen as part of the long term range pattern from 0.9799 (2008 high). Range trading should continue between 0.8201 and 0.9499, until there is clear signal of imminent breakout.
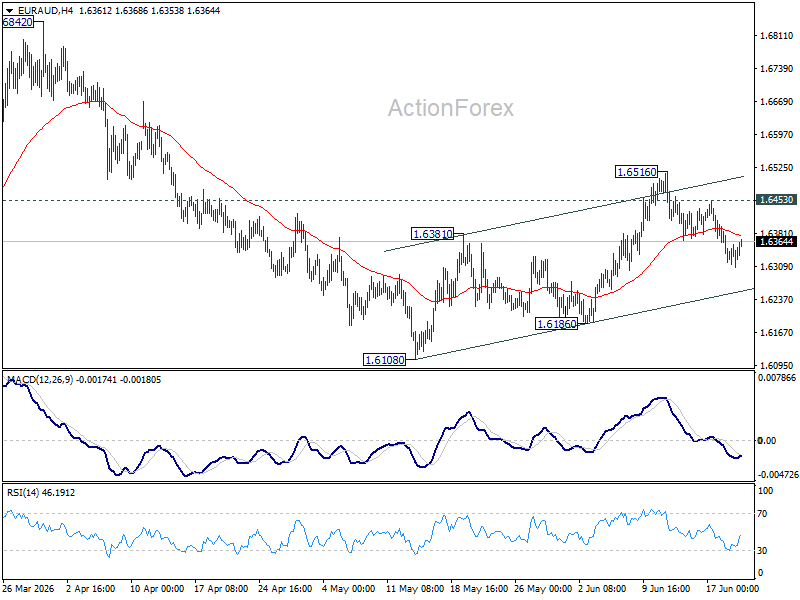
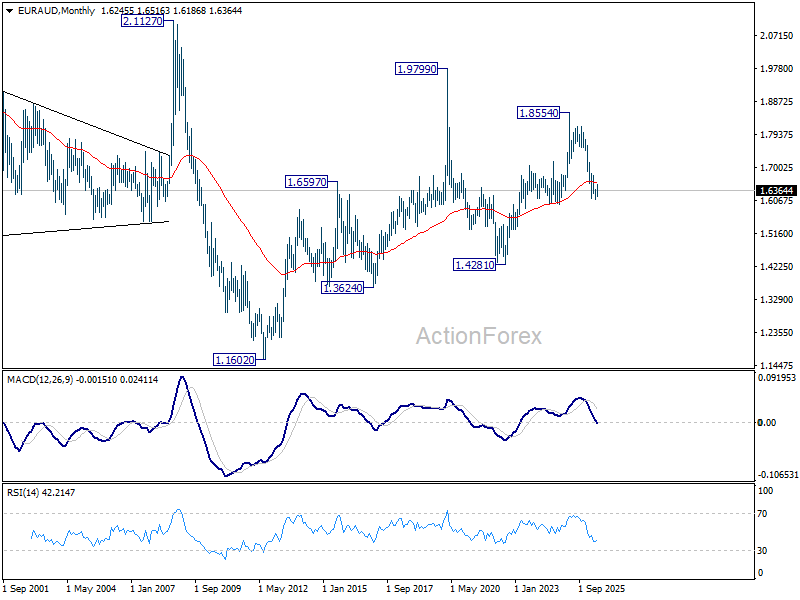
EUR/AUD Weekly Outlook
EUR/AUD's extended fall last week argues that rebound from 1.6108 has completed as a three wave corrective move to 1.6518. Initial bias is mildly on the downside this week for 1.6186 support first. Break will target retest of 1.6108 low. On the upside, above 1.6453 will turn bias back to the upside, and resume the rise from 1.6108 through 1.6516.
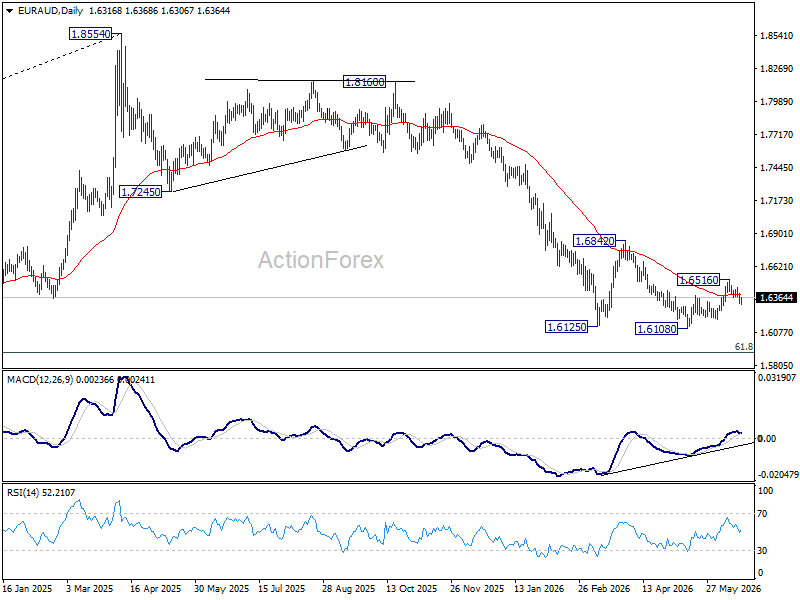
In the bigger picture, outlook will stay bearish as long as 1.6842 resistance holds. Fall from 1.8554 (2025 high) is expected to continue to 61.8% retracement of 1.4281 to 1.8554 at 1.5913. Decisive break there will pave the way back to 1.4281 (2022 low). However, firm break of 1.6842 should confirm medium term bottoming, and bring stronger rally.
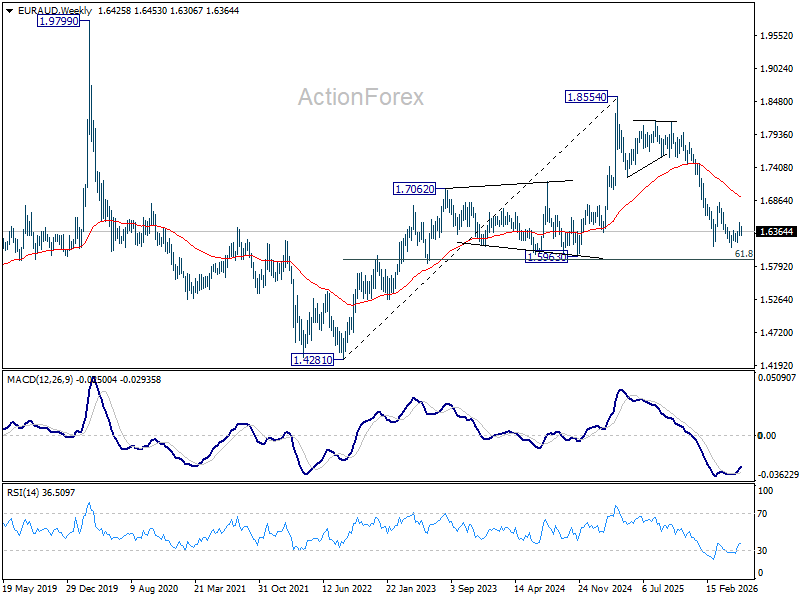
In the longer term picture, fall from 1.8554 is seen as the third leg of the pattern from 1.9799 (2020 high), which is part of the pattern from 2.1127 (2008 high). Sustained trading below 55 M EMA (now at 1.6577) will confirm this bearish case, and pave the way back towards 1.4281.
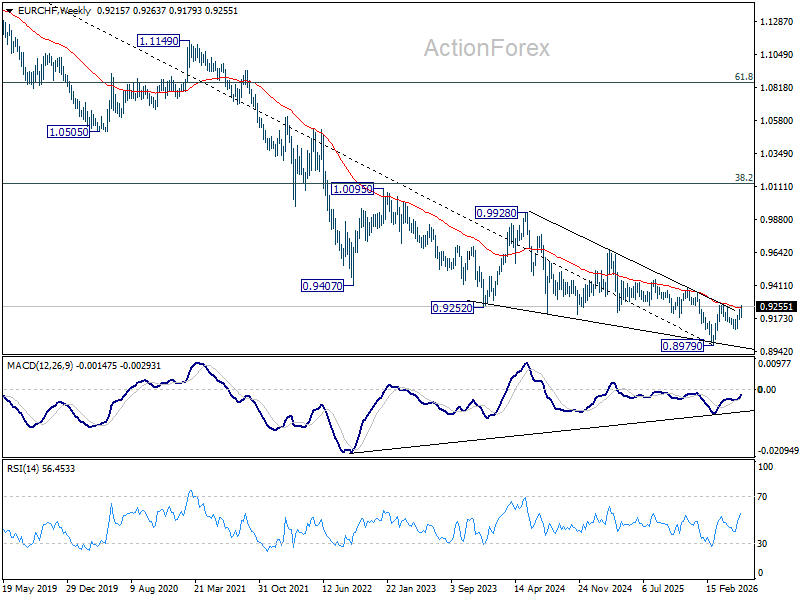
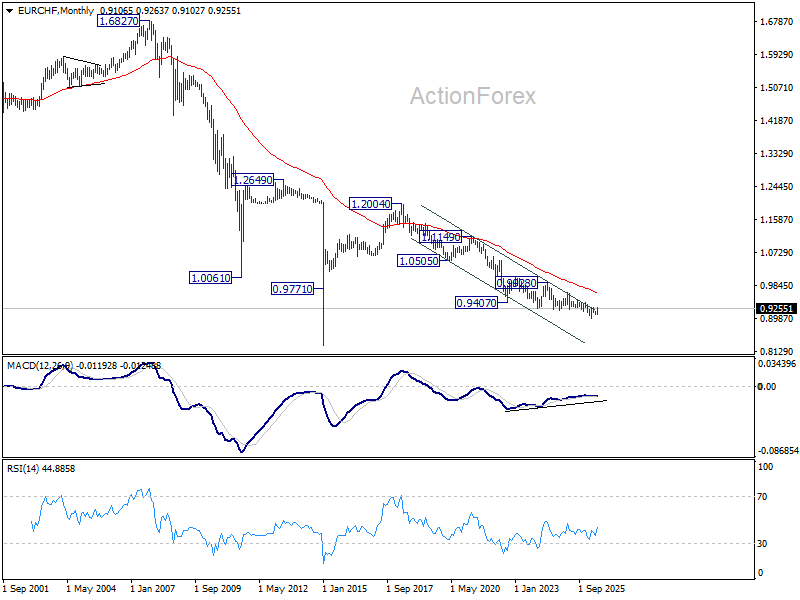
EUR/CHF Weekly Outlook
EUR/CHF's rally resumed last week after dipping to 0.9179. Initial bias stays on the upside this week with focus on 0.9264 resistance. Firm break there will resume the rally from 0.8979 to 100% projection of 0.8979 to 0.9264 from 0.9094 at 0.9379. Outlook will now remain bullish as long as 0.9179 support holds, in case of retreat.
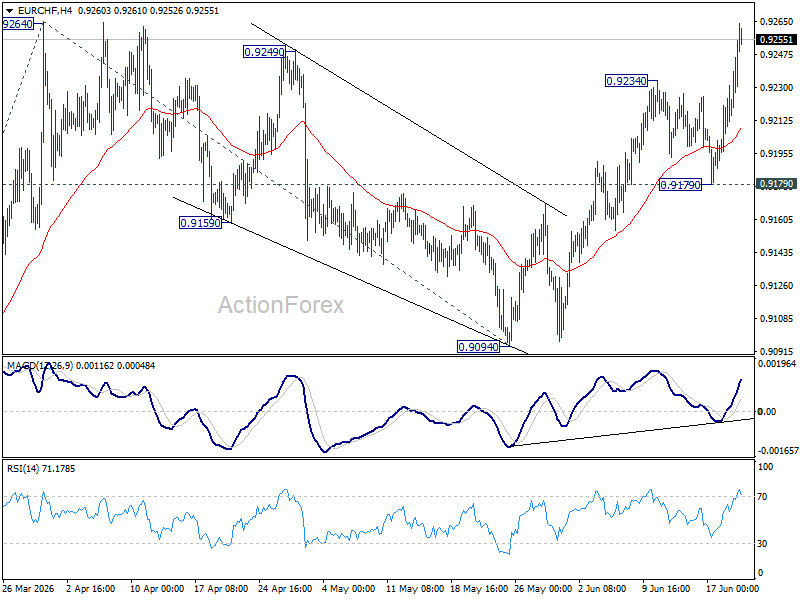
In the bigger picture, the break of medium term falling trend line resistance indicate that 0.8979 is already on medium term bottom. Considering bullish convergence condition in W MACD, rise from there should at least be revering the fall from 0.9928, with prospect of developing into a medium term up trend. Firm break of 0.9394 resistance will add more credence to this case. For now rise will remain on the upside as long as 0.9094 support holds, in case of retreat.
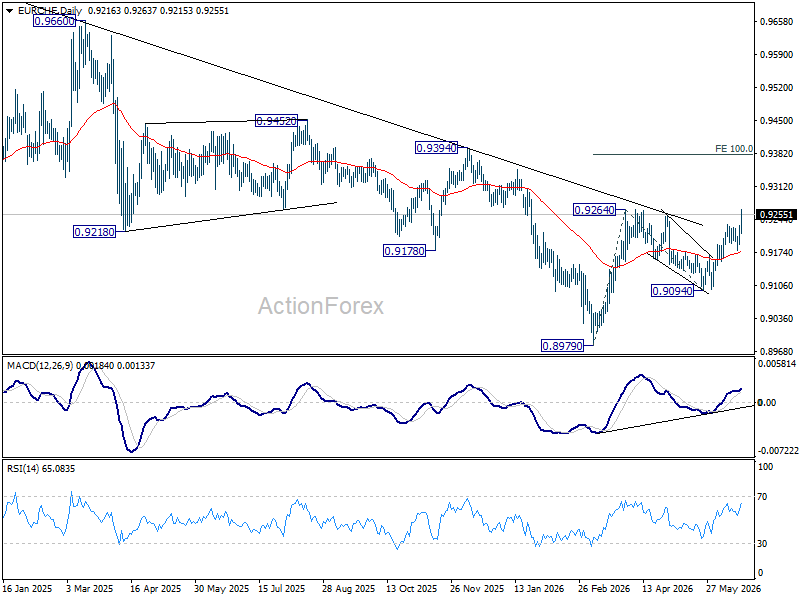
In the long term picture, outlook will stay bearish as long as 0.9407 support turned resistance (2022 low) holds. However, firm break of 0.9407 will argue that the down trend from 1.2004 (2018 high) has completed with five waves down to 0.8979. Stronger rebound should then be seen to 38.2% retracement of 1.2004 to 0.8979 at 1.0135 in the medium term.
The Weekly Bottom Line: Price Pressures Now on the Front Foot
Canadian Highlights
- The Bank of Canada held the policy rate at 2.25%. Soft growth argues against further tightening, but the risk inflation pressures become more generalized keep cuts off the table, reinforcing a prolonged hold.
- Canada’s international trade books moved further into surplus territory. Broad export gains and firmer volumes point to net trade supporting Q2 growth after dragging in Q1.
- The Canadian economy is expected to rebound in Q2, but it’s not out of the woods – lingering uncertainty continues to cap the upside.
U.S. Highlights
- The effects of the Iran war were evident in the CPI inflation report, which hit a three year high in May. Core inflation edged up to 2.9% y/y in line with consensus expectations.
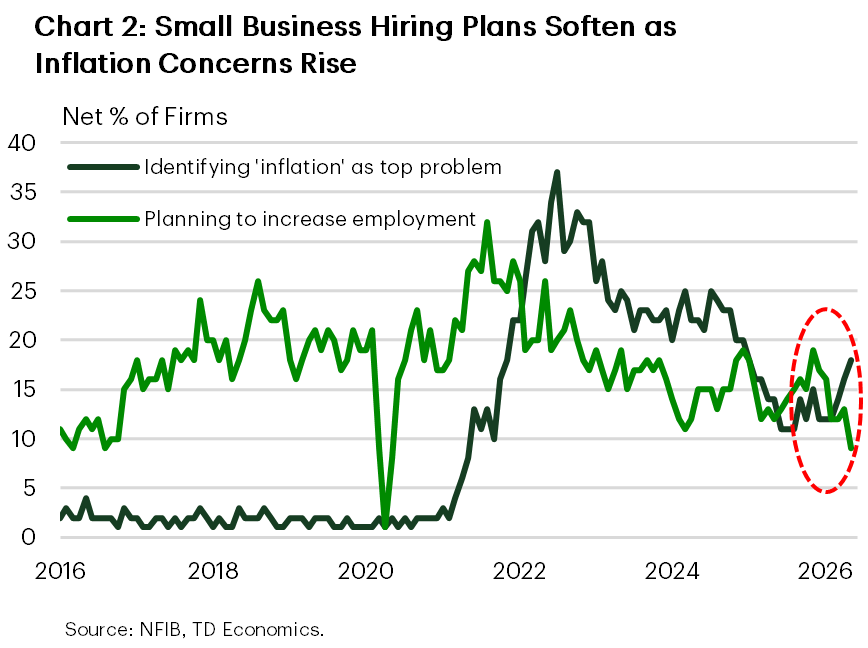
- NFIB pricing indicators also moved higher in May and inflation concerns continued to rise, while hiring plans continued to soften.
- Existing home sales beat market expectations in May, but activity remains low compared to historical norms. Lacklustre markets are reflected in home price growth, which is still in the slow lane (1.3% y/y).
Canada – Tumbling Energy Prices and Economic Stabilization
Reports that a memorandum of understanding between the U.S. and Iran has been signed pushed have helped push oil prices lower, easing inflation pressures and supporting market sentiment. However, the downside for oil prices is likely limited, with global supply conditions still tight, suggesting some scope for energy prices to rise from today’s level as markets adjust to the evolving supply-demand balance in the coming months. For Canada, near-term reliefg to inflation and household budgets is likely on the way, and we expect that beyond the tough start to the year, a gradual economic recovery is in the making.
After a tough first quarter, the housing market is showing tentative signs of stabilizing. Housing starts pulled back 6% month-on-month (m/m) in May, but continue to track above Q1 levels, limiting the downside to residential investment in the second quarter. Meanwhile, existing home sales rose 5.5% m/m in May, with gains across most provinces. At the same time, new listings declined, tightening the sales-to-new listings ratio to 49.2%. While still below historical averages, this suggests improving balance. Prices remain mixed, reflecting ongoing weakness in segments such as condos. Overall, improving alignment between buyers and sellers appears to be supporting a partial rebound in activity, leaving sales on track for a firm Q2 gain. For the housing sector overall, headwinds from elevated inventories and slower population growth remain, but the near-term signal is one of stabilization rather than deterioration (see our Provincial Forecast for more details).
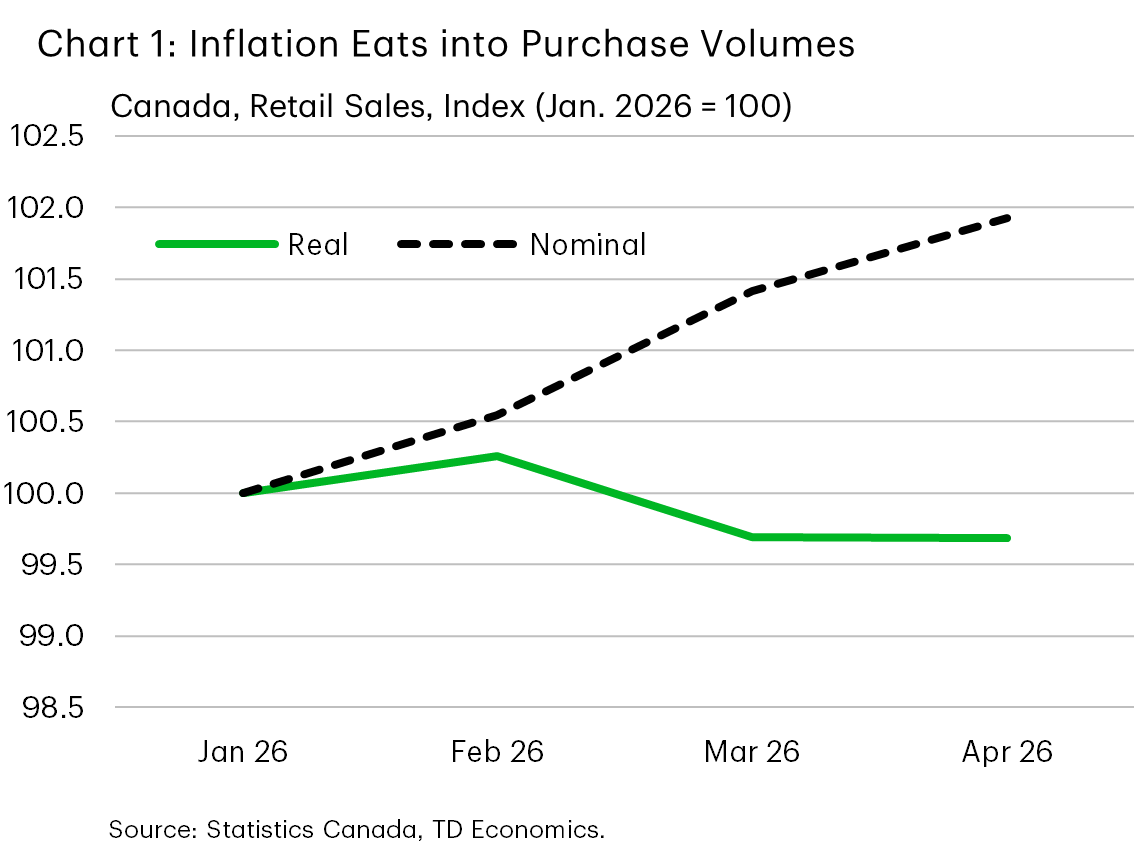
Emerging stability in the housing market is a positive sign, but consumer spending remains soft in the face of rising inflation. Retail sales rose 0.5% m/m in April, but volumes were unchanged, indicating that higher prices are driving gains (Chart 1). Strength in autos and gasoline masked underlying weakness, with core retail sales falling for a second consecutive month (-0.7% m/m). The dynamic suggests that households are becoming more selective as higher energy costs weigh on budgets. As a result, consumer spending is likely to grow modestly in Q2. The recent decline in energy prices should offer some relief heading into the second half of the year.
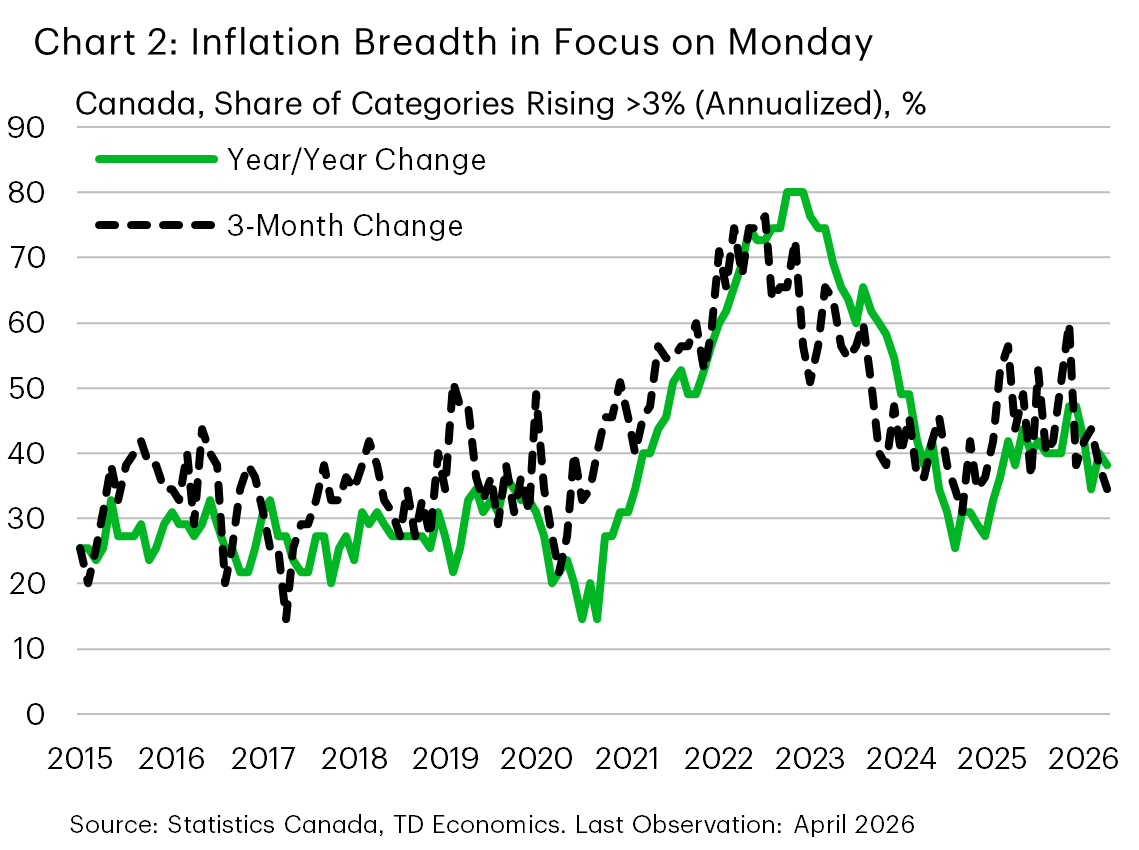
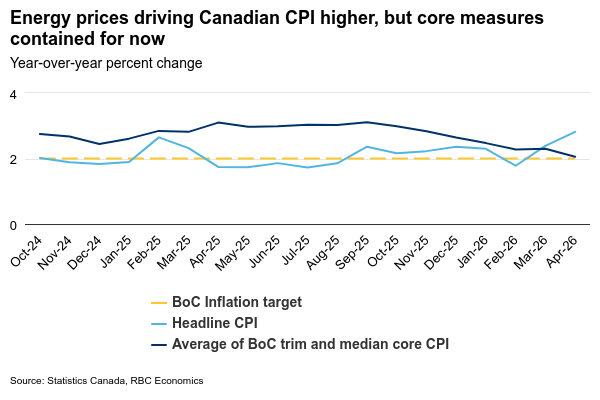
Attention now turns to next week’s inflation report for May. We expect a firm print, with gasoline prices rising about 3% in the month. However, the key focus will be on inflation breadth (Chart 2) and core measures. In April, headline inflation rose to 2.8% y/y on higher energy prices, while the average of the Bank of Canada’s (BoC) core measures cooled to 2.1%. The critical question for the BoC will be whether price pressures are broadening beyond energy prices and, given that the upside to oil prices appears limited for the time being, how persistent any pass-through becomes.
Overall, while the upcoming inflation report will be important for assessing underlying pressures, the broader backdrop remains one of excess supply, subdued domestic demand and likely moderating energy prices. This should limit the pass-through to core inflation and keep the Bank of Canada on the sidelines through the remainder of the year.
U.S. – Price Pressures Now on the Front Foot
Middle East tensions spiked and then eased again this week, with President Trump threatening new strikes on Iran and then calling them off as he noted progress toward a deal. WTI oil prices, which had been holding near $90/barrel, fell sharply toward $85/barrel. The 10-year Treasury yield also dipped initially, reflecting hopes that a resolution to the conflict would limit the energy shock’s spillover into broader inflation expectations, but recovered some lost ground later in the week as investors digested another firm inflation report.
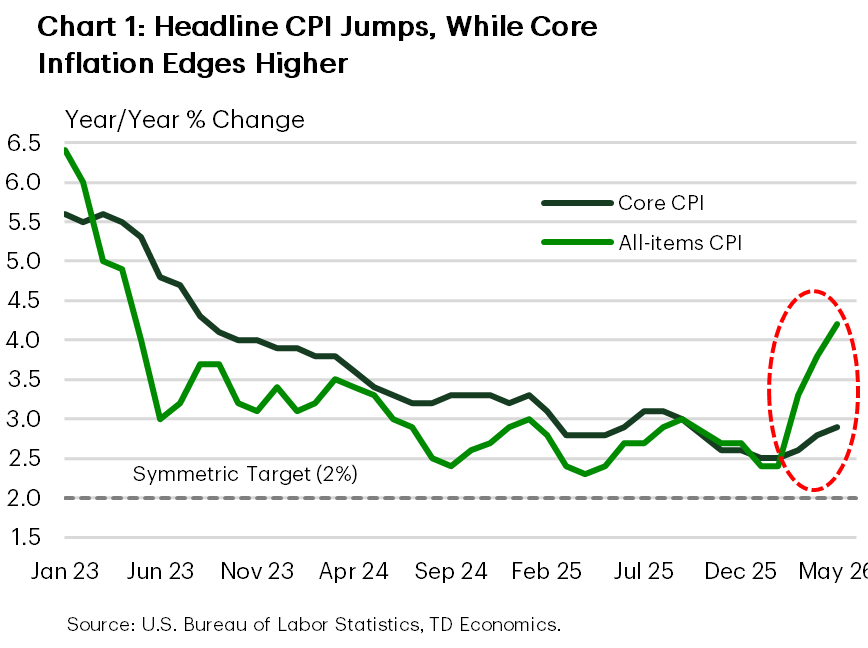
The May CPI report was the clearest evidence that inflation pressures continue to build. Headline inflation accelerated to the fastest pace in three years - 4.2% year-on-year (Chart 1). Higher energy costs accounted for the bulk of that increase. The gain in core inflation was more contained, but the annual rate still moved further above target (2.9% y/y), adding support to a “higher for longer” policy stance. Sifting through the details, shelter cooled after April’s outsized gain and core goods prices slipped, but non-housing services remained firm.
Inflation pressure was also evident in the NFIB small business survey, where a growing share of firms reported that they had raised average selling prices and that they planned further increases in the months ahead. This supports the view that higher energy and input costs are starting to ripple beyond the pump.
Housing offered a modest reprieve from the sour inflation news. Existing home sales rose a solid 3.2% in May to the highest level since December. Still, little has changed in the broader picture, with activity hovering near the 4-million mark for the third consecutive year and home price growth remaining in the slow lane.
Labor market signals, meanwhile, were mixed. Initial jobless claims ticked higher for the third week in a row but remained broadly range-bound, while continuing claims are still low by historical standards. Signals out of the small business survey, however, were less reassuring on this front. Small businesses are pointing to slower job creation ahead, with job openings and hiring plans softening recently amid an increase in inflation concerns (Chart 2).
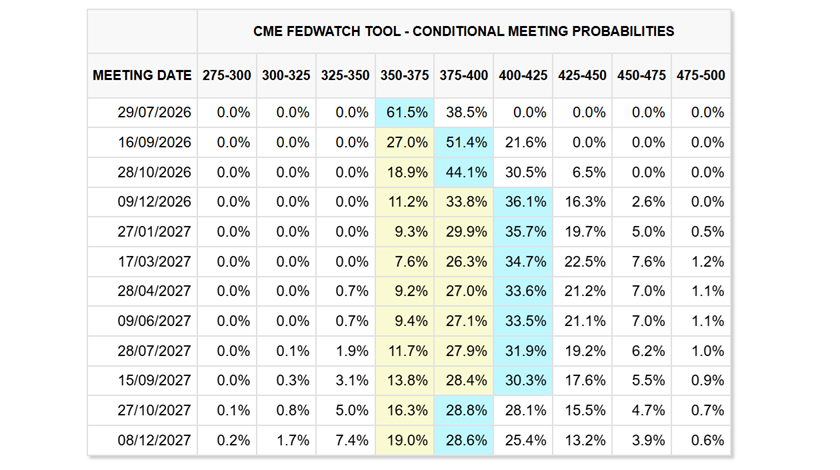
All told, the effects of the Middle East conflict continue to show up in the data, and this is becoming harder for the Fed to ignore. Our view is that core inflation will likely remain elevated through year-end, supporting the case for an extended Fed pause. Next week marks Kevin Warsh’s first FOMC meeting as Chair. Markets will be watching not only for a clear rate signal, but also for clues on how he intends to communicate. Warsh has indicated a preference for a shift in communication strategy, like potentially not holding a press conference after every Fed meeting. We expect the committee to telegraph a “higher for longer” policy stance in its updated Summary of Economic Projections, which had reflected 25 bps of easing this year and next. It is also likely to drop its easing bias in the statement. This expected shift would move the Fed closer to market pricing, which now reflects a toss-up between “no action” and a 25-bps hike by year-end.
A Hawkish Fed and a Dovish SNB Are Driving Gains in USDCHF
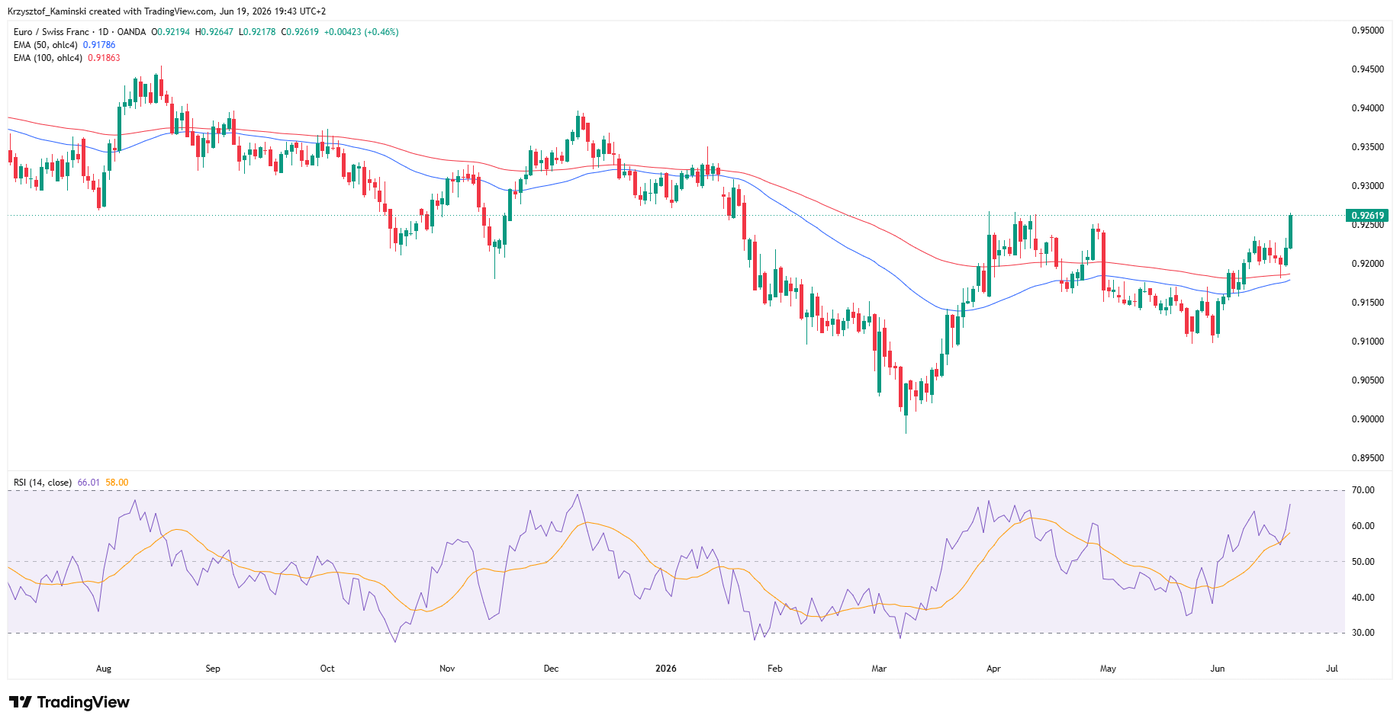
- USDCHF has strengthened sharply, rising 1.3% this week and more than 3.3% since the start of the month, supported by a stronger US dollar and weaker Swiss franc
- The Fed’s hawkish tone boosted the dollar, as markets increased expectations for a possible US rate hike after Kevin Warsh emphasized price stability and the fight against inflation
- The Swiss franc came under pressure after the SNB kept rates at 0% and signaled readiness to intervene in the FX market to prevent excessive franc appreciation, which supports the upward bias in USDCHF
The USDCHF pair has strengthened noticeably in recent days. This week, the exchange rate rose by 1.3%, and since the beginning of the current month it has gained more than 3.3%. This move has been driven mainly by a combination of a stronger dollar and a weaker Swiss franc, which came under pressure following the Swiss National Bank’s statement.
On the US side, the key factor was the FOMC’s decision to leave interest rates unchanged in the 3.5–3.75% range, as well as Kevin Warsh’s first press conference as Chair of the Federal Reserve. Warsh strongly emphasized that the Fed’s priority remains price stability, meaning the fight against inflation. Investors interpreted this message as a signal that the US central bank could return to rate hikes sooner if incoming data confirm persistent price pressures.
As a result, expectations for a more restrictive monetary policy in the United States increased. The market began pricing in the possibility of a rate hike within the next six weeks as a scenario close to a 50% probability. This supported the dollar, especially against lower-yielding currencies such as the Swiss franc.
The SNB keeps rates unchanged but warns against an excessively strong Franc
In Switzerland, the Swiss National Bank kept its main interest rate at 0%, while at the same time emphasizing its readiness to intervene in the foreign exchange market. This means that, if necessary, the SNB may sell francs to limit an excessively rapid and excessive appreciation of the currency.
For the market, this was an important signal. The franc remains one of the key safe-haven currencies, which is why it often strengthens during periods of geopolitical tension. However, the SNB indicated that an overly strong currency could harm the economy, especially exporters, and further reduce inflation. After the statement, the franc weakened against the euro, confirming that investors interpreted the central bank’s stance as a factor limiting the Swiss currency’s appreciation potential.
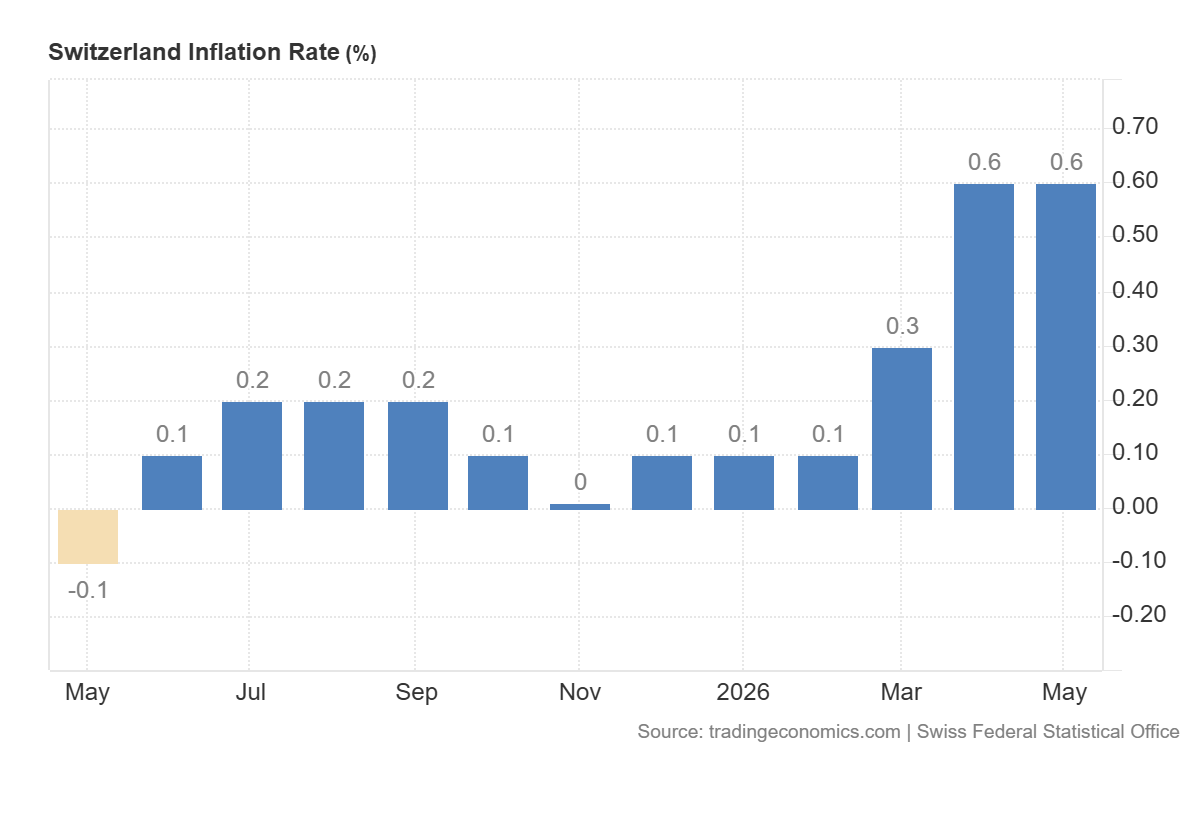
Inflation in Switzerland currently stands at 0.6% and remains within the SNB’s target range of 0% to 2%. The bank slightly raised its inflation forecast for this year from 0.5% to 0.6%, while expecting only moderate price growth in the following years. At the same time, the economic growth forecast remained unchanged, assuming growth of around 1% this year and 1.5% next year. This shows that the SNB’s main concern is currently not inflation, but the exchange rate of the franc.
Diverging central bank stances support USDCHF
The current situation in USDCHF clearly reflects the divergence between Fed and SNB policy. The Federal Reserve is signaling greater determination in fighting inflation and may be ready to tighten monetary policy further. The SNB, by contrast, is keeping rates at 0% and is focused primarily on preventing excessive appreciation of the franc.
This combination supports further gains in USDCHF. The dollar is benefiting from higher expectations for US interest rates, while the franc remains under pressure due to the SNB’s readiness to act in the foreign exchange market. In addition, the temporary agreement in the Middle East reduced demand for safe-haven assets, which also limited interest in the franc.
The market will remain sensitive to data and geopolitics
In the coming weeks, the performance of USDCHF will depend mainly on two factors: US macroeconomic data and the level of geopolitical tensions. If inflation in the United States remains elevated and the Fed maintains a firm tone, the dollar may continue to strengthen. Warsh has announced less predictable communication and greater dependence of decisions on incoming data, which could increase volatility in the currency market.
On the other hand, a decline in oil prices, weaker economic growth or lower inflation readings could reduce expectations for US rate hikes and therefore weigh on the dollar. For the franc, the key issue will remain whether geopolitical tensions rise again. A return of risk aversion could increase demand for the Swiss currency, although the SNB has clearly suggested that it will counteract any excessively sharp appreciation.
USDCHF maintains a bullish bias
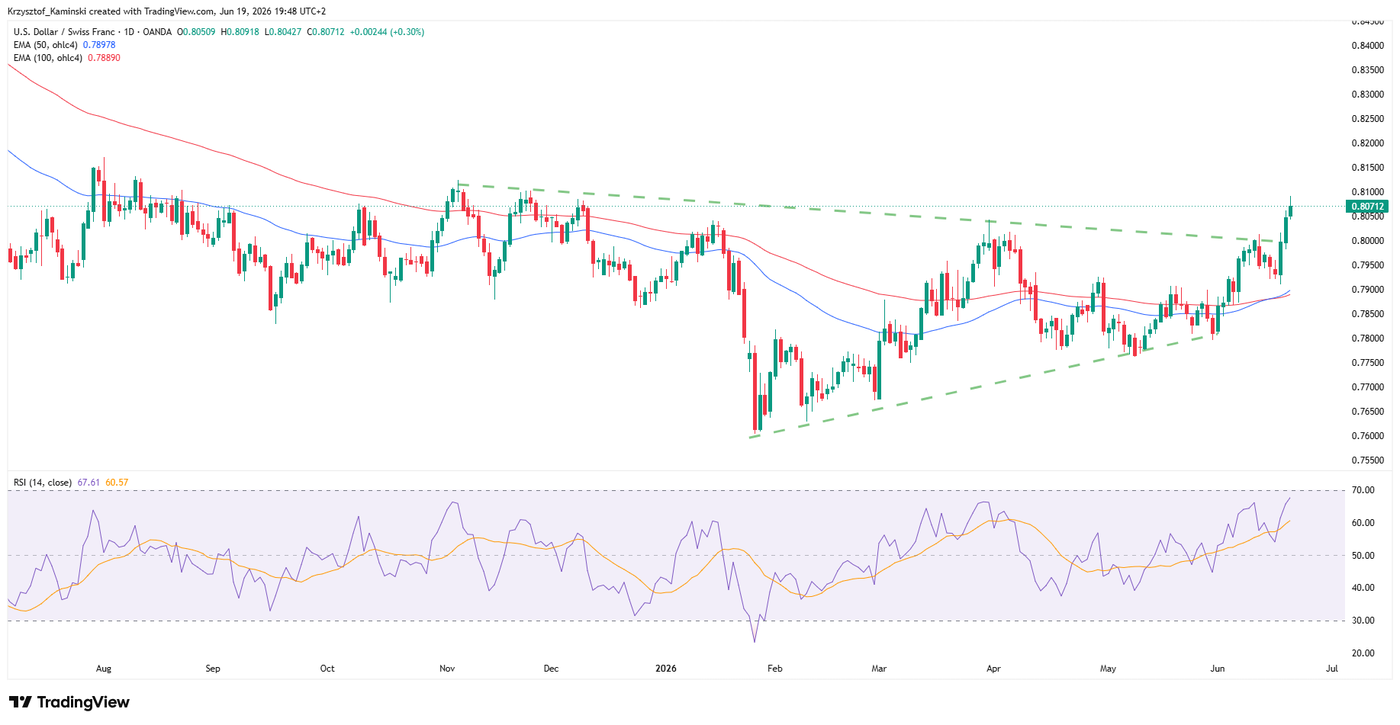
For now, the balance of fundamental factors supports further strength in USDCHF. The pair is benefiting both from dollar appreciation following the Fed’s hawkish message and from franc weakness after the SNB’s statement. The 1.3% weekly rise and the gain of more than 3.3% since the beginning of the month show that investors are clearly shifting capital toward the US currency. As long as the market continues to price in the possibility of rate hikes in the United States, while the SNB signals readiness to limit franc strength, USDCHF may remain under upward pressure.
Summary 6/22 – 6/26
Monday, Jun 22, 2026
| GMT | Ccy | Events | Cons | Prev |
|---|---|---|---|---|
| 01:15 | CNY | 1-Y Loan Prime Rate | 3.00% | 3.00% |
| 01:15 | CNY | 5-Y Loan Prime Rate | 3.50% | 3.50% |
| 12:30 | CAD | CPI M/M May | 0.70% | 0.40% |
| 12:30 | CAD | CPI Y/Y May | 3.00% | 2.80% |
| 12:30 | CAD | CPI Median Y/Y May | 2.10% | 2.10% |
| 12:30 | CAD | CPI Trimmed Y/Y May | 2.00% | 2.00% |
| 12:30 | CAD | CPI Common Y/Y May | 2.50% | 2.50% |
| 14:00 | EUR | Eurozone Consumer Confidence Jun P | -18 | -19 |
| 01:15 | CNY |
| 1-Y Loan Prime Rate | |
| Consensus | 3.00% |
| Previous | 3.00% |
| 01:15 | CNY |
| 5-Y Loan Prime Rate | |
| Consensus | 3.50% |
| Previous | 3.50% |
| 12:30 | CAD |
| CPI M/M May | |
| Consensus | 0.70% |
| Previous | 0.40% |
| 12:30 | CAD |
| CPI Y/Y May | |
| Consensus | 3.00% |
| Previous | 2.80% |
| 12:30 | CAD |
| CPI Median Y/Y May | |
| Consensus | 2.10% |
| Previous | 2.10% |
| 12:30 | CAD |
| CPI Trimmed Y/Y May | |
| Consensus | 2.00% |
| Previous | 2.00% |
| 12:30 | CAD |
| CPI Common Y/Y May | |
| Consensus | 2.50% |
| Previous | 2.50% |
| 14:00 | EUR |
| Eurozone Consumer Confidence Jun P | |
| Consensus | -18 |
| Previous | -19 |
Tuesday, Jun 23, 2026
| GMT | Ccy | Events | Cons | Prev |
|---|---|---|---|---|
| 23:00 | AUD | Manufacturing PMI Jun P | 50.7 | |
| 23:00 | AUD | Services PMI Jun P | 48.7 | |
| 00:30 | JPY | Manufacturing PMI Jun P | 54.5 | 54.5 |
| 00:30 | JPY | Services PMI Jun P | 50 | |
| 07:15 | EUR | France Manufacturing PMI Jun P | 50.4 | 49.7 |
| 07:15 | EUR | France Services PMI Jun P | 45.9 | 44.3 |
| 07:30 | EUR | Germany Manufacturing PMI Jun P | 50.2 | 50.1 |
| 07:30 | EUR | Germany Services PMI Jun P | 48.7 | 48.1 |
| 08:00 | EUR | Eurozone Manufacturing PMI Jun P | 51.2 | 51.6 |
| 08:00 | EUR | Eurozone Services PMI Jun P | 48.1 | 47.7 |
| 08:30 | GBP | Manufacturing PMI Jun P | 53.6 | 53.9 |
| 08:30 | GBP | Services PMI Jun P | 50 | 49.3 |
| 13:45 | USD | Manufacturing PMI Jun P | 54.6 | 55.1 |
| 13:45 | USD | Services PMI Jun P | 51.1 | 50.7 |
| 23:00 | AUD |
| Manufacturing PMI Jun P | |
| Consensus | |
| Previous | 50.7 |
| 23:00 | AUD |
| Services PMI Jun P | |
| Consensus | |
| Previous | 48.7 |
| 00:30 | JPY |
| Manufacturing PMI Jun P | |
| Consensus | 54.5 |
| Previous | 54.5 |
| 00:30 | JPY |
| Services PMI Jun P | |
| Consensus | |
| Previous | 50 |
| 07:15 | EUR |
| France Manufacturing PMI Jun P | |
| Consensus | 50.4 |
| Previous | 49.7 |
| 07:15 | EUR |
| France Services PMI Jun P | |
| Consensus | 45.9 |
| Previous | 44.3 |
| 07:30 | EUR |
| Germany Manufacturing PMI Jun P | |
| Consensus | 50.2 |
| Previous | 50.1 |
| 07:30 | EUR |
| Germany Services PMI Jun P | |
| Consensus | 48.7 |
| Previous | 48.1 |
| 08:00 | EUR |
| Eurozone Manufacturing PMI Jun P | |
| Consensus | 51.2 |
| Previous | 51.6 |
| 08:00 | EUR |
| Eurozone Services PMI Jun P | |
| Consensus | 48.1 |
| Previous | 47.7 |
| 08:30 | GBP |
| Manufacturing PMI Jun P | |
| Consensus | 53.6 |
| Previous | 53.9 |
| 08:30 | GBP |
| Services PMI Jun P | |
| Consensus | 50 |
| Previous | 49.3 |
| 13:45 | USD |
| Manufacturing PMI Jun P | |
| Consensus | 54.6 |
| Previous | 55.1 |
| 13:45 | USD |
| Services PMI Jun P | |
| Consensus | 51.1 |
| Previous | 50.7 |
Wednesday, Jun 24, 2026
| GMT | Ccy | Events | Cons | Prev |
|---|---|---|---|---|
| 23:50 | JPY | Corporate Service Price Index Y/Y May | 3.30% | 3.00% |
| 23:50 | JPY | BoJ Summary of Opinions | ||
| 01:30 | AUD | CPI M/M May | -0.40% | 0.40% |
| 01:30 | AUD | CPI Y/Y May | 4.30% | 4.20% |
| 01:30 | AUD | Trimmed Mean CPI M/M May | 0.30% | 0.30% |
| 01:30 | AUD | Trimmed Mean CPI Y/Y May | 3.60% | 3.40% |
| 08:00 | CHF | UBS Economic Expectations Jun | -11.1 | |
| 08:00 | EUR | Germany IFO Business Climate Jun | 85.6 | 84.9 |
| 08:00 | EUR | Germany IFO Current Assessment Jun | 86 | 86.1 |
| 08:00 | EUR | Germany IFO Expectations Jun | 85 | 83.8 |
| 12:30 | USD | Current Account (USD) Q1 | -225B | -190.7B |
| 14:00 | USD | New Home Sales May | 640K | 622K |
| 14:30 | USD | Crude Oil Inventories (Jun 19) | -3.9M | -8.3M |
| 23:50 | JPY |
| Corporate Service Price Index Y/Y May | |
| Consensus | 3.30% |
| Previous | 3.00% |
| 23:50 | JPY |
| BoJ Summary of Opinions | |
| Consensus | |
| Previous | |
| 01:30 | AUD |
| CPI M/M May | |
| Consensus | -0.40% |
| Previous | 0.40% |
| 01:30 | AUD |
| CPI Y/Y May | |
| Consensus | 4.30% |
| Previous | 4.20% |
| 01:30 | AUD |
| Trimmed Mean CPI M/M May | |
| Consensus | 0.30% |
| Previous | 0.30% |
| 01:30 | AUD |
| Trimmed Mean CPI Y/Y May | |
| Consensus | 3.60% |
| Previous | 3.40% |
| 08:00 | CHF |
| UBS Economic Expectations Jun | |
| Consensus | |
| Previous | -11.1 |
| 08:00 | EUR |
| Germany IFO Business Climate Jun | |
| Consensus | 85.6 |
| Previous | 84.9 |
| 08:00 | EUR |
| Germany IFO Current Assessment Jun | |
| Consensus | 86 |
| Previous | 86.1 |
| 08:00 | EUR |
| Germany IFO Expectations Jun | |
| Consensus | 85 |
| Previous | 83.8 |
| 12:30 | USD |
| Current Account (USD) Q1 | |
| Consensus | -225B |
| Previous | -190.7B |
| 14:00 | USD |
| New Home Sales May | |
| Consensus | 640K |
| Previous | 622K |
| 14:30 | USD |
| Crude Oil Inventories (Jun 19) | |
| Consensus | -3.9M |
| Previous | -8.3M |
Thursday, Jun 25, 2026
| GMT | Ccy | Events | Cons | Prev |
|---|---|---|---|---|
| 01:30 | AUD | Employment Change May | 30.5K | -18.6K |
| 01:30 | AUD | Unemployment Rate May | 4.40% | 4.50% |
| 06:00 | EUR | Germany GfK Consumer Confidence Jul | -28 | -29.8 |
| 12:30 | USD | Initial Jobless Claims (Jun 19) | 225K | 226K |
| 12:30 | USD | Personal Income M/M May | 0.40% | 0.00% |
| 12:30 | USD | Personal Spending May | 0.60% | 0.50% |
| 12:30 | USD | PCE Price Index M/M May | 0.50% | 0.40% |
| 12:30 | USD | PCE Price Index Y/Y May | 4.10% | 3.80% |
| 12:30 | USD | Core PCE Price Index M/M May | 0.30% | 0.20% |
| 12:30 | USD | Core PCE Price Index Y/Y May | 3.40% | 3.30% |
| 12:30 | USD | Durable Goods Orders May | -4.70% | 8.00% |
| 12:30 | USD | Durable Goods Orders ex Transport May | 0.50% | 1.10% |
| 12:30 | USD | GDP Annualized Q1 F | 1.60% | 1.60% |
| 12:30 | USD | GDP Price Index Q1 F | 3.50% | 3.50% |
| 14:30 | USD | Natural Gas Storage (Jun 19) | 67B | 73B |
| 01:30 | AUD |
| Employment Change May | |
| Consensus | 30.5K |
| Previous | -18.6K |
| 01:30 | AUD |
| Unemployment Rate May | |
| Consensus | 4.40% |
| Previous | 4.50% |
| 06:00 | EUR |
| Germany GfK Consumer Confidence Jul | |
| Consensus | -28 |
| Previous | -29.8 |
| 12:30 | USD |
| Initial Jobless Claims (Jun 19) | |
| Consensus | 225K |
| Previous | 226K |
| 12:30 | USD |
| Personal Income M/M May | |
| Consensus | 0.40% |
| Previous | 0.00% |
| 12:30 | USD |
| Personal Spending May | |
| Consensus | 0.60% |
| Previous | 0.50% |
| 12:30 | USD |
| PCE Price Index M/M May | |
| Consensus | 0.50% |
| Previous | 0.40% |
| 12:30 | USD |
| PCE Price Index Y/Y May | |
| Consensus | 4.10% |
| Previous | 3.80% |
| 12:30 | USD |
| Core PCE Price Index M/M May | |
| Consensus | 0.30% |
| Previous | 0.20% |
| 12:30 | USD |
| Core PCE Price Index Y/Y May | |
| Consensus | 3.40% |
| Previous | 3.30% |
| 12:30 | USD |
| Durable Goods Orders May | |
| Consensus | -4.70% |
| Previous | 8.00% |
| 12:30 | USD |
| Durable Goods Orders ex Transport May | |
| Consensus | 0.50% |
| Previous | 1.10% |
| 12:30 | USD |
| GDP Annualized Q1 F | |
| Consensus | 1.60% |
| Previous | 1.60% |
| 12:30 | USD |
| GDP Price Index Q1 F | |
| Consensus | 3.50% |
| Previous | 3.50% |
| 14:30 | USD |
| Natural Gas Storage (Jun 19) | |
| Consensus | 67B |
| Previous | 73B |
Friday, Jun 26, 2026
| GMT | Ccy | Events | Cons | Prev |
|---|---|---|---|---|
| 23:30 | JPY | Tokyo CPI Y/Y Jun | 1.40% | |
| 23:30 | JPY | Tokyo CPI Core Y/Y Jun | 1.60% | 1.30% |
| 23:30 | JPY | Tokyo CPI Core-Core Y/Y Jun | 1.60% | |
| 12:30 | USD | Goods Trade Balance (USD) May P | -85.0B | -83.7B |
| 12:30 | USD | Wholesale Inventories May P | 0.20% | 0.60% |
| 14:00 | USD | UoM Consumer Sentiment Jun F | 48.9 | 48.9 |
| 14:00 | USD | UoM 1-Yr Inflation Expectations Jun F | 4.60% | 4.60% |
| 23:30 | JPY |
| Tokyo CPI Y/Y Jun | |
| Consensus | |
| Previous | 1.40% |
| 23:30 | JPY |
| Tokyo CPI Core Y/Y Jun | |
| Consensus | 1.60% |
| Previous | 1.30% |
| 23:30 | JPY |
| Tokyo CPI Core-Core Y/Y Jun | |
| Consensus | |
| Previous | 1.60% |
| 12:30 | USD |
| Goods Trade Balance (USD) May P | |
| Consensus | -85.0B |
| Previous | -83.7B |
| 12:30 | USD |
| Wholesale Inventories May P | |
| Consensus | 0.20% |
| Previous | 0.60% |
| 14:00 | USD |
| UoM Consumer Sentiment Jun F | |
| Consensus | 48.9 |
| Previous | 48.9 |
| 14:00 | USD |
| UoM 1-Yr Inflation Expectations Jun F | |
| Consensus | 4.60% |
| Previous | 4.60% |
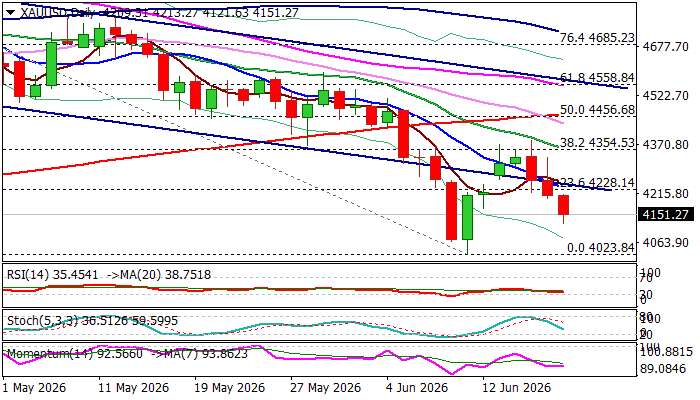
Gold – Bears Regain Control After Short-Lived Correction and Look for Renewed Attack at Key Supports
Gold remains in red for the third straight day, on track for the third consecutive weekly loss, under renewed pressure from Fed’s hawkish steer.
Recovery leg from $4000 support zone (metal hit new 2026 low at $4023 on June 11), repeatedly failed to register close above important Fibo resistance at $4354 (38.2% of $4889/$4023 descend) that resulted in formation of bull-trap.
Post-Fed acceleration lower confirmed an end of corrective phase and shifted near-term focus lower (fresh weakness has so far retraced over 61.8% of $4023/$4382 recovery leg), as the price is about to register second weekly close below the support line of bear-channel (following a short-lived return into channel).
Fully bearish daily techs (reinforced by the latest formation of 30/200DMA bear-cross) add to expectations for renewed probe through cracked Fibo support at $4077 (38.2% of $1616/$5598 uptrend) and attack at rising weekly cloud top ($4058) which guard psychological $4000 support.
Hawkish Fed rate outlook is likely to continue to keep metal’s price under pressure, though, significant supports within $4100 and $4000 need to be cleared to generate bearish continuation signal.
Res: 4213; 4251; 4354; 4382
Sup: 4077; 4058; 4023; 4000
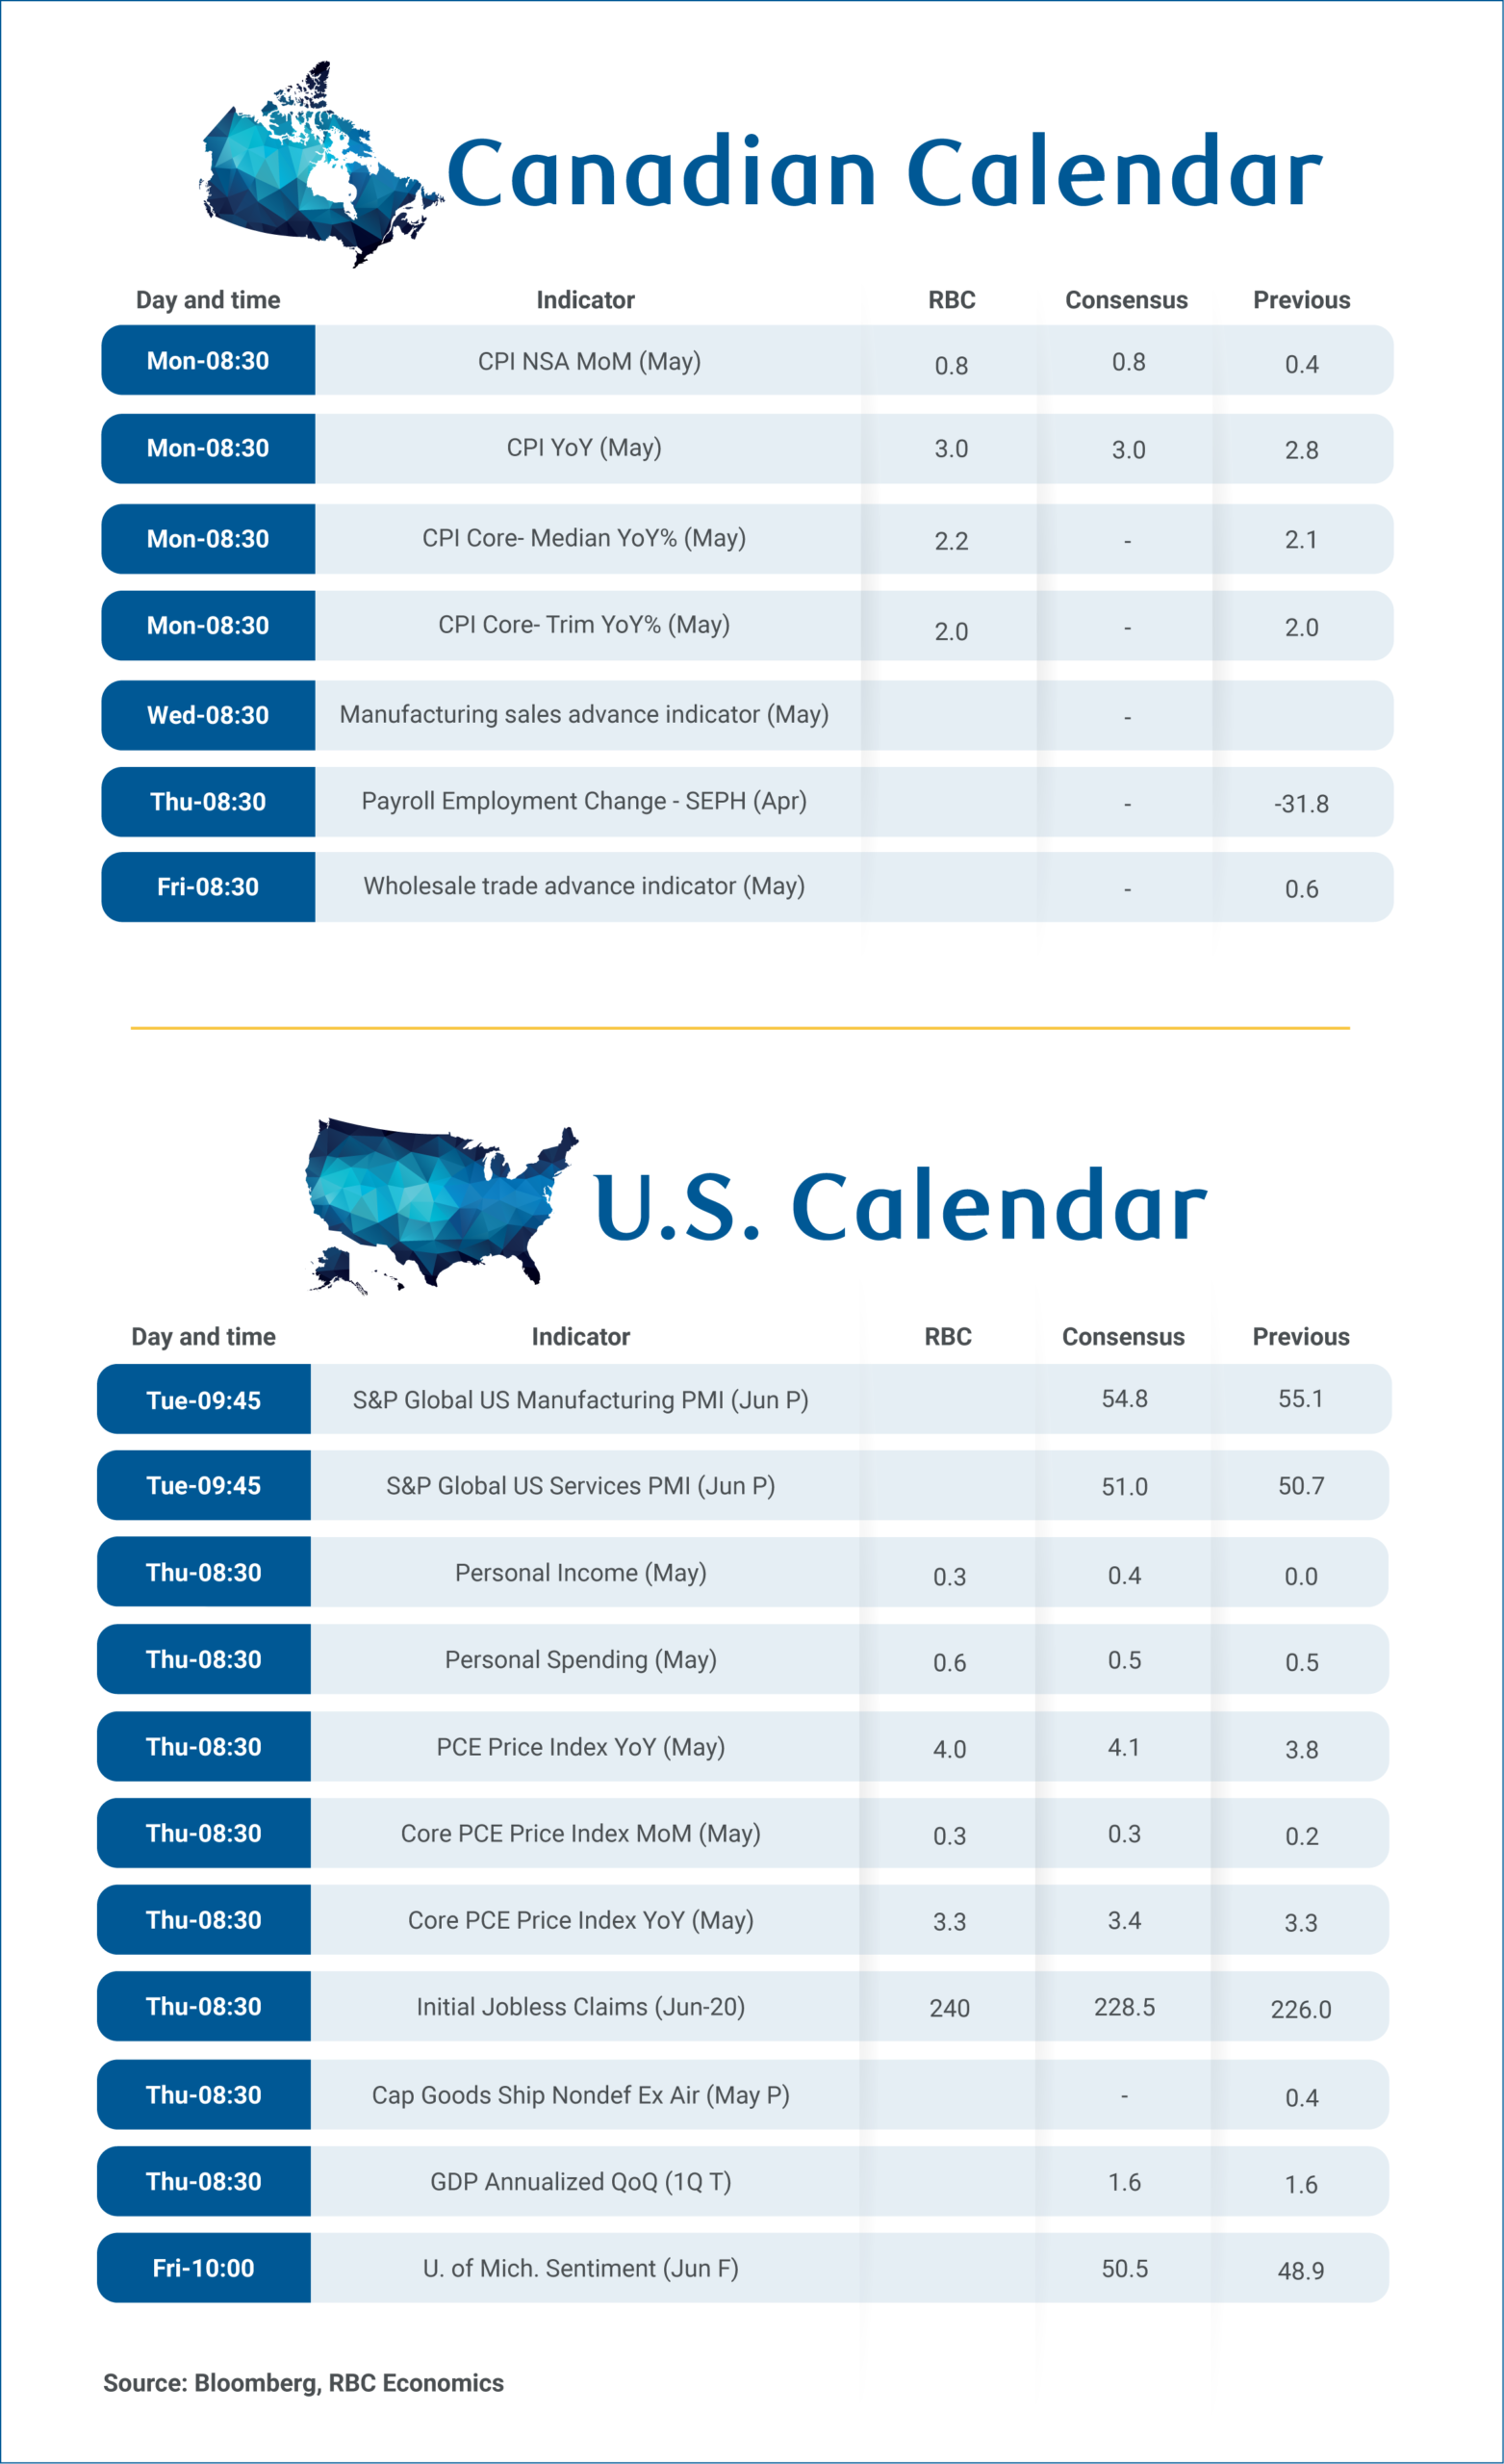
Canada’s Headline Inflation to Edge Higher as Core Remains Near Target
Canada’s Consumer Price Index report for May on Monday will provide an updated reading on inflation trends following the Bank of Canada’s decision to leave interest rates unchanged earlier this month.
We expect headline inflation to rise to 3% year-over-year in May, up from 2.8% in April. Energy prices are expected to remain the largest contributor to price growth with the annual gain likely edging higher after jumping to 19% in April. But, food price inflation likely also increased. We look for a tick up to 3.8% after slowing to 3.5% in April from 4% in March.
Energy prices have continued to drive headline inflation higher, but there’s nothing the BoC can do about global oil prices.
The central bank would be far more concerned about a broadening of price pressures beyond directly impacted energy prices. But, recent reports have generally shown strength in headline CPI has been concentrated in a limited number of categories with underlying measures staying closer to the BoC’s 2% inflation target.
We look for core inflation measures to remain largely contained in May despite the increase in headline inflation. CPI growth excluding food and energy likely held at 1.5% y/y, while the BoC’s preferred median and trim CPI measures stayed close to the 2% target.
The May report will also incorporate updated CPI basket weights based on 2025 consumer spending patterns. The largest changes include higher weights for transportation, health and personal care expenditures, partially offset by a lower weight for shelter. While the revised basket may result in modest changes to the contribution of specific components, we expect little impact on total inflation measurements.
Canada’s April Survey of Employment, Payrolls and Hours (SEPH) will be watched closely after a larger-than-expected bounce back in jobs in the timelier Labour Force Survey (LFS) in May. Job vacancies in the SEPH (not available in LFS) will be key, and have been edging higher in a sign that labour demand is stabilizing. We expect SEPH wage growth will continue to underperform surprisingly firm LFS readings in April. But, May data showed LFS wage growth slowed to 3% y/y, more consistent with an edging lower but still elevated unemployment rate.
We expect U.S. personal income to rise 0.4% m/m in May, trailing the 0.6% m/m increase we anticipate for personal spending, indicating consumers are continuing to spend beyond their income growth. This spending is being funded by drawing down savings rather than higher incomes with the personal savings rate expected to potentially decline further from April’s 2.6%. The data should confirm that U.S. consumers are maintaining spending momentum at the expense of their savings buffer.