
Sample Category Title
USD/CHF Daily Outlook
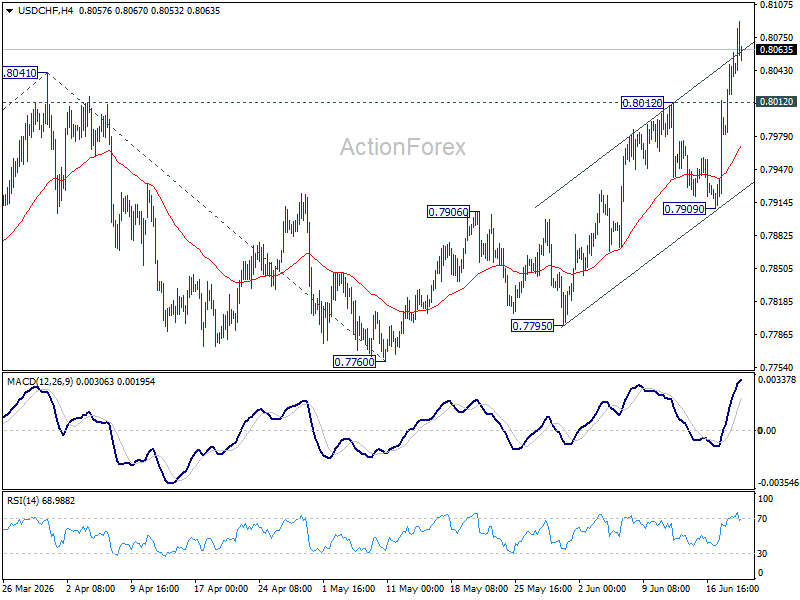
USD/CHF's rally continues today and intraday bias remains on the upside. Break of 0.8041 confirms resumption of the rise from 0.7603. Next target is 100% projection 0.7603 to 0.841 from 0.7600 at 0.8198. On the downside, below 0.8012 resistance turned support will turn intraday bias neutral and bring consolidations first before staging another rise.
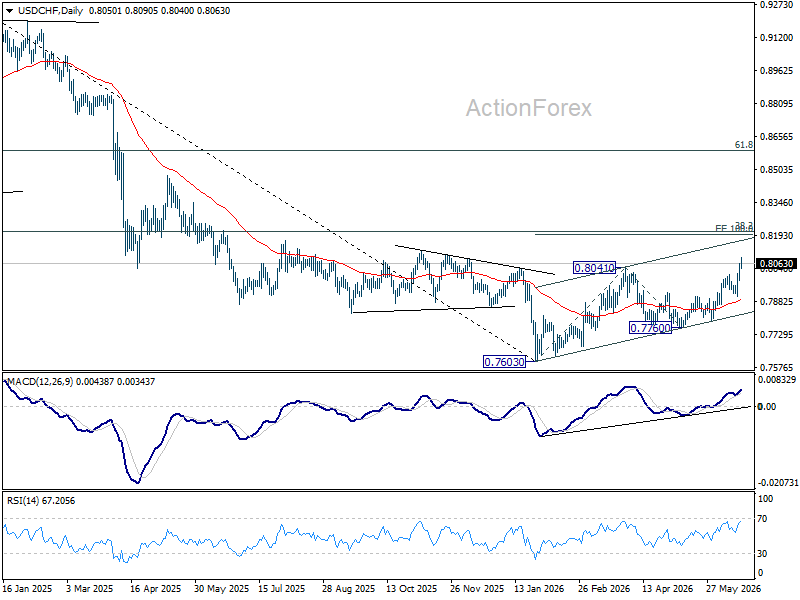
In the bigger picture, while a medium term bottom was formed at 0.7603, it's still early to call for bullish trend reversal. As long as 38.2% retracement of 0.9200 (2025 high) to 0.7603 at 0.8213 holds, the larger down trend could still continue through 0.7603 at a later stage. However, firm break of 0.7603 will argue that the trend has reversed and turn focus to 0.8332 support turned resistance (2023 low) for confirmation.
AUD/USD Daily Report
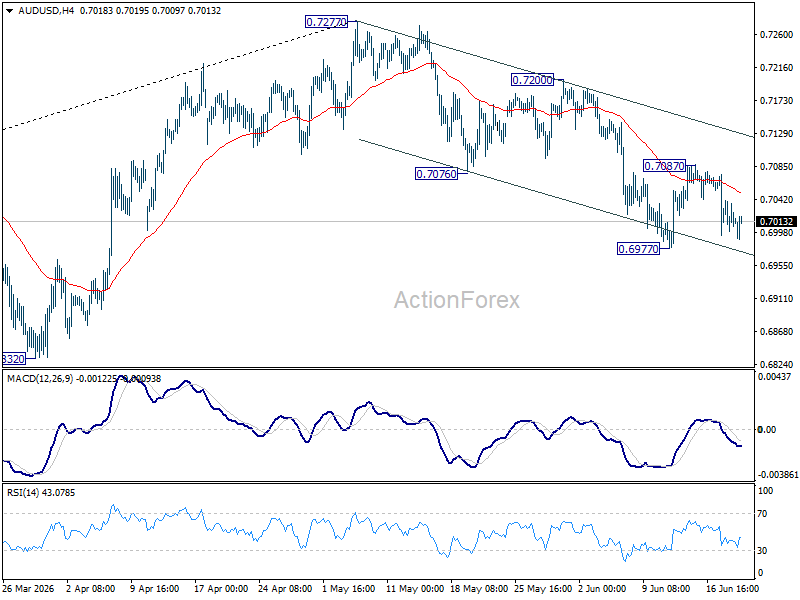
AUD/USD is still bounded in range of 0.6977/7087 and intraday bias remains neutral. On the downside, break of 0.6977 will resume the fall from 0.7277 towards 0.6832 support. On the upside, break of 0.7087 will bring stronger rebound to 0.7200 resistance.
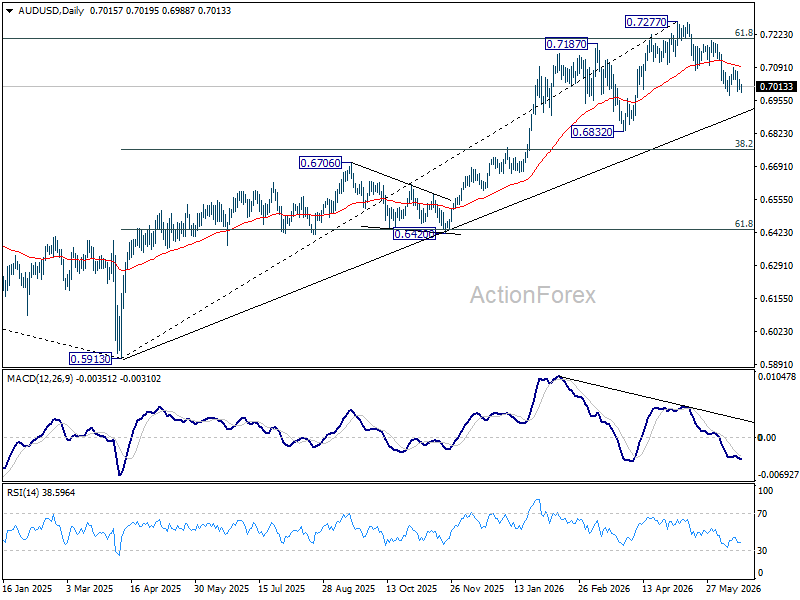
In the bigger picture, considering bearish divergence condition in D MACD, a medium term top could be formed at 0.7277 after failing to sustain above 61.8% retracement of 0.8006 (2021 high) to 0.5913 (2024 low) at 0.7206). Deeper fall could be seen to 38.2% retracement of 5913 to 0.7277 at 0.6756 as a correction. But strong support should be seen there to bring rebound. Consolidations would continue below 0.7277 for a while.
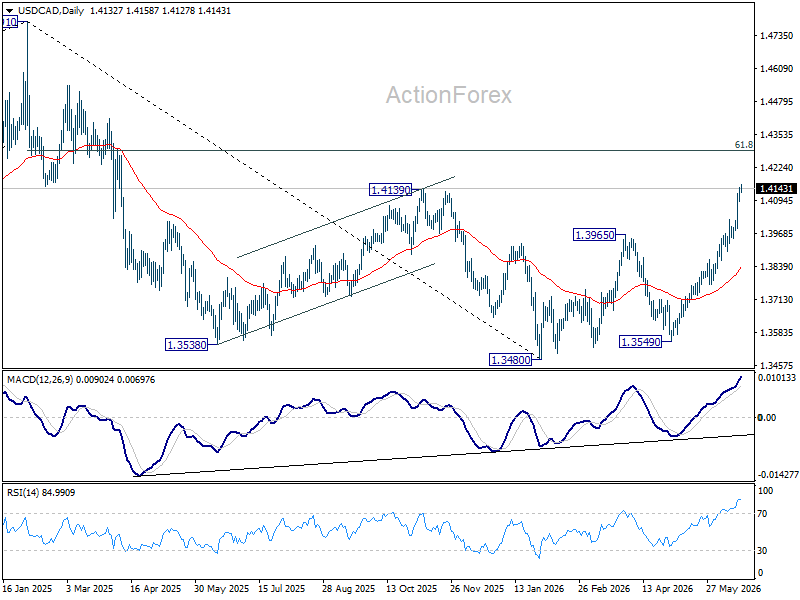
USD/CAD Daily Outlook
Intraday bias in USD/CAD remains on the upside at this point. Further rally should be seen to 61.8% retracement of 1.4791 to 1.3480 at 1.4290 next. On the downside, below 1.4092 minor support will turn intraday bias neutral and bring consolidations first, before staging another rally.
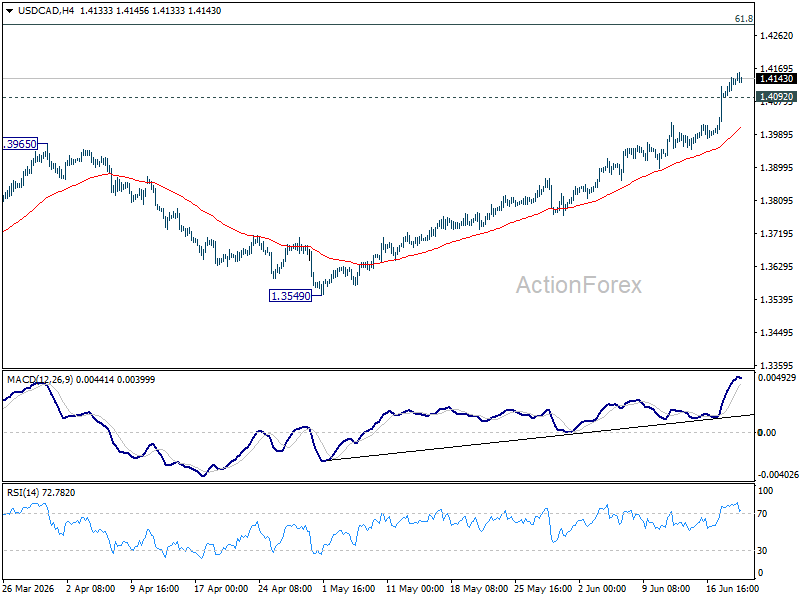
In the bigger picture, current development suggests that fall from 1.4791 has completed as a three wave correction to 1.3480. It's still early to judge if rise from there a corrective bounce, or resumption of the larger up trend from 1.2005 (2021 low). But in either case, retest of 1.4791 high should be seen next.
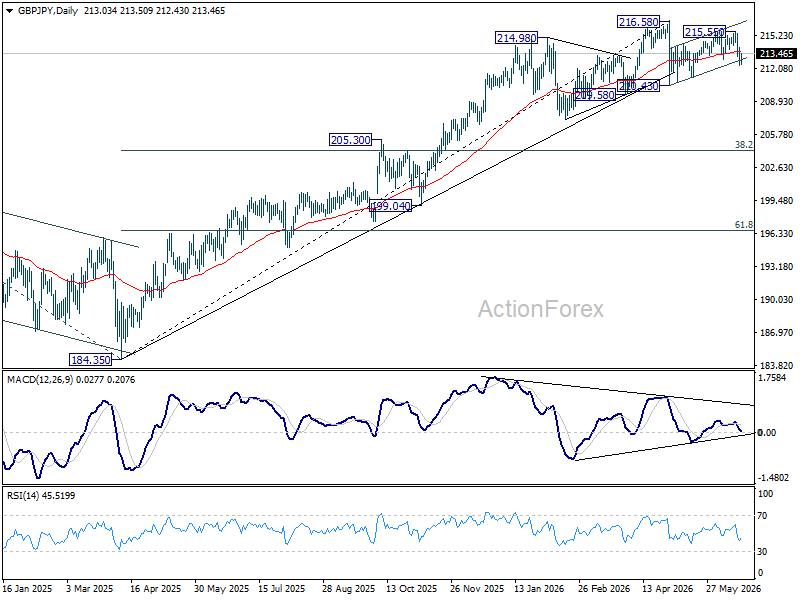
GBP/JPY Daily Outlook
Intraday bias in GBP/JPY remains on the downside at this point. Rebound from 210.43 could have completed at 215.59 already. Deeper fall should be seen to 211.23 support first. Firm break there will target 210.43. On the upside, above 214.04 minor resistance will turn intraday bias neutral again.
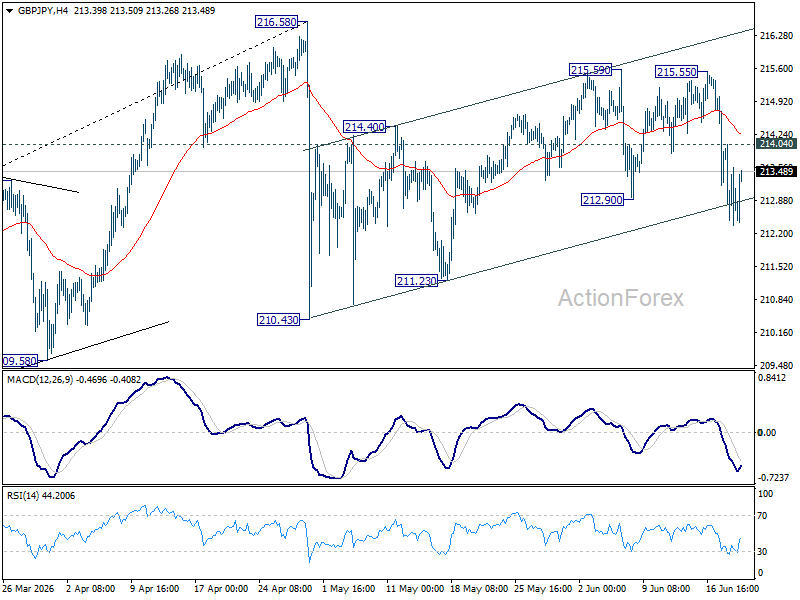
In the bigger picture, there is no clear sign of trend reversal yet. The long term up trend could still extend to 61.8% projection of 148.93 (2022 low) to 208.09 (2024 high) from 184.35 at 220.90 on resumption. However, sustained break of 55 W EMA (now at 207.11) will argue that it's already in medium term down trend for 184.35 support.
EUR/JPY Daily Outlook
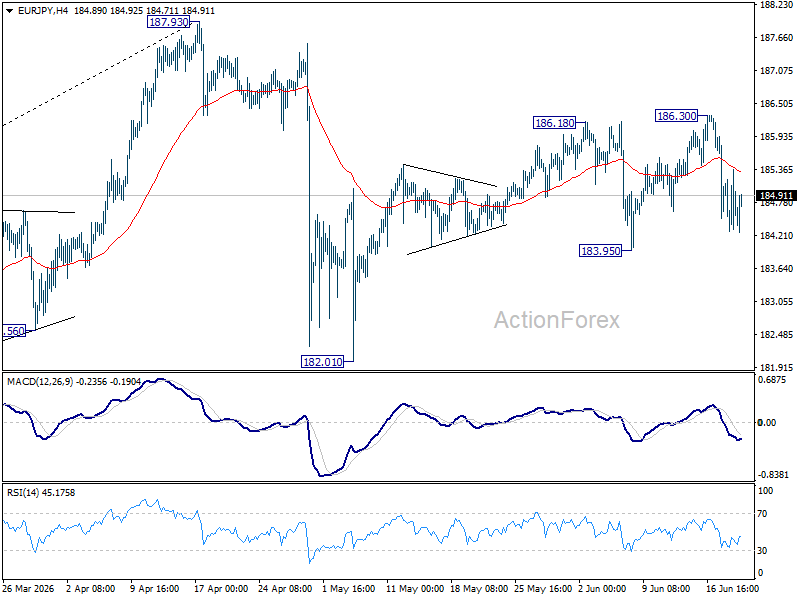
EUR/JPY recovered ahead of 183.95 support and intraday bias is turned neutral first. On the downside, firm break of 183.95 will argue that rebound from 182.01 has completed, and bring deeper fall back to this support. Nevertheless, break of 186.30 will resume the rise to retest 187.93 high instead.
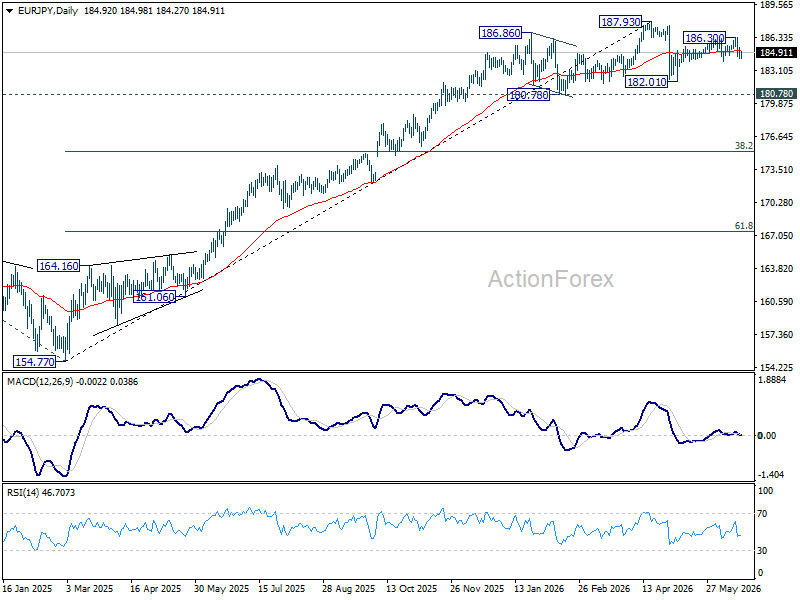
In the bigger picture, there is no sign of reversal yet. Uptrend from 114.42 (2020 low) is still expected to resume at a later stage to 78.6% projection of 124.37 (2022 low) to 175.41 (2025 high) from 154.77 at 194.88. However, sustained break of 55 W EMA (now at 179.23) will argue that it's already in a medium term down trend to 175.41 resistance turned support and below.
EUR/GBP Daily Outlook
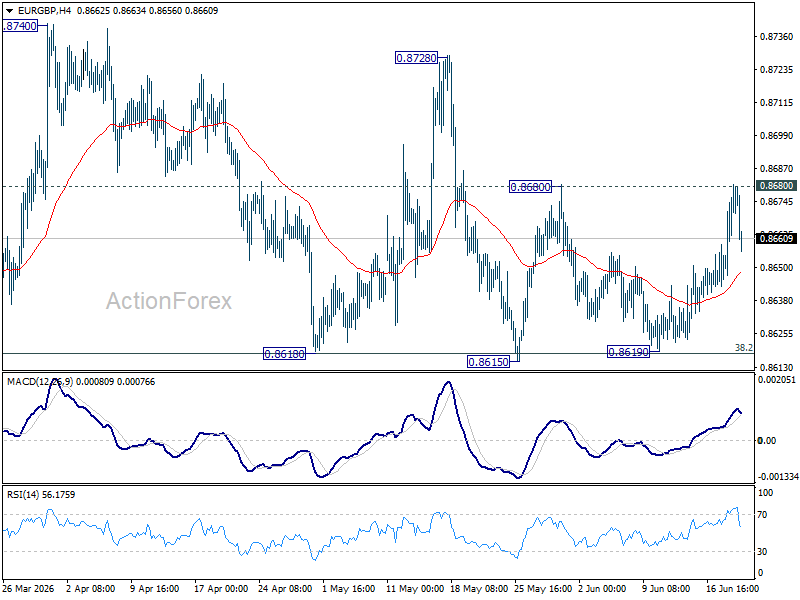
EUR/GBP failed to sustain above 0.8680 resistance on first attempt, and intraday bias remains neutral. On the upside, firm break of 0.8680 will bring further rally back to 0.8278 resistance. Decisive break there will argue that fall from 0.8863 has completed already. On the downside, however, decisive break of 0.8610 support will revive the case of bearish trend reversal.
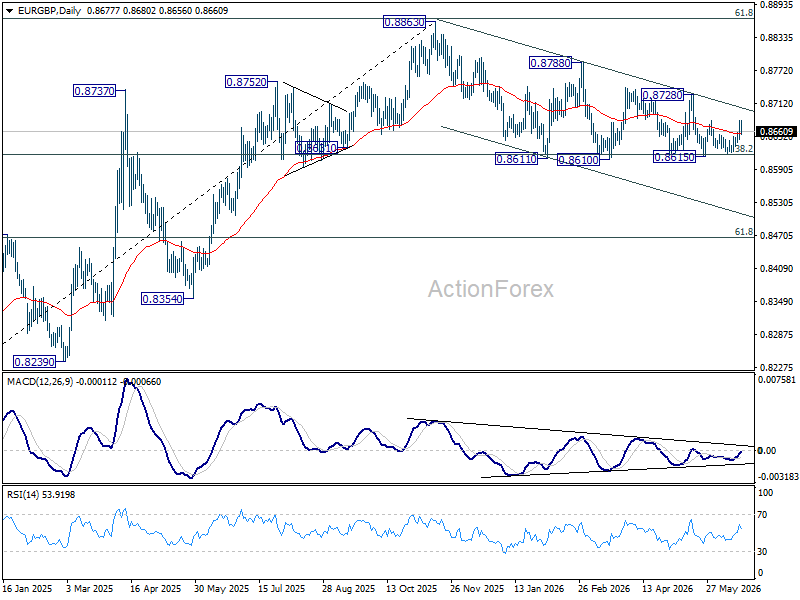
In the bigger picture, focus is staying on 38.2% retracement of 0.8221 to 0.8863 at 0.8618. Strong rebound from there will retain medium term bullishness. Rise from 0.8221 should resume through 0.8863 at a later stage. Nevertheless, sustained break of 0.8618 will confirm that whole rise from 0.8221 has completed at 0.8863. Deeper decline should then be seen to 61.8% retracement at 0.8466 at least.
EUR/AUD Daily Outlook
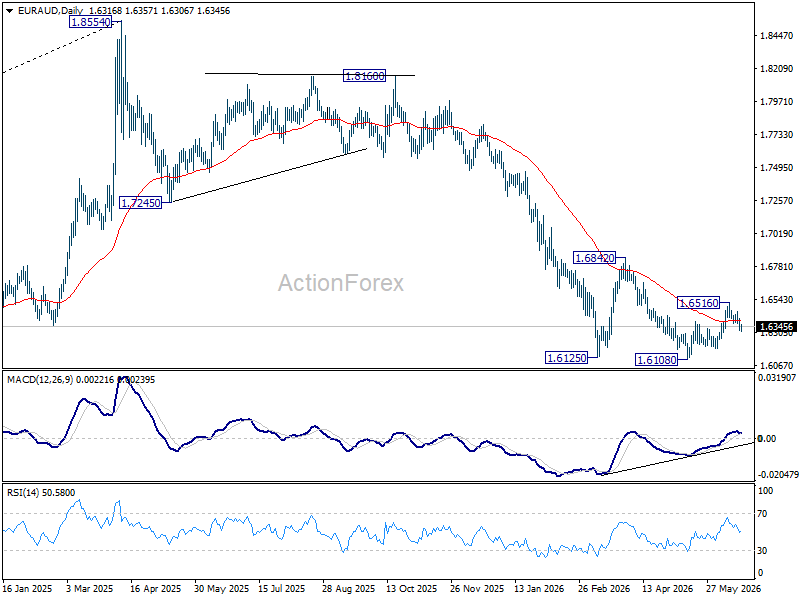
Extended fall in EUR/AUD suggests that rebound from 1.6108 has completed as a corrective three-wave move to 1.6516. Intraday bias is back on the downside for 1.6108/6186 support zone. On the upside, above 1.6453 will turn bias back to the upside, and resume the rise from 1.6108 through 1.6516.
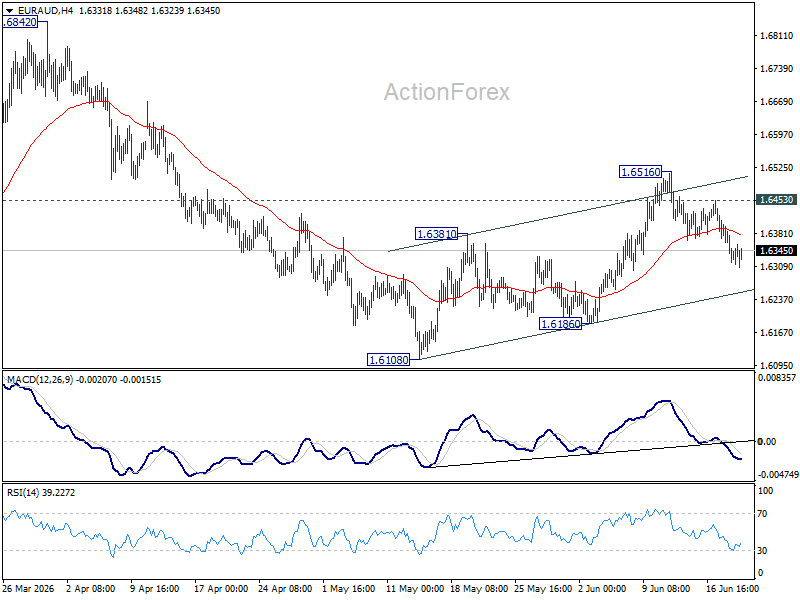
In the bigger picture, outlook will stay bearish as long as 1.6842 resistance holds. Fall from 1.8554 (2025 high) is expected to continue to 61.8% retracement of 1.4281 to 1.8554 at 1.5913. Decisive break there will pave the way back to 1.4281 (2022 low). However, firm break of 1.6842 should confirm medium term bottoming, and bring stronger rally.
EUR/CHF Daily Outlook
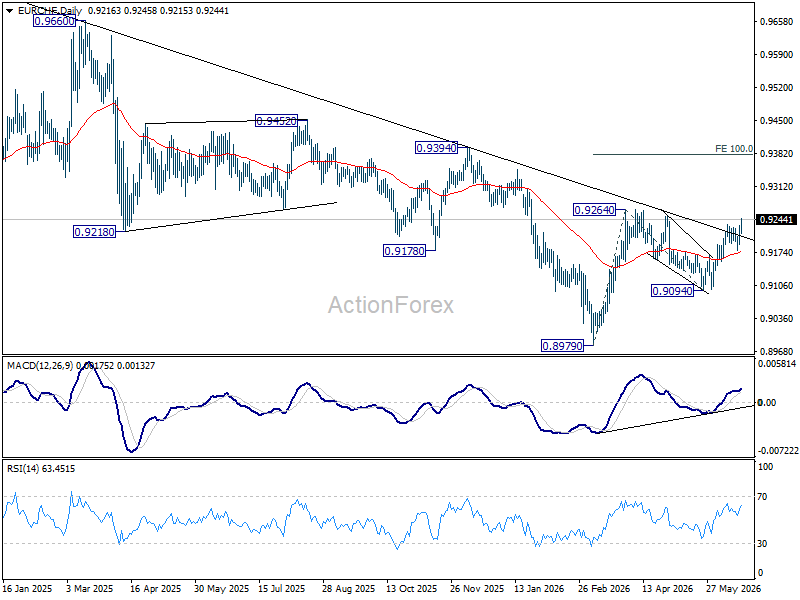
Intraday bias in EUR/CHF is back on the upside with break of 0.9234 temporary top. Further rise should be seen to retest 0.9264 first. Firm break there will resume the rally from 0.8979 to 100% projection of 0.8979 to 0.9264 from 0.9094 at 0.9379. Outlook will now remain bullish as long as 0.9179 support holds, in case of retreat.
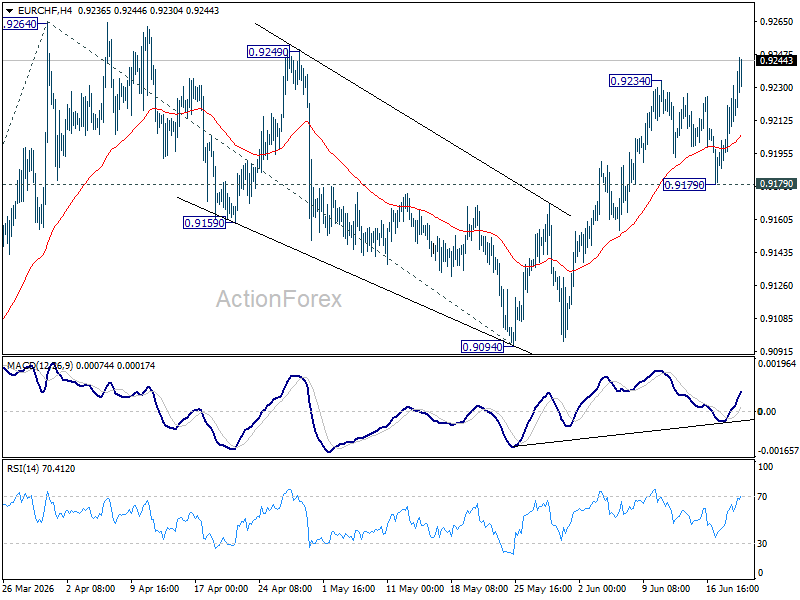
In the bigger picture, as long as 0.9394 resistance holds, down trend from 0.9928 (2024 high) could still be in progress. Firm break of 0.8979 will confirm down trend resumption. However, decisive break of 0.9394 will be an important sign of medium term bullish reversal.
EURUSD – Larger Bears May Take a Breather Before Probing Through 2026 Low
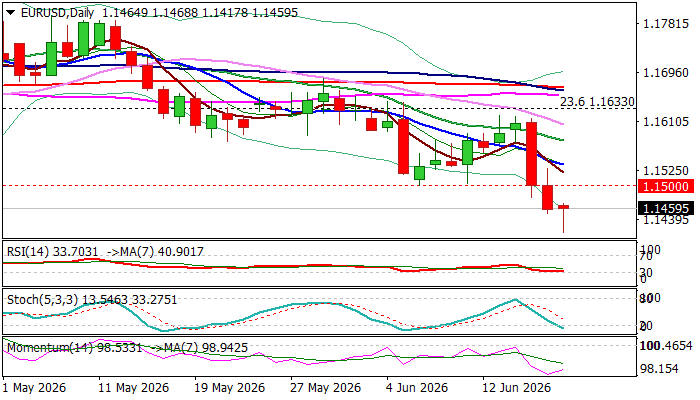
The Euro trades near 2026 low (1.1410) on Friday, holding in red for the third straight day, in reaction to hawkish signals from Fed (the pair has registered the biggest daily loss since 30 July 2025 on Wednesday, following Fed’s hawkish hold).
The price neared YTD low on Friday, but subsequent bounce that created long tail on daily candle signals that bears started to face increased headwinds on approach to significant support.
This may lead to scenario of consolidation / limited correction, as oversold conditions and end of the week could spark partial profit taking.
Overall structure remains firmly bearish on daily chart (reinforced by the latest 100/200 DMA bear cross) suggesting that bears may take a breather to position for fresh push lower.
Broken 1.1500 support (former base / round-figure) reverted to initial resistance, followed by falling 10DMA (1.1536) which should ideally cap upticks.
Firm break of 1.1410 (2026 low) and 1.1355 (Fibo 38.2% of 1.0177/1.2082 rally) would generate strong bearish signal and open way for deeper correction of Jan 2025 / Jan 2026 ascend.
Res: 1.1500; 1.1536; 1.1578; 1.1620
Sup: 1.1410; 1.1355; 1.1283; 1.1215
Bitcoin Breaks the Channel, ETHereum Fails to Reclaim Support
Market Overview
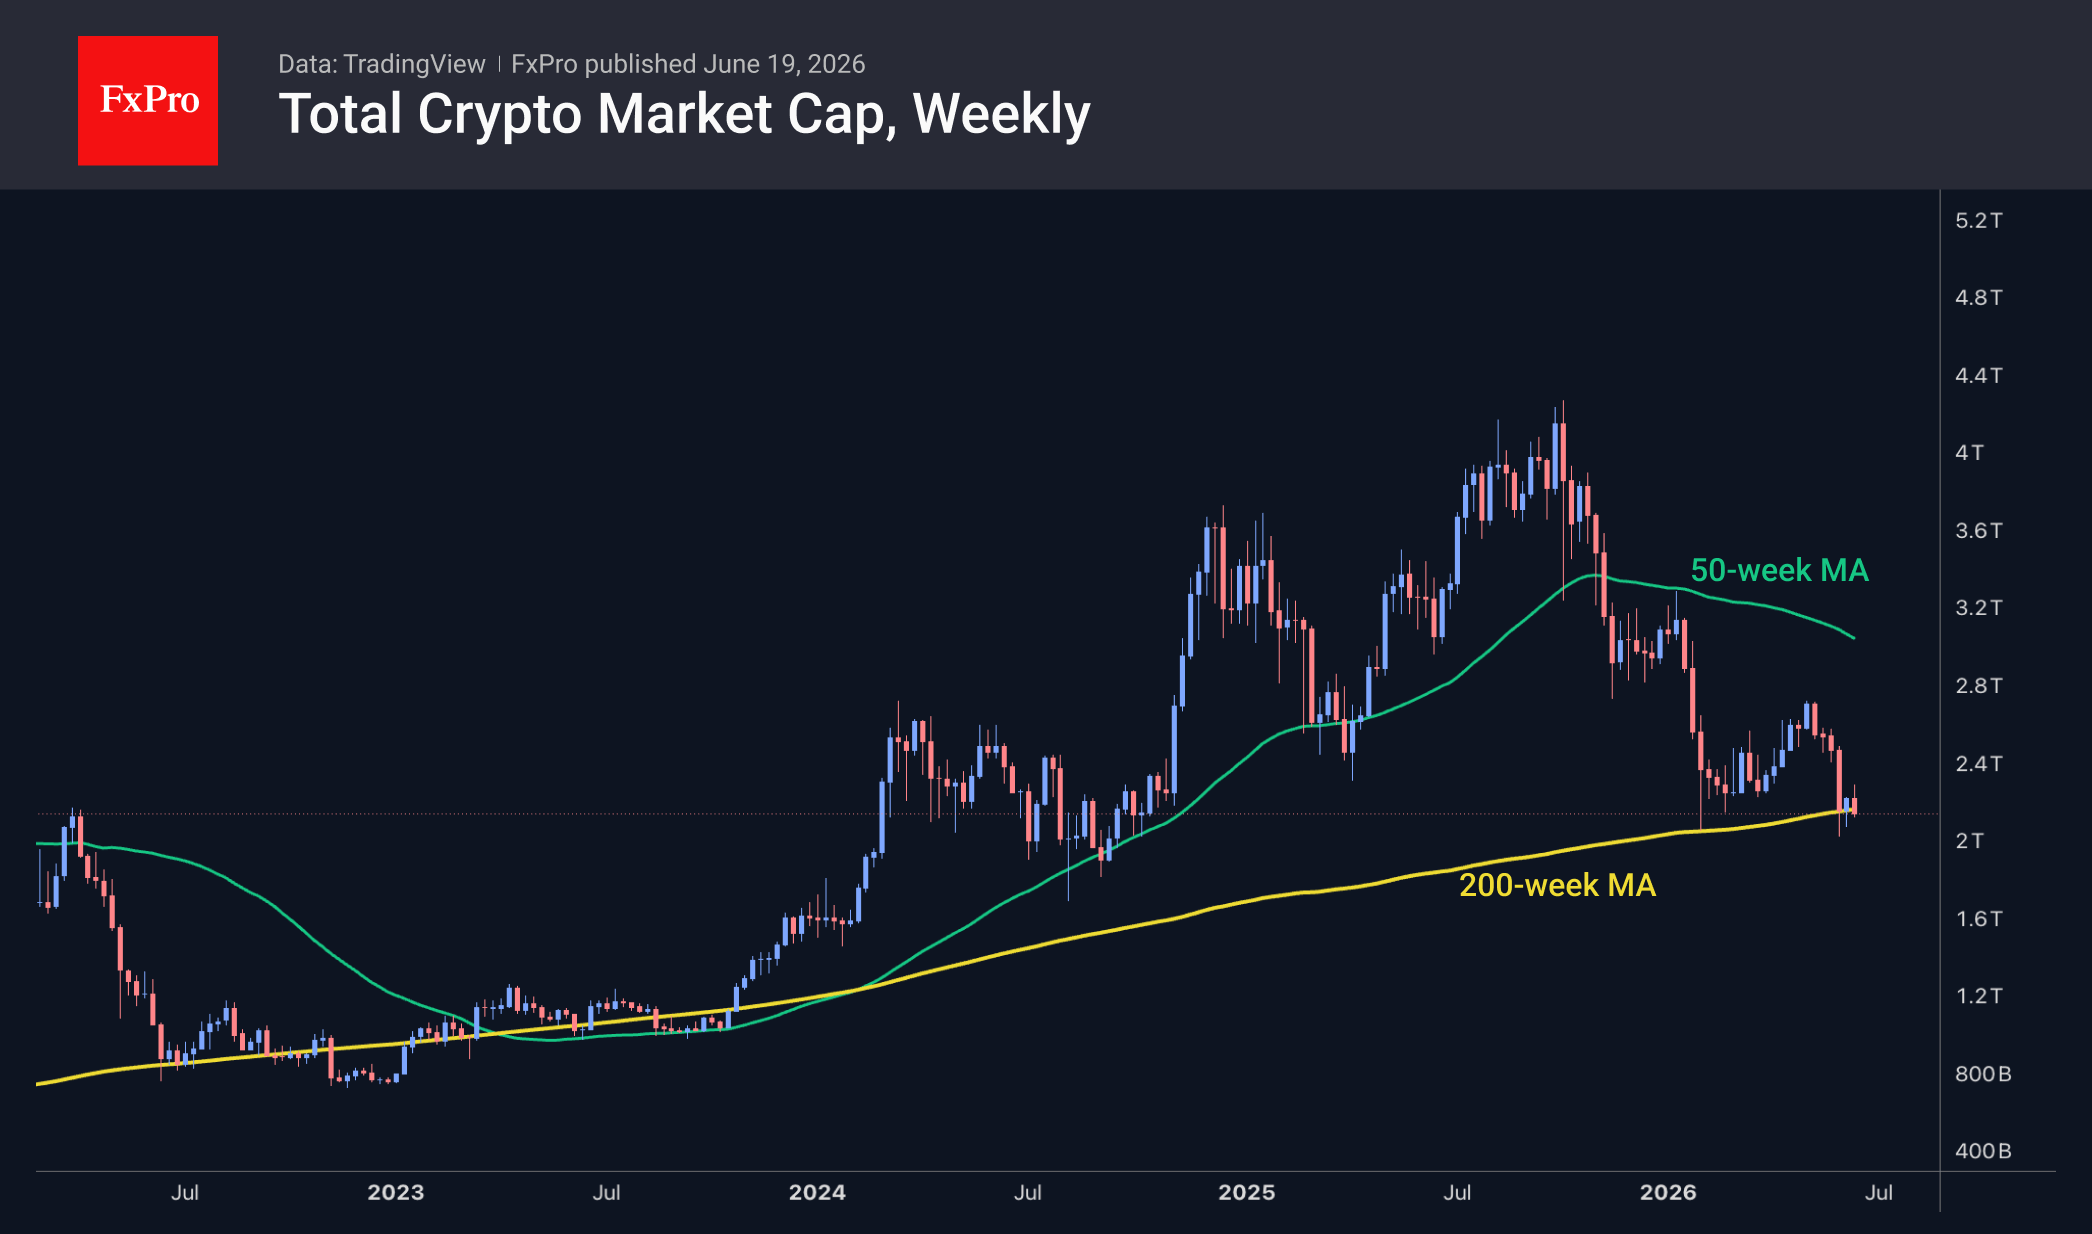
The crypto market has fallen 1.8% over the past 24 hours, to $2.16T, continuing its downward trend after a rebound in the first half of the month. Market capitalisation has once again returned to its 200-week moving average, around which it has been fluctuating for the third consecutive week. We should be prepared for a prolonged period of trading near or below this line, as was the case from June 2022 to October 2023, when periods below it lasted between 4 and 18 weeks. Among the most liquid coins, only three have gained over the past day: The Graph (+1.8%), Aave (+0.3%) and Tron (+0.1%). The worst performers on our list were Avalanche (-8.6%), Bitcoin Cash (-6%) and SushiSwap (-5%).
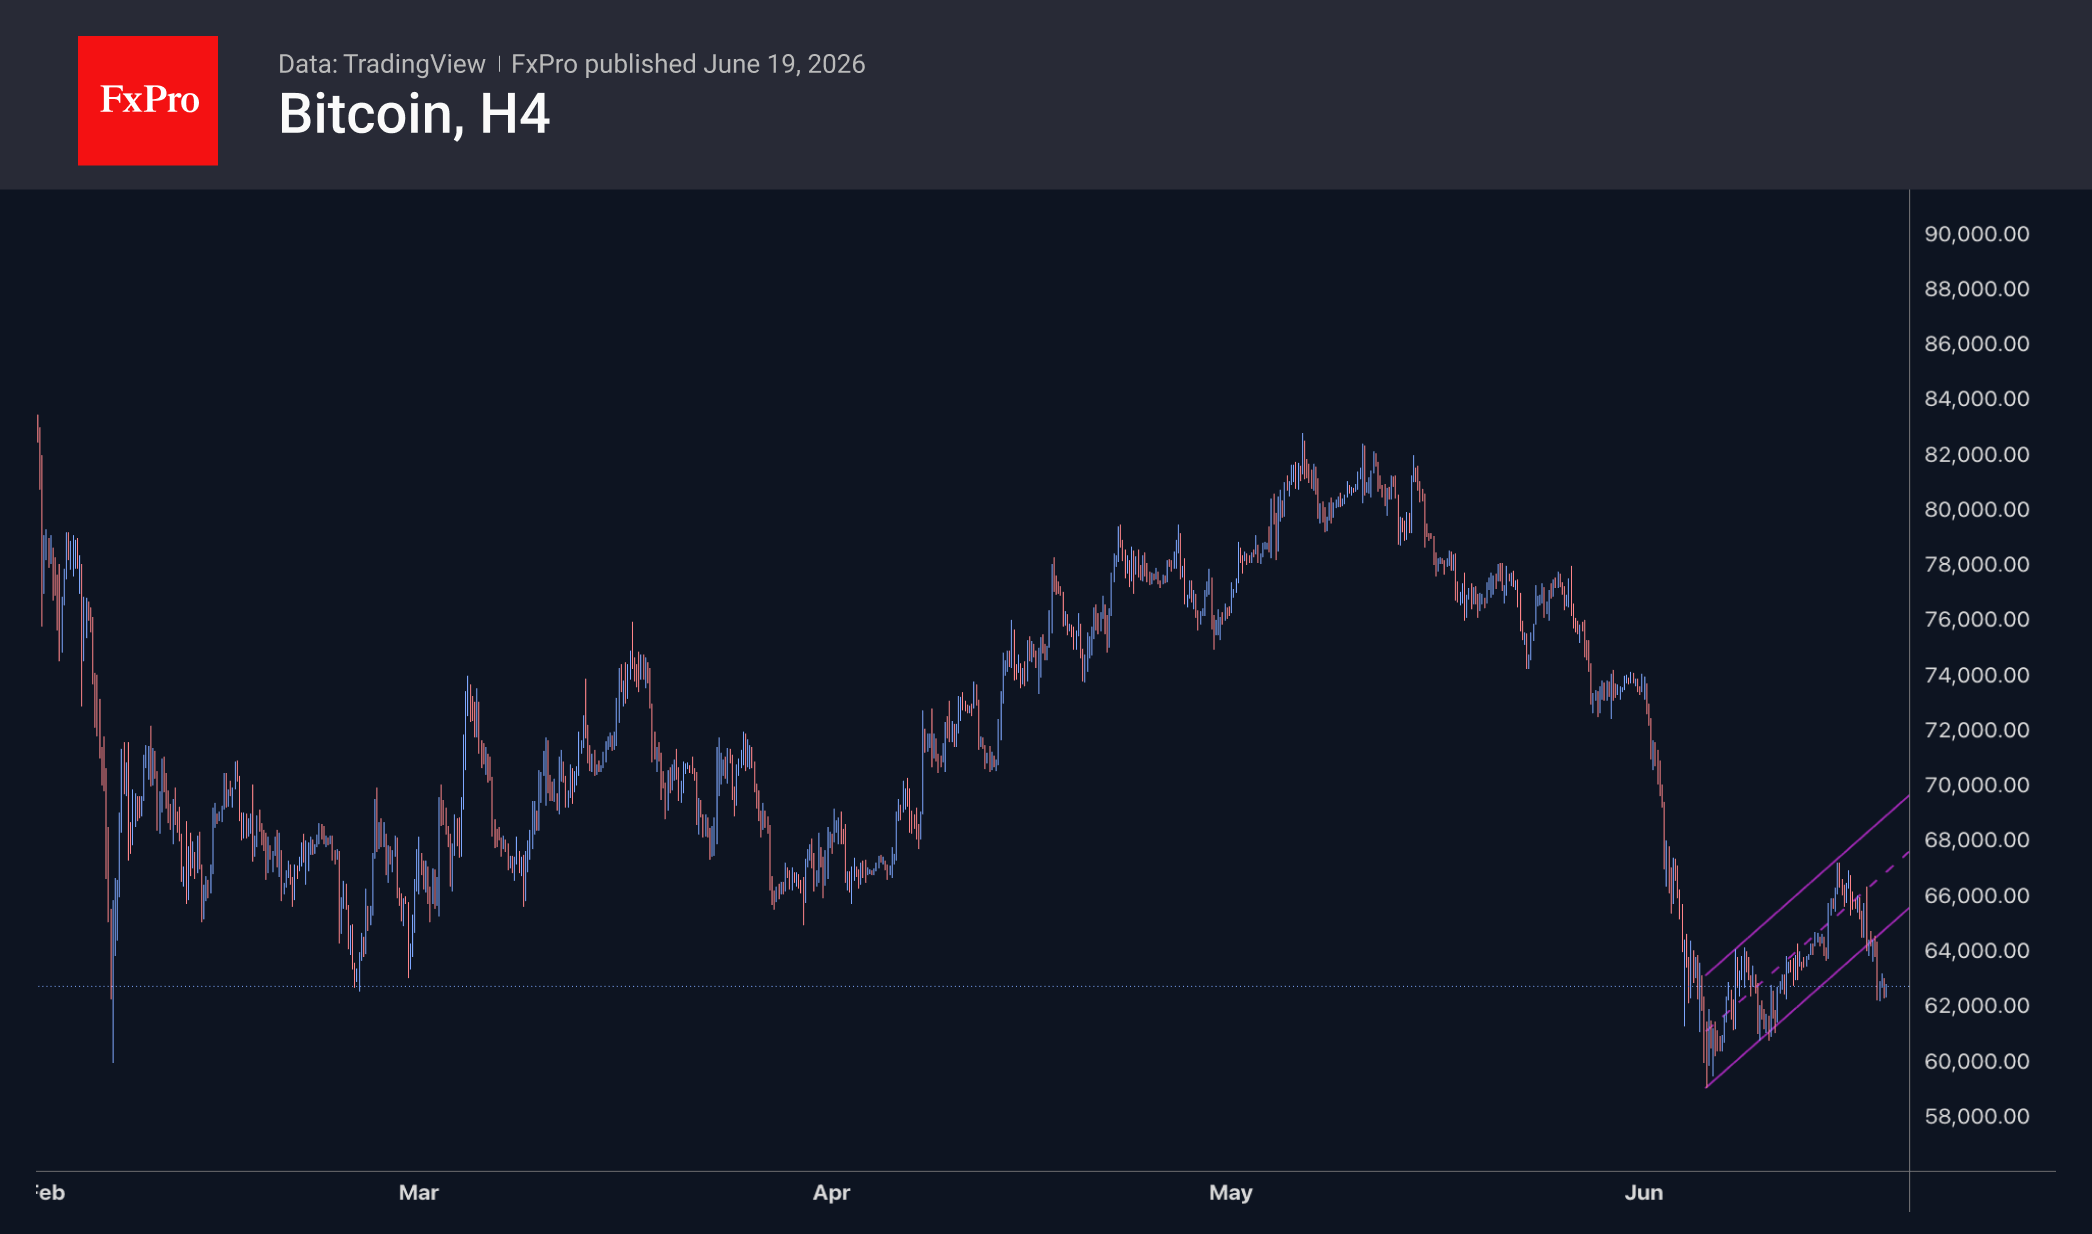
The price of Bitcoin has broken out of its upward channel and has traded predominantly below $63K since late Thursday. The bulls still have some hope, as a formal break of the trend would require the price to settle below previous lows near $61.5K. Even in this scenario, the price decline could stall in the $59–60K range, which represents this year’s most critical support level. The significance of this area is reinforced by the fact that the 2021 highs and the 2024 consolidation zone were located near it.
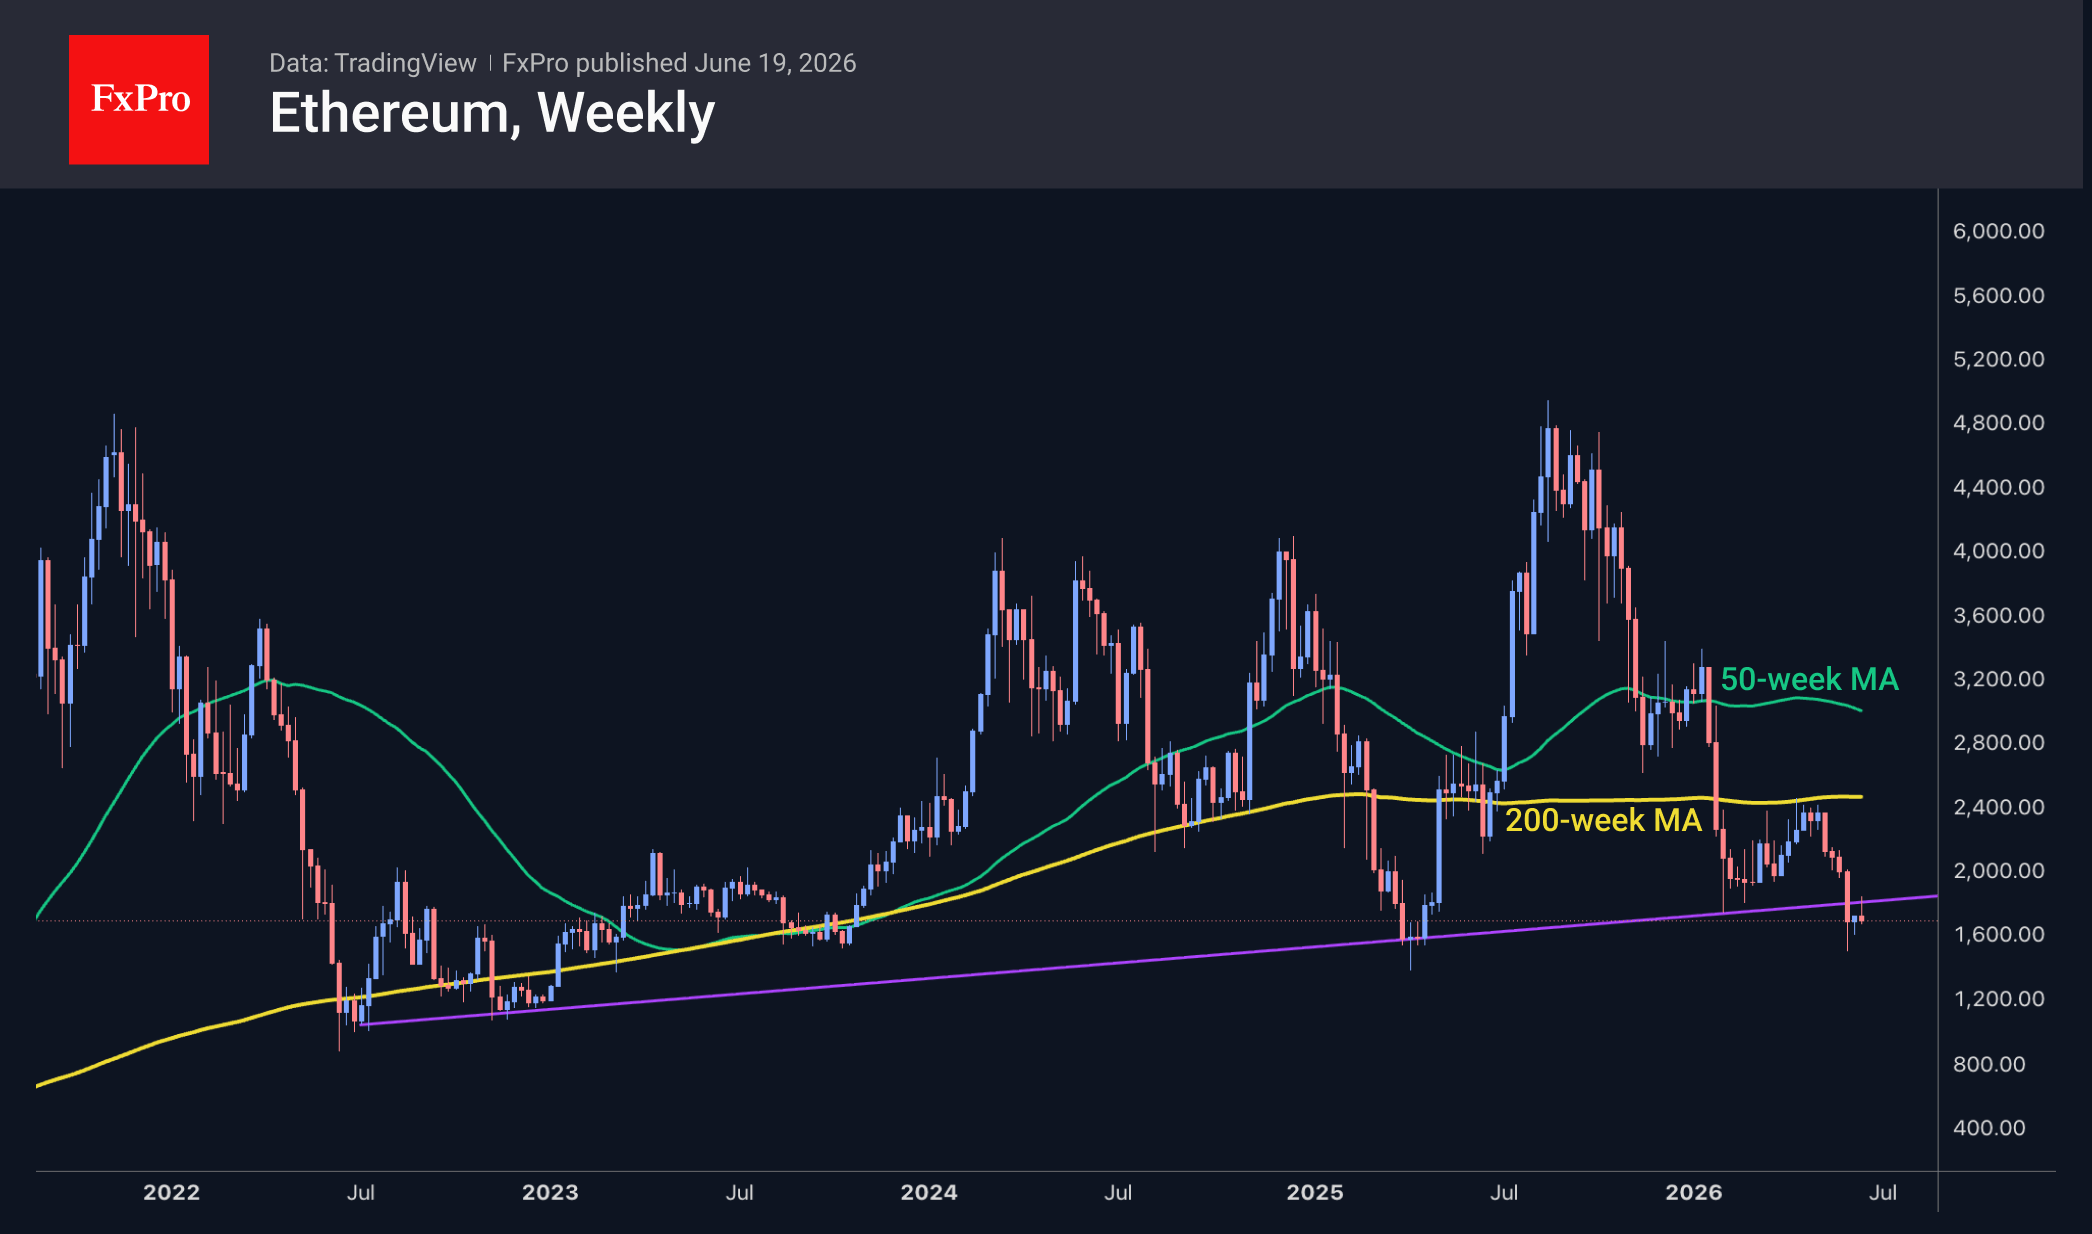
Ethereum is struggling, having failed to return to the area above the long-term support line from which it has been bought back over the past four years. The rebound in the first half of the month was modest, failing to push the price above the February–March support zone. Earlier, ETHUSD was actively sold off after a failed attempt to climb above the 200-week MA. The subsequent rebound proved short-lived. Going forward, we will be monitoring price action near the support levels at $1.5K, $1.2K, and $1.0K, where the most recent bullish reversals have occurred.
News Background
Bitcoin’s on-chain metrics indicate that the bearish trend is continuing, according to Glassnode. BTC is trading 19% below the true market price, currently $77.2K. Spot liquidity has improved, but the market remains fragile.
The crypto industry is experiencing the most severe downturn in its history, yet even in this crisis, there are positive factors, according to blockchain company StarkWare. The outflow of capital from major companies’ cryptocurrency holdings could reset and cleanse the crypto market.
According to Arkham Intelligence, Bhutan has transferred 533 bitcoins, worth around $34.5 million, to the Binance cryptocurrency exchange. The balance of the kingdom’s publicly tracked wallets has fallen from a peak of 13,000 in October 2024 to 1,750 BTC.
Monero developers have warned miners about a vulnerability affecting rewards in the decentralised mining pool P2Pool. Attackers are already exploiting this flaw, so network participants need to update their software urgently.
Changpeng Zhao, co-founder of the Binance cryptocurrency exchange, has called on all countries worldwide to migrate stock markets to the blockchain and issue their own state-backed stablecoins pegged to fiat currencies. In his view, tokenisation has the potential to make stock markets more accessible to investors.
The FxPro Analyst Team