
Sample Category Title
Euro Area Inflation Steady at ECB’s 2% Target
In focus today
In the US, today's main data focus will be on July JOLTs labour turnover report. The number of job openings is a key measure of labour demand for the Fed.
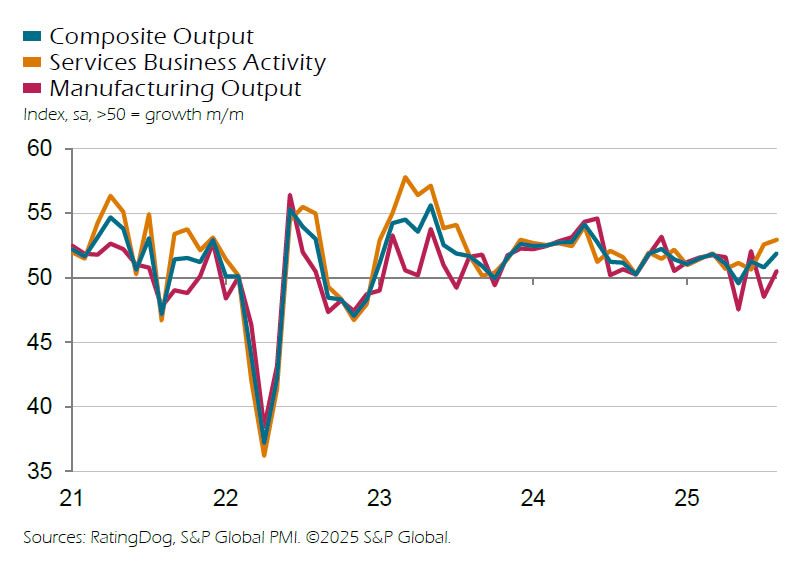
In Sweden, we get services and composite PMI. They both fell in July, driven by services PMI which had a strong and broad setback. All components fell, but especially employment, which had the lowest reading since March 2020.
In the euro area, we receive final services and composite PMI, and with much of Europe on holiday in August, late responses not captured in the preliminary release could influence the final print.
In Poland, the central bank (NBP) will announce their rate decision, we expect them to cut the policy rate by 25bp bringing it to 4.75%.
Economic and market news
What happened overnight
This morning, we published our Nordic Outlook with updated economic forecasts for the major economies and the Nordic countries. For the Nordics, we take note of the disappointing data we have received from Sweden and adjust down the outlook for both growth and for the Riksbank policy rate, where we now expect an additional cut this year. We lower the growth forecast for Denmark for 2025 by 1.4 percentage points, primarily reflecting large revisions to historical data. Growth in Norway, on the other hand, is revised up, and since it is driven by higher productivity growth it still leaves room for gradual rate cuts. For the major economies, we have only smaller adjustments, most notably an upwards revision of euro area growth in 2025. We have not seen much weakening of the economies following the US tariff hikes, which means that downside risk has decreased. Read more in Nordic Outlook - Caution, not crisis, 3 September.
What happened yesterday
In the euro area, HICP inflation rose to 2.1% y/y in August, up from 2.0% y/y in July, with core inflation at 2.3% y/y, above expectations of 2.2% y/y. This marks the fourth consecutive month that inflation has aligned with the ECB's target. Monthly trends remain consistent with what we have seen the past months. Services inflation stays elevated at around 3% y/y, while energy prices decline and goods price increases remain minimal. We expect inflation to average 2.1% y/y in Q4 before falling below target to 1.8% y/y in 2026.
In the US, ISM manufacturing rose to 48.7 in August from 48.0 in July, below expectations and PMI predictions. Sub-indices show promise, with modest declines in prices, a slight rise in the employment index, and improvements in new orders and order-inventory balances, hinting at future production growth. Meanwhile, manufacturing PMI climbed to 53.0 in August, the strongest improvement in operating conditions since May 2022, driven by a surge in production and solid growth in new order books. Despite the positive trends, the USD weakened slightly following the ISM release.
In the UK, PM Starmer did a backroom reshuffle in his Downing Street team and Treasury related roles ahead of the important Autumn Budget, a move that has the potential to sideline Chancellor Reeves, who represents the more responsible fiscal line within the Labour party. This move triggered a spike in 30Y Gilt yields which at one point traded at the highest level since 1998, although the increase was driven by a global move for higher yields as well. Regardless, the increase in borrowing costs worsens the position for the Labour government.
Equities: Global equities suffered yesterday, taking their cues from the long end of the yield curve again. Amid massive issuance volume in European debt markets (largely due to substantial deals in Italy and the UK alongside corporate issuance) and concerns over the UK fiscal path, risk sentiment deteriorated. This left Dow Jones -0.6%, S&P500 -0.7% and Nasdaq down -0.8%. In Europe, the Stoxx 600 ended 1.5% lower. The same pattern continued in the Asian session this morning with equities lower and long end Japanese yields higher.
Given the sour risk sentiment, with lower equities, higher bond yields and a VIX spike (now trading around 17), it came as no surprise that defensive sectors outperformed cyclicals. Only consumer staples, health care and energy managed to post gains. Unsurprisingly, the rate-sensitive sectors - tech, real estate and industrials - were the worst performing.
FI and FX: GBP and the UK bond market came under significant pressure yesterday as a surprise cabinet reshuffle sent worries over UK fiscal sustainability to new highs. EUR/USD dropped firmly below 1.17 as the dollar caught a bid in a broad risk-off environment. We have updated our Riksbank call and now expect a 25bp cut in November against our previous view of unchanged interest rates.
Gold Rally Resumes – What’s Next After This Powerful Move?
Key Highlights
- Gold started a fresh rally above the $3,500 resistance.
- A major bullish trend line is forming with support at $3,460 on the 4-hour chart.
- WTI Crude Oil prices could recover if there is a close above $66.65.
- GBP/USD dipped below the 1.3450 support zone.
Gold Price Technical Analysis
Gold prices formed a base above $3,320 and started a fresh increase against the US Dollar. It cleared many hurdles near $3,400 and $3,450.
The 4-hour chart of XAU/USD indicates that the price settled above the $3,440 level, the 100 Simple Moving Average (red, 4 hours), and the 200 Simple Moving Average (green, 4 hours). The upward move was such that the price spiked above $3,540.
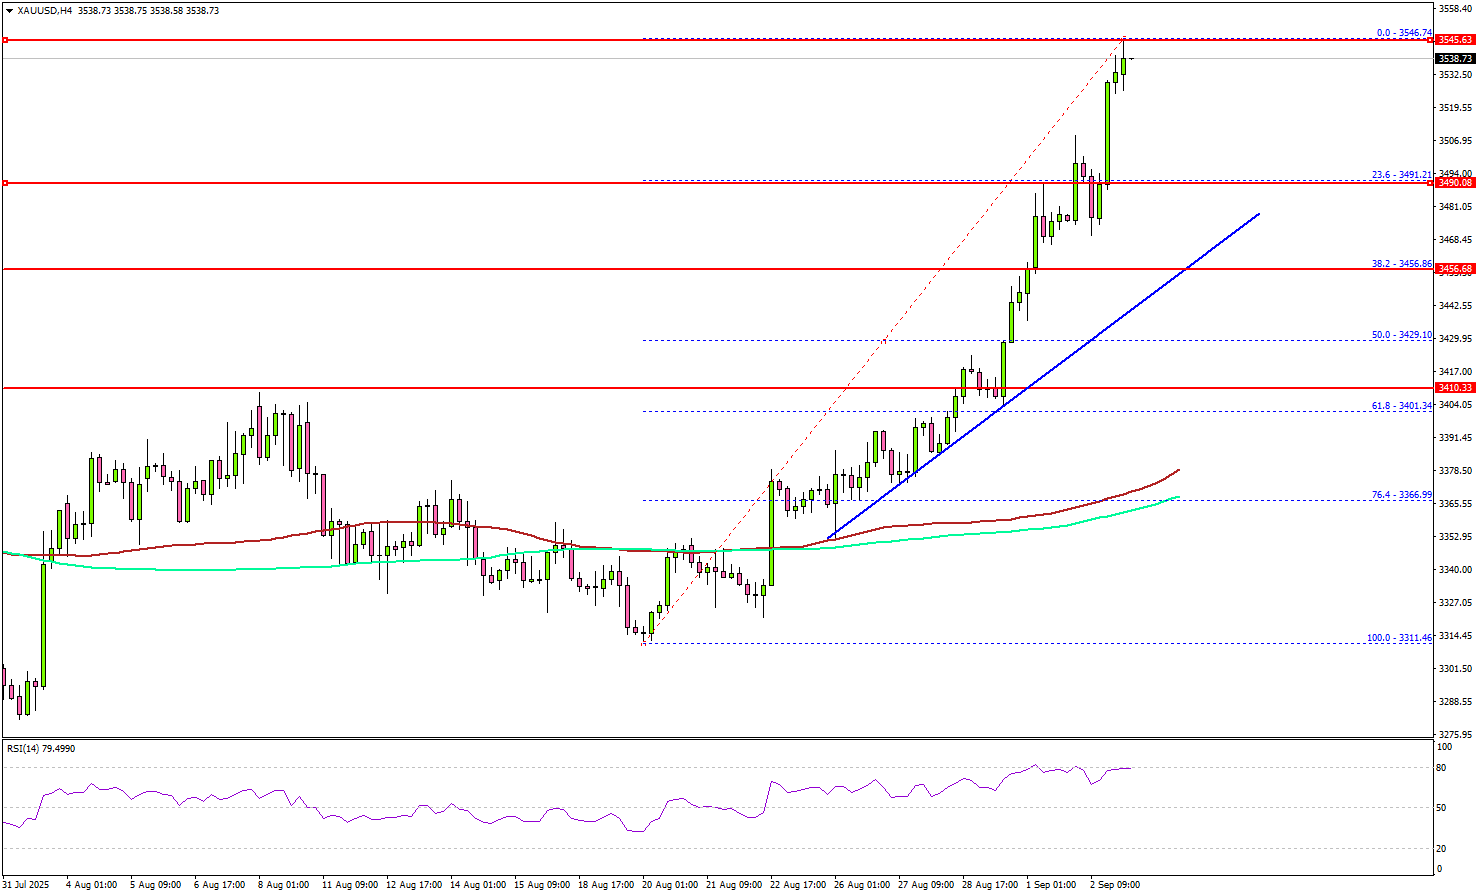
Gold is now consolidating gains above the 23.6% Fib retracement level of the upward move from the $3,311 swing low to the $3,540 high. On the downside, initial support is near the $3,465 level and a bullish trend line.
The first key support is $3,450. The next major support is near the $3,435 level. A downside break below $3,435 might call for more downsides. The next key zone to watch could be $3,410 and the 50% Fib retracement.
On the upside, immediate resistance is near the $3,550 level. The next major resistance sits near the $3,560 level. A clear move above $3,560 could open the doors for more upside. In the stated case, the bulls could aim for a move toward $3,580, above which the price could rally toward the milestone level of $3,600.
Looking at WTI Crude Oil, the price shows signs of recovery, but the bulls need to push it above $66.65 in the near term.
Economic Releases to Watch Today
- Euro Zone Services PMI for August 2025 – Forecast 50.7, versus 50.7 previous.
- UK Services PMI for August 2025 – Forecast 53.6, versus 53.6 previous.
- Fed's Kashkari speech.
- Fed's Beige Book.
- Fed's Musalem speech.
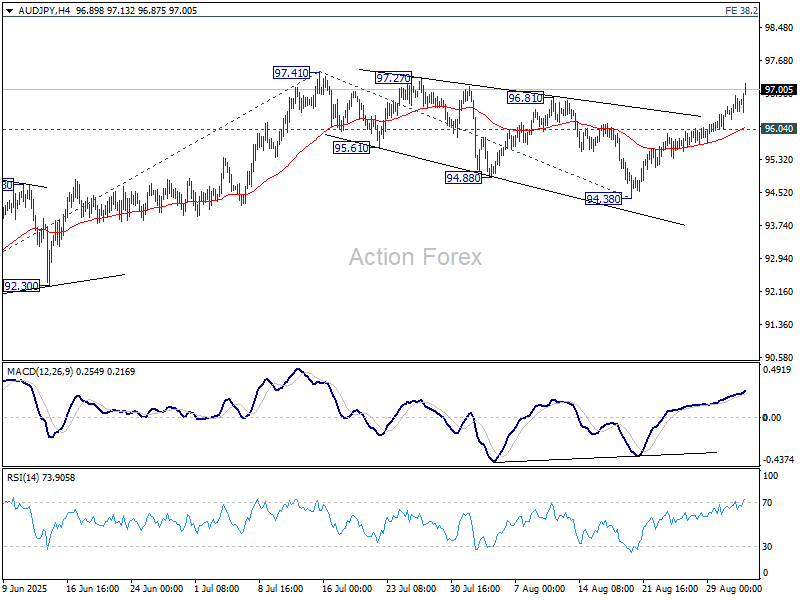
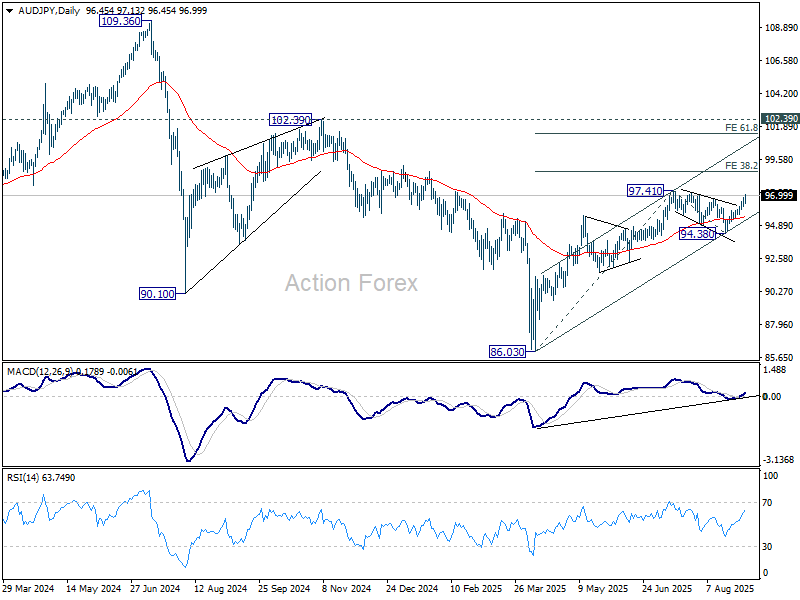
AUD/JPY eyes break A above 97.41 as Aussie strength, Yen weakness align
AUD/JPY extended its rally this week, surging toward the 97.41 resistance level and positioning to resume the broader uptrend from the April low of 86.03. The move has been driven by a powerful combination of Australian Dollar strength and Yen weakness, pushing the cross closer to levels not seen since earlier this year.
For Aussie, Q2 GDP surprised to the upside at 1.8% yoy, its strongest expansion since 2023 and above RBA own forecast of 1.6%. Household consumption and government spending were key contributors, while net trade added to growth thanks to stronger iron ore and LNG exports. The data reinforced a picture of an economy proving more resilient than feared. Meanwhile, inflationary pressures remain sticky. Released last week, July CPI accelerated to 2.8% year-on-year, a reminder that consumer demand is still strong and disinflation is not guaranteed.
Recent data reinforces that the RBA is firmly on hold this month, with November shaping up as the earliest window for another rate cut. Even then, any rate cuts are likely to remain gradual given the still-firm growth and inflation backdrop.
On the Yen side, stalled trade negotiation process is adding strain. Hopes for a U.S. executive order to reduce auto tariffs remain unfulfilled, and Deputy Governor Ryozo Himino’s warning about downside risks to growth underscores the BoJ’s reluctance to tighten further in the near term. Yen’s position has also been eroded by this week’s surge in global bond yields, led by gilts.
Technically, today's break above 96.81 resistance suggests that AUD/JPY’s correction from 97.41 completed as a five-wave triangle at 94.38. As long as 96.04 minor support holds, the bias remains firmly upward. Decisive break of 97.41 would resume the rise from 86.03, targeting the 38.2% projection of 86.03 to 97.41 from 94.38 at 98.72. Further break there break there could prompt upside acceleration to 61.8% projection at 101.41.
Looking medium term, the broader corrective downtrend from 2024 high at 109.36 should have completed with three waves down to 86.03. If that scenario holds, clearing structural resistance at 102.39 could open the way for a full retest of 109.36.
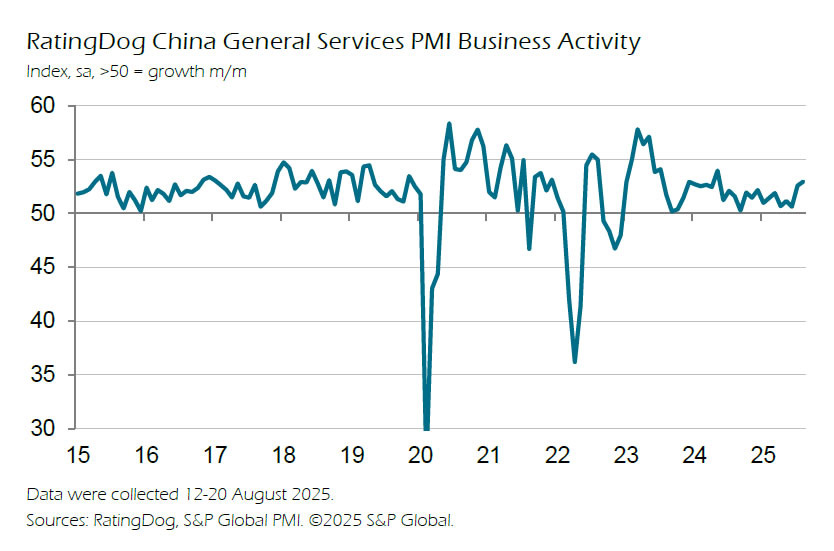
China RatingDog services PMI rises to 53.0, optimism improves
China’s services sector gained fresh momentum in August, with the RatingDog PMI rising to 53.0 from 52.6, topping expectations of 52.5 and marking the highest level since May 2024. The composite index also improved, climbing to 51.9 from 50.8.
RatingDog founder Yao Yu highlighted that new business inflows surged to the highest since May of last year, while new export orders expanded at the fastest pace since February. More stable domestic demand and a recovery in foreign demand were key drivers, with service providers also reporting stronger optimism—the highest since March.
Price trends, however, remained challenging. Input costs rose modestly but firms were unable to fully pass them on, with output prices slipping back into contraction. That indicates profit margins have been under sustained pressure since late 2023.
Australia’s GDP rebounds 0.6% qoq in Q2, as spending and exports drive recovery
Australia’s economy grew 0.6% qoq in Q2, beating expectations of 0.5% qoq and expanding 1.8% yoy from a year earlier. The Australian Bureau of Statistics noted that growth rebounded after weather disruptions depressed activity in Q1. GDP per capita also rose 0.2% qoq, reversing the decline recorded in the March quarter.
Domestic final demand was the key driver, supported by a 0.9% qoq rise in household spending and a 1.0% qoq increase in government consumption. Public investment detracted from growth, but private demand proved resilient.
Net trade added 0.1 percentage points to GDP, driven by a rebound in exports of iron ore and LNG as production normalized after severe weather disruptions earlier in the year.

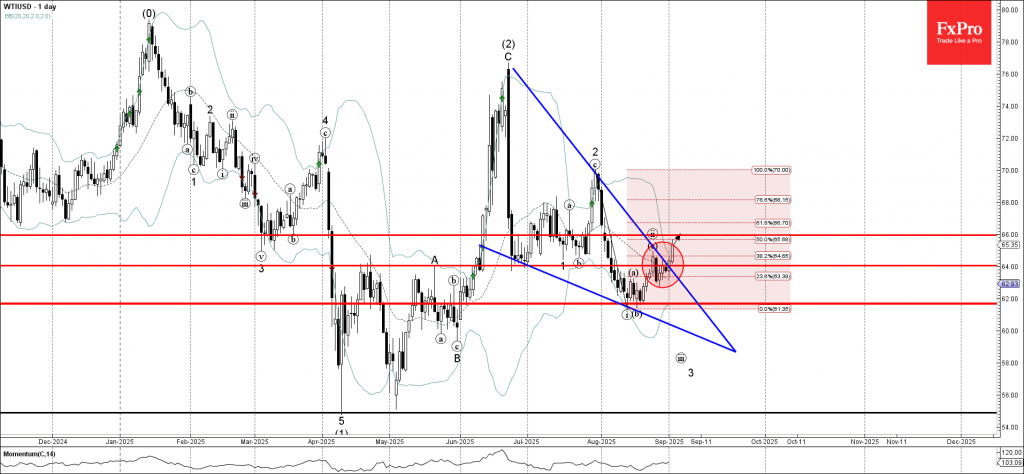
WTI Crude Oil Wave Analysis
WTI crude oil: ⬆️ Buy
- WTI crude oil broke the resistance level 64.00
- Likely to rise to resistance level 66.00
WTI crude oil recently broke the resistance level 64.00 intersecting with the resistance trendline of the daily Falling Wedge from June.
The breakout of the resistance level 64.00 coincided with the breakout of the 38.2% Fibonacci correction of the downward impulse i from July.
WTI crude oil can be expected to rise to the next resistance level 66.00, which is the 50% Fibonacci correction of the downward impulse i from July.
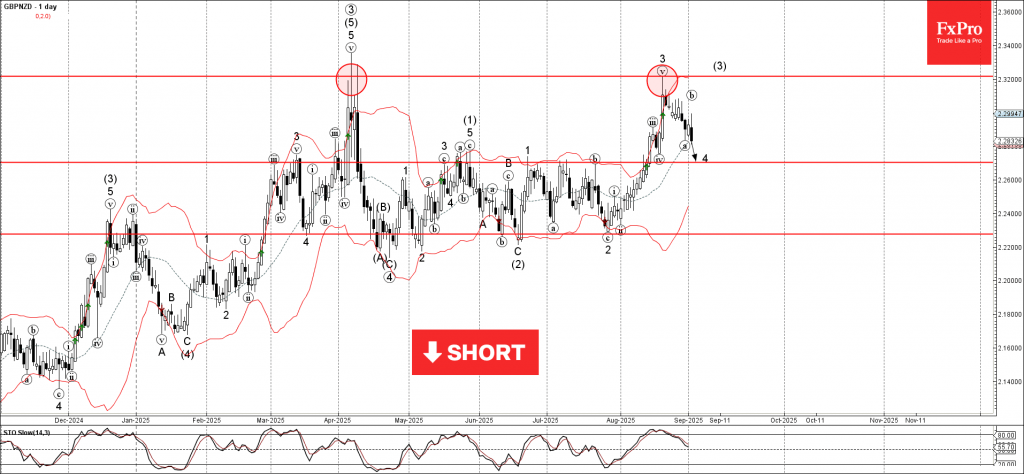
GBPNZD Wave Analysis
GBPNZD: ⬇️ Sell
- GBPNZD reversed from the resistance zone
- Likely to fall to support level 2.270
GBPNZD currency pair recently reversed from the resistance zone between the strong resistance level 2.3200 (which stopped the daily uptrend in April) and the upper daily Bollinger Band.
The downward reversal from this resistance zone started the active short-term ABC correction 4.
GBPNZD currency pair can be expected to fall to the next support level 2.270, the former monthly high from June and July, and the target for the completion of the active wave 4.
Why Government Bond Yields Rising So Much as of Late?
(Too long; didn't read resume at the end of the article. I strongly invite you to at least check the charts, which are worth 1,000 words.)
Since 2020, the bond market, traditionally seen as the safest and most liquid market, has experienced unprecedented dynamics (at least compared to recent times).
Many factors are responsible: Quantitative Easing from the post-Great Financial Crisis and COVID period, the consequent tightening from central banks, and global governments' spending addiction.
From 2008 to 2021, low inflation and a somewhat sluggish economy required easy monetary conditions to stimulate job creation and every other positive aspect that a more efficient labor force creates (including the quintessential credit creation).
Inflation is closely tied to government bond yields; with slowing inflation, longer-run government bond yields have been held between 0% (or even negative) to 2% throughout most economies in that same period.
This phenomenon allowed governments to subsidize companies and programs to boost the economy, using what is vulgarly called "cheap money creation".
One could debate that it now has broadly negative consequences, but without it, the COVID era would have led to a decade-long recovery process and a much more considerable economic crisis.
However, as the economy quickly recovered from the COVID crisis, inflation rose sharply (close to 10% year-over-year) in the US, Canada, Europe, and throughout the globe.
This caused bond yields to shoot higher, leading to higher inflation expectations and forcing central banks to hike interest rates aggressively from 2022 to 2023.
In an ideal world, government spending would slow as fast as economic recovery would be completed.
However, a too-indebted global economy has become addicted to borrowing, and governments are having a tough time slowing down their hunger for debt. (But are they really trying?)
That forces high-spending governments to spend even more to finance their increasing debts—for comparison, as an individual, it's as if one would take a second mortgage to help repay a first, too large mortgage at higher rates (not a good deal).
If you're watching the headlines, you will notice that President Trump is complaining almost daily about the higher interest costs from the US government and tries to force the Federal Reserve Chair Powell to lower rates, for the US to reduce their interest costs – but doing so would greatly raise longer-run inflation expectations
With decreasing inflation, government yields should traditionally be heading down—but after 20 years of extremely low yields, this correlation is inverting.
With a sufficient explanation of the situation, let's watch a few charts that paint the current picture.
US Government debt since 1960
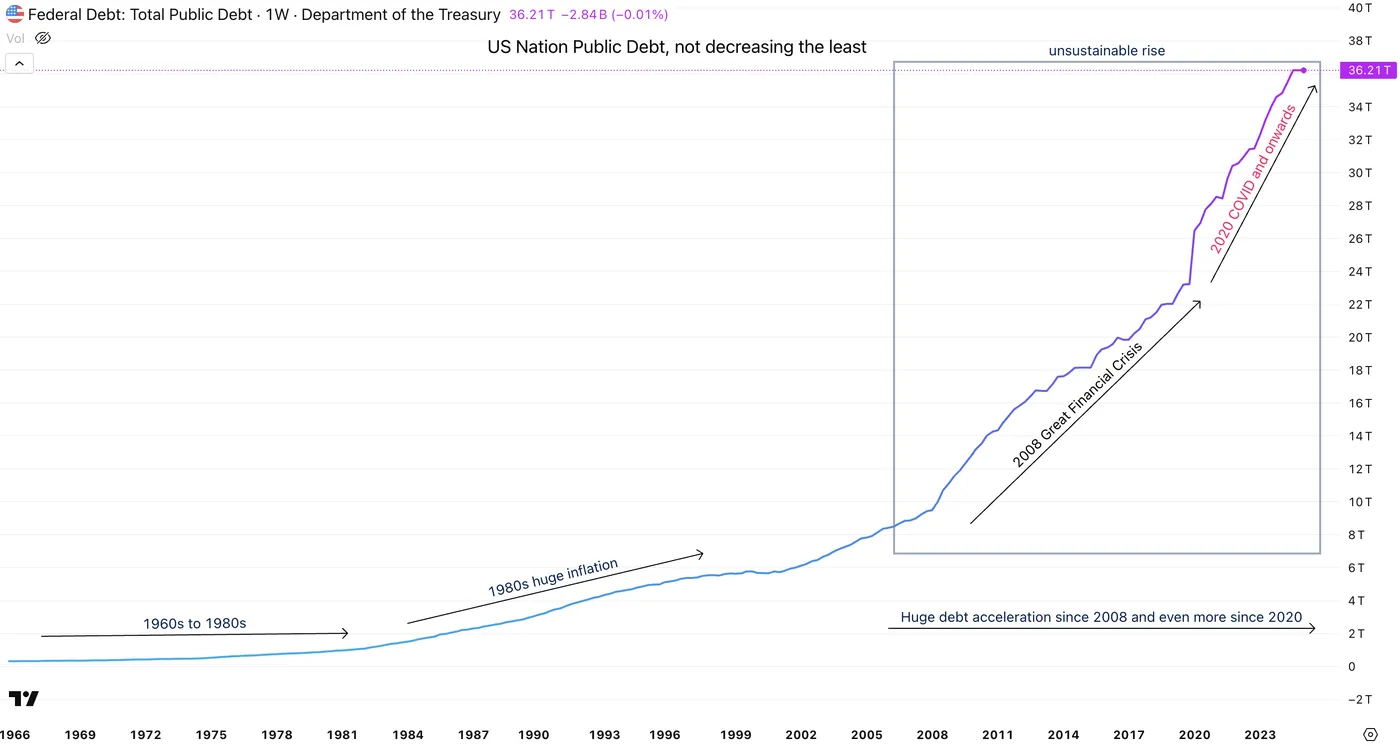
US Public Debt – Source: St Louis FED and TradingView
US inflation and global money creation (M2) since 2008
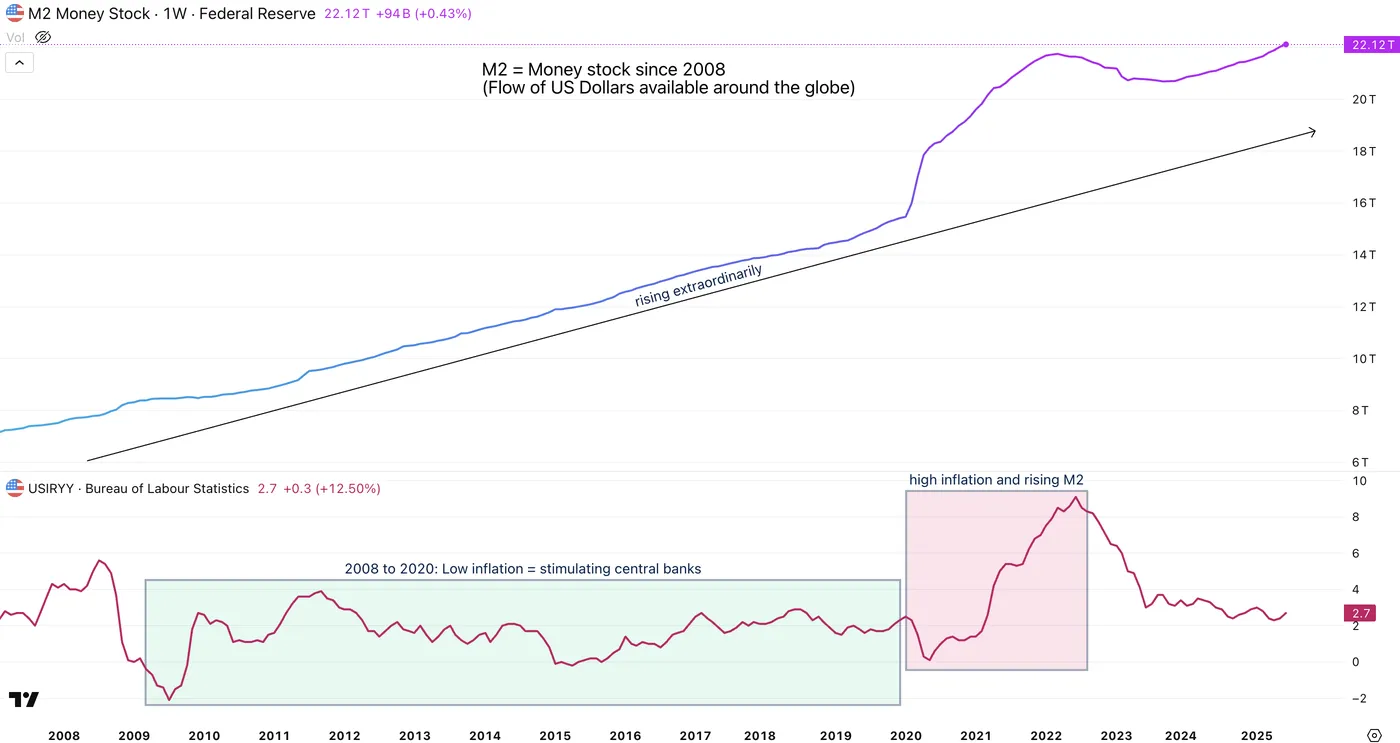
The Rise of M2 and how it made inflation shoot up – Source: TradingView
Essentially, money creation makes M2 rise, which props up inflation (more money for the same goods = price of goods rises)
When governments spend, they print (or create) money which creates inflation.
Long-run bond yields (30Y) from 2020 to 2025 (US, Europe, Japan and UK) and long-run inflation expectations
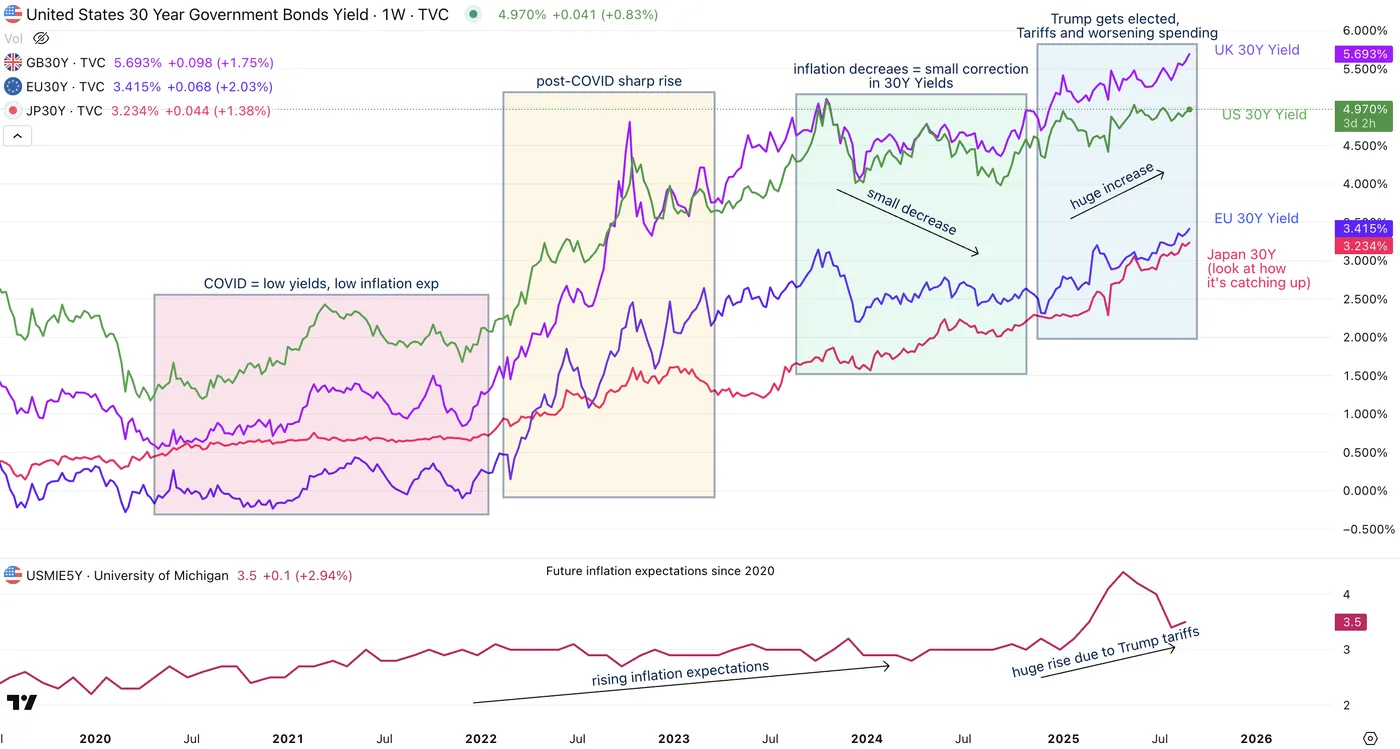
30Y Yields for US, UK and Europe with US inflation expectations below – Source: TradingView
So what about the current situation: The FED should cut rates and 30Y Yields are shooting higher, but why?
So why is inflation heading lower but government bond yields are rising ?
The reason is simple, short term interest rates move on central banks's main rate expectations, and this is closely linked to immediate inflation (like headline CPI for example).
However, 10Y yields and onwards (which are the base of all consumer-mortgages) are more influenced by future (long-run) inflation expectations, future costs of government debt and credit creation (heavier credit = higher yields).
These go up from looser fiscal policies (like the Big, Beautiful Bill from the Trump Administration or the current mess-ups in the United Kingdom) and a decreasing investor confidence. A higher risk demands higher compensation.
These three components are rising sharply, hence, government bond yields are shooting higher, with the latest case in the UK pushing higher yields in the US and even in Japan where the 30 year yield just reached multi-decade highs.
Also, tariffs increase inflation, which pushes yields higher.
Independent central banks (particularly the Federal Reserve which manages the flow of the US Dollar, the global reserve currency) are more than essential to preserve the value of money, which helps to reduce inflation further and maintains the value of everyone's precious fiat money.
Governments slowing down their spendings would be of much help.
(All of these dynamics contribute sharply to diversification towards metals, cryptocurrencies, and other asset classes)
(TL;DR) – Too long, didn't read
- Since 2020, the bond market — usually the safest and most liquid — has seen historic volatility – Bonds selling = higher yields.
- Years of QE (post-GFC, COVID) + government spending created “cheap money” conditions that fueled growth but stored up risks – higher risks = higher yields.
- From 2008–2021, inflation stayed low, keeping long-term yields near 0–2% across developed economies – past two decades of low yields = cheap money = spending addiction from governments.
- Post-COVID, inflation spiked near 10% globally, forcing central banks into aggressive 2022–2023 hikes = government costs rise sharply – Normally, governments stop spending from here, but they're not.
- Normally, falling inflation = lower yields, but this link is breaking down – High spending in decent economies = high inflation expectations.
- Short-term yields follow central bank policy expectations, but long-term yields reflect future inflation, fiscal debt, and credit demand.
- If main rates (like the FOMC 4.50% rate that should go down in the upcoming FED Meeting) go down while economy is good, future inflation exp, hence bond yields shoot up.
Looser fiscal policy, tariffs, and weak investor confidence are also driving long-term yields higher. - Governments are stuck in a debt spiral: borrowing more at higher costs to cover past debts.
- Political pressure (e.g., Trump vs. Powell) risks undermining central bank independence — crucial for preserving the value of money and keeping inflation anchored.
- This structural shift in bonds is fueling diversification flows into metals, crypto, and other alternatives.
Safe Trades!
Dow Jones (DJIA) Finishes 0.57% Down After Late Recovery, What Next for Wall Street Indexes?
The summer lull appears to be over with September off to a rocking and volatile start for global markets. Stock markets have not started September on the front foot, which isn't a surprise given that it is a notoriously tricky month for US equity markets.
The US exchanges reopened after the holiday, and nerves rose. Some traders have long felt that stock prices are maybe too high, especially as the economy shows signs of slowing. At the same time, political talk about trade tariffs adds to the doubt, and there are whispers that the Federal Reserve could be feeling pressure from the President.
The tip of the iceberg appeared on Tuesday when new questions surfaced over the weekend about whether the President’s tariffs are even legal. That doubt was enough to push both stocks and bonds down.
Consequently, most market participants expect more swings this week, particularly before Friday’s big NFP jobs report. There remains a possibility that the volatility could simply be a short‑term reaction, not a sign of a deeper problem. The road ahead looks uncertain, and market participants will watch closely.
This is backed up by the Atlanta Fed's GDPNow model. The model projects that US real GDP will expand at a 3.5% annualized rate in Q3 2025, suggesting steady and robust economic growth.
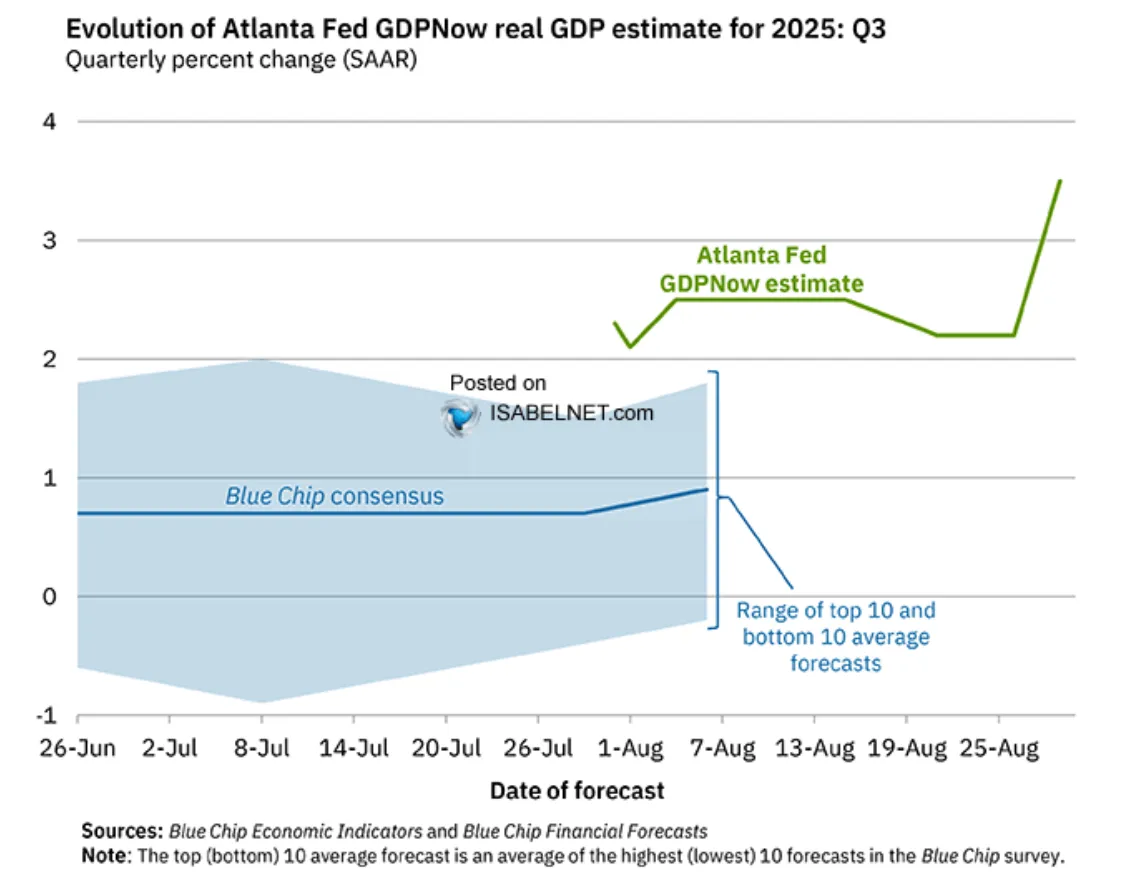
Source: IsabelNet, Blue Chip financial forecasts
The CBOE Market Volatility index .VIX touched its highest mark in over four weeks, while a selloff in the global bond market also raised concern. Benchmark 10-year Treasury yields, which rise when bond prices drop, surged by nearly five basis points to 4.269%, while 30-year yields surged to their highest since mid-July.
When bond yields rise they become more attractive and usually lead to an outflow in equities and a pivot into bonds.
September Seasonal Woes
Historically, September is the worst-performing month for US stocks—this holds true for the past 10 years, 20 years, and going back to 1950. It is rare to see both August and September finish higher in a post-election year.
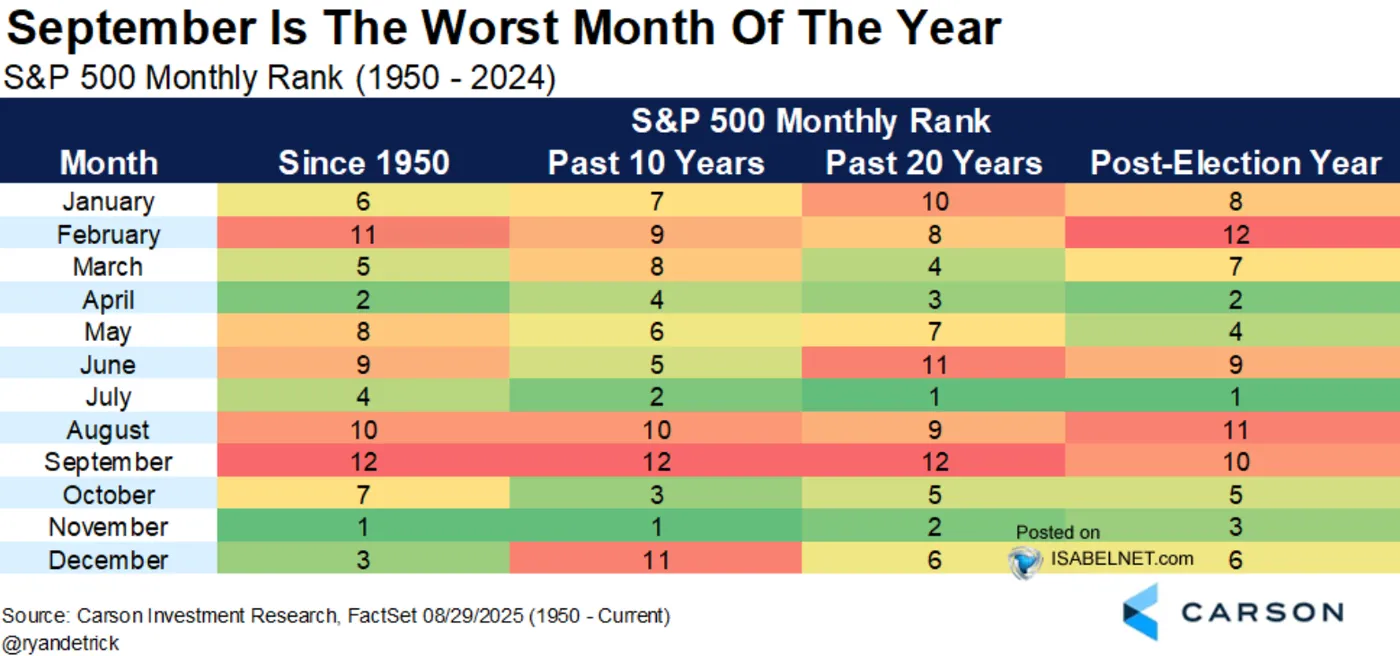
Source: IsabelNet, Carson Investment Research
One possible reason the stock market is often weak in September is that it's when investors return from their summer vacations and get back to work. They often sell stocks they no longer want to "clean up" their investments and make changes for tax purposes before the end of the year.
The Week Ahead
Investors are paying very close attention to the U.S. jobs report that will be released this Friday. The report will give market participants a clue about how much the Fed might cut interest rates in the coming months.
However, if inflation remains a problem, the Fed may not be able to lower rates as much as market participants are hoping.
Market participants will be watching the confirmation hearing for Stephen Miran, who is the President's choice for a temporary position at the Fed. This is significant because it's happening at a time when the President is increasing his public attacks on the Fed. He has been constantly criticizing the Fed's chairman, Jerome Powell, for not cutting interest rates and is also trying to get another member, Lisa Cook, removed from her position.
Markets have been concerned about Fed independence and this remains a key topic of discussion which could have an impact on sentiment.
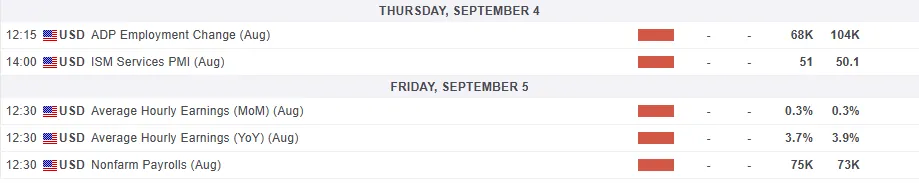
For all market-moving economic releases and events, see the MarketPulse Economic Calendar. (click to enlarge)
Technical Analysis - Dow Jones Index
From a technical standpoint, the Dow Jones index saw whipsaw price action on Tuesday with the index down as much as 1% before recovering in the second half of the day to finish the day down 0.57%.
Looking at the four-hour chart below, the Dow has seen a change in structure as it printed a lower low.
Price is however stuck now between the 50 and 100-day MAs which rests at 45508 and 45195 respectively.
A break below the 100-day MA could open up the possibility of a retest of the 200-day MA at 44880 with the next key support area resting at 44118.
Dow Jones Four-Hour Chart, September 2, 2025
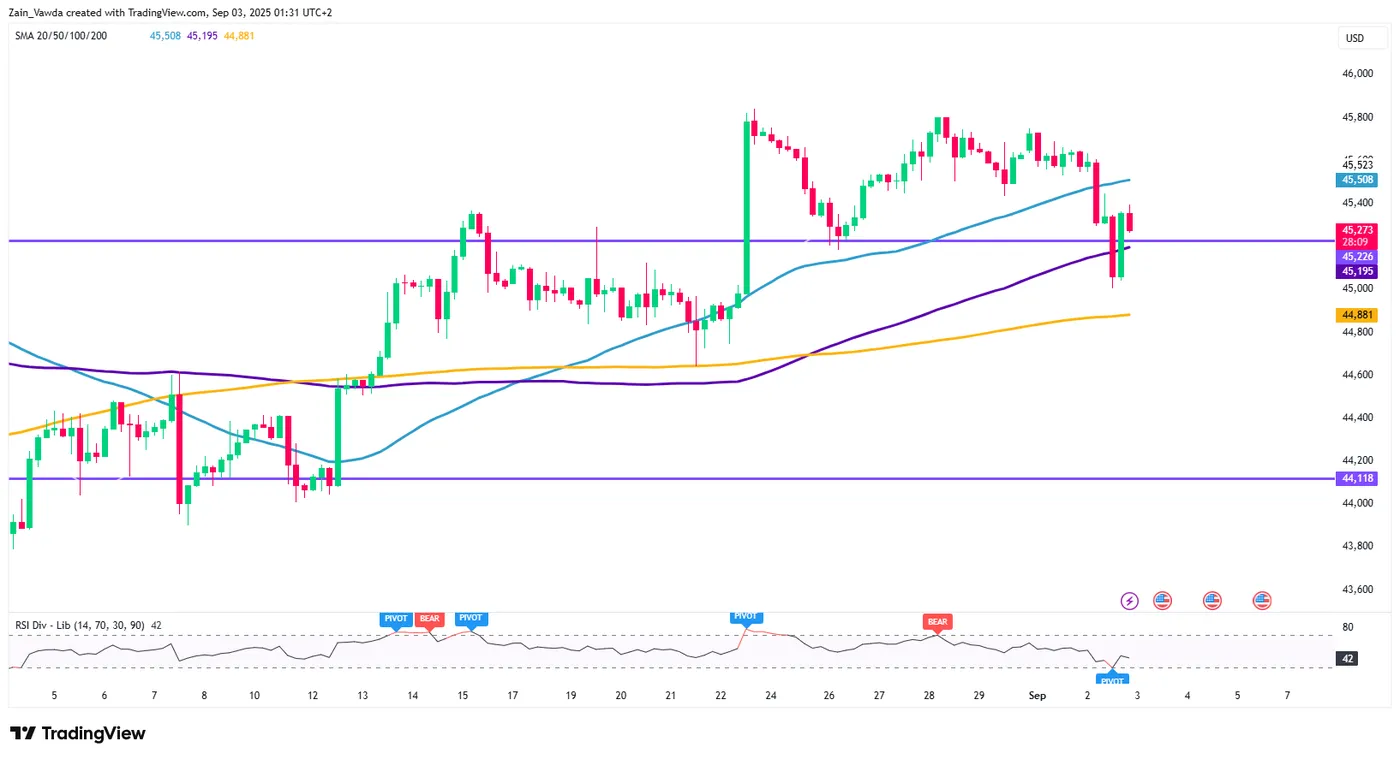
Source: TradingView (click to enlarge)
Client Sentiment Data - DOW JONES Index
Looking at OANDA client sentiment data and market participants are short on the DOW with 77% of traders net-short. I prefer to take a contrarian view toward crowd sentiment and thus the fact that so many traders are short means the Dow Jones Index could rise in the near-term.
Cryptocurrencies Still Lack Clear Direction – BTC, SOL, XRP and SOL Levels
We are assisting at a very mixed picture across different asset classes – Equities are down after the long weekend, the US Dollar is up but correcting from its highs since the ISM Manufacturing PMI report, and Cryptocurrencies are sluggish, but showing signs of rebound.
After sending worrying signs throughout the past week of price action, with Bitcoin correcting for the whole past week and Ethereum marking a new record in a weak-looking price action, cryptos are finding a floor with traders bracing for the upcoming Non-Farm Payrolls.
Bitcoin has for example marked an intermediate low at around $107,000 at the extreme of its previous ATH support area and rebounding since, while Ethereum opens the week off its $4,200 lows.
Bitcoin holding above $100,000 still paints a broadly positive picture for cryptos, but markets are starting to be more careful at the recent highs. A huge boost to sentiment should be needed to push BTC to a renewed ATH but everything is possible.
However, Solana is still holding decent momentum.
In the preparation of this shortened week of compact action (volumes were down hard yesterday due to a prolonged Labor Day weekend), let's have a look at intraday charts and levels for Bitcoin, Ethereum, XRP and Solana.
An overlook on the Cryptocurrency Market
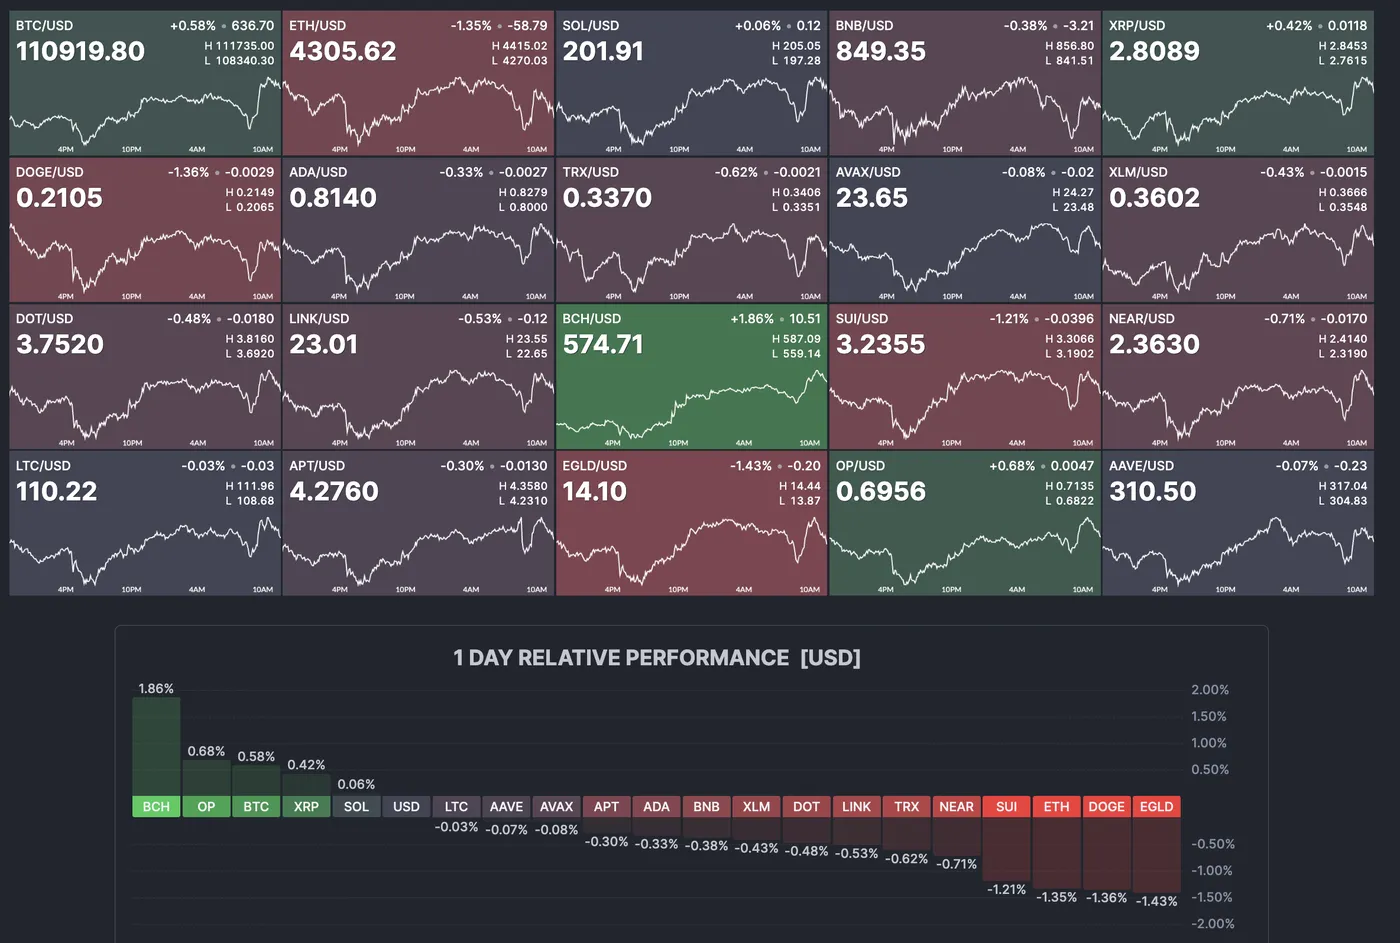
Crypto market overview, September 2, 2025 – Source: Finviz
Technical analysis for the major cryptocurrencies
Bitcoin (BTC) 4H Chart
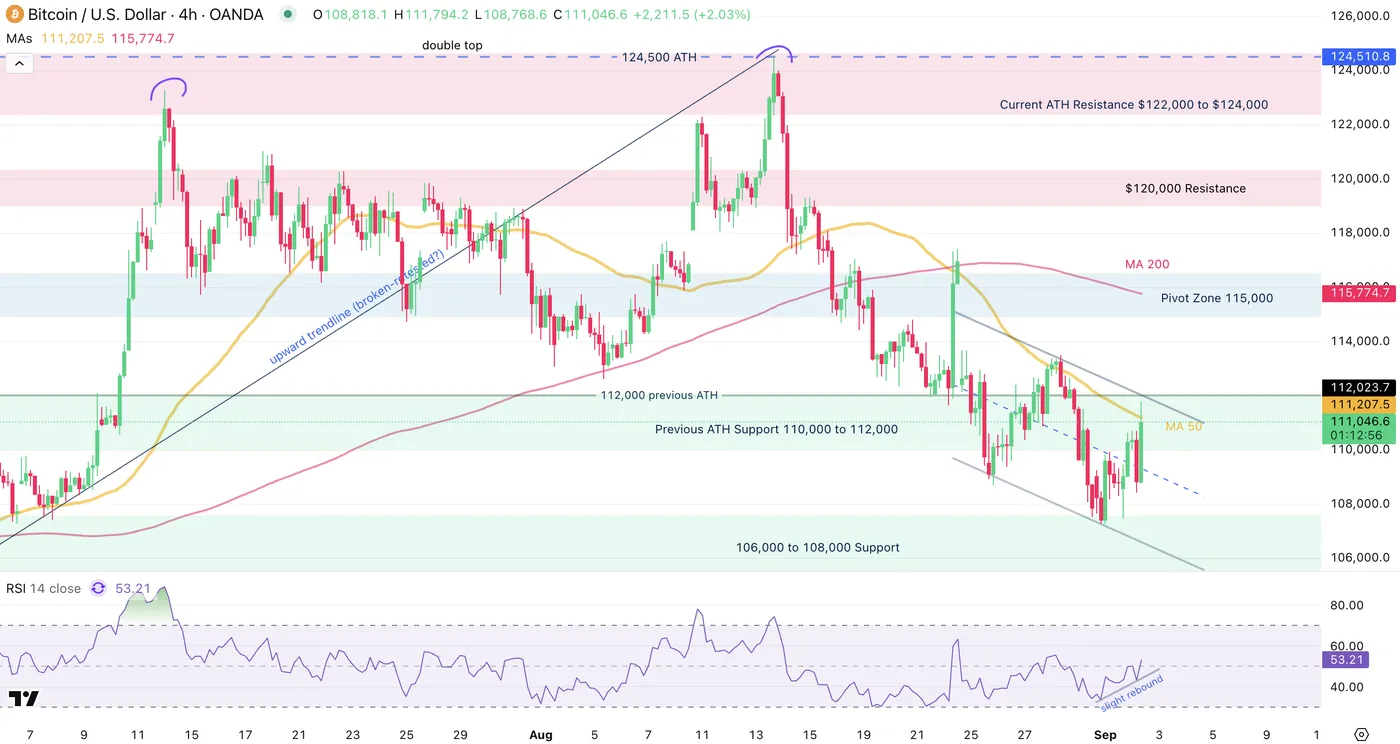
Bitcoin 4H Chart, September 2, 2025 – Source: TradingView
Bitcoin has recently rebounded on the $106,000 to $108,000 minor support area and is now consolidating within its major previous ATH Support.
Breaking above would bring back bullish trends back to life – for now, the picture for the intermediate term is mixed and the short-term picture is still slightly bearish, as the action is evolving within a downwards channel (as seen on the chart) and the 4H MA 50 crossed below the MA 200.
A soft beat on NFP expectations would be the goldilocks conditions for Bitcoin as the FED would still be expected to cut rates while sentiment wouldn't degrade too harshly – A strong miss could send fears of a too-late FED, while a strong beat would take out hopes for cuts.
Levels of interest for BTC trading:
Support Levels:
- $110,000 to $112,000 previous ATH support zone (currently getting tested)
- $106,000 to $108,000 Minor support
- $100,000 Main support at psychological level
Resistance Levels:
- $112,000 previous ATH – immediate resistance level
- $115,000 to $117,000 Pivot Zone (most recent rejection)
- Major Resistance $122,000 to $124,500
- Current all-time high $124,596
Ethereum (ETH) 4H Chart
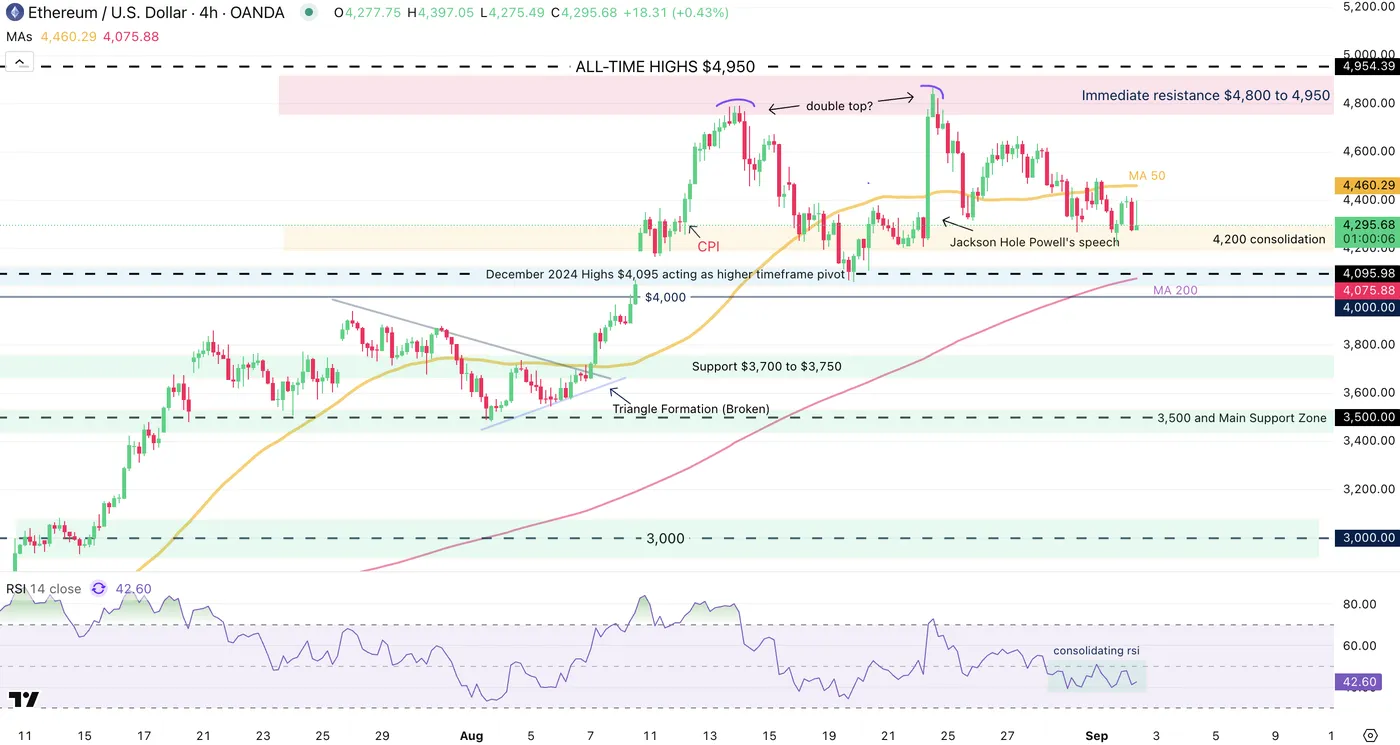
ETH 4H Chart, September 2, 2025 – Source: TradingView
Ethereum has weakened since its past week new All-time high (around $4,950).
Some technical concerns could be noted due to the sharp rejection right after marking its new record, not the best sign for continuation (watch Bitcoin's previous $72,000 ATH in November 2021 if you haven't).
Nonetheless, the action is still far from bearish and points more towards consolidation as long a prices hold above the $4,000 to $4,095 pivot region.
With buyers holding steady at the $4,200 level, bulls haven't given up anything yet – More on this as the week progresses. Don't forget that decisive momentum should pick up after Friday's US NFP release.
Levels of interest for ETH trading:
Support Levels:
- $4,200 to $4,300 consolidation Zone (getting tested)
- $4,000 to $4,095 Main Long-run Pivot
- $3,500 Main Support Zone
Resistance Levels:
- $4,460 MA 50 (acting as immediate resistance)
- $4,950 Current new All-time highs
- $4,700 to $4,950 All-time high resistance zone
- Potential main resistance $5,230 Fibonacci extension.
Ripple (XRP) 4H Chart
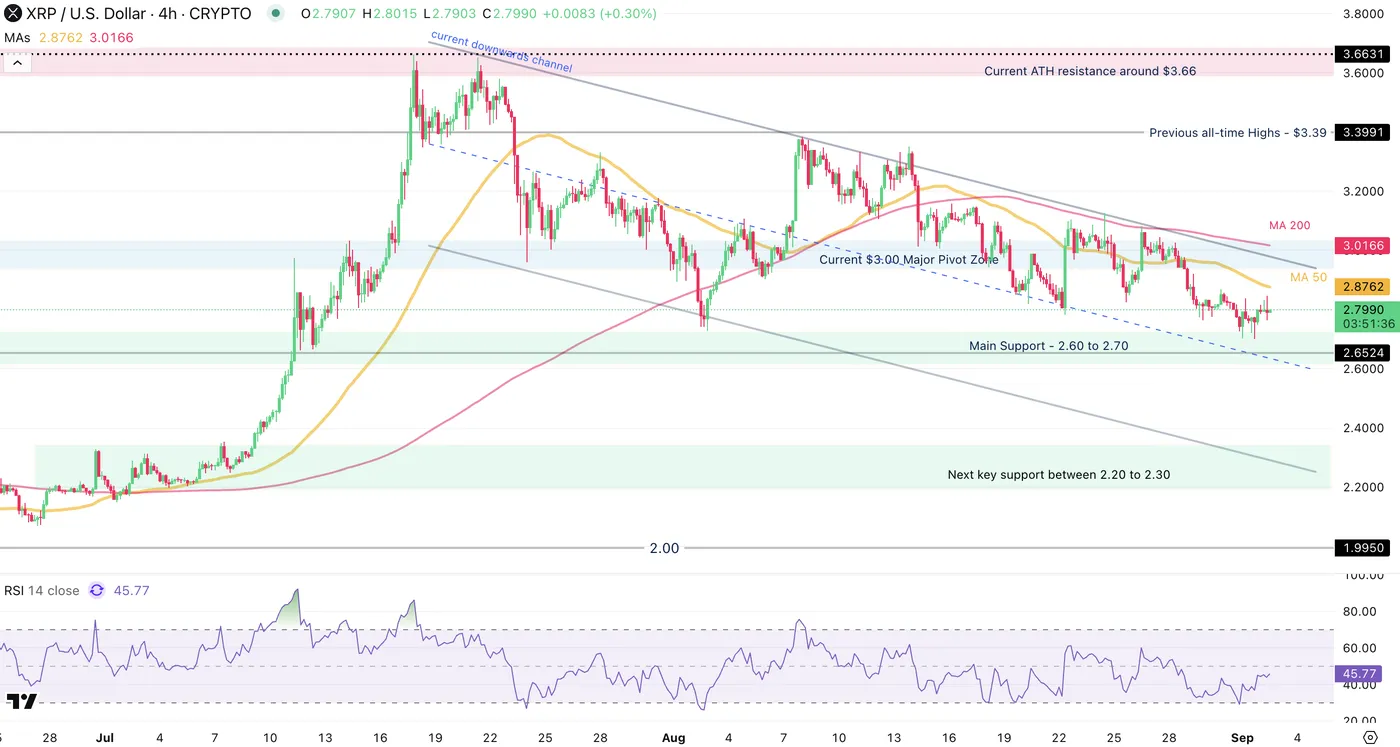
XRP 4H Chart, September 2, 2025 – Source: TradingView
Ripple is going through a profit-taking phase, having breached the $3.00 that was acting as a key psychological level.
Now evolving within a downwards channel, it seems that the path is for gradual correction. Some buyers have stepped in at the $2.60 Support zone, which will be one of the last barriers before a retest of the previous break (around $2.20) would get higher probabilities of happening.
Levels of interest for XRP trading:
Support Levels:
- $2.60 to 2.70 immediate support (getting tested)
- $2.20 to $2.30 next key support
- $2.00 psychological level
Resistance Levels:
- 4H MA 50 $2.80
- $3.00 Key momentum pivot, now acting as resistance
- Current ATH resistance around $3.66
Solana (SOL) 4H Chart
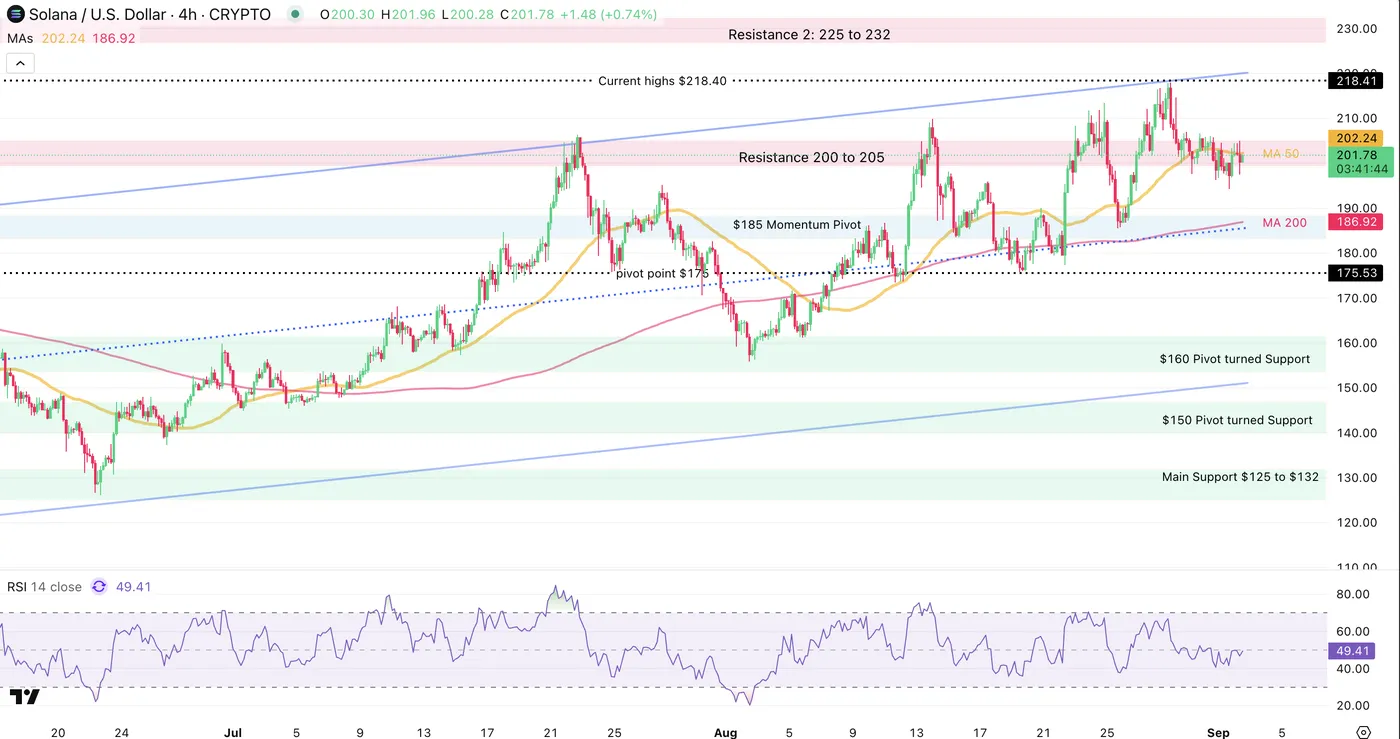
SOL 4H Chart, September 2, 2025 – Source: TradingView
Solana's price action is probably the most bullish out of all other cryptos.
The biggest rival for Ethereum's dominance has held its upward channel and recently tested its upper bound.
The technical short-timeframe top has led to some small profit taking, but the action stays bullish above the $185 Momentum pivot which coincides with the middle of the channel, essential for momentum analysis.
Levels of interest for SOL trading:
Support Levels:
- $185 momentum pivot and recent swing lows
- $160 Major support and low of channel
- $150 psychological Support
Resistance Levels:
- $200 Psychological Level (getting tested)
- current highs $216 and top of upward channel
- Current all-time high $295
Safe Trades!