Sample Category Title
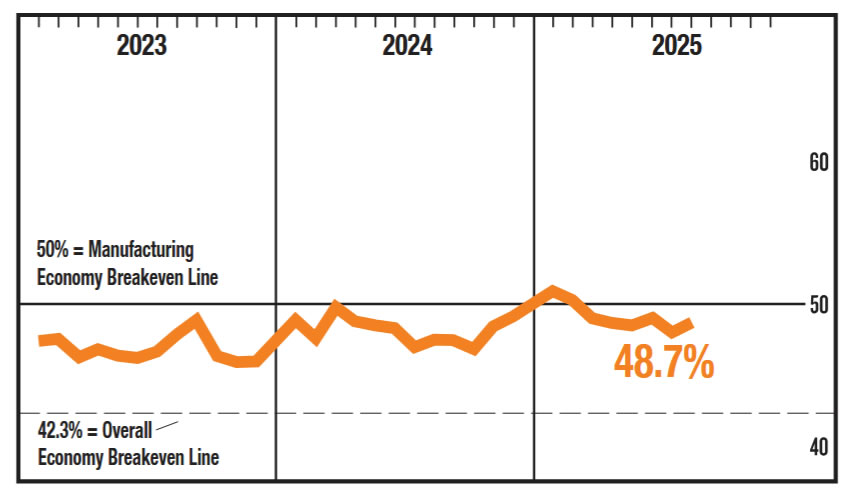
US: ISM Manufacturing Index Contracts for Sixth Consecutive Month in August
The ISM Manufacturing Index rose to 48.7 in May, up from 48.0 in July, but remained in contraction territory.
Only seven of 18 industries reported growth for the month, matching July's share. Roughly 70% of manufacturing GDP contracted in August, down from 79% recorded in July.
However, demand conditions improved in August, with the new orders index rising by 4.2 points to 51.4, signaling expansion for the first time since January. The new export orders index also rose by 1.5 points to 47.6, but continued to signal a contraction. The backlog of orders index fell 2.1 points on the month to 44.7, reversing the prior month's uptick and also signaling contraction.
The production index fell in August to 47.8 from 51.4, falling back into contraction territory after two months of expansion. The employment index remained in contractionary territory, but at a slower pace, with the index rising to 43.8 vs. 43.4 in July.
Price gains decelerated in August, coming in at 63.7 vs. 64.8 in August. However, the prices index continued to fluctuate near a three-year high.
Key Implications
Manufacturing activity contracted at a slower pace in August as domestic demand expanded and the decline in foreign demand slowed. However, with a host of tariff policies coming into effect during the month, including the full slate of reciprocal tariffs and 50% tariffs on Brazil and India, manufacturing production slipped back into contraction territory and hiring activity remained notably subdued.
Furthermore, sentiment relayed by survey respondents was dire. Comments included in the survey ranged from comparisons to the 2008 financial crisis in the transportation equipment industry, to describing current business plans as survival in the electrical equipment, appliances & components industry. The recent court ruling against many of the administration's tariff policies only adds to the uncertainty businesses are facing, as the case continues to be reviewed by the courts. While the likely return of interest rate cuts at the Federal Reserve's next meeting in two weeks will be welcome, trade policy is likely to remain a material headwind for the manufacturing industry through the second half of the year.
Euro CPI Ticks Higher, Euro Lower
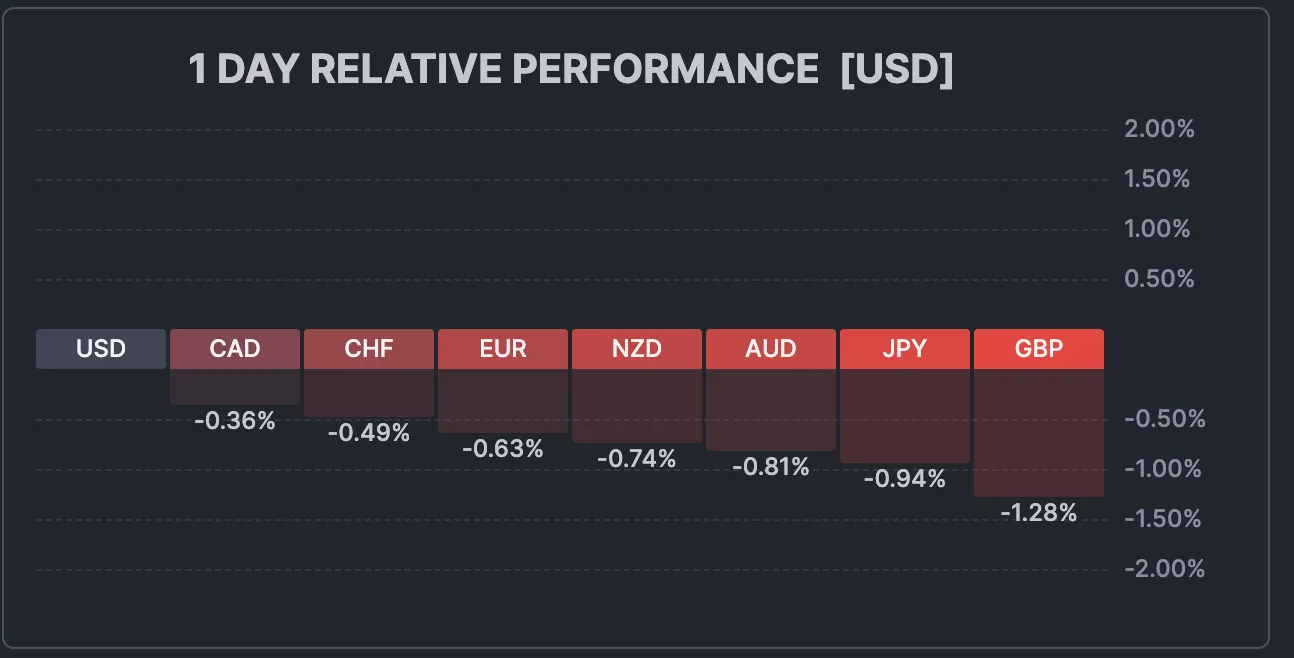
The US dollar has posted sharp gains against most of the majors on Tuesday. In the North American session,EUR/USD is trading at 1.1672, down 0.33% on the day. The euro fell as smuch as 0.84% today but has recovered most of those losses after soft US manufacturing data.
Eurozone CPI ticks up to 2.1%
Eurozone inflation ticked higher in August to 2.1% y/y, up from 2.0% in July. This was just above the market estimate of 2.0%. Services inflation, which has been sticky, eased to 3.1% from 3.2%.
Core CPI, which excludes energy and food, was unchanged at 2.3% y/y for a fourth consecutive time, above the market estimate of 2.2%. The core rate remained at its lowest level since October 2021.
The calm in inflation means that the European Central Bank is likely to continue to maintain its key deposit rate at 2.0% at the September 11 meeting. Still, the ECB has its doves who favor further rate cuts in order to kick-start the weak eurozone economy. As well, the Federal Reserve is widely expected to cut rates this month, which will put pressure on the ECB to also lower rates. The central bank has inflation under control but is also concerned about inflation undershooting the 2% target.
ISM Manufacturing PMI misses forecast
The US ISM Manufacturing PMI came in at 48.7 in August, up from 48.0 in July but below the market estimate of 49.0. Manufacturing has been in the doldrums, with six straight readings below 50, which indicates contraction. There was a rebound in new orders but production and employment showed declines.
The weak global economy and the impact of counter-tariffs on US goods continues to dampen manufacturing activity, with little indication that the situation will improve anytime soon.
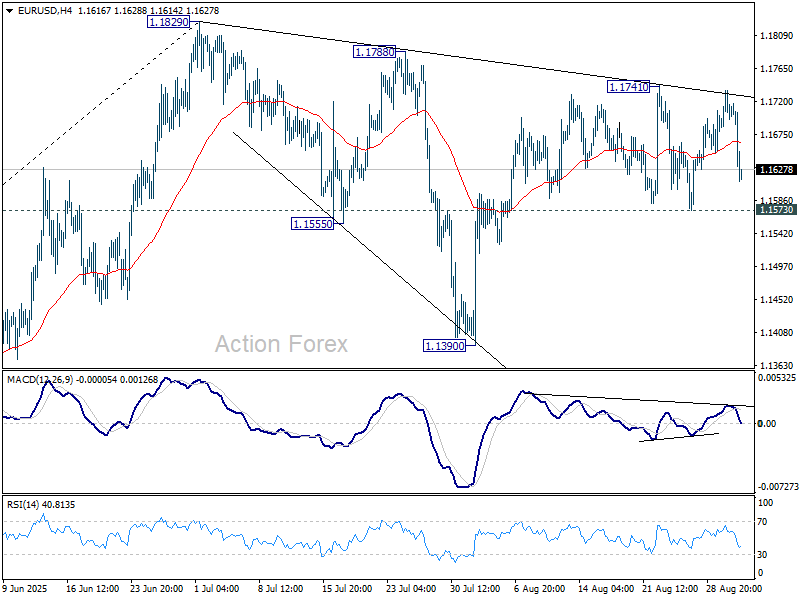
EUR/USD Technical
- EUR/USD has pushed below support at 1.1687 and is putting pressure on 1.1662. Next, there is support at 1.1638
- There is resistance at 1.1711 and 1.1736
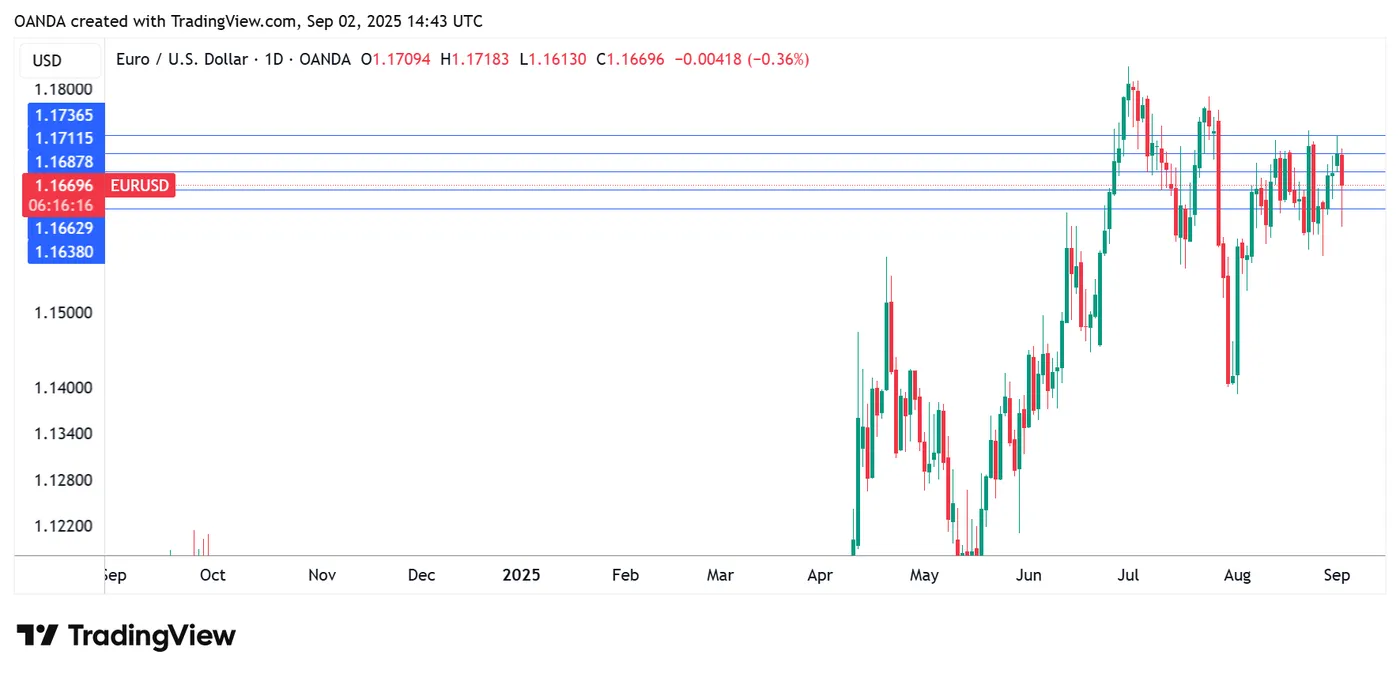
EURUSD 1-Day Chart, September 2, 2025
Sunset Market Commentary
Markets
Traders around the world, including in the US after Labour Day, have swapped their loungers for office chairs and governments were made well aware. Risk premia are back with a vengeance after a relatively calm summer period. The ultralong end of the curve is underperforming and the UK is once again lagging peers. The story is plain and simple: highly indebted countries keep on making deficits in a fundamentally different interest rate environment without massive central bank buying and with markets instead demanding higher compensation for increasing (credit) risks. The UK case stands out ever since the Truss-Kwarteng mini budget debacle in 2022. And going into this October’s budget, finance minister Reeves faces a trilemma of upholding the self-imposed fiscal straightjacket, keeping her spending commitments (or said otherwise: no meaningful spending cuts) while holding to her promise not to raise taxes again. Something’s got to give and the gilt market fears it’s going to be the first one. The 30-year UK yield adds 6 bps, launching the closely watched tenor towards the highest level since 1998. Other maturities add between 1.6-5.1 bps. The fiscal tidal wave is coming for everyone and since the spending U-turn announced by Merz early March, that includes German Bunds. Its 30-year tenor rose to 3.4%, the highest level in 14 years. The 30-year European (swap) equivalent is on the verge of topping 3% for the first time since November 2023. The US is no different (even though no one is talking about the BBB anymore), resulting in daily yield changes of 4.4-5.4 bps. Watch for the 30-year (4.97%) over there to hit 5% near-term. Similar-dated Japanese bond yields have added 2.7 bps but are bound to rise further in tomorrow’s Asian session after missing out on part of the intraday rise in the other regions. The core bond selloff triggers broader risk aversion, notably in equity markets. European stocks shed 1.4%. Main indices on Wall Street drop up to 1.5% (Nasdaq) at the open. The US dollar emerges as the main beneficiary on currency markets. Losing a safe have appeal doesn’t happen overnight, of course, but is a slow process of gradual erosion. The greenback gains against all of the important peers, most notably against sterling. GBP/USD suffers a double whammy with the pair dropping from 1.354 at the open to 1.337 currently. EUR/USD eases to 1.164 but in a move far from technically significant. The pair has room for further declines towards the 1.14(3) area before things get tricky. The trade-weighted dollar index rebounds to 98.4, up from 97.6 at the open. Fiscal worries also weigh on the yen (USD/JPY 148.5), preventing it from fulfilling its safe haven status. Gold, on the other hand, does. The precious metal looked through the yield increase to briefly hit a new all-time high. The US manufacturing ISM is still up for release after this report but it’s unlikely it’ll alter the current market moves.
News & Views
Hungarian Q2 GDP growth was confirmed at 0.4% Q/Q and 0.1% Y/Y today. From a production point of view, valued added in construction was 4.3% higher Y/Y and activity in services rose 1.3% Y/Y. Industrial activity (-3.3% Y/Y) and agriculture (-11.4% Y/Y) contributed negatively to growth. Considering an expenditure point of view, household consumption rose 1.8% Q/Q (was 0.1% in Q1) and 4.5% Y/Y. Government consumption rose 1.2% Q/Q and 9.8% Y/Y. On the other hand, gross fixed capital formation declined 1.9% Q/Q and -7.0% Y/Y. Exports declined 0.9% Y/Y as imports rose 4.0% Y/Y, resulting in a negative contribution of 3.4 ppts to yearly growth. Hungarian swap yields today add about 3-5 bps across the curve. This is probably driven by the overall market focus on fiscal sustainability, and higher risk premia rather than on data published today. The forint declines, albeit mildly, given the overall risk-off context (EUR/HUF 395.75).
According to Bloomberg referring to remarks from Michl after his trip to the Jackson Hole meeting, the CNB governor supported the recent process to reduce interest rates, but indicated that monetary policy should avoid holding borrowing cost extremely low for a long period. Michl was said to support the view that without fiscal reforms and in a context with an aging population and rising government debts, central banks will have to hold rates higher than in the period before the pandemic. Michl distanced himself from previous policy of currency interventions, including a bigger CNB balance sheet and negative real interest rates, and indicated this will have to be offset by relatively higher interest rates than before.
US ISM manufacturing improves to 48.7, still in contraction for the sixth month
US manufacturing showed tentative signs of stabilization in August, with ISM Manufacturing PMI rising to 48.7 from 48.0, slightly above expectations of 48.6. Despite the improvement, the index remained in contraction for the sixth consecutive month, highlighting the strain from weak global demand and tariff-related pressures.
New orders provided a bright spot, jumping to 51.4 from 47.1 to expand for the first time since January. Export orders also improved slightly from 46.1, though they remained in contraction at 47.6. Imports weakened further from 47.6 to 46.0, while production slipped back into contraction at 47.8, down from 51.4, its first decline since May.
Labor market conditions remained fragile, with the employment index at 43.8, up from 43.4, marking a seventh straight month of contraction. Price pressures moderated slightly, with the index easing to 63.7 from 64.8, though tariff-driven increases in steel and aluminum continued to filter through supply chains, keeping costs elevated across the sector.
Overall, ISM noted that 69% of manufacturing GDP contracted in August, down from 79% in July. The PMI’s historical relationship with GDP suggests the latest reading corresponds to an annualized real GDP growth rate of about 1.8%. While the headline index remains weak, the rebound in new orders offers a glimmer of optimism that activity may be bottoming out.
Dollar Strengthens After Labor Day – DXY Technical Outlook
Traders are getting back to their desks after a prolonged weekend – Both the United States and Canada were celebrating Labor Day yesterday.
The week prior to Labor Day tends to see slower movement and thinner volumes and despite recent volatility, this year was not an exception.
Rangebound conditions have dominated currency markets since Powell's change of tone which shook up rate expectations for the FED – The upcoming Federal Reserve meeting, coming up on September 18, is close to a promised cut (90% of a 25 bps cut priced in).
Volatility is now back on its feet to kick off the month.
With the UK Government bonds opening the week with fresh concerns, a huge selloff in Gilts is leading another rout in the Bond market – With the GBP hurting at the same time.
These concerns combined with a failure from bears to push the Greenback below its prior week range, and rising geopolitical tension around the globe are hurting sentiment.
US Index futures (pre-open for Equities) are in the red and cryptocurrencies attempted a rebound which got rejected – The US Dollar on the other hand is shining.
A past week Dollar Index analysis had emitted the hypothesis that bears had the fundamentals to take control of the action, but their hesitancy paints another picture.
Is a longer-run rebound close?
We'll take a look at that right now.
An overlook at the daily picture in the FX Market
FX Market overview – September 2, 2025 – Source: Finviz
Dollar Index technical outlook
DXY Daily chart
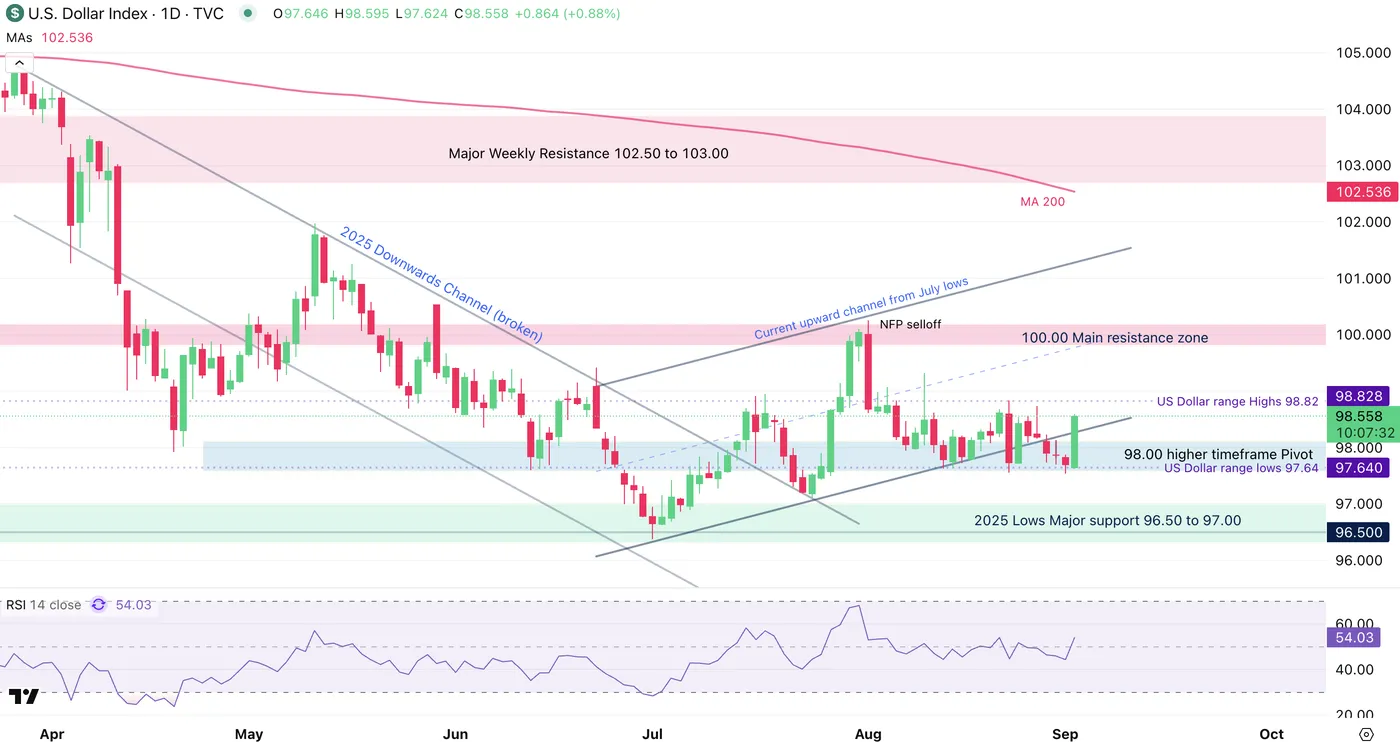
Dollar Index Daily chart, September 2, 2025 – Source: TradingView
The US Dollar is putting up a strong bull candle ahead of today's ISM US Manufacturing report (coming up at 10:00 A.M.)
Despite the current data having the potential to influence the current flows, it seems that currency markets are more looking at US bond yields that are strengthening while Index futures are weakening – this underpins the USD.
Hanging around the higher timeframe 98.00 Pivot zone, the rebound is exacerbated by hesitant USD sellers – with bets on a lower dollar increasing since Jackson Hole, you can expect a failed move to see reversals like the one from today.
RSI is still neutral but rising, however one thing to keep in mind is that the Friday Non-Farm Payrolls report will have the most influence on the future price action for all markets and particularly in the US.
DXY 4H chart
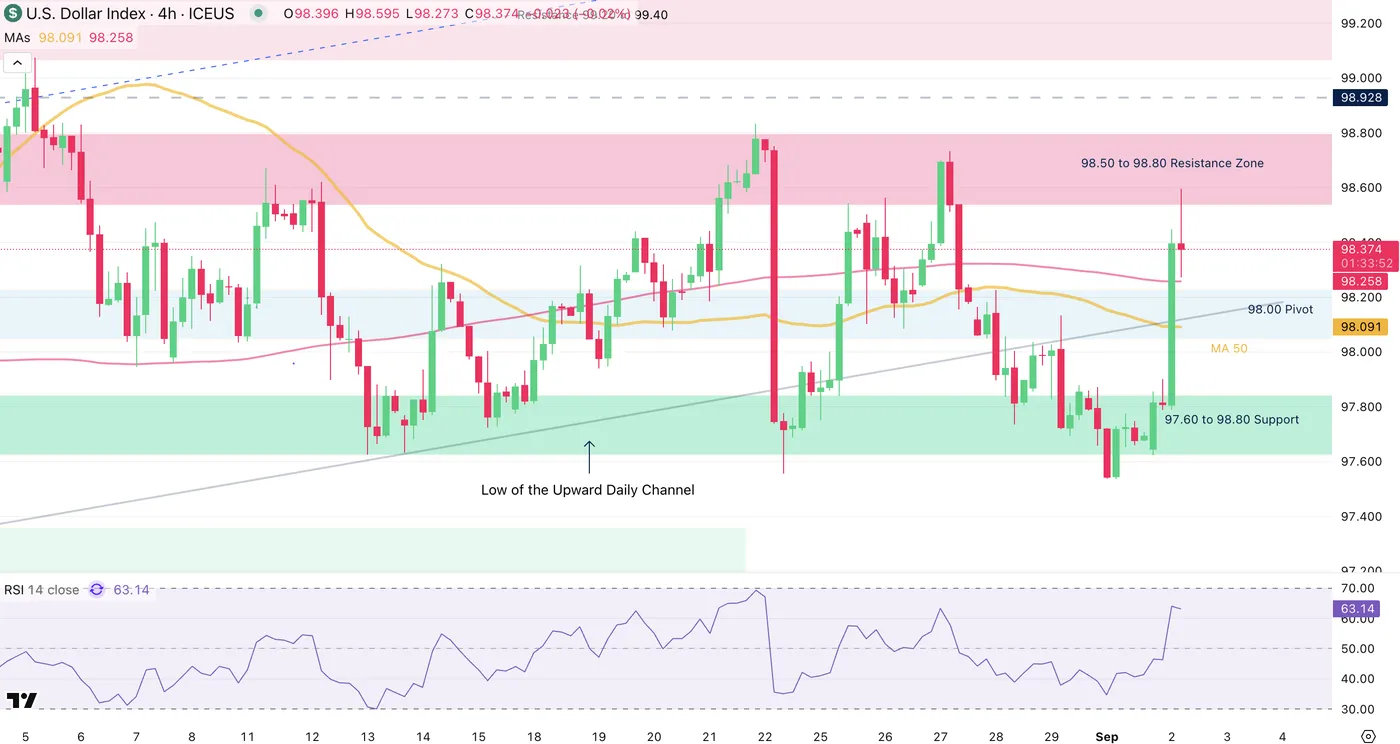
Dollar Index 4H chart, September 2, 2025 – Source: TradingView
Looking closer to the 4H Chart, it seems that rangebound conditions still have a high possibility of holding – As I write this piece, mean-reversion USD sellers have appeared at the upper bound of the prior week range.
Held in a range between 97.60 lows to around 98.80 since the 11th of August, participants have tried without success to provide meaningful direction to the Greenback.
As always, the Non-Farm Payrolls report is making every participants hold their breath.
Levels to watch for the Dollar Index (DXY):
Support Levels:
- 98.00 Pivot (key for immediate momentum, immediate support)
- Lower bound of the upward channel 97.60 to 97.80
- 2025 Lows Major support 96.50 to 97.00
Resistance Levels:
- US Dollar range Highs 98.82
- 98.50 to 98.80 Resistance Zone
- Mid-line of the ascending channel and psychological level 99.50
- 100.00 Main resistance zone
Dollar Index 1H chart
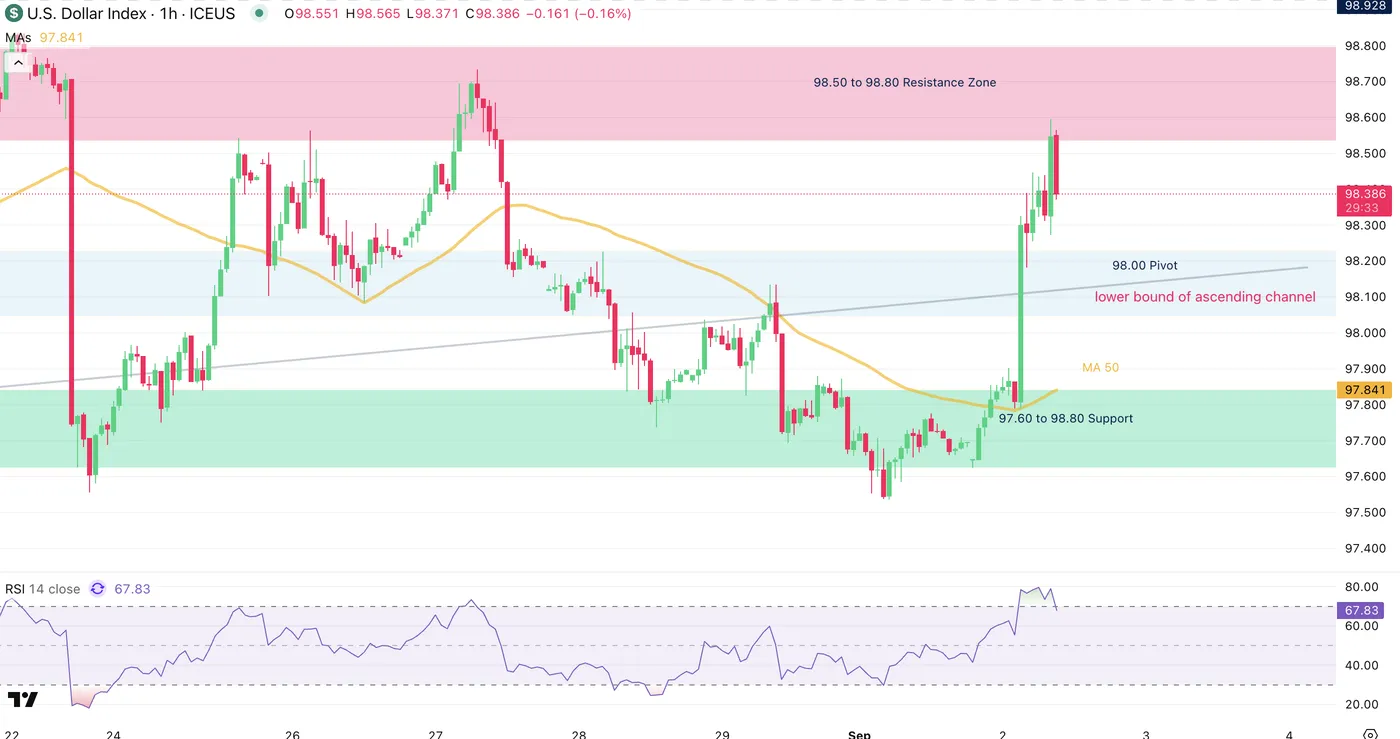
Dollar Index 1H chart, September 2, 2025 – Source: TradingView
It will be interesting to spot if players want to prolong the already extensive moves in FX after the upcoming US ISM Manufacturing report.
Don't forget to log in for our headline piece.
Safe Trades and successful week!
GBP/USD Mid-Day Outlook
Daily Pivots: (S1) 1.3510; (P) 1.3530; (R1) 1.3566; More...
GBP/USD's fall from 1.3594 resumed by diving through 1.3389 support and intraday bias is back on the downside. Corrective pattern from 1.3787 is extending with another falling leg. Deeper decline would be seen back to 1.3140 support. But downside should be contained by 38.2% retracement of 1.2099 to 1.3787 at 1.3142. But still, for now, risk will stay mildly on the downside as long as 1.3459 resistance holds, in case of recovery.

In the bigger picture, up trend from 1.3051 (2022 low) is in progress. Next medium term target is 61.8% projection of 1.0351 to 1.3433 from 1.2099 at 1.4004. Outlook will now stay bullish as long as 55 W EMA (now at 1.3104) holds, even in case of deep pullback.

EUR/USD Mid-Day Outlook
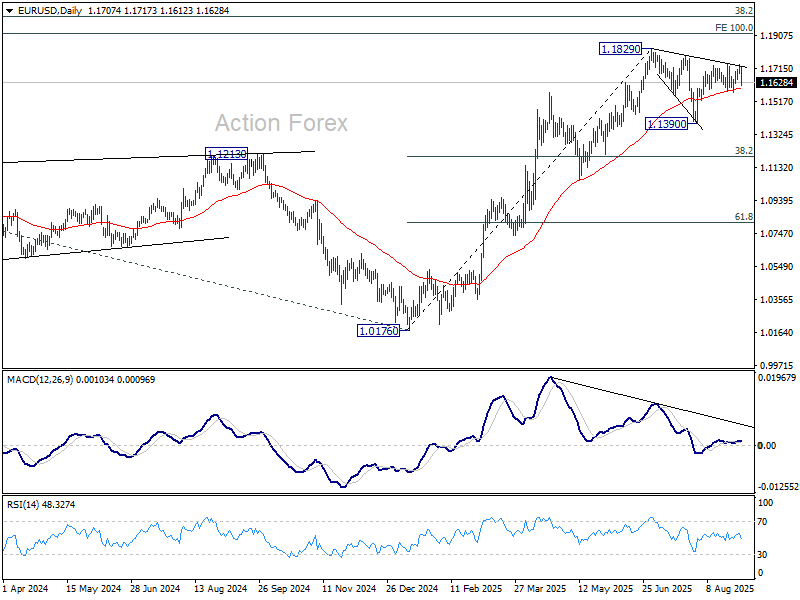
Daily Pivots: (S1) 1.1655; (P) 1.1682; (R1) 1.1713; More...
Range trading continues in EUR/USD and intraday bias remains neutral. Overall outlook is unchanged that corrective fall from 1.1829 should have completed with three waves down to 1.1390. On the upside, above 1.1741 will bring retest of 1.1829 high first. Firm break there will resume larger up trend. However, sustained break of 1.1573 will dampen this view, and indicate that corrective pattern from 1.1829 is extending with another falling leg towards 1.1390 again.
In the bigger picture, rise from 0.9534 (2022 low) long term bottom could be correcting the multi-decade downtrend or the start of a long term up trend. In either case, further rise should be seen to 100% projection of 0.9534 to 1.1274 from 1.0176 at 1.1916. This will remain the favored case as long as 1.1604 support holds.
USD/CHF Mid-Day Outlook
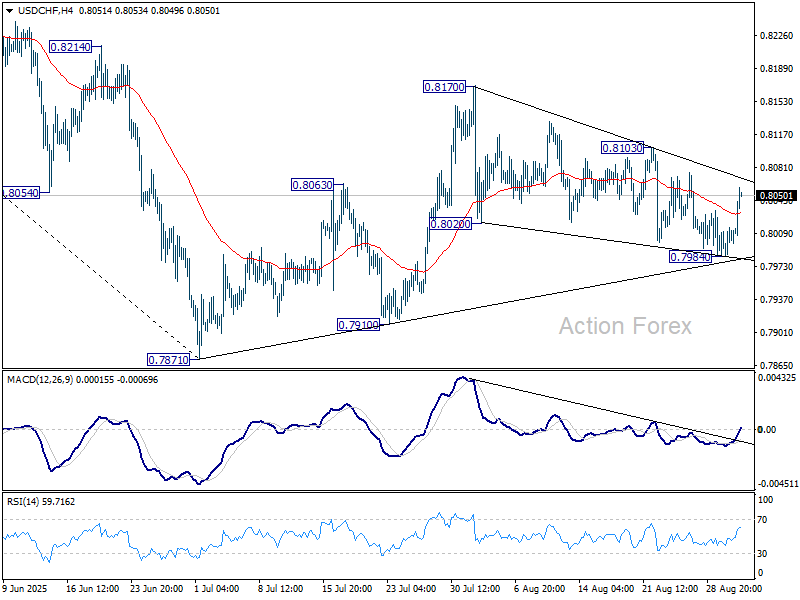
Daily Pivots: (S1) 0.7988; (P) 0.8002; (R1) 0.8019; More….
Intraday bias in USD/CHF remains neutral first. On the downside, break of 0.7984 will resume the fall from 0.8170 to 0.7910 support first, and then retest of 0.7871 low. However, break of 0.8103 resistance will turn bias to the upside to resume the rebound from 0.7871 through 0.8170.
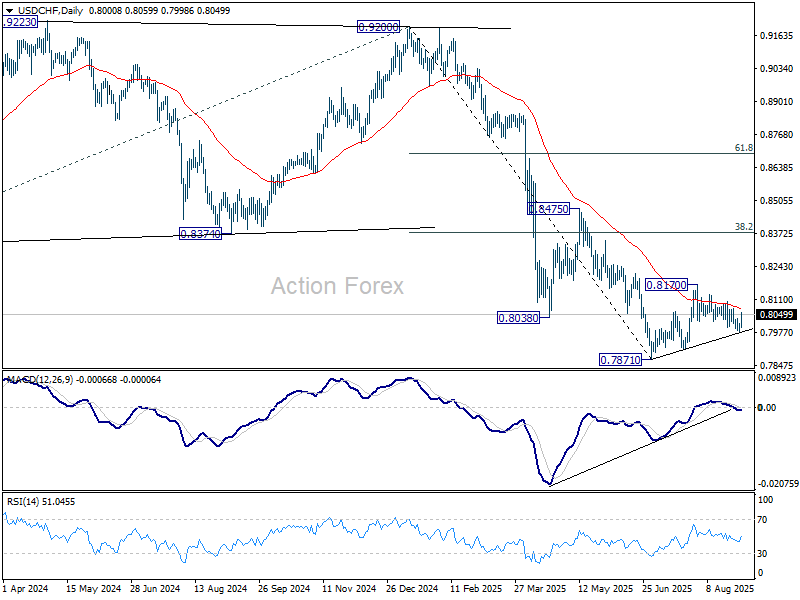
In the bigger picture, long term down trend from 1.0342 (2017 high) is still in progress. Next target is 100% projection of 1.0146 (2022 high) to 0.8332 from 0.9200 at 0.7382. In any case, outlook will stay bearish as long as 0.8475 resistance holds.
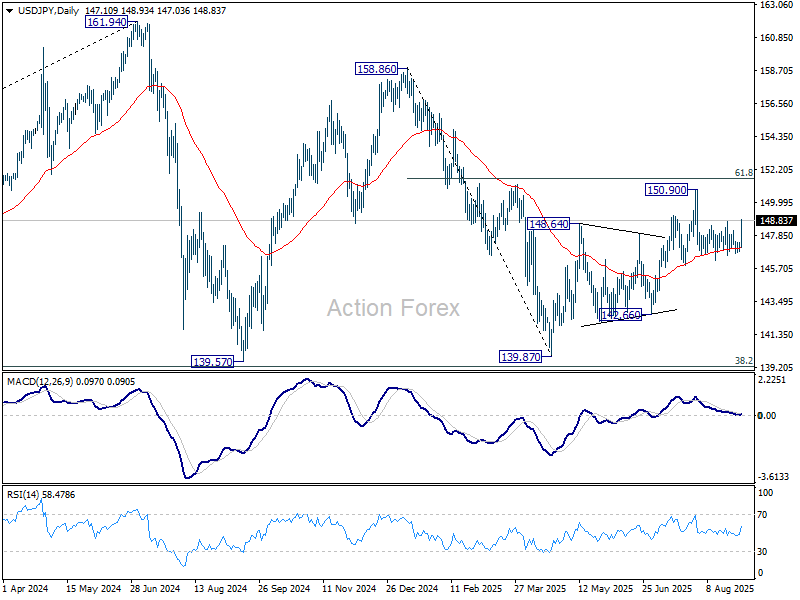
USD/JPY Mid-Day Outlook
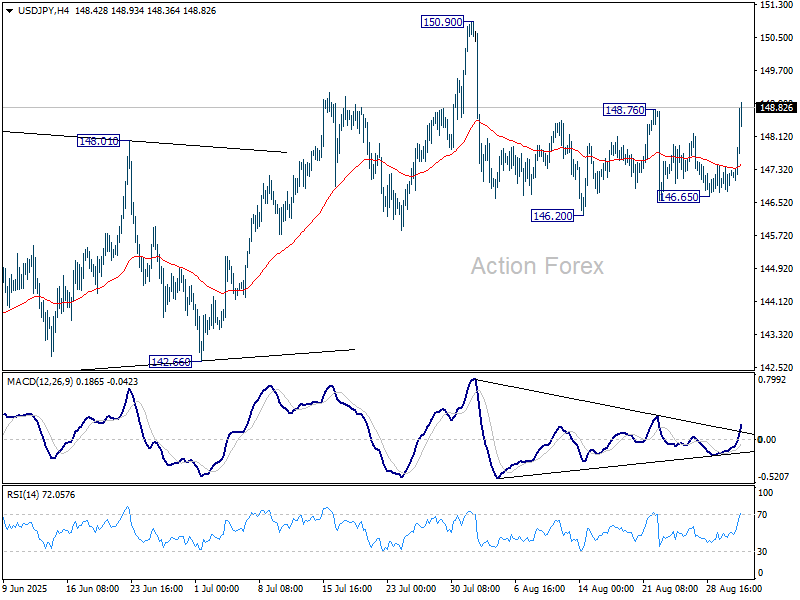
Daily Pivots: (S1) 146.85; (P) 147.12; (R1) 147.44; More...
USD/JPY's break of 148.76 resistance suggests that pullback from 150.90 has already completed after drawing support from 55 D EMA (now at 147.06). Intraday bias is back on the upside for 150.90, and then 151.22 fibonacci level. Firm break there will carry larger bullish implication. On the downside, however, break of 146.65 support will resume the decline from 150.90 through 146.20 instead.
In the bigger picture, price actions from 161.94 (2024 high) are seen as a corrective pattern to rise from 102.58 (2021 low). Decisive break of 61.8% retracement of 158.86 to 139.87 at 151.22 will argue that it has already completed with three waves at 139.87. Larger up trend might then be ready to resume through 161.94 high. In case the corrective pattern extends with another fall, strong support is expected from 38.2% retracement of 102.58 to 161.94 at 139.26 to bring rebound.