
Sample Category Title
Gold (XAU/USD) Technical: Bullish Acceleration Supported Rising Implied Volatility
The price actions of Gold (XAU/USD) have staged the expected bullish move, rallied by 2.3% and hit the US$3,435 resistance as highlighted in our earlier publication last Friday, 29 August.
The price actions of Gold (XAU/USD) have staged the expected bullish move, rallied by 2.3% and hit the US$3,435 resistance as highlighted in our earlier publication last Friday, 29 August.
For a quick recap, the US$3,435 is considered a significant range resistance on Gold (XAU/USD) as this level has managed to stall prior rallies since its current all-time high of US$3,500 printed on 22 April 2025 and caused Gold (XAU/USD) to oscillate in a choppy sideways range in the past four months.
Gold (XAU/USD) has finally managed to have a proper bullish breakout above the four-month range resistance of US$3,435 in last Friday’s US session, as it recorded a daily close of US$3,447 on 29 August in light of an anticipation of a US Federal Reserve's dovish pivot in September.
Gold (XAU/USD) extended its upward momentum at the start of the week, advancing 0.8% to close at US$3,476 on Monday, 1 September.
In this latest report, we will highlight several key technical elements that Gold (XAU/USD) has entered into a potential short to medium-term bullish acceleration phase.
Let’s discuss them in detail, as well as the next short-term directional bias and key levels to watch on Gold (XAU/USD)
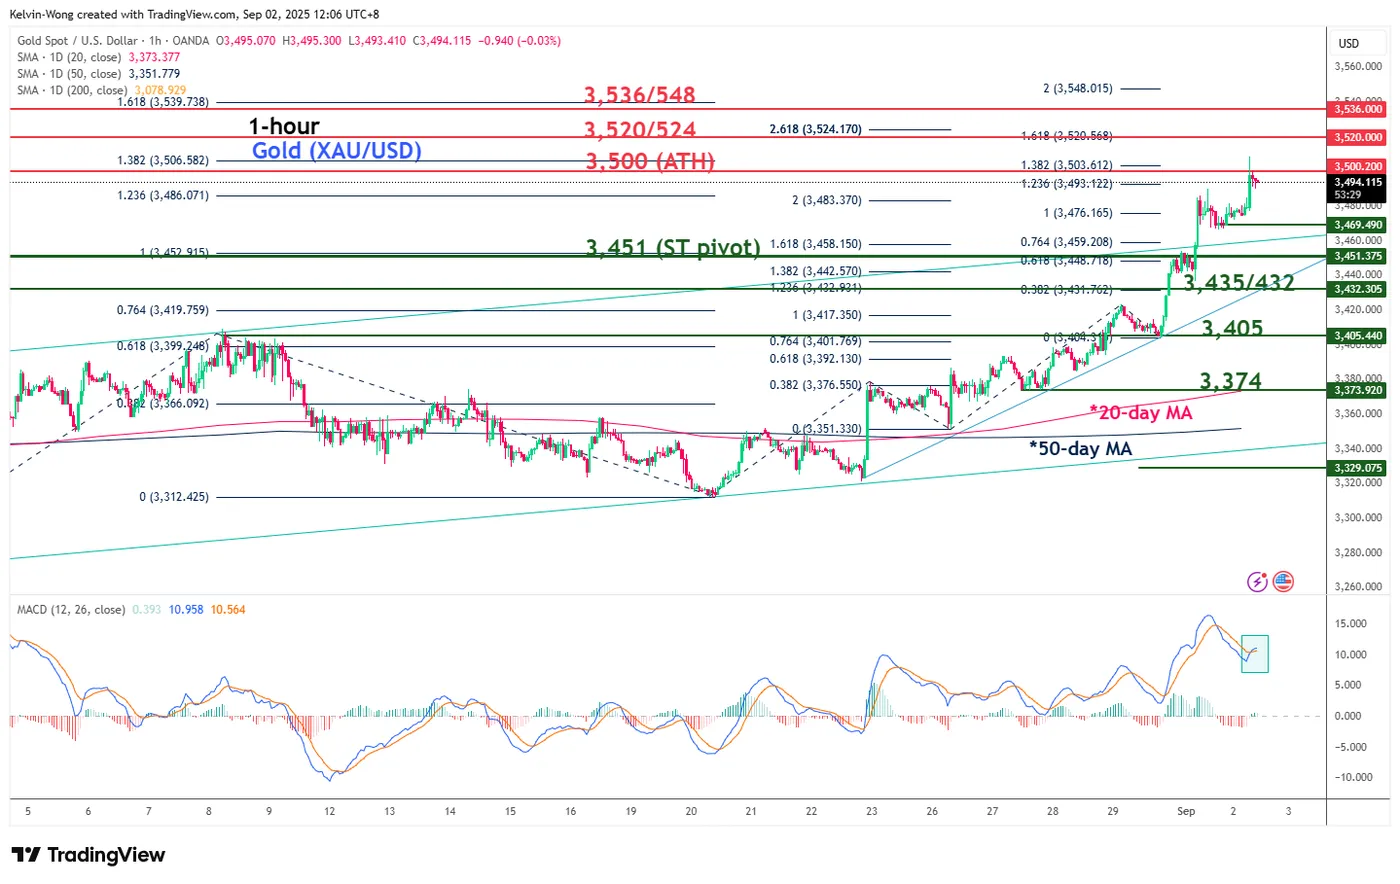
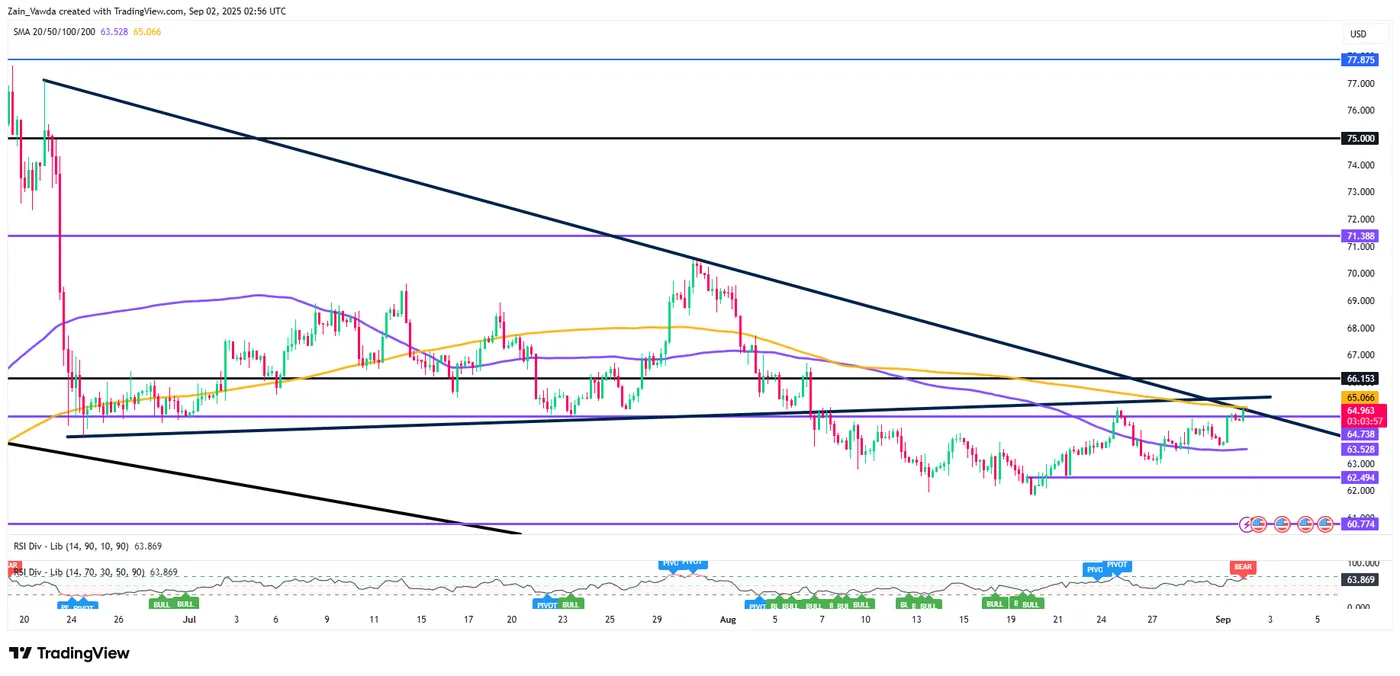
Fig. 1: Gold (XAU/USD) minor trend as of 2 Sep 2025 (Source: TradingView)
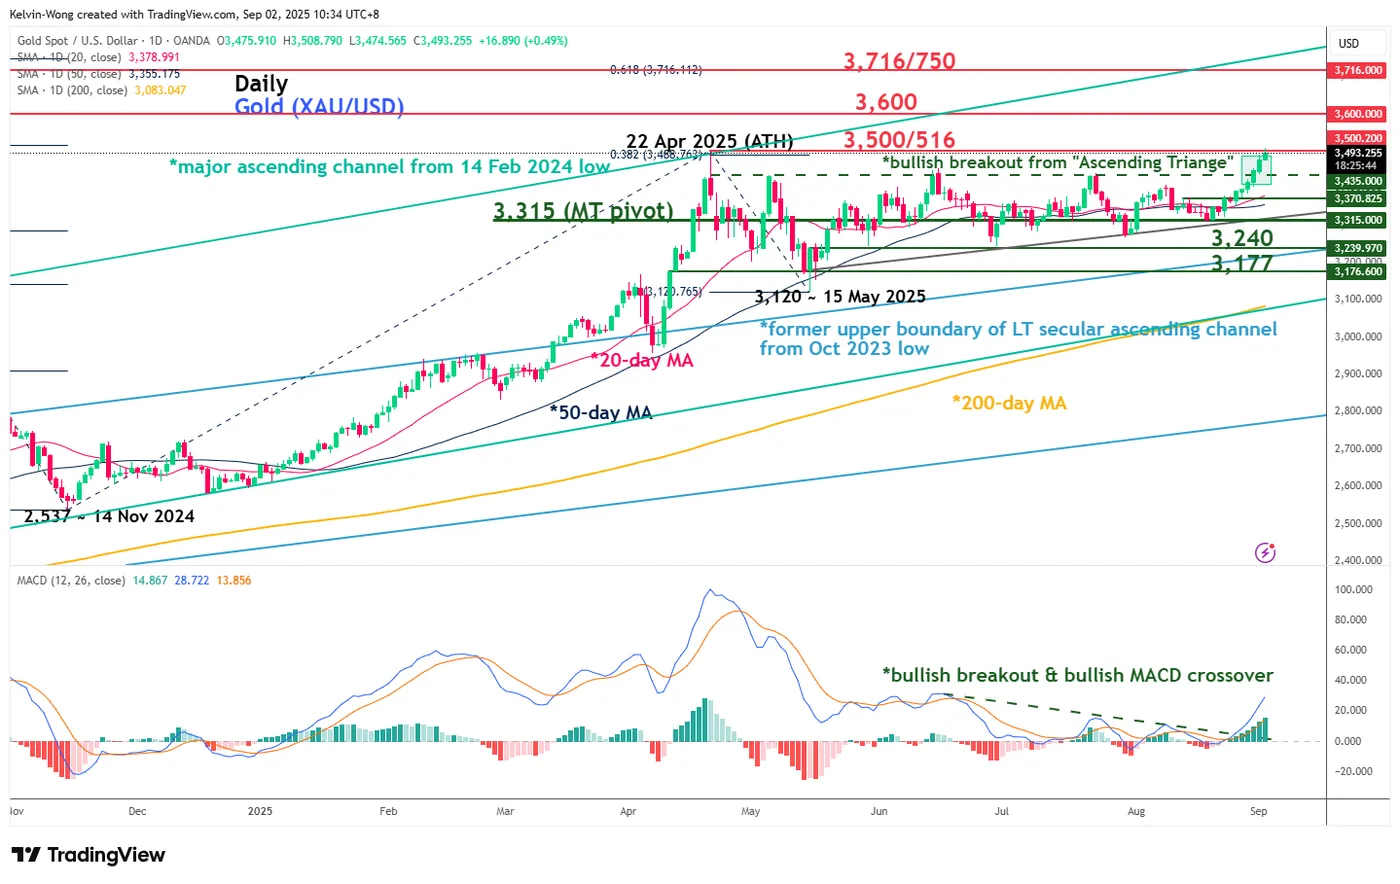
Fig. 2: Gold (XAU/USD) medium-term trend as of 2 Sep 2025 (Source: TradingView)
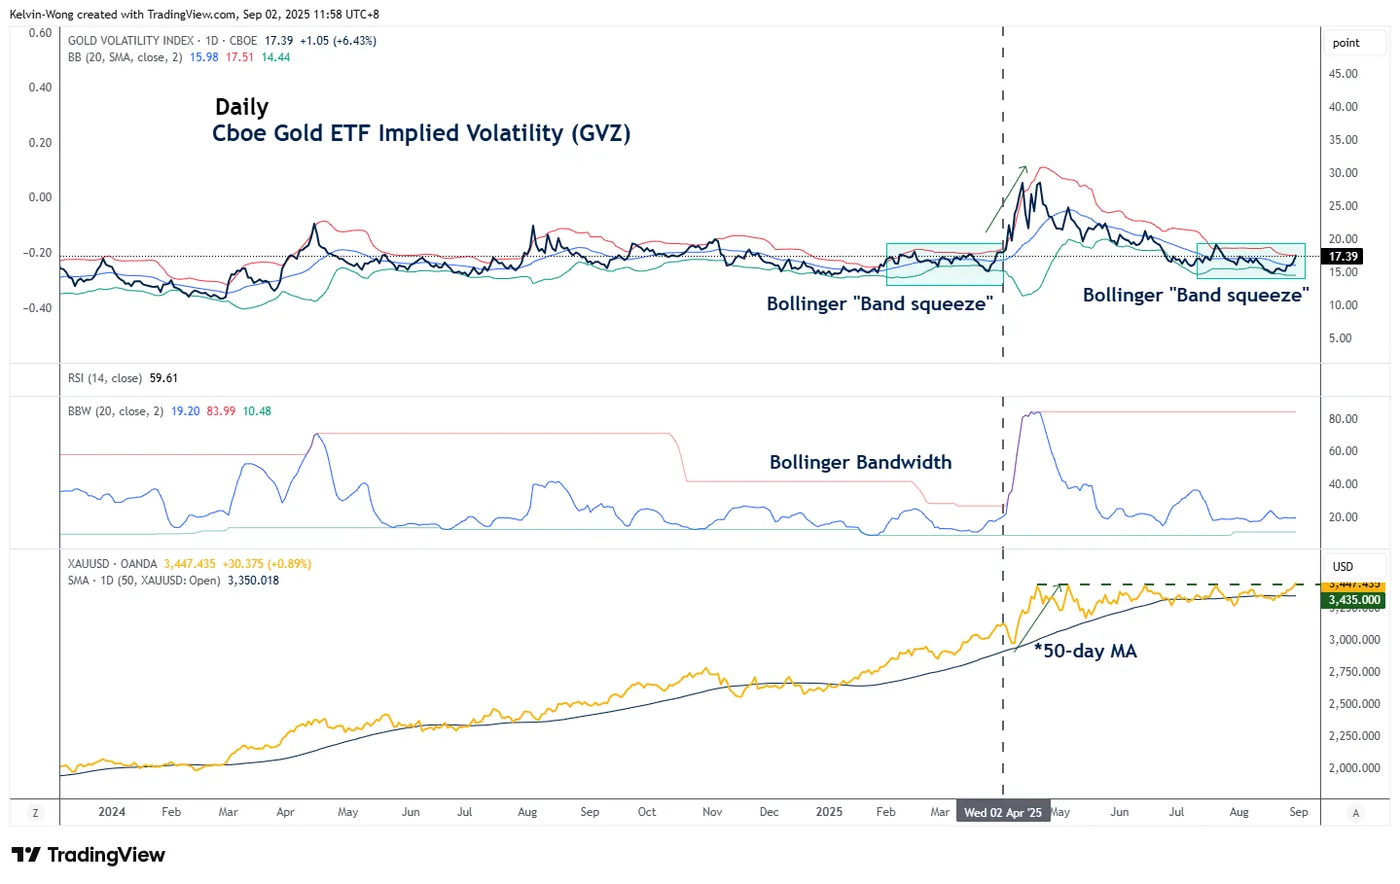
Fig. 3: Gold (XAU/USD) with GVZ (implied volatility of Gold ETF) as of 2 Sep2025 (Source: TradingView)
Preferred trend bias (1-3 days)
Maintain bullish bias on Gold (XAU/USD) as the yellow metal kickstarts a potential bullish acceleration phase (see Fig. 1).
Watch the US$3,451 key short-term pivotal support. A clearance above US$3,500 (the current all-time high) will see the next intermediate resistances coming in at US$3,520/3,524 and US$3,536/3,548 (Fibonacci extension clusters).
Key elements
- The hourly MACD trend indicator of Gold (XAU/USD) has just flashed out an impending bullish crossover signal above its centreline, which suggests that short-term bullish momentum remains intact (see Fig. 1).
- The recent bullish breakout in the Gold (XAU/USD) above US$3,435 marks an exit from a bullish continuation range configuration, defined as a bullish “Ascending Triangle”. These observations increase the odds of a continuation of its prior impulsive up move sequence (see Fig. 2).
- The daily MACD trend indicator of Gold (XAU/USD) has continued to trend upwards above its centreline after its earlier bullish crossover on Monday, August 25, 2025, which supports a potential change in medium-term trend conditions from sideways to bullish (see Fig. 2).
- The Cboe Gold exchange-traded fund implied volatility (GVZ) has entered into a low volatility environment, as depicted by the narrowing of the Bollinger Bands, called the “Band Squeeze” since mid-July 2025. A “Band Squeeze” or a low “Bandwidth” reading is a prelude to a potential expansion in volatility. An increased implied volatility (GVZ) may trigger a significant up move in Gold (XAU/USD) (see Fig. 3).
- Recent observations between February and March 2025, when a Bollinger “Band Squeeze” in GVZ occurred, preceded a notable rally in Gold (XAU/USD) in April 2025 (see Fig. 3).
Alternative trend bias (1 to 3 days)
Failure to hold at the US$3,451 key short-term support on Gold (XAU/USD) negates the bullish tone for another round of minor corrective decline to retest US$3,435/3,432 pull-back support of the former medium-term “Ascending Triangle” range resistance.
WTI Oil Rallies 1% and Eyes Break of Key Confluence Level. Could a Rally to $70/Barrel Finally
Oil prices have rallied just over 1% to start the week thanks in part to rising geopolitical risks with Russia-Ukraine tensions stoking supply concerns.
Russia-Ukraine Developments
Ukraine has recently used drones to attack and shut down many of Russia's oil processing plants. These attacks have stopped Russia from processing over a million barrels of oil each day, which is a significant part of their total supply (about 17%).
Ukraine's President, Volodymyr Zelenskiy, has said they plan to launch more of these attacks deep inside Russia.
This is happening three and a half years into the war. In the last few weeks, both sides have increased their air strikes. While Russia has been attacking Ukraine's power and transport systems, Ukraine is hitting back by targeting Russia's oil industry.
These ongoing attacks on energy infrastructure have increased the risk premium and this is likely aiding oil prices at present. A potential peace deal touted by US President Donald Trump appears to be falling apart with European Leaders taking a more combative approach following a historic meeting at the White House in August.
Many had expected the meeting to lead to a path for peace, for now though, this seems further away than ever.
Chevron Returns to Venezuela
The US government, under the Trump administration, has slightly changed its rules for Venezuela's oil industry. It gave the oil company Chevron special permission to increase its work there. This is a careful change, not a wide-open door, but it might allow other foreign oil companies to return to Venezuela in the future.
At the same time, the US is using a two-part strategy. While it's allowing more oil to be produced, it is also increasing pressure on Venezuela's President, Nicolás Maduro. As part of this, the US recently sent three navy warships to waters near Venezuela to help fight drug trafficking. The government had also previously charged Maduro with drug-related terrorism and offered a $50 million reward for his arrest.
For Chevron, this special permission is a big deal. The company could produce about 250,000 more barrels of oil per day. While that's not enough to change global oil prices, it's a significant boost for Chevron itself, increasing its oil production by more than 10%. Chevron's refineries in the US are now in a great position to process this cheaper Venezuelan oil, which they haven't been able to get for years.
The decision may offset some of the fears around Russian Oil supply and could be seen as a move in anticipation of supply constraints if the US follows through on harsher restrictions on Russian Oil purchases.
However, this is unlikely to affect demand for Russian Crude. China and India are the biggest buyers of crude oil from Russia. India has already seen additional tariffs imposed as a result of a its Russian Oil purchases but has remained steadfast thus far.
This was evident by Narendra Modi attending the SCO (Shanghai Cooperation Organization) meeting in Tianjin over the weekend where he was pictured alongside China Leader Xi Jinping and Russian Leader Vladimir Putin.
OPEC 8 Meeting
Markets will now turn their attention to API and EIA data this week ahead of the much anticipated meeting by the OPEC 8 scheduled for September 7.
OPEC meetings this year have been fruitful with significant output increases. The recent meeting on August 3 saw a 547,000 bpd increase for September, fully reversing the group's previous voluntary output cuts.
The group does appear to have pivoted its strategy to counter US President Donald Trump's pledge to lower oil prices. They have shifted from price stabilization to market share as Oil prices struggle to break back above the $70/ barrel mark.
The lower Oil prices go the more beneficial this may prove to OPEC members as US producers need Oil to average around the $56/barrel mark to remain profitable. Thus the closer we are to that number the less appealing it is for US producers.
For all market-moving economic releases and events, see the MarketPulse Economic Calendar. (click to enlarge)
Technical Analysis - WTI
From a technical analysis standpoint, Oil is eyeing a clean break of a long-term descending trendline which could open up the possibility of a significant rally to the upside.
The trendline is also a confluence level as it lines up with the 200-day MA resting at the 65.00 handle.
A break of this level should in theory lead to a rally toward the 70.00 mark before the next target at 76.00 comes into view.
However, there are potential warning signs that need to be considered. Firstly the current price is almost identical to the previous swing high from August 25 which led to a selloff back to the 63.00 mark and thus a rejection here could be seen as a potential double top pattern and lead to an influx of sellers.
This make this level a key inflection point for Oil prices in the short-term and potentially the medium-term as well and should be monitored closely.
WTI Oil Four-Hour (H4) Chart, September 1, 2025
Source: TradingView (click to enlarge)
Gold breaks above 3,500, Fed pressure adds fuel
Gold’s rally accelerated this week, surging past 3,500 level for the first time in history. The move reflects growing conviction that the Fed’s rate-cut cycle will extend deep into 2026, eventually bringing policy back to neutral at around 3.00%. With global uncertainty mounting and political interference in Washington intensifying, the precious metal continues to draw strong demand as a hedge.
U.S. President Donald Trump has amplified calls for more aggressive easing, declaring in a social media post that “Prices are WAY DOWN in the USA, with virtually no inflation.” Treasury Secretary Scott Bessent added to the pressure, accusing the Fed of “a lot of mistakes” and backing Trump’s effort to remove Governor Lisa Cook. Bessent also urged swift Senate confirmation of White House economic adviser Stephen Miran to temporarily replace Adriana Kugler, who resigned earlier this month, for the upcoming FOMC meeting this month.
Investors increasingly view Gold as a shield against political intrusion into monetary policy, particularly as institutional frictions grow louder in the run-up to key policy meetings. The combination of dovish expectations and political pressure has fueled the current strong rally.
Technically, while there may be some jitters for Gold at the current 3,500 psychological resistance, near term outlook will stay bullish as long as 3,408.21 resistance turned support holds.
Current rally should target 161.8% projection of 3,267.90 to 3,408.21 from 3,311.30 at 3,538.32 in the near term. Firm break there will pave the way to 261.8% projection at 261.8% projection at 3,678.63 next.


BoJ’s Himino: Risk of larger-than-expected tariff impact warrants focus
BoJ Deputy Governor Ryozo Himino warned in a speech today that U.S. trade policies are likely to weigh on Japan’s economy, with overseas slowdowns and weaker corporate profits feeding through domestically. While accommodative financial conditions should cushion the hit, Himino said the baseline scenario is for Japan’s growth to “moderate,” with downside risks from tariffs deserving greater attention.
Looking further ahead, Himino said Japan’s growth should eventually recover as overseas economies return to a more stable expansion path. But in the near term, the tariff shock remains the key uncertainty, with the risk of a “larger-than-expected impact” now seen as more pressing than the chance of a mild outcome.
On inflation, Himino noted that headline prices remain above the BoJ’s 2% target, by a "considerable margin", due in part to surging rice prices and spillovers to other goods. However, he stressed headline inflation is expected to "decline in due course" as food-related effects fade. Underlying inflation, meanwhile, remains below target but is steadily rising, despite some potential "temporary halts", supported by a wage–price feedback loop.
Summing up, Himino said the BoJ’s baseline scenario assumes headline inflation will cool, while core prices continue to edge toward 2%. If that path holds, it would be appropriate for the central bank to keep raising rates gradually, fine-tuning monetary accommodation in line with improving economic activity and stable price gains.
Ethereum Approaches Support Zone – Can Buyers Stop Further Losses?
Key Highlights
- Ethereum started a downside correction after trading close to $5,000.
- ETH is approaching a connecting bullish trend line with support at $4,020 on the daily chart.
- Bitcoin price is consolidating losses below the $110,000 resistance.
- XRP is struggling to gain pace for a move above the $3.00 level.
Ethereum Technical Analysis
Ethereum traded to a new all-time high near $4,951 and started a downside correction. ETH dipped below the $4,650 and $4,550 levels.
Looking at the daily chart, the price dipped below the 23.6% Fib retracement level of the upward move from the $2,108 swing low to the $4,951 high. However, the bulls are now active above the $4,000 support zone.
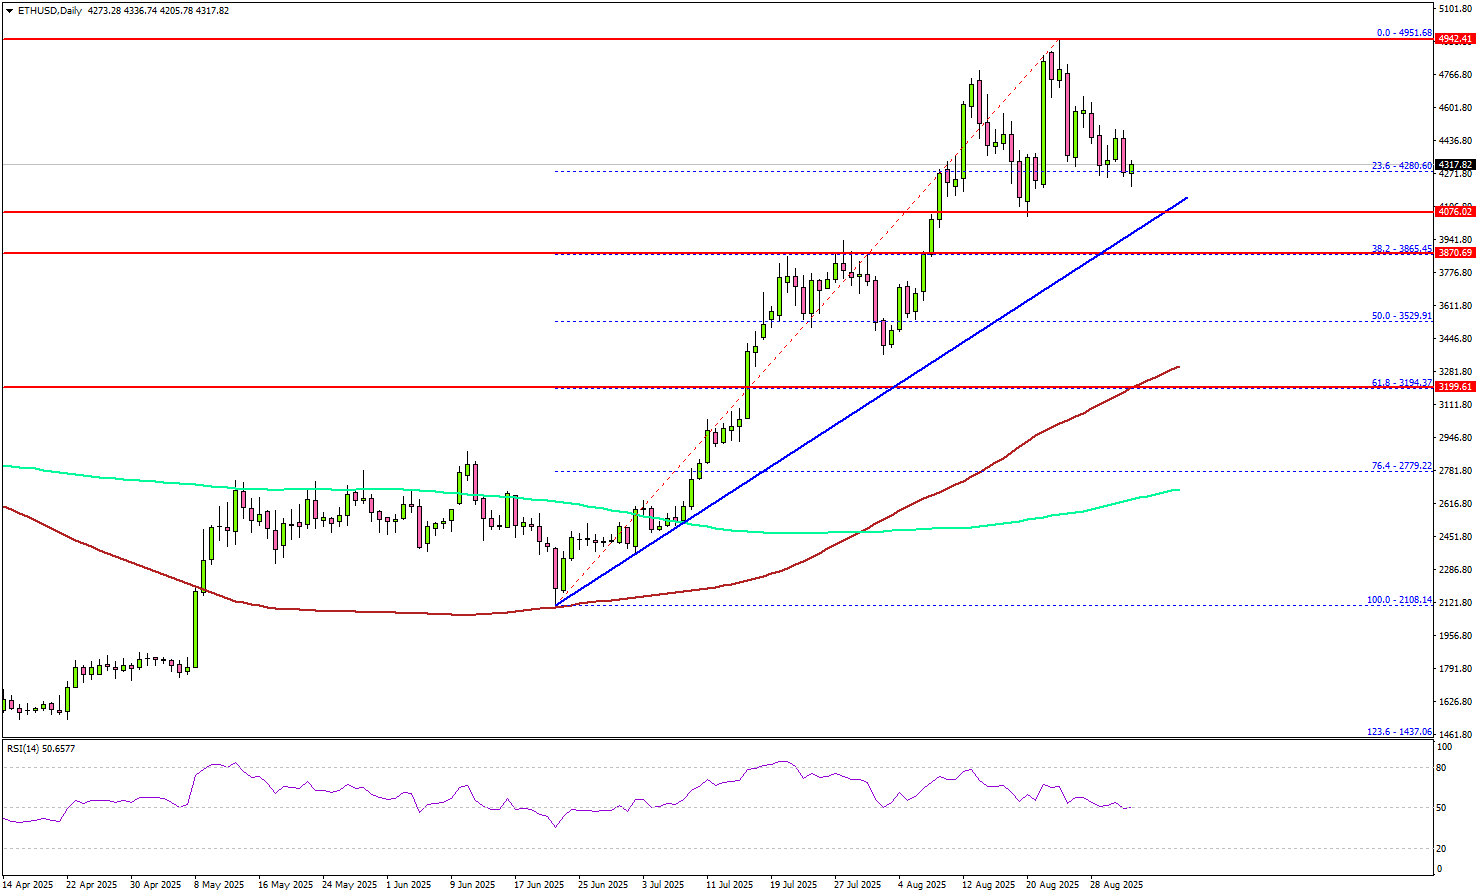
There is also a connecting bullish trend line with support at $4,020 on the same chart. The next major support is $3,865 or the 38.2% Fib retracement level, below which the price could slide toward $3,700.
Any more losses might call for a move toward the 100-day simple moving average (red) and the 61.8% Fib retracement level at $3,250. On the upside, the price is facing hurdles near the $4,500 level.
The next major resistance is near the $4,550 level. A daily close above the $4,550 resistance zone could start another steady increase. In the stated case, the price may perhaps rise toward the $4,800 level. The next stop for the bulls may perhaps be $5,000.
Looking at Bitcoin, there was a fresh decline, and the bears seem to be active below the $112,000 pivot level.
Economic Releases
- US ISM Manufacturing Index for Aug 2025 – Forecast 49.0, versus 48.0 previous.
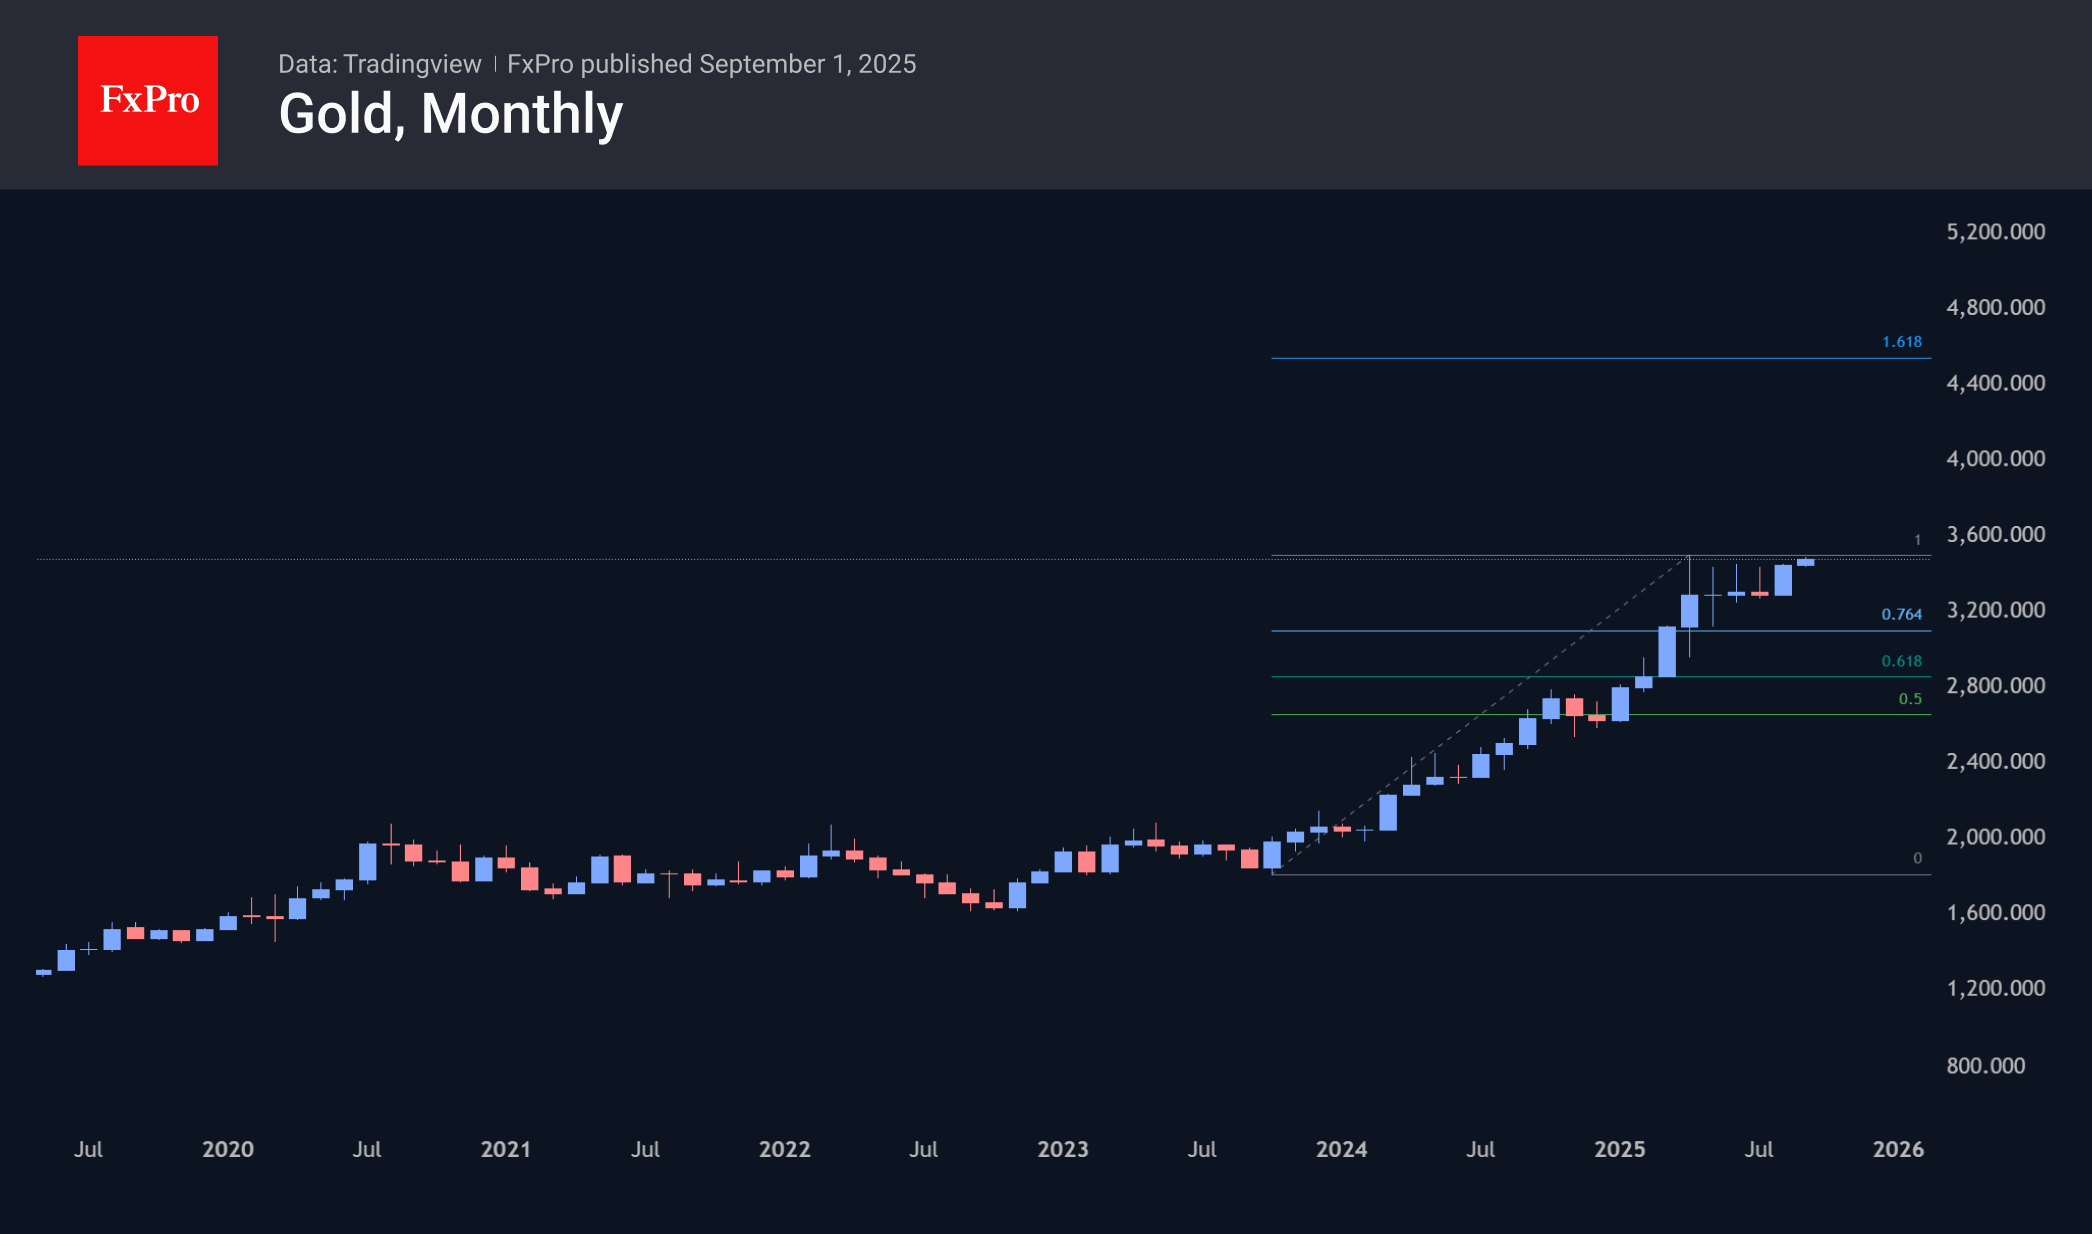
Gold may be targeting $4,500, silver $50
Precious metals have returned to active growth, pushing the spot price of gold to $3,490—just $10 below its historic high of 22 April. Meanwhile, silver has decisively moved above $40, its highest level in 14 years.
The news agenda continues to favour metals, with reports that India is now actively selling US government bonds, building up its gold reserves. China did the same before, and Russia even earlier. However, this may turn out to be nothing more than a glimpse into the past, cleverly picked up by the global media. It should also be remembered that years of net sales of gold reserves did not initially prevent gold from rallying. This could also work in the opposite direction: the actions of finance ministers and central banks may not have a very noticeable long-term effect.
The lack of progress on a peaceful settlement between Russia and Ukraine also helps gold. After months of virtually empty promises, hopes are gradually fading.
A more visible but at the same time short-term factor is the growing expectation of a Fed key rate cut in September from 75% on 21 August (before Powell’s speech) to 87% now. This leaves room for the rate to rise by another 10-13 percentage points, which is negative for the dollar and positive for commodities.
However, we recommend paying more attention to the technical picture now. The gold market has been in a prolonged sideways trend since reaching highs in April. At the same time, the bullish scenario is supported by sluggish resistance from bears in recent days and a series of higher local lows.
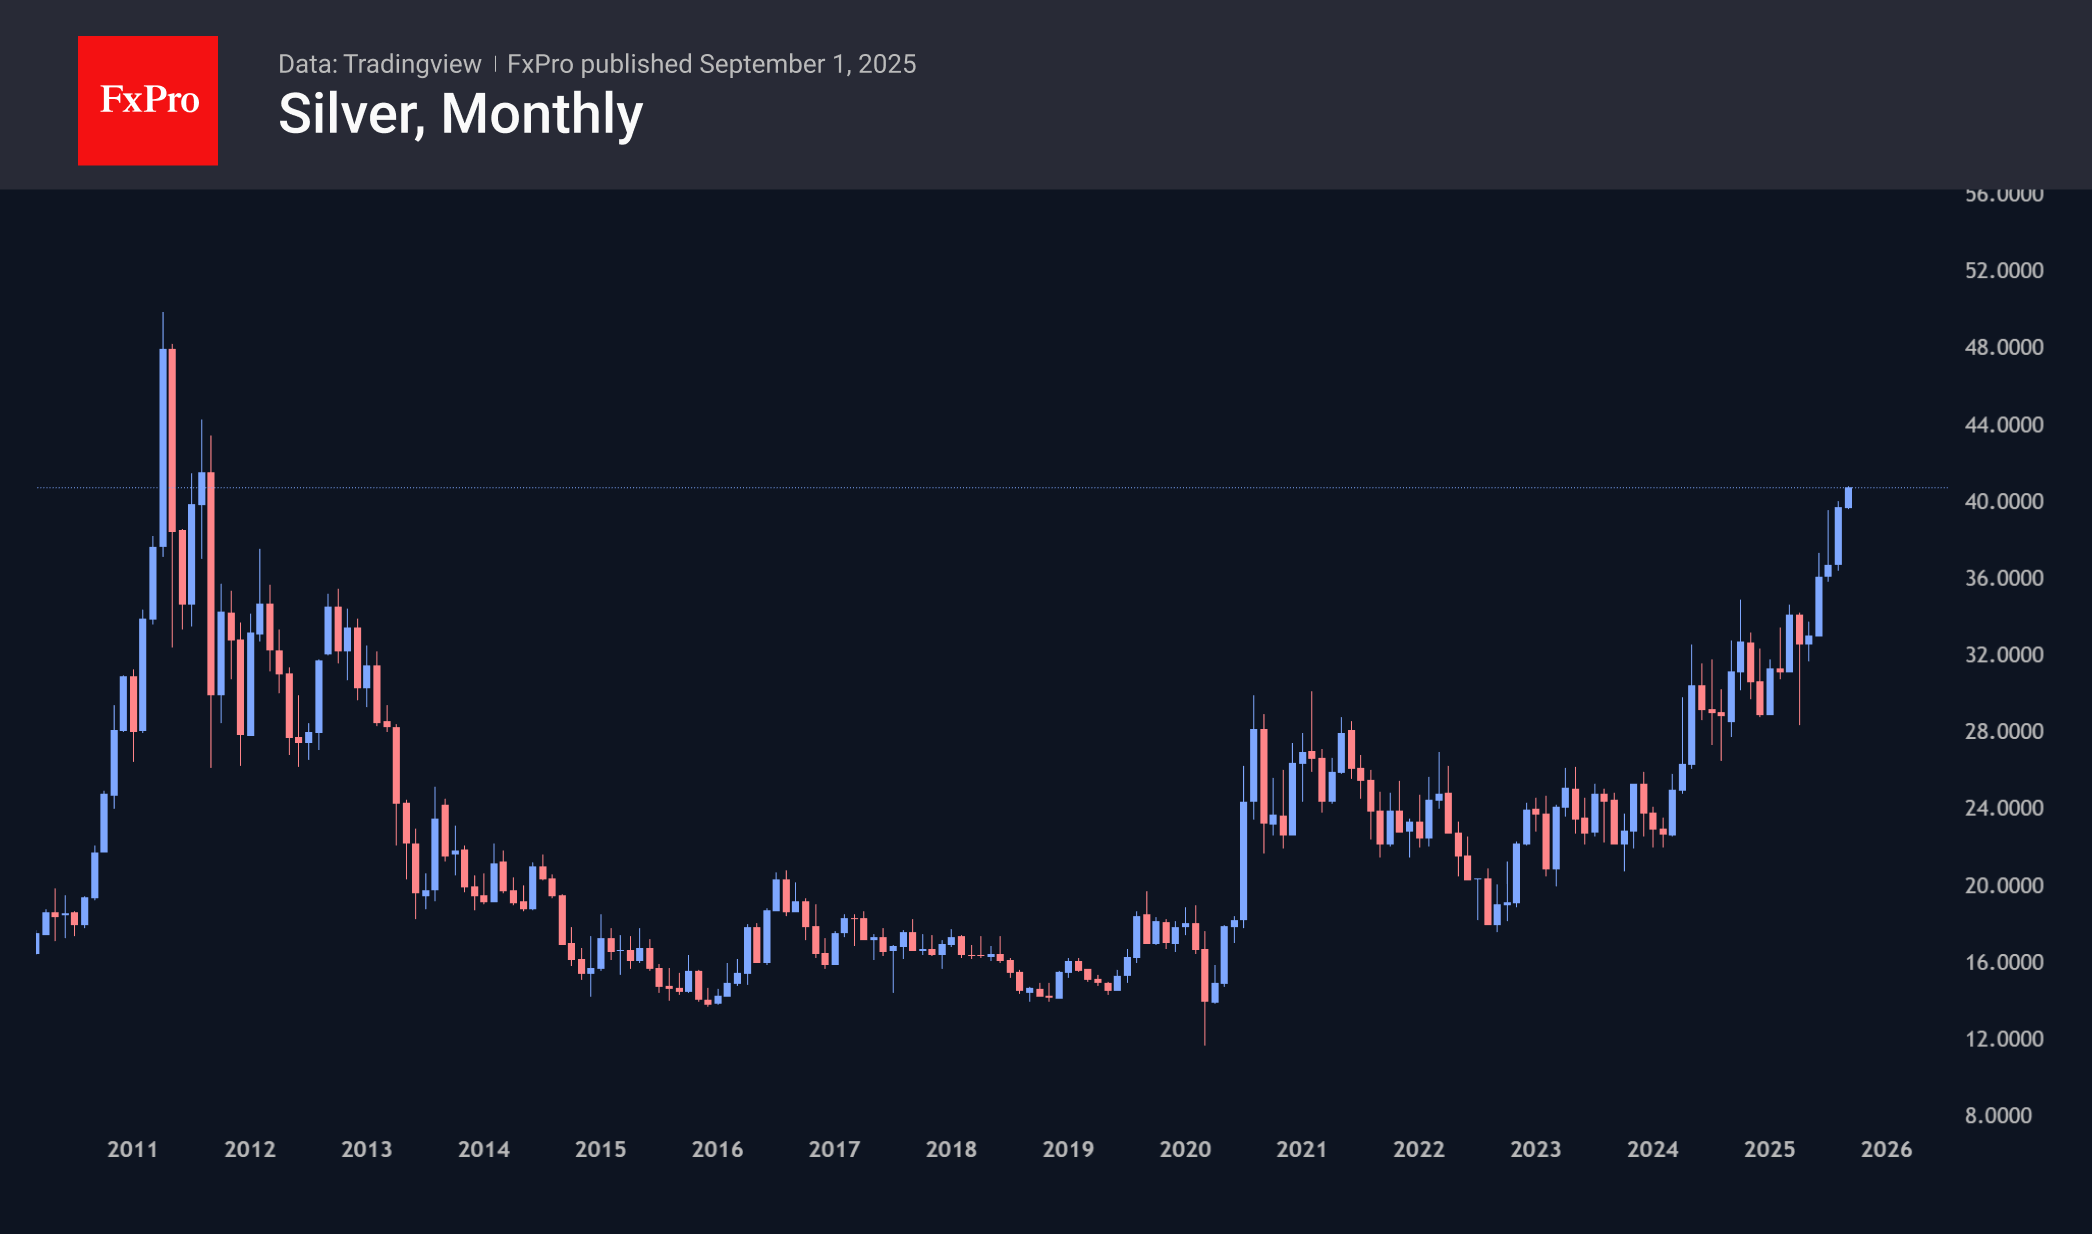
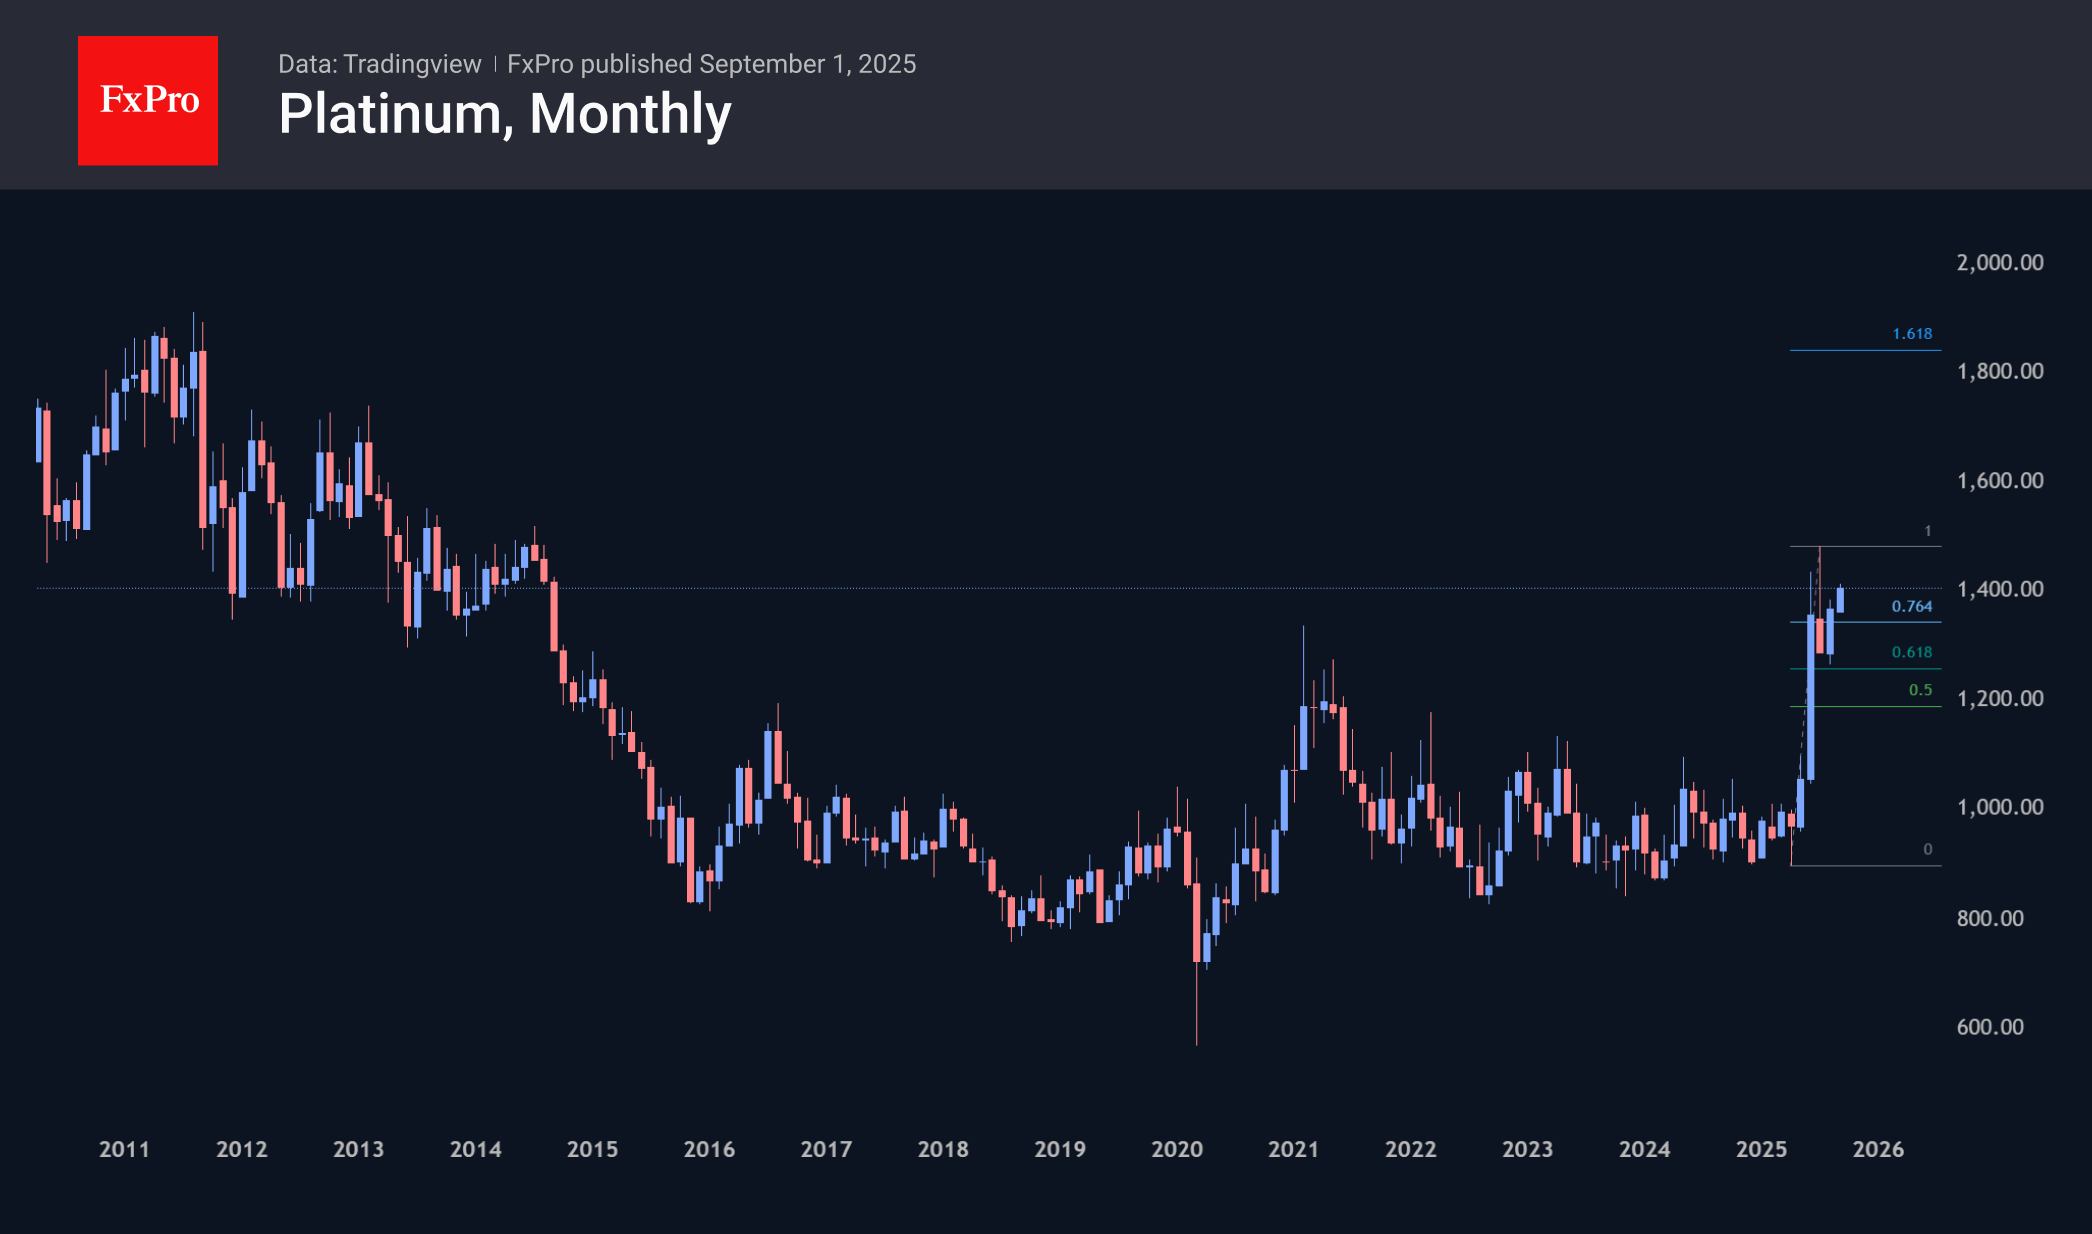
Silver has been under less pressure from local profit-taking, gaining in each of the last four months. Platinum and palladium seem to be ending their corrective decline, having risen sharply in early September. This behaviour of precious metals indicates that traders are serious about this direction, sharply increasing the chances of new historical highs soon.
Nevertheless, we urge caution when joining the gold rally in the coming days. First, reaching historic highs could trigger widespread selling in gold, as we saw in April and as is happening with Bitcoin.
If the breakout above $3,500 does not trigger a sell-off, as was the case earlier this year, the potential target is $4,500, close to which the 161.8% Fibonacci extension level is located.
In silver, it appears that the bulls are targeting the area of historical highs near $50.
Platinum also looks rested and ready to renew its multi-year highs after a corrective pullback. Its technical growth potential suggests a rise above $1,800, to the highs of 2011. However, such ambitious growth will only become the main scenario if the recent highs are exceeded and the price rises above $1,500.
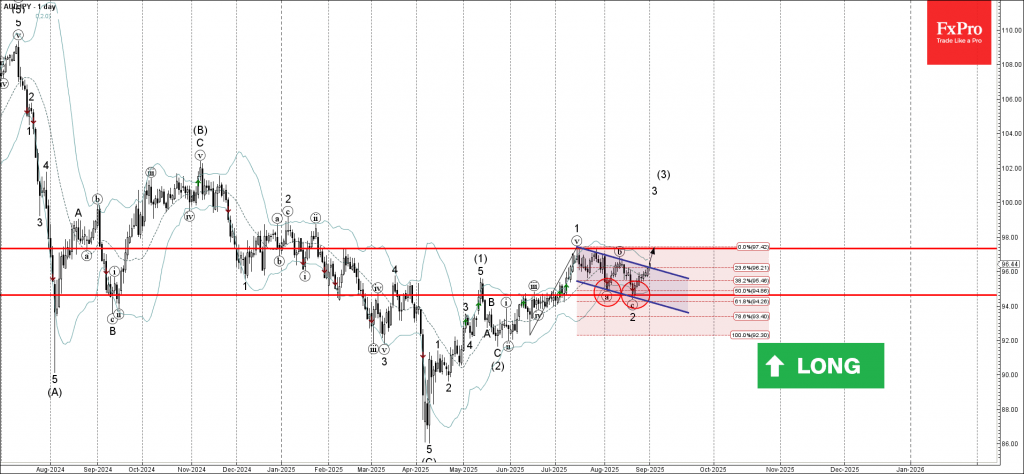
AUDJPY Wave Analysis
AUDJPY: ⬆️ Buy
- AUDJPY broke daily Down Channel
- Likely to rise to resistance level 97.30
AUDJPY currency pair today broke the resistance the resistance trendline of the daily Down Channel from the start of July (which encloses the previous ABC correction 2).
The breakout of this Down Channel continues the active short-term impulse wave 3 of the intermediate impulse wave (3) from May.
AUDJPY currency pair can be expected to rise to the next resistance level 97.30, which stopped the previous impulse wave 1 at the start of July.
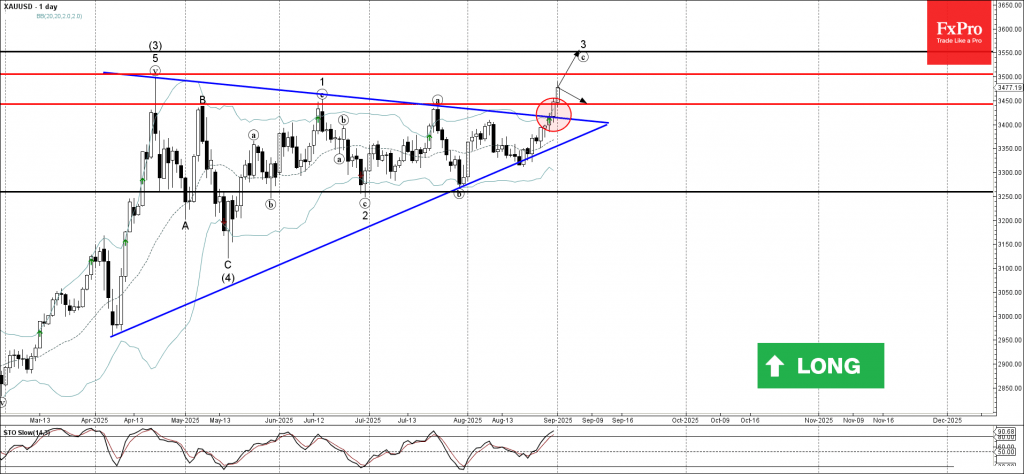
Gold Wave Analysis
Gold: ⬆️ Buy
- Gold broke resistance zone
- Likely to rise to resistance level 3500.00
Gold recently broke the resistance zone between the resistance level 3450.00 (which has been reversing the price from May, as can be seen from the daily Gold chart below) and the resistance trendline of the daily Triangle from April.
The breakout of the resistance level 3450.00 continues the active short-term impulse wave 3 of the intermediate impulse wave (5) from May.
Given the strong daily uptrend, Gold can be expected to rise to the next resistance level 3500.00 – the breakout of which can lead to further gains toward 3550.00, target price for the completion of the active impulse wave 3.
Australian Dollar Extends Gains, Hits Three-Week High
The Australian dollar is coming off a positive week and has extended its gains on Monday. In the North American session, AUD/USD is trading at 0.6556, up 0.27% on the day. Earlier, the Aussie rose as high as 0.6560, its highest level since August 11. With US markets closed for Labor Day, we're unlikely to see stronger movement from AUD/USD during the day.
China's weak manufacturing could hurt Australian dollar
China's manufacturing sector continues to contract and that could spell trouble for the Australian economy and the Aussie. China's manufacturing PMI for August inched higher to 49.4 from 49.3 in August. This missed the market forecast of 49.5 and marked the fight straight month of contraction in manufacturing.
The manufacturing industry has been dampened by weak global demand and US tariffs on Chinese products. The drop in manufacturing activity means there has been less demand for iron ore from Australia, which is used in the production of steel. This has resulted in a decline in iron ore prices, which has weighed on the Australian dollar and dampened Australia's export-reliant economy.
US PCE core inflation rises to 2.9%
The US core personal consumption expenditures price index (core PCE), the Federal Reserve's preferred inflation indicator, ticked higher to 2.9% in July, up from 2.8% in June. This matched the market estimate and was a five-month high. Monthly, core PCE rose 0.3%, unchanged from June and in line with the market estimate.
The slight rise in US core inflation has raised expectations of a rate cut at the Fed's September 17 meeting to 89%, up from 86% just before the core PCE release on Friday.
AUD/USD Technical
- AUD/USD is testing resistance at 06552. Above, there is resistance at 0.6563 and 0.6578
- 0.6537 and 0.6526 are providing support
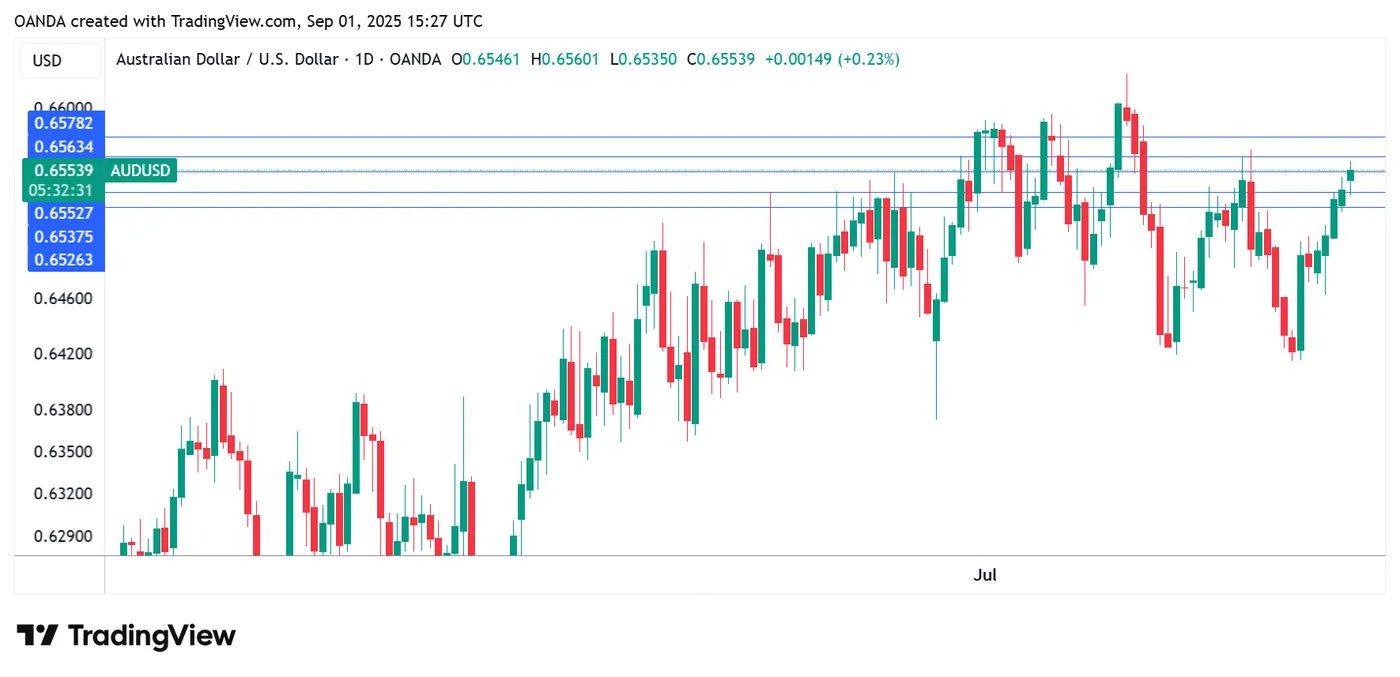
AUDUSD 1-Day Chart, September 1, 2025