
Sample Category Title
GBP/USD Bulls in Control as USD/CAD Faces Fresh Decline
GBP/USD started a fresh increase above 1.3500. USD/CAD declined and is now consolidating losses below 1.3800.
Important Takeaways for GBP/USD and USD/CAD Analysis Today
- The British Pound is eyeing more gains above 1.3500.
- There is a key bearish trend line forming with resistance at 1.3530 on the hourly chart of GBP/USD at FXOpen.
- USD/CAD started a fresh decline after it failed to stay above 1.3900.
- There is a connecting bearish trend line with resistance at 1.3755 on the hourly chart at FXOpen.
GBP/USD Technical Analysis
On the hourly chart of GBP/USD at FXOpen, the pair formed a base above the 1.3390 level. The British Pound started a steady increase above 1.3440 against the US Dollar, as discussed in the previous analysis.
The pair gained strength above 1.3465 and the 50-hour simple moving average. It even cleared the 1.3500 handle and tested 1.3530. It is now consolidating gains below 1.3530.
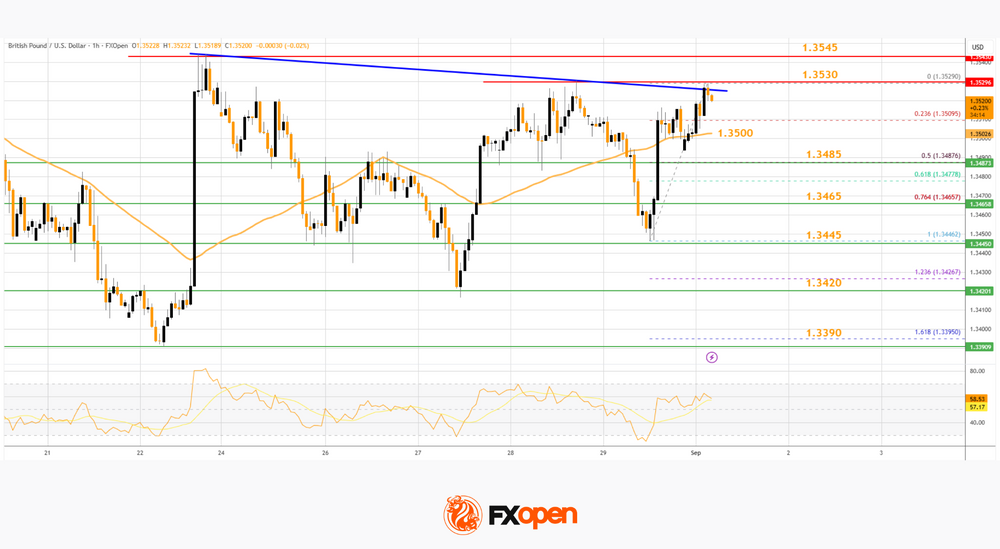
The pair is stable above the 23.6% Fib retracement level of the upward move from the 1.3446 swing low to the 1.3529 high. It seems like the bulls might aim for more gains. The RSI moved above the 50 level on the GBP/USD chart and the pair could soon aim for an upside break above a key bearish trend line at 1.3530.
An upside break above 1.3530 could send the pair toward 1.3545. Any more gains might open the doors for a test of 1.3620. If there is a downside correction, immediate support is near the 1.3500 level and the 50-hour simple moving average.
The first major support could be near the 50% Fib retracement at 1.3485. The next pivot level sits near 1.3445. If there is a break below 1.3445, the pair could extend the decline. In the stated case, it could drop and test 1.3420. Any more losses might call for a move toward 1.3390.
USD/CAD Technical Analysis
On the hourly chart of USD/CAD at FXOpen, the pair climbed toward 1.3900 before the bears appeared. It formed a swing high near 1.3867 and recently declined below 1.3800.
There was also a close below the 50-hour simple moving average and 1.3785. The bulls are now active near 1.3720. If there is an upside correction, the pair could face resistance near 1.3755 and a connecting bearish trend line.
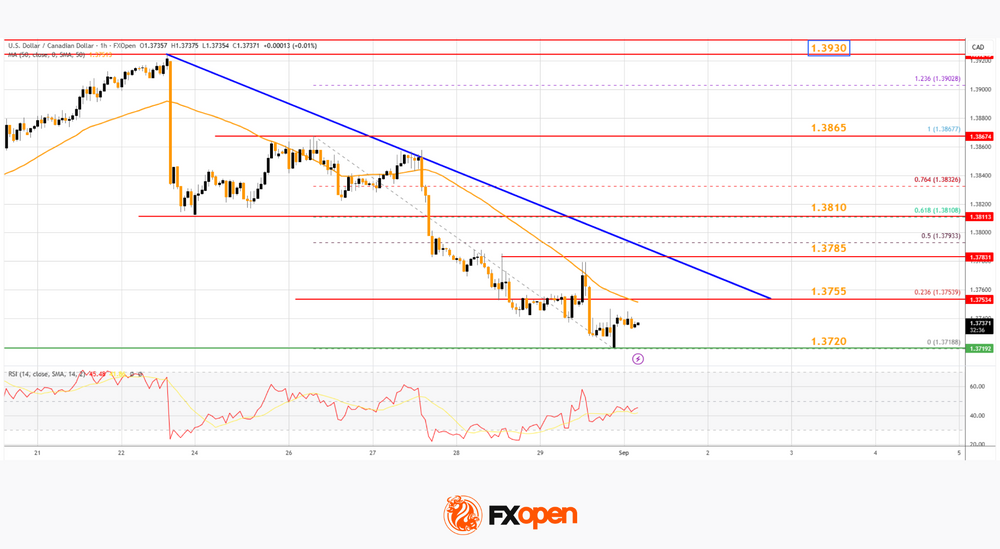
The trend line is near the 23.6% Fib retracement level of the downward move from the 1.3867 swing high to the 1.3718 low. If there is an upside break above the trend line, the pair could rise toward the 1.3785 pivot level.
The next key hurdle on the USD/CAD chart is near the 61.8% Fib retracement at 1.3810. If there is an upside break above 1.3810, the pair could rise toward 1.3865. The next major sell zone is 1.3930, above which it could rise steadily toward the 1.4000 handle.
Immediate support is near the 1.3720 level. The first major support could be 1.3700. A close below the 1.3700 level might trigger a strong decline. In the stated case, USD/CAD might test 1.3600. Any more losses may possibly open the doors for a drop toward 1.3500.
Trade over 50 forex markets 24 hours a day with FXOpen. Take advantage of low commissions, deep liquidity, and spreads from 0.0 pips. Open your FXOpen account now or learn more about trading forex with FXOpen.
This article represents the opinion of the Companies operating under the FXOpen brand only. It is not to be construed as an offer, solicitation, or recommendation with respect to products and services provided by the Companies operating under the FXOpen brand, nor is it to be considered financial advice.
USD/CAD Daily Outlook
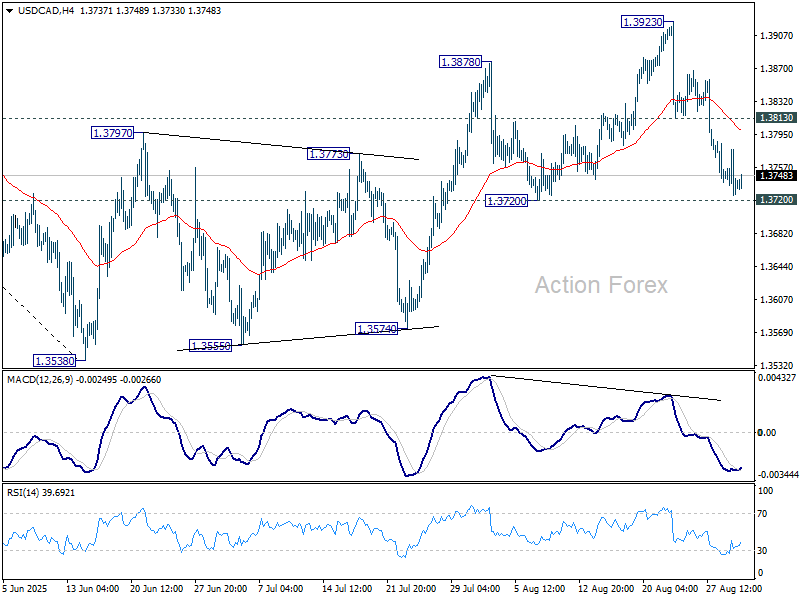
Daily Pivots: (S1) 1.3720; (P) 1.3750; (R1) 1.3772; More...
USD/CAD is still holding above 1.3720 support and intraday bias stays neutral. On the downside, decisive break of 1.3720 will argue that the corrective pattern from 1.3538 has already completed at 1.3923. Intraday bias will be back on the downside for 1.3574 support first. Break there will bring retest of 1.3538 low. On the upside, though, break of 1.3813 resistance will retail near term bullishness, and bring retest of 1.3923 high instead.
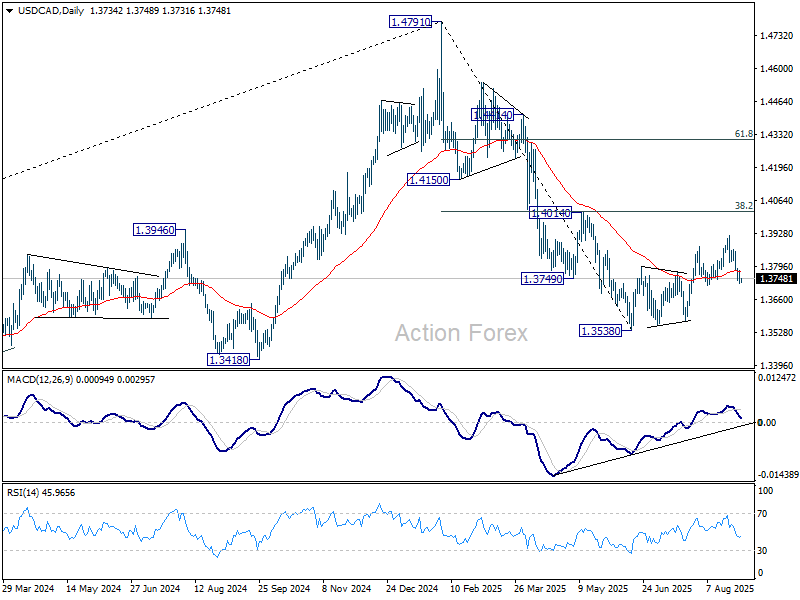
In the bigger picture, price actions from 1.4791 medium term top could either be a correction to rise from 1.2005 (2021 low), or trend reversal. In either case, further decline is expected as long as 1.4014 cluster resistance (38.2% retracement of 1.4791 to 1.3538 at 1.4017) holds. Next target is 61.8% retracement of 1.2005 (2021 low) to 1.4791 at 1.3069.
AUD/USD Daily Report
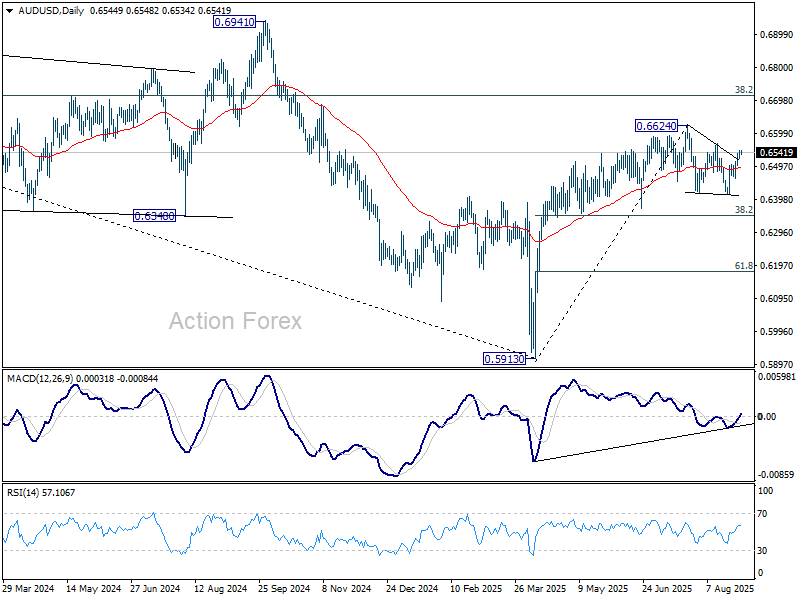
Daily Pivots: (S1) 0.6526; (P) 0.6537; (R1) 0.6552; More...
AUD/USD is staying below 0.6567 resistance and intraday bias remains neutral first. On the upside, firm break of 0.6567 should confirm that corrective pattern from 0.6624 has completed at 0.6413, and larger rally is ready to resume. Retest of 0.6624 high should be seen next. On the downside, though, break of 0.6461 will extend the corrective pattern with another fall, and target 0.6413 support, and possibly below.
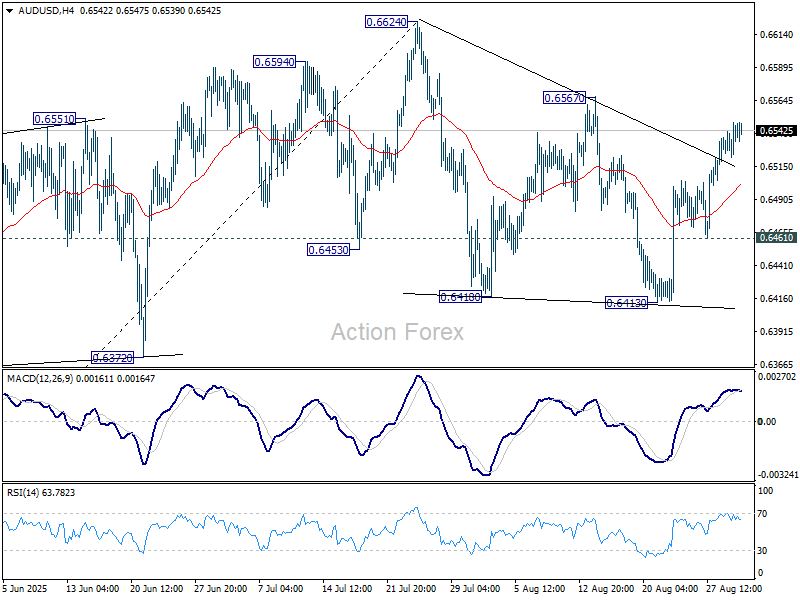
In the bigger picture, there is no clear sign that down trend from 0.8006 (2021 high) has completed. Rebound from 0.5913 is seen as a corrective move. While stronger rally cannot be ruled out, outlook will remain bearish as long as 38.2% retracement of 0.8006 to 0.5913 at 0.6713 holds. Nevertheless, considering bullish convergence condition in W MACD, even in case of another fall through 0.5913, downside should be contained above 0.5506 (2020 low).
USD/JPY Daily Outlook
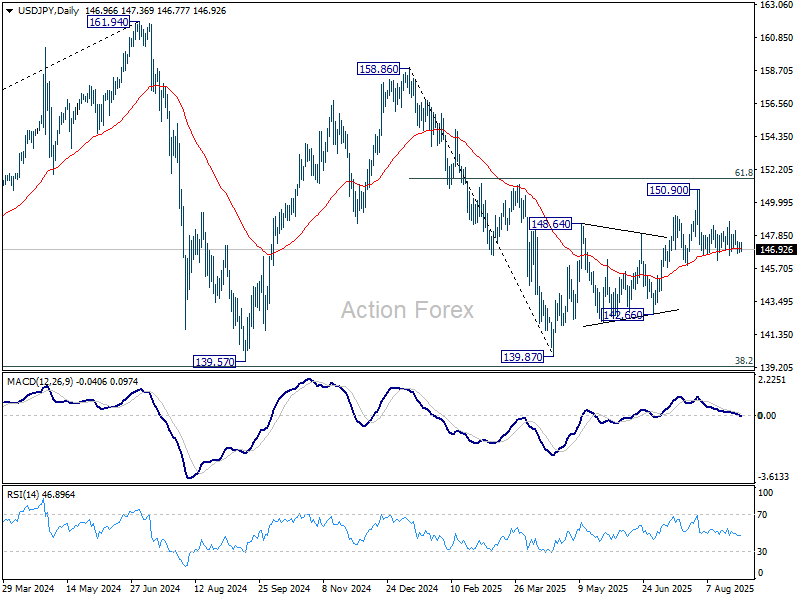
Daily Pivots: (S1) 146.74; (P) 147.08; (R1) 147.38; More...
Intraday bias in USD/JPY remains neutral for the moment. On the downside, firm break of 146.20 will resume the decline from 150.90. More importantly, that would also argue that rebound from 139.87 has completed as a corrective move to 150.90. Deeper fall should be seen to 142.66 support for confirmation. On the upside, above 148.76 will bring another rise to retest 150.90 instead.
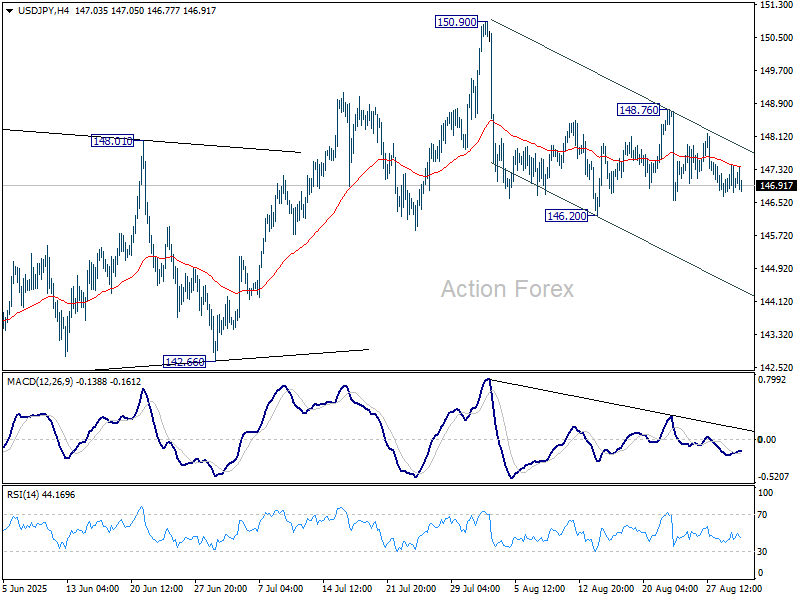
In the bigger picture, price actions from 161.94 (2024 high) are seen as a corrective pattern to rise from 102.58 (2021 low). Decisive break of 61.8% retracement of 158.86 to 139.87 at 151.22 will argue that it has already completed with three waves at 139.87. Larger up trend might then be ready to resume through 161.94 high. In case the corrective pattern extends with another fall, strong support is expected from 38.2% retracement of 102.58 to 161.94 at 139.26 to bring rebound.
USD/CHF Daily Outlook
Daily Pivots: (S1) 0.7983; (P) 0.8010; (R1) 0.8034; More….
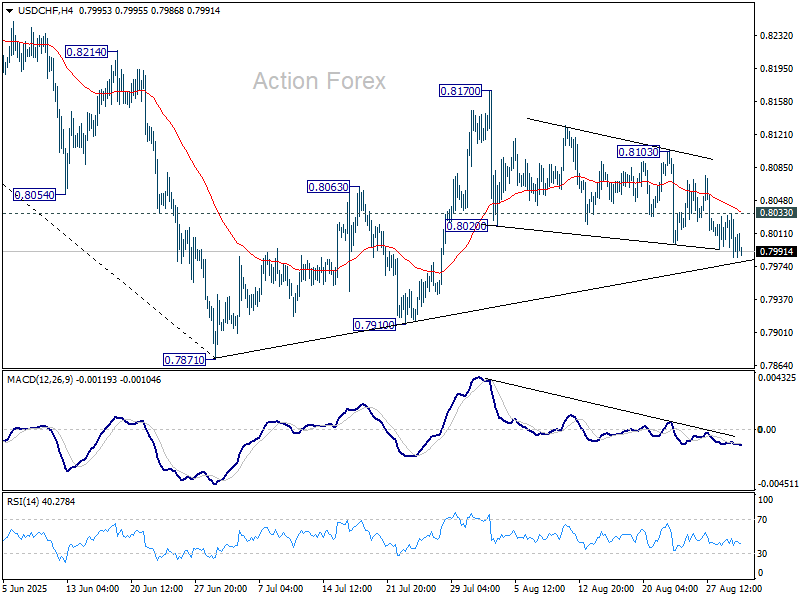
Intraday bias in USD/CHF remains mildly on the downside at this point. The current favored case is that corrective rebound from 0.7871 has completed at 0.8170. Deeper fall would be seen to 0.7910 support, and then retest 0.7871. Nevertheless, break of 0.8033 minor resistance will dampen this bearish view and turn intraday bias neutral again first.
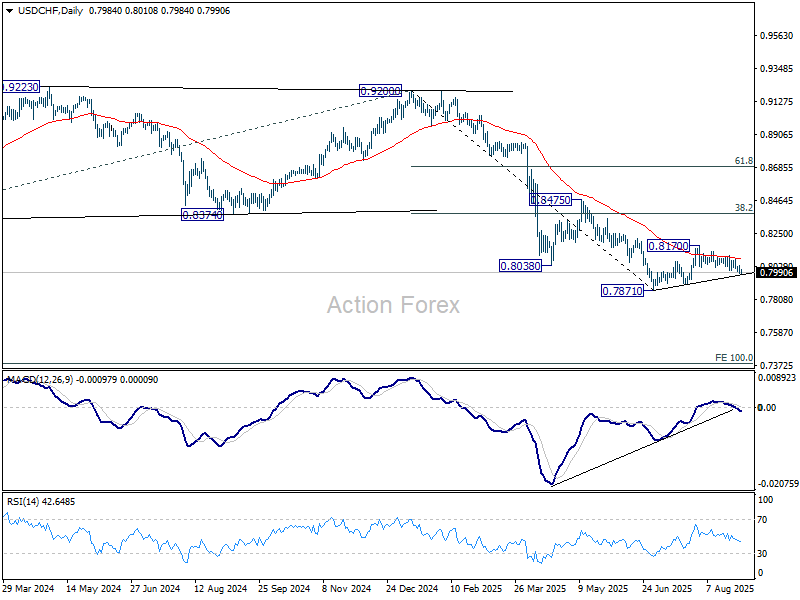
In the bigger picture, long term down trend from 1.0342 (2017 high) is still in progress. Next target is 100% projection of 1.0146 (2022 high) to 0.8332 from 0.9200 at 0.7382. In any case, outlook will stay bearish as long as 0.8475 resistance holds.
GBP/USD Daily Outlook
Daily Pivots: (S1) 1.3459; (P) 1.3490; (R1) 1.3534; More...
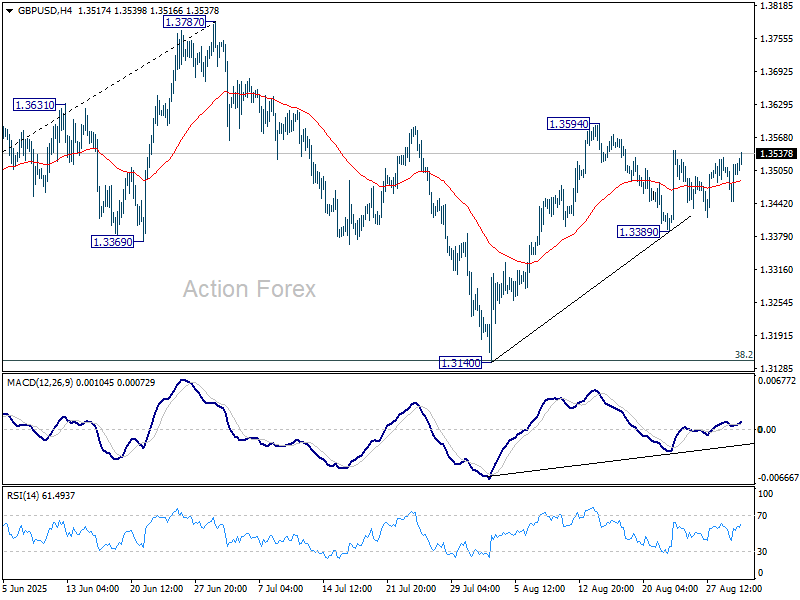
Intraday bias in GBP/USD stays neutral for the moment. With 1.3389 support intact, further rally is in favor. On the upside, above 1.3594 will resume the rebound from 1.3140 to retest 1.3787 high. On the downside, however, break of 1.3389 support will extend the corrective pattern from 1.3787 with another fall, and target 1.3140 support.
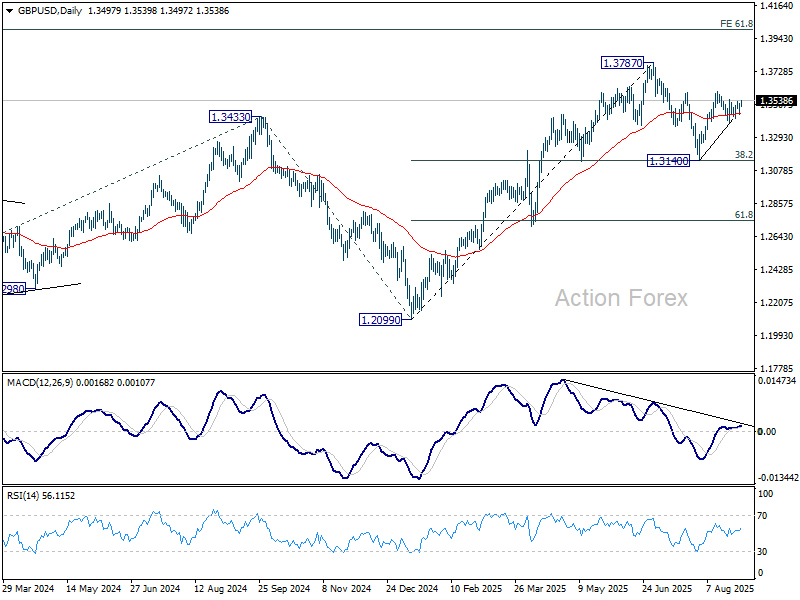
In the bigger picture, up trend from 1.3051 (2022 low) is in progress. Next medium term target is 61.8% projection of 1.0351 to 1.3433 from 1.2099 at 1.4004. Outlook will now stay bullish as long as 55 W EMA (now at 1.3104) holds, even in case of deep pullback.
EUR/USD Daily Outlook
Daily Pivots: (S1) 1.1655; (P) 1.1682; (R1) 1.1713; More...
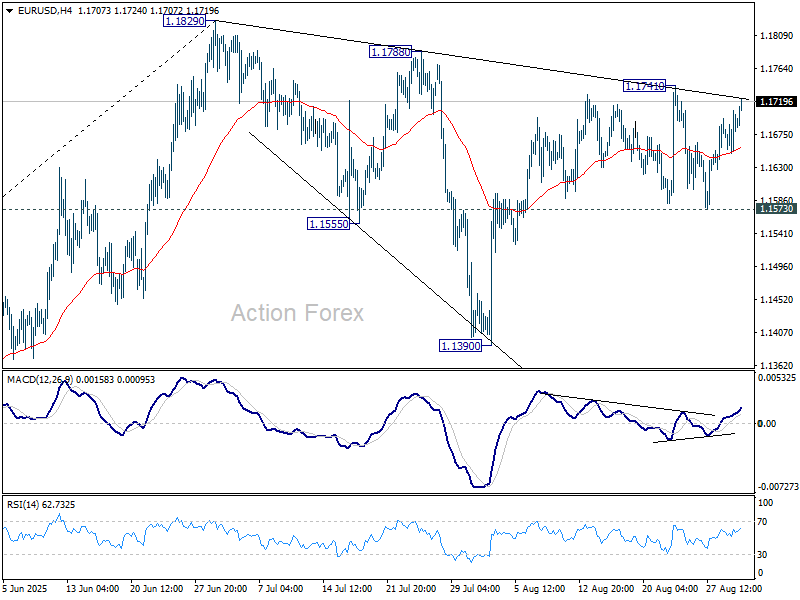
EUR/USD strengthens today but stays below 1.1741 resistance. Intraday bias remains neutral at this point. Overall outlook is unchanged that corrective fall from 1.1829 should have completed with three waves down to 1.1390. On the upside, above 1.1741 will bring retest of 1.1829 high first. Firm break there will resume larger up trend. However, sustained break of 1.1573 will dampen this view, and indicate that corrective pattern from 1.1829 is extending with another falling leg towards 1.1390 again.
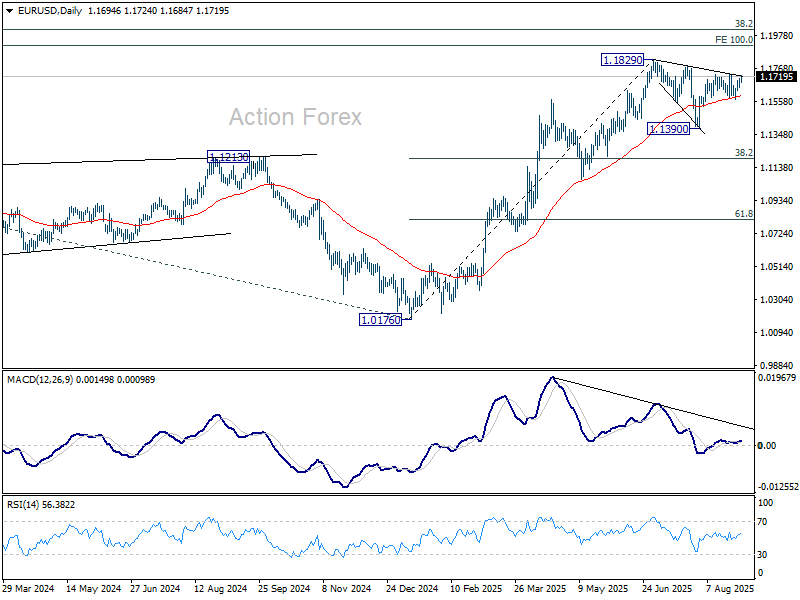
In the bigger picture, rise from 0.9534 (2022 low) long term bottom could be correcting the multi-decade downtrend or the start of a long term up trend. In either case, further rise should be seen to 100% projection of 0.9534 to 1.1274 from 1.0176 at 1.1916. This will remain the favored case as long as 1.1604 support holds.
Asian Markets Diverge, Dollar Weakens, Euro Rebounds Into Key Data-Heavy Week
Investor sentiment in Asia opened the week on a mixed note, with traders weighing better-than-expected Chinese manufacturing data against fresh signs of weakness in other export-driven economies. Hong Kong shares found support after the private RatingDog survey showed China’s manufacturing sector returning to mild expansion in August, offering some relief for a market battered by global trade uncertainty.
In contrast, Japanese equities tumbled sharply, setting the tone for a sluggish session across much of Asia. The divergence highlights the uneven impact of US President Donald Trump’s sweeping tariff regime, which continues to weigh on regional exporters. Despite China’s uptick, broader Asia remains under pressure from weaker global demand.
Manufacturing surveys released Monday highlighted the challenges. Japan’s S&P Global Manufacturing PMI rose modestly to 49.7 in August from 48.9 but remained below the 50 threshold for a second straight month. South Korea’s PMI printed at 48.3, an improvement from July’s 48.0 but marking the seventh consecutive month of decline. Taiwan also remained in contraction, reinforcing the strain on Asia’s export engines.
At the same time, investors digested a major legal development in Washington. A U.S. federal appeals court ruled that most of Trump’s reciprocal tariffs were illegal, arguing he had exceeded his presidential authority with the sweeping April 2 “liberation day” announcement. The decision injects new uncertainty into U.S. trade policy just as markets brace for additional volatility tied to economic data.
North American markets are closed for holiday today, but attention is already turning to a heavy week of global releases. The U.S. nonfarm payrolls on Friday will be crucial in shaping expectations for the Fed’s September rate cut, while Eurozone CPI, Swiss CPI, Canada’s jobs report, and Australia’s GDP all promise to keep volatility elevated.
In currencies, European majors are leading the way higher at the start of the week, with Euro the strongest performer followed by Sterling and Swiss Franc. Dollar is the laggard, with traders wary of holding long positions ahead of a data slate that could prompt faster Fed easing. Aussie and Loonie are also under pressure, while Kiwi and Yen are trading mid-pack.
In Asia, at the time of writing, Nikkei is down -1.36%. Hong Kong HSI is up 1.93%. China Shanghai SSE is up 0.32%. Singapore Strait Times is up 0.12%. Japan 10-year JGB yield is up 0.02 at 1.625.
Silver set to outpace Gold again once 40 barrier clears
Silver’s uptrend reignited last week, riding alongside Gold’s surge and now threatening to eclipse it in strength. The metal is pressing against 40 psychological level, its highest in over a decade, with markets sensing that Fed policy easing this month could provide an extra push. Historically, Silver often lags Gold at the start of a rally but outperforms once momentum builds, and the current advance could also fit that pattern.
That precedent is clear. During the 1970s bull market, Gold’s gain of roughly 2,200% was extraordinary, but silver’s surge of more than 3,000% was even more dramatic. In the 2008–2011 cycle, Gold advanced about 150% from trough to peak, while Silver exploded nearly 400%, touching almost 50. Even in the shorter 2020 rally, gold rose a solid 35% while silver soared 140%. The pattern is unmistakable: once the metals market gains conviction, Silver becomes the standout.

While Gold has provided the steady safe-haven anchor, while Silver’s dual role as monetary and industrial metal gives it more torque once investors commit to a full-fledged precious metals run. In this context, Silver looks positioned to extend higher even if Gold pauses for breath ahead. As long as the rally is not purely defensive, Silver stands to attract more speculative and retail flows, creating conditions for further outperformance. With a dovish Fed providing policy fuel, the next leg higher could confirm silver’s leadership role in this phase of the precious metals cycle.
Technically, Silver is now pressing against the rising channel resistance that has defined the uptrend from 17.54 (2022 low). Sustained break above that barrier, followed by decisive move through 100% projection of 21.92 to 34.84 from 28.28 at 41.20, would open the door to upside acceleration consistent with a fifth-wave extension.
That would set the stage for 138.2% projection at 46.13, or even further to 161.8% projection at 49.18, which is close to 50 psychological level.

For the near term, the bullish outlook remains intact as long as 36.93 support holds. Any dips are likely to be seen as opportunities within the trend rather than signs of exhaustion.

China RatingDog PMI manufacturing rises to 50.5, relief rally rather than turning point
China’s manufacturing sector showed a modest improvement in August, with the RatingDog Manufacturing PMI rising from 49.5 to 50.5, beating expectations of 49.9 and returning to expansion. However, RatingDog described the uptick as a “breath of relief rather than a sustained rally,” reflecting cautious optimism. By contrast, the official NBS survey offered a more subdued view, with manufacturing inching up from 49.3 to 49.4 and non-manufacturing steady at 50.3.
The RatingDog report highlighted firmer new orders, which pushed inventories of raw materials and finished goods higher. Export demand remains weak but showed slower contraction. Yao cautioned that external demand may have been pulled forward while domestic demand stays soft, limiting the scope for sustained output gains without stronger local consumption.
Meanwhile, input costs continued to climb under the “Anti-involution” policy backdrop, and those upstream pressures are now filtering into output prices, ending an eight-month streak of falling charges. With profit recovery still slow, the durability of the latest rebound depends on whether exports can stabilize further and domestic demand begins to catch up.
Dollar risks fresh slide on weak NFP; Eurozone CPI, Swiss data eyed
The coming week shifts the spotlight back to the US, where a heavy calendar of ISM surveys and the August nonfarm payrolls will determine the tone into the September Fed meeting. With markets already leaning heavily toward a cut, the data could decide whether expectations consolidate around a standard 25bps move or drift toward more aggressive scenarios.
July’s weak jobs report was the catalyst that pushed September bets over the line, especially after painful downward revisions for earlier months. That string of poor data persuaded investors that the Fed has little room to wait if it wants to avoid over-tightening into a slowing economy. Interim jitters aside, Fed Chair Jerome Powell’s dovish pivot at the Jackson Hole Symposium gave traders further confidence.
Still, Friday’s labor data could test those assumptions. A modest upside surprise might not be enough to dislodge expectations, but any meaningful undershoot would sharpen fears of a Fed misstep. Markets would quickly speculate whether the central bank needs to move faster. Talk of a 50bps move in September, floated by Treasury Secretary Scott Bessent, could regain attention in that scenario. Alternatively, investors could start to price a series of consecutive cuts in September, October, and December, producing a three-cut sequence to stabilize growth.
Any massive downside shock would also carry immediate market impact. Dollar selling would likely accelerate, particularly against higher-yielding or pro-cyclical currencies, as investors price in faster Fed accommodation. At the same time, equities and Gold could see a renewed bid on looser policy expectations.
Europe will also feature prominently with the release of Eurozone flash CPI. ECB minutes from July revealed that policymakers still see room for one more cut, but with “high option value” in waiting for September projections. That means the inflation print will be decisive—steady readings at 2% would leave the ECB free to act or pause depending on broader conditions.
Elsewhere, Swiss CPI will be closely watched as the economy struggles with the burden of sweeping 39% US tariffs. The SNB has so far resisted pressure to cut below zero, with Vice Chairman Antoine Martin stressing the absence of deflation risks and the high bar for reintroducing negative rates. The data will either affirm or challenge that cautious stance.
The week also brings key updates from Canada and Australia. Canada’s weak GDP report has markets leaning toward a September BoC cut, a view that could be solidified or reversed by this week’s jobs data. In Australia, a strong Q2 GDP reading alongside last week’s upside CPI surprise should keep the RBA on hold in September, with the Board likely to wait for Q3 inflation before deciding on a potential November move.
Here are some highlights for the week:
- Monday: China RaitingDog PMI manufacturing; Swiss retail sales; Eurozone PMI manufacturing final, unemployment rates; UK PMI manufacturing final.
- Tuesday: New Zealand terms of trade; Eurozone CPI flash; Canada PMI manufacturing; US PMI manufacturing final, ISM manufacturing.
- Wednesday: Australia GDP; China RatingDog PMI services; Eurozone PMI services final, PPMI; UK PMI services final; US factory orders, Fed's Beige Book report.
- Thursday: Australia goods trade balance; Swiss CPI, unemployment rate; UK PMI construction; Eurozone retail sales; Canada trade balance; US ADP employment, jobless claims, trade balance, PMI services final, ISM services.
- Friday: Japan labor cash earnings, household spending; Germany factory orders; UK retail sales; Swiss foreign currency reserves, SECO consumer climate; Eurozone GDP revision; Canada employment, US non-farm payrolls.
EUR/USD Daily Outlook
Daily Pivots: (S1) 1.1655; (P) 1.1682; (R1) 1.1713; More...
EUR/USD strengthens today but stays below 1.1741 resistance. Intraday bias remains neutral at this point. Overall outlook is unchanged that corrective fall from 1.1829 should have completed with three waves down to 1.1390. On the upside, above 1.1741 will bring retest of 1.1829 high first. Firm break there will resume larger up trend. However, sustained break of 1.1573 will dampen this view, and indicate that corrective pattern from 1.1829 is extending with another falling leg towards 1.1390 again.
In the bigger picture, rise from 0.9534 (2022 low) long term bottom could be correcting the multi-decade downtrend or the start of a long term up trend. In either case, further rise should be seen to 100% projection of 0.9534 to 1.1274 from 1.0176 at 1.1916. This will remain the favored case as long as 1.1604 support holds.
New Friendships
Chinese equities hit a fresh three-year high, while India’s Nifty 50 rebounded on Monday after President Xi Jinping and Prime Minister Narendra Modi attended a weekend summit in Shanghai alongside leaders from Russia, Iran and Turkey. The meeting focused on strengthening ties among emerging markets in the face of what participants described as aggressive US trade policies.
Trade tensions remain a key drag. Export-dependent economies are struggling with rising tariff barriers, and many companies are reporting production cutbacks and rising stockpiles. In Switzerland, sentiment has weakened sharply: the ZEW expectations index fell in August, while Q2 growth slowed more than anticipated. The SMI has underperformed European peers since April, with a strong franc adding to the headwinds. Some firms are reportedly considering relocating production within the EU to mitigate tariff pressures. Market participants are beginning to speculate whether negative rates could return to Switzerland.
In the US, a federal appeals court upheld earlier rulings that questioned the legality of the tariffs imposed on a wide range of countries. Legal debates aside, tariffs continue to weigh on global growth. The US dollar index started the week softer, with futures little changed in thin holiday trading. September is historically a weak month for equities, with an average return of -0.7%, but expectations of Federal Reserve (Fed) support remain a backstop.
The Fed’s preferred inflation gauge, core PCE, rose from 2.8% to 2.9% year-on-year in July, exactly in line with expectations. Headline PCE held steady at 2.6%. The lack of surprise limited market reaction, but the fact that the data was ‘too close to expectations’ sparked worries about its reliability and accuracy.
Attention now turns to Friday’s US jobs report — the first since leadership changes at the Bureau of Labor Statistics. Bloomberg consensus expects around 74K new nonfarm jobs in August and a slight uptick in unemployment. Revisions to prior months will be closely watched, too. With the labour market softening, investors see growing pressure on the Fed to cut rates, provided inflation remains contained.
For FX, ongoing uncertainty is weighing on the dollar, though positioning suggests the downside could be limited.
For equities, expectations of lower rates continue to support valuations, with dip-buying still evident despite trade and political risks.
In Europe, last week’s inflation data were mixed: French and Spanish CPI undershot forecasts, while German inflation came in stronger. The euro eased initially but has since rebounded above 1.17 against the dollar on broad USD weakness. Upside looks capped into 1.18, with political risks in France and uncertainty around next week’s government stability vote weighing on sentiment. The eurozone CPI print on Tuesday will be key for the European Central Bank (ECB), which is expected to remain on hold in September. The ECB rates are not too restrictive and not too supportive right now. The latter hints that the EURUSD is more likely to find direction with the US dollar and the French news, while the equities could bear the brunt of French political uncertainty in the short run.
Euro Area Labour Market Figures Kick Off Eventful Week
In focus today
In the euro area, attention shifts to August unemployment data. While the labour market has remained robust with low unemployment, employment growth has moderated lately. We expect the unemployment rate to remain unchanged at 6.2%. Additionally, the final manufacturing PMI is due today. With much of Europe on holiday in August, late responses not captured in the preliminary release could influence the final print. This is particularly important as the flash estimate surprised significantly on the upside.
This week offers plenty of key data, including euro area inflation on Tuesday, Sweden's flash inflation figures on Thursday, which will be closely watched and key to near-term Riksbank rate decisions. The week concludes with the US jobs report on Friday.
Economic and market news
What happened overnight and over the weekend
In China, PMIs for August released this morning and yesterday highlight ongoing economic softness. Official PMI manufacturing rose slightly to 49.4, while RatingDog PMI (formerly Caixin PMI) edged up to 50.3. While better than expected, weakness persists in construction and employment indices, underscoring the need for stronger stimulus targeting housing and consumption. The price indices were the main bright spot suggesting easing deflationary pressures as output price indices improved.
In the US, an appeals court ruled IEEPA tariffs illegal but allowed them to remain until 14 October, giving the Supreme Court time to intervene. The Trump administration has prepared a backup plan to replace IEEPA tariffs with broader sectoral tariffs, similar to Section 232 tariffs on steel and aluminium, though these would take longer to implement. While fewer tariffs would be positive for now, the prolonged uncertainty poses a downside risk.
What happened Friday
In the US, July's PCE figures aligned with expectations, with headline inflation at 2.6% y/y and core inflation rising to 2.9% y/y, marking the third consecutive monthly increase in core inflation and leaving the door open to a potential rate cut in September. Meanwhile, August's revised Michigan Consumer Sentiment index dropped to 58.2, indicating a modest decline in consumer confidence, as both current conditions and future expectations weakened, with a growing number of consumers viewing jobs as 'hard to get'.
In euro area, we received inflation figures for France, Germany and Spain ahead of the euro area inflation release this Tuesday. Both France and Spain reported lower-than-expected inflation. French HICP inflation fell to 0.8% y/y, below the expected 0.9%, driven by muted services inflation, while Spain's headline inflation remained steady at 2.7% y/y, below the anticipated rise to 2.8%, though core inflation edged up to 2.4% y/y. In contrast, German HICP inflation surprised to the upside at 2.1% y/y, driven by base effects in energy and goods as well as strong food prices. Overall, we expect euro area HICP inflation to come in at 2.0% y/y (cons: 2.1%).
In Sweden, GDP figures were revised upward as expected, slightly exceeding consensus at 0.5% q/q and 1.4% y/y. Consumption rose 0.4% y/y in Q2, signalling some recovery for households, while retail sales improved in July but remained below early-year levels. Backward revisions lowered GDP growth for both FY2025 and FY2024, yet Q2 recovery momentum was stronger than anticipated, presenting a mixed outcome for the Riksbank.
In Norway, the NAV unemployment rate remained steady at 2.1% (s.a.), aligning with Norges Bank's June MPR estimate and should in isolation support the case for a September rate cut. Meanwhile, Norwegian retail sales rose by 0.6% m/m in July, slightly below our expectations of a 1% lift signalled by leading indicators, following a largely flat performance in Q2.
Equities: Global risk sentiment deteriorated on Friday amid a sell-off in US yields, led by the long end, with the 30-year US Treasury yield rising by 4bp. The S&P 500 closed -0.6% on Friday, erasing earlier gains from the week and ending broadly unchanged for the week. Unsurprisingly, defensives outperformed cyclicals by 1pp on Friday. The sell-off in cyclicals was led by the tech sector, after a strong run last week, declining 1.6%. In Europe, the CAC 40 continues to underperform amid lingering political turmoil.
FI and FX: On a relatively muted day in the FX market terms of price action, SEK, NZD and AUD gained vis-à-vis GBP and JPY. EUR/USD ended the week close to the 1.17 level, EUR/SEK close to 11.05 and EUR/NOK around 11.75. The 10Y US Treasury yield finished the week at 4.23% - around the lowest in about two weeks. Both the 10Y US and German swap spreads ended the week at a tighter level.