Sample Category Title
North American Labour Market and International Trade Data in Spotlight Next Week
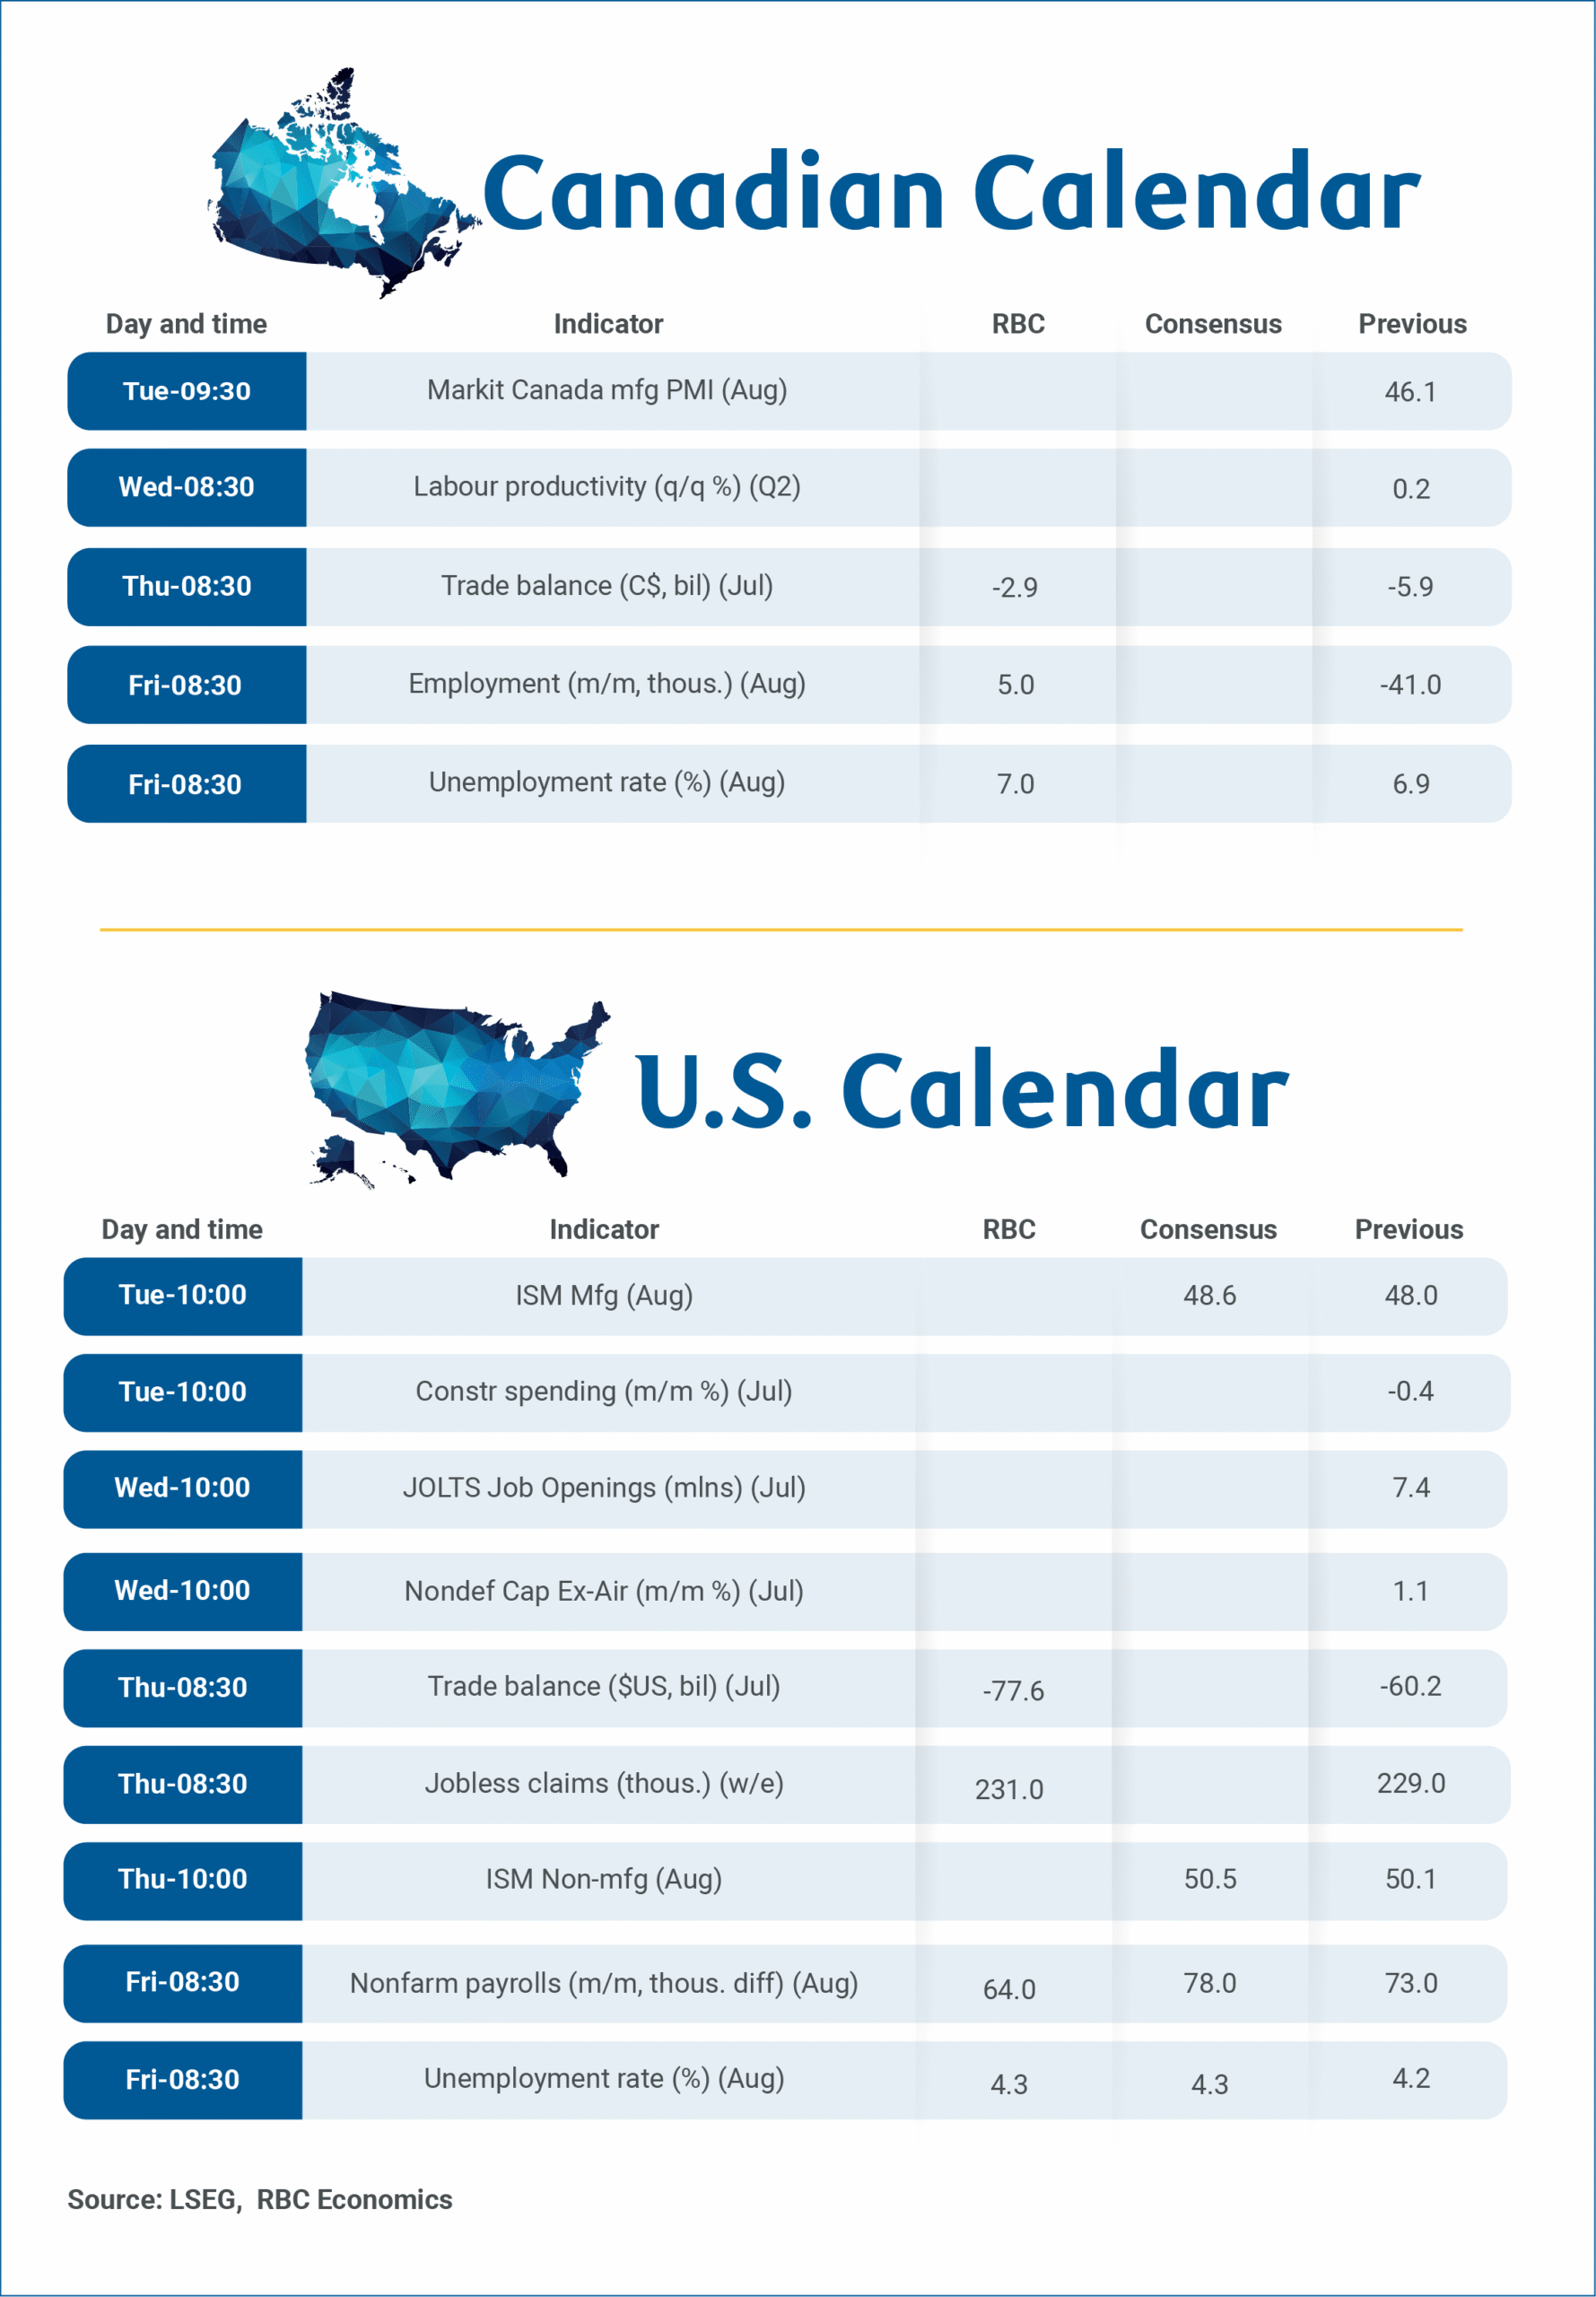
Next week’s labour market and international trade reports for Canada and the U.S. will again be watched closely for the impact that U.S. tariffs are having on economic activity.
A softer round of U.S. July jobs data, followed by subsequent comments from Federal Reserve Chair Powell that interest rate cuts could be warranted soon, have put a brighter than usual spotlight on the next round of U.S. labour market numbers. Our own expectation is for another softer payroll gain of 64k in August, and a tick higher in the unemployment rate to 4.3%.
Canadian job markets, on the other hand, have shown some signs of stabilizing in recent months with the unemployment rate ticking down to 6.9% in June and July from a 7.0% rate in May.
We don’t expect Canadian labour market weakness has fully run its course, and look for Canada’s unemployment rate to edge back up to 7% in August alongside minimal employment growth (+5k.) Lingering trade uncertainty still appears to be stalling hiring demand – early data on job postings from indeed.com has been edging lower into late summer – but conditions also haven’t softened enough to drive widespread layoffs.
Critically, the bulk (90%) of Canadian exports to the United States through June have remained tariff-free under an exemption for CUSMA compliant trade. Because of it, we look for Tuesday’s international trade data to show Canada maintained the lowest average effective tariff rate of major U.S. trade partners despite tariff revenues that continued to rise in July
Tariffs on the remaining 10% of Canadian exports to the U.S., concentrated in metal products, are still having a significant impact – manufacturing employment in Canada ticked higher in July but was still down nearly 40,000 from where it was at the beginning of this year.
But the bleed in the Canadian jobs market for now appears contained to the more trade-exposed sectors and has not been spreading – employment in service producing sectors was still up 146k from the end of last year in July, led by a 71k increase in wholesale and retail jobs.

Week ahead data watch:
The Canadian trade deficit likely narrowed in July from elevated levels in Q2, including a record large deficit in April as U.S. imports plunged after a surge to build inventories ahead of tariffs in Q1. Oil prices remained largely unchanged in July, after surging 10% in June. This stability is expected to have kept the energy trade balance steady during the month. A reported $2 billion import of a single large piece of machinery for Canada's offshore oil production sector in June is considered a one-off event, and imports are likely to decline as that effect unwinds.
International trade data from the U.S. Census Bureau, released at the same time as the Canadian trade data, will continue to be scrutinized for insights into the broader impact of U.S. tariffs on trading partners. Recent reports have indicated that most Canadian exports continue to access the U.S. market duty-free, thanks to exemptions for products that comply with USMCA rules of origin.
Week Ahead – All Eyes on NFP Report as Fed Rate Cut Bets Intensify
- US jobs data to steal the limelight amid worries about labour market health.
- ISM PMIs to be watched too for signs of tariff-driven price pressures.
- Eurozone flash CPI, Canadian jobs and Australian GDP data also on tap.
Will August jobs report shock again?
It’s almost one month ago that the July payrolls numbers generated not just considerable volatility in the markets but also a lot of controversy, as it offended President Trump’s record on the economy. Hence, the August report due Friday will be significant in two ways – will it point to a further deterioration in labour market conditions and will the data raise fresh questions about its accuracy following Trump’s dismissal of the head of the Bureau of Labor Statistics (BLS).
It's worth being reminded that the shock in the July report wasn’t so much the miss in the headline print (73k vs 110k expected) but the big downward revision to the May and June numbers, when the economy barely added new jobs.
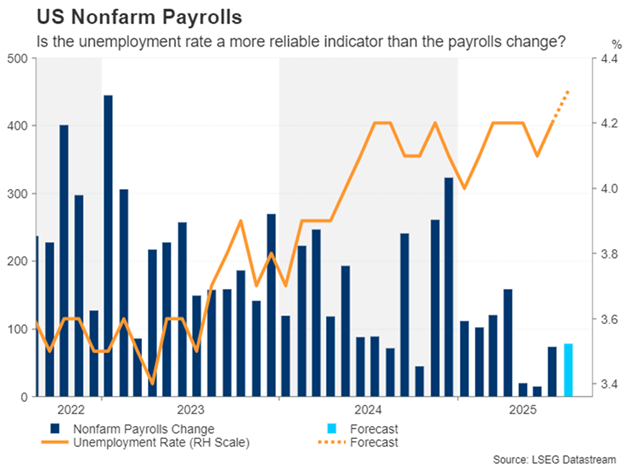
The no surprise in the unemployment rate was of some relief, particularly to the Fed, which has been branded “too little, too late” by Trump. But the unemployment rate is forecast to have edged up further in August, from 4.2% to 4.3%, while the increase in nonfarm payrolls is anticipated to have remained below 100k at 78k.
An ongoing softening in the labour market would not only solidify rate cut bets for September but also revive expectations of a third 25-basis-point reduction this year. In his Jackson Hole speech, Fed Chair Powell highlighted that the risks to inflation in the near term are tilted to the upside, and employment risks are tilted to the downside.
More importantly, Powell acknowledged that the balance of risks “appears to be shifting” towards the labour market. But he also pointed out that the supply of workers is slowing amid the Trump administration’s tough crackdown on migrants. This is likely contributing to the decline in new payrolls.
Thus, the unemployment rate might be a more reliable indicator of labour market strength in the current environment, and this is even before considering the recent doubts about the reliability of the payrolls survey, which Trump has claimed to be “rigged”. However, any changes to how the survey is conducted following Trump’s appointment of a new BLS commissioner will probably take some time. Another miss, therefore, could again attract some criticism from the President.
The Dollar’s surprise resilience
For the US dollar, its broader trajectory against a basket of currencies has remained unchanged despite the initial selloff post the July NFP. Unless the August numbers bolster expectations of a third cut this year, the dollar index will likely remain within its shallow uptrend.
This would especially be the case if the ISM manufacturing and services PMIs, out on Tuesday and Thursday, respectively, show that higher tariffs pushed the corresponding price indices further up.

Other US data to keep an eye on are factory orders and the JOLTS job openings on Wednesday, while the ADP employment report will see a delayed release on Thursday instead of Wednesday due to the Labor Day holiday on Monday. Meanwhile, any new tariff decisions by Trump could add to the volatility during the busy data week.
Canada hoping for US tariff reprieve
One such announcement could be about Canada. Unlike Mexico, Canada failed to win an extension on the 25% tariffs on the goods not covered by USMCA. Canada’s counter-tariffs on US imports were a major stumbling block in the negotiations and Trump hiked the levies to 35%.
However, Canadian Prime Minister Mark Carney has said the country will remove some of the retaliatory tariffs as of September 1 as a gesture of good will to the US government. Should a deal to lower Canada’s tariff rate follow in the days after, the Canadian dollar could enjoy a small rally.
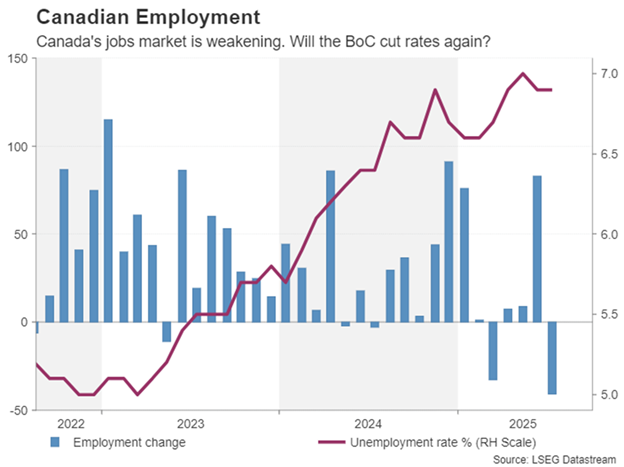
Friday’s employment report will also be important for the loonie as the economy appears to be going through a bit of a soft patch at the moment. The labour market shed almost 41k jobs in July. Another drop in employment in August could lead to investors bringing forward the expected timing of the next 25-bps rate cut, which is not fully priced in until December.
Eurozone CPI to likely confirm ECB pause
Inflation in the euro area has well and truly stabilized in recent months, holding around the European Central Bank’s 2% target for almost the past year now. The flash estimate for August is out on Tuesday and expectations are that the headline rate remained unchanged at 2.0% y/y. The core readings have steadied slightly above 2.0% and even the sticky services CPI has come down substantially this year.
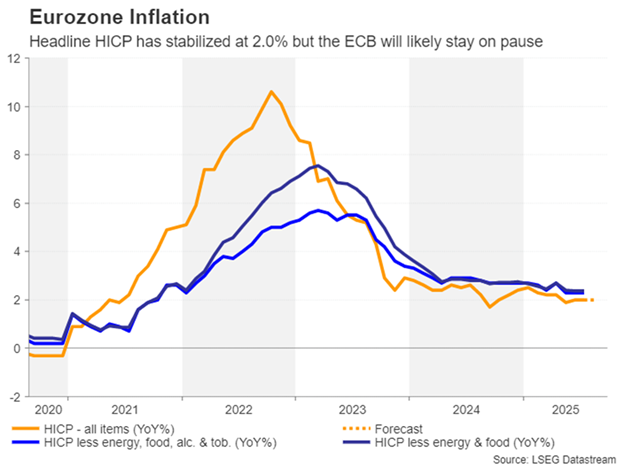
The one worry is wage growth, which unexpectedly jumped to 4.0% y/y in Q2. This isn’t entirely surprising, however, when considering that economic growth has been somewhat stronger than projected in spite of the trade war.
The outlook going forward, though, will probably be slightly more difficult to predict amid the uncertainty about how big an impact the higher US tariffs will have on European exports. But for the time being, the ECB is well placed to stay on pause for the foreseeable future, with the reaction in the euro to the inflation data likely being limited.
Also on the Eurozone agenda are producer prices on Wednesday, retail sales on Thursday, and quarterly employment and GDP figures on Friday. German industrial orders for July might also attract some attention on Friday.
Over in the UK, the delayed release of the July retail sales report on Friday will be the only highlight for sterling.
Aussie eyes GDP and Chinese PMIs
Moving to the Asia-Pacific region, Chinese manufacturing PMIs will be watched at the start of the week for clues about whether Trump’s tariffs are having a material impact on industrial output.
The official manufacturing gauge is due on Sunday and the S&P Global/Caixin equivalent will follow on Monday. Both PMIs printed slightly below 50 in July so a further worsening in activity in August could hit sentiment, including for the risk-sensitive Australian dollar.
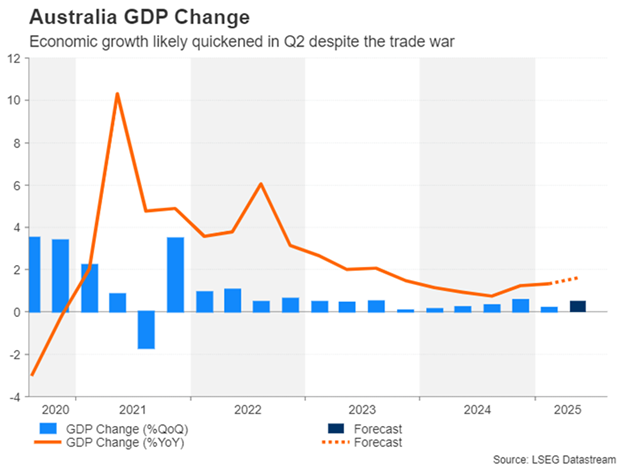
As for domestic data for the aussie, traders will be monitoring GDP growth figures on Wednesday. The Australian economy likely accelerated in Q2 after a weak Q1. However, following the sharp uptick in monthly CPI in July, the GDP readings may not have such a huge bearing on RBA rate cut odds, even if they disappoint.
In Japan, updated capital expenditure data on Monday will be an indication as to whether the Q2 GDP estimate will be revised higher or lower. Household spending and earnings numbers will follow on Friday. With investors gradually upping their expectations for a year-end rate hike by the Bank of Japan, there could be a further boost if pay growth quickened in July.
Weekly Focus – US Markets Shrug Off Attack on Fed Independence
Powell's relatively dovish stance at Jackson Hole a week ago has lingered in markets and rippled through to particularly US equity markets this week. The US outperformed European equities throughout the week, particularly due to a selloff in French banks on the back of an imminent government collapse in France. US treasury yields and Bund yields traded lower while French and peripheral bond spreads widened as French PM Bayrou is phasing a no-confidence vote, once again drawing attention to the French troubles passing sufficient public savings.
President Trump's attempt to fire Fed Governor Cook on the basis of mortgage fraud created some short-term US headwinds in both bond and FX markets but corrected as markets are likely anticipating that Cook can win her legal challenge and be reinstated. The Fed has stated that Cook's status remains unchanged unless a court rules otherwise before the 16-17 September FOMC meeting.
On the data front, the US Conference Board's consumer survey contained some worrying information for the Fed, with inflation expectations picking up again in August, mirroring a similar shift in the Michigan survey. Consumer sentiment declined modestly, and a rising number of consumers perceive jobs as 'hard to get'.
In Europe, IFO data confirmed the stagnation reality in Europe's biggest economy as the current assessment index declined slightly. The expectations index on the other hand increased to its highest level in 3½ years not least on the back of a relatively bright outlook in manufacturing, adding to last week's more upbeat German PMIs. French and Spanish inflation was a bit lower than expected in August, while German inflation was a bit higher. Largely, it points towards unchanged headline inflation in the euro area at the 2.0% target. Euro area bank lending came to a two-year high in July, indicating looser monetary policy is feeding through, and supporting our expectation that the ECB is done cutting rates for now.
We kick off next week with PMIs from China, the official measure already on Sunday. The manufacturing sector disappointed in July and we look for a small comeback. We have a ton of interesting US data coming up, including ISM. Three US labour market reports will be the main attractions, though, and given all the fuzz about the BLS, the ADP report will probably gather some extra attention. For the NFP-report, we expect 80k new jobs, unchanged unemployment rate at 4.2% and average hourly earnings growth of 0.3%. We will also look out for July wage data from Japan, where stronger wage growth is a prerequisite for further rate hikes from the Bank of Japan. July retail sales came in surprisingly weak this week, as particularly food inflation continues to weigh heavy on consumers' purchasing power. On our own continent, we will zoom in on the August inflation data for the entire euro area. We also get unemployment data.
Sunset Market Commentary
Markets
The Fed’s preferred inflation measure (PCE deflator) showed no surprises in July. The headline index increased by 0.2% M/M and stabilized at 2.6% Y/Y. The core PCE deflator rose by 0.3% M/M with the annual number printing at 2.9% from 2.8%. Core PCE deflation is sticky between 2.6% Y/Y and 3% Y/Y since December 2023. Just like in the July CPI inflation report, services inflation (0.4% M/M) added most weight to deflators with goods’ costs – closely watched for tariff-related inflation – even declining. Today’s deflators vindicate Fed chair Powell’s dovish pivot at Jackson Hole with risks of a permanent increase in price levels decreasing as time passes by. If any, US Treasuries trade a tad softer after the release, which was accompanied by strong – but in line with consensus – personal spending data (+0.5% M/M), pointing at resilient demand in the US economy. The US yield curve bear steepens with yields rising by up to 3 bps at the very long end of the curve. US investors enjoy a long weekend now with markets closed on Monday for Labor Day Holiday. Afterwards, activity (traded volumes) traditionally pick-up, leaving scope for further (dovish) repositioning if data warrant so. With manufacturing ISM on Tuesday, JOLTS jobs report on Wednesday, ADP employment change and services ISM on Thursday and payrolls on Friday there are plenty of possible drivers. With the Fed steering towards a gradual, 25 bps, rate cut in September, anything that comes close to a deteriorating US labour market could be a trigger to repositioning for three instead of two Fed rate cuts this year. The legal battle between US President Trump and Fed governor Cook remains a wildcard.
National European inflation numbers left no trace on trading neither. A small upward surprise in Germany was compensated for by lower than expected Italian and Spanish numbers. Tuesday’s EMU outcome will thus be very close to the current consensus (0.1% M/M and 2% Y/Y for headline; 2.2% Y/Y for core) and implies that current ECB policy is in a good place. EMU money market still add a 1/3 possibility to an additional ECB rate cut before year-end, but that’s not our base scenario. Consumer inflation expectations stayed unchanged for the year-ahead at 2.6% in July, but ticked up from 2.4% to 2.5% on a 3-yr horizon. The EMU eco agenda is very light next week apart from the inflation number. German yields gain up to 1.7 bps (10-yr) today. EUR/USD is stuck within an extremely tight range today (1.1650-1.1690).
News & Views
The Indian rupee plunged to a record low against the US dollar. While Q2 GDP numbers today printed a better than expected 7.8% y/y, forward-looking investors fear the economic impact of president Trump’s international trade policy on future growth. USD/INR pierced through the 88 barrier following the US administration’s decision to double the 25% import levy to 50%, penalizing India for its purchases of Russian oil. The tariffs would have the biggest impact on India’s labor-intensive industries such as textiles and jewelry, putting a lot of jobs at risk. The 50% tariff also puts the country at the disadvantage compared to US-exporting peers such as Japan (15%), Vietnam (20%) or China (30%). Indeed, the rupee today also tanked to a historical low against the Chinese yuan.
Polish inflation in August eased a tad more than anticipated. Prices dropped 0.1% on a monthly basis, lowering the yearly outcome to 2.8% from 3.1%. It’s the slowest pace since June 2024 and is considered to be low enough for the central bank to reduce the policy rate again to 4.75% from 5% at next week’s meeting. Details are lacking with the statistical office in Poland’s statement only revealing that the m/m drop mainly came on the account of fuels for personal transport equipment (-1.9% m/m). Food and non-alcoholic beverages eased 0.1% while prices for electricity, gas and other fuel rose by 0.1%. KBC Economics’ estimate for core inflation (to be officially released September 16) stands at 3.4% y/y. Today’s numbers had little impact on the Polish zloty. EUR/PLN is moving directionless within a symmetrical triangle since mid-April and is currently trading around 4.266.
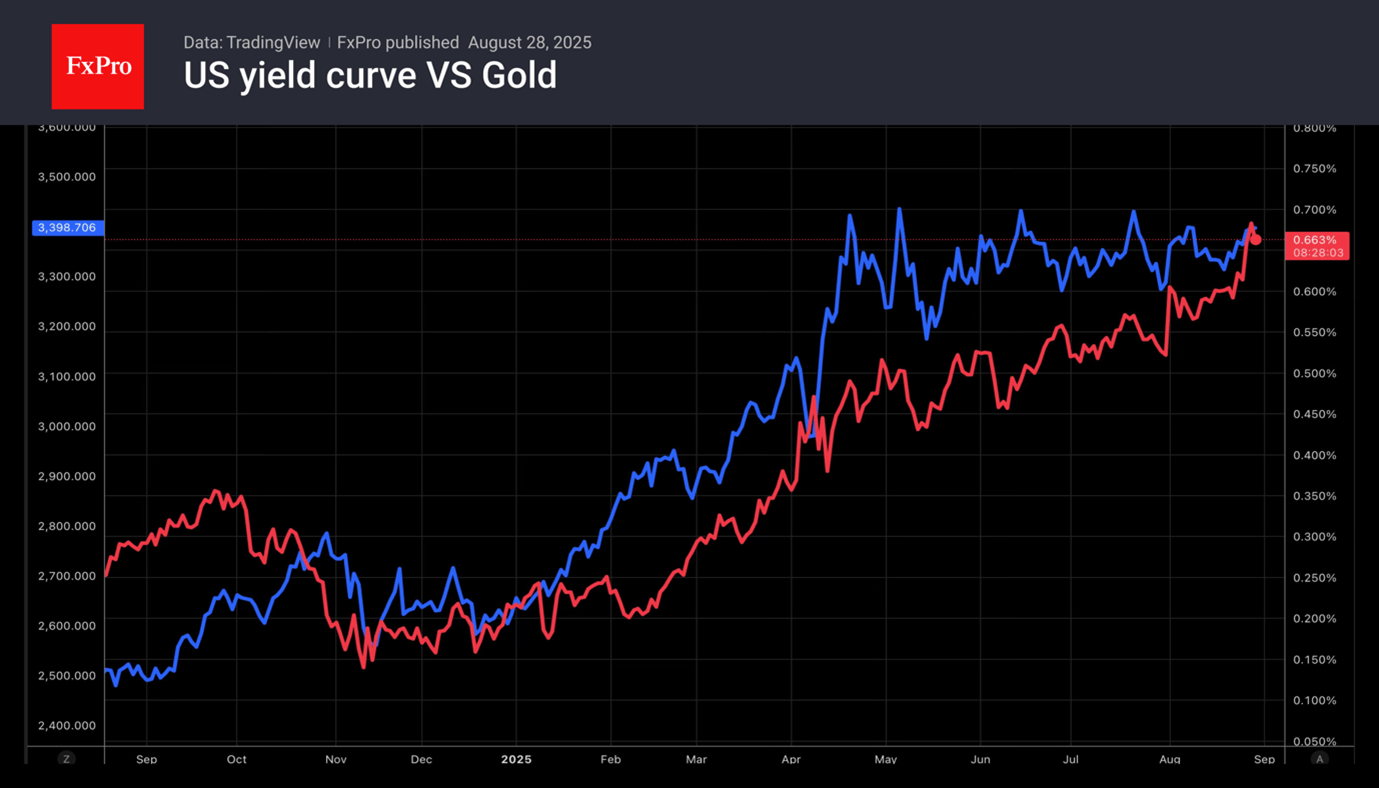
Gold Approached Upper Limit of the 4-Month Trading Range
Gold is trading above $3,400 again at the end of the week. The upper limit of the trading range, within which the price has been fluctuating since April, is close to $3,430. Jerome Powell’s signals about a rate cut, unprecedented pressure from the White House on the Fed, and the continuing high level of geopolitical risks have brought the price back to this level. Washington’s introduction of 50% tariffs against India risks further deepening the divide between the West and the East, as well as the associated processes of de-dollarisation and diversification of gold and foreign exchange reserves by central banks in favour of precious metals.
For the first time since 1996, central banks hold more gold (about 25%) than US government bonds (about 20%) in their gold and foreign exchange reserves. For comparison, between 2008 and 2015, this ratio fluctuated between 10% and 30%, respectively.
Gold bulls are drawing strength from the dynamics of the US yield curve. Yields on 2- and 10-year Treasuries are falling. The market is painting a stagflationary backdrop, which is the best food for gold bugs.
Gold’s ability to break through the resistance zone above $3,430 will be an important signal of the market’s readiness to return to a rally after four months of tug-of-war. But it is worth being cautious with early bullish bets at these levels. Formally, there is now a greater chance of another pullback to the lower end of the range at $3,300-3,315.
At the same time, investors should remember that whichever way the breakout occurs, the subsequent movement could be very strong, given how long the gold market has been gathering strength while remaining in a sideways trend.
US Core PCE Came as Expected, While Canadian GDP Lags Again
Markets just received the report for the much-anticipated Core PCE, which came exactly as expected – The month-over-month Core release came at 0.3 % vs 0.3% expectations.
All data components are once again exactly as expected, Core PCE is calculated from already released data, so not surprising to get accurate expectations.
This brings the y/y total to 2.6% for the headline and 2.9% for the Core.
Canada released their own GDP data which came at -0.1%, a miss on the already weak 0.1% m/m expectations.
Annualized, the Canadian GDP is at -1.6%!
Canada is still awaiting for a proper relaunch of their slowing economy, and the Loonie that was strenghtening these past few days is giving up some of this strength. Canadian PM Carney and US President Trump are however getting back to better ground.
Let's see how it plays out for the two North-American neighbors.
Spot live reactions to the Dollar Index and USDCAD just below
Dollar Index 30m Chart – Rising but the report didn't change much
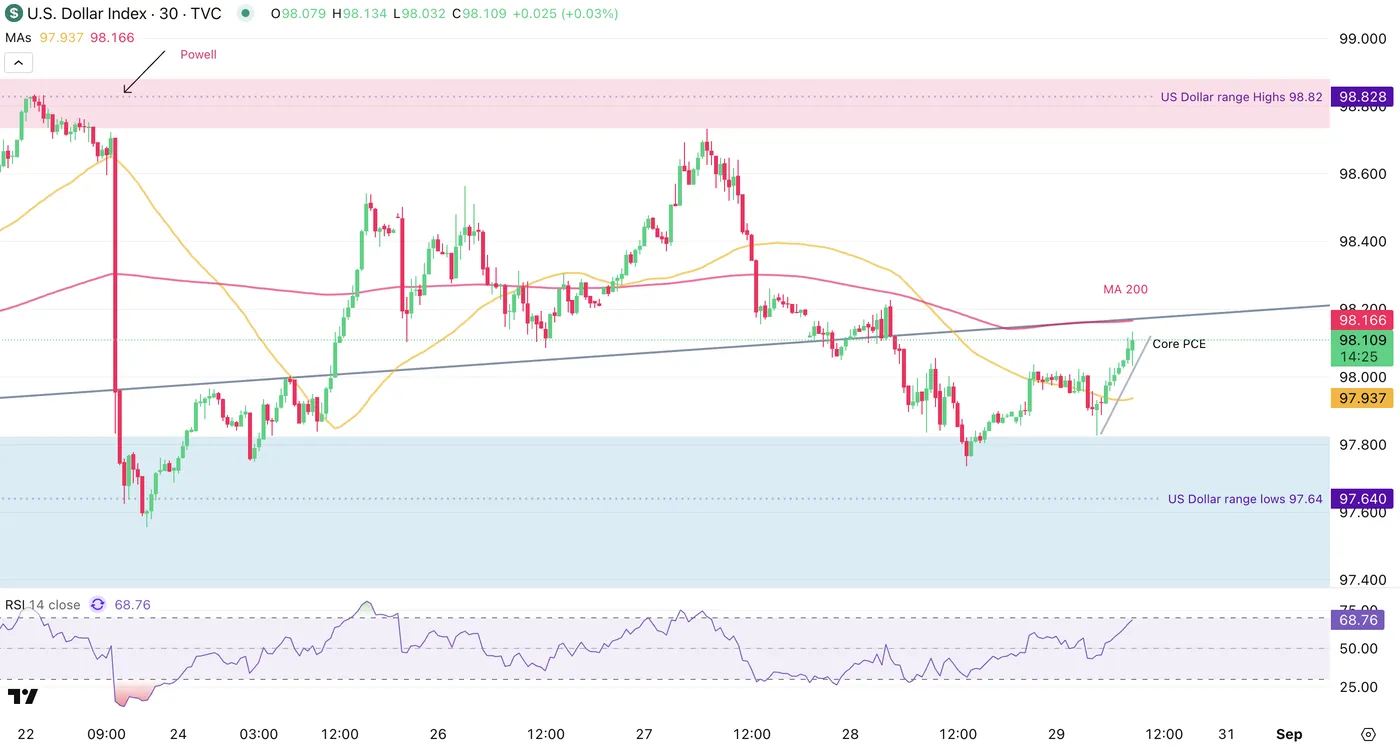
Dollar Index 30m Chart, August 29, 2025 – Source: TradingView
The Dollar is rising slowly but will be stepping against the 30m 200-MA around 98.17, still evolving in a range within the 98.00 handle.
USDCAD 30m Chart
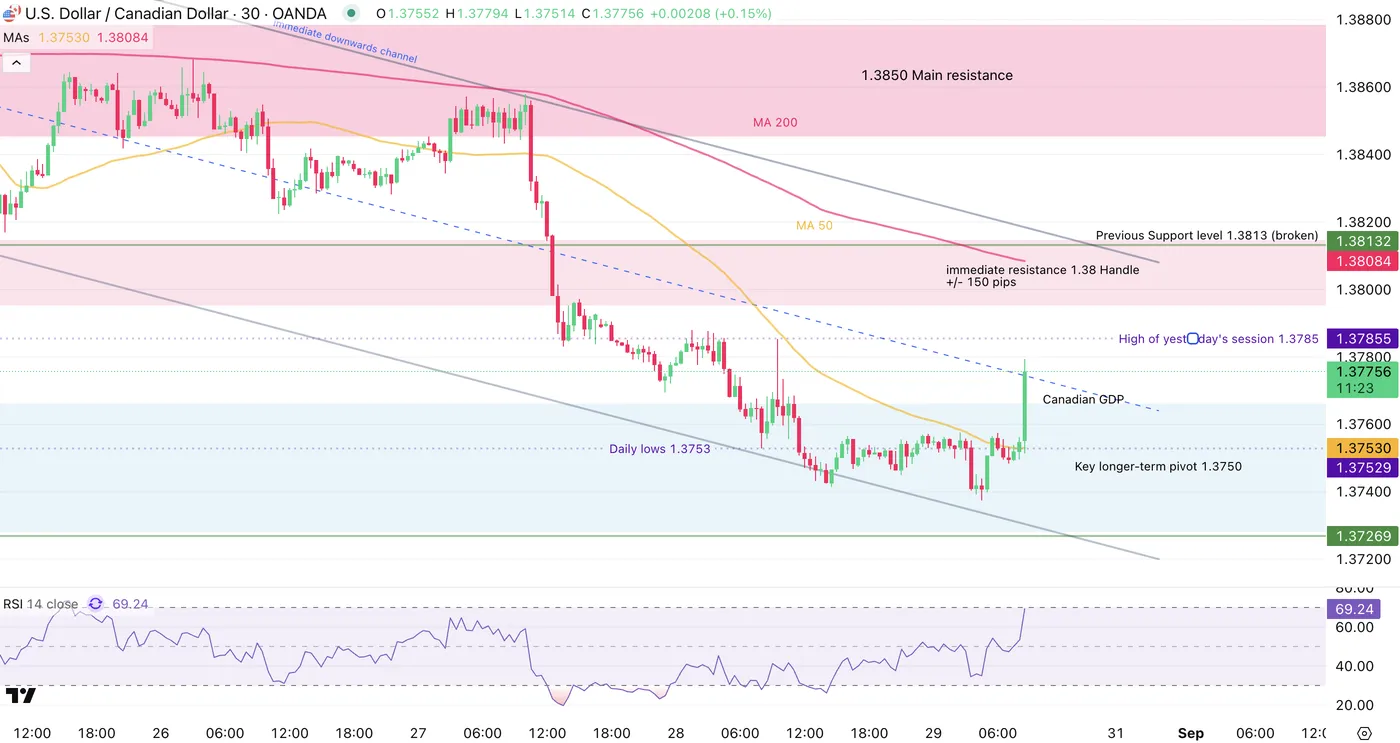
USDCAD 30m Chart, August 29, 2025 – Source: TradingView
The Loonie is losing some steam after the data. The pair is still evolving in a downward channel.
You can access our latest analysis of the pair right here.
Safe trades!
EURUSD Rangebound in the Waiting for Further News – Breakout Levels
The most traded FX pair wasn't exempt of a huge decrease in trading volumes in this final week of August.
Without much change to fundamentals, traders have been looking for volatility in the impatient waiting of next Friday's Non-Farm Payrolls report.
However, yesterday, Markets received the news of the Zelenskyy-Putin meeting not moving forward (It could have been expected with no advances since the past two weeks).
The implications for the Euro are still to be clarified, but what is sure is that as long as this conflict keeps going, EU nations are going to keep spending on defense.
The fundamental background could be negative for the Euro, but national spending of that sort tends to generate economic activity and hence can be seen as a positive for the Joint currency – However, the news are already priced in and have helped the Euro already in 2025.
Also, rangebound action is not worst for trading, albeit can be a bit dull; It provides boundaries for entry points.
One thing to consider, is that ranges will break on renewed fundamentals, like economic data (Core PCE is expected to get released promptly) – therefore one other advantage is that they also provide breakout levels
EURUSD technical analysis – determining the range and breakout points
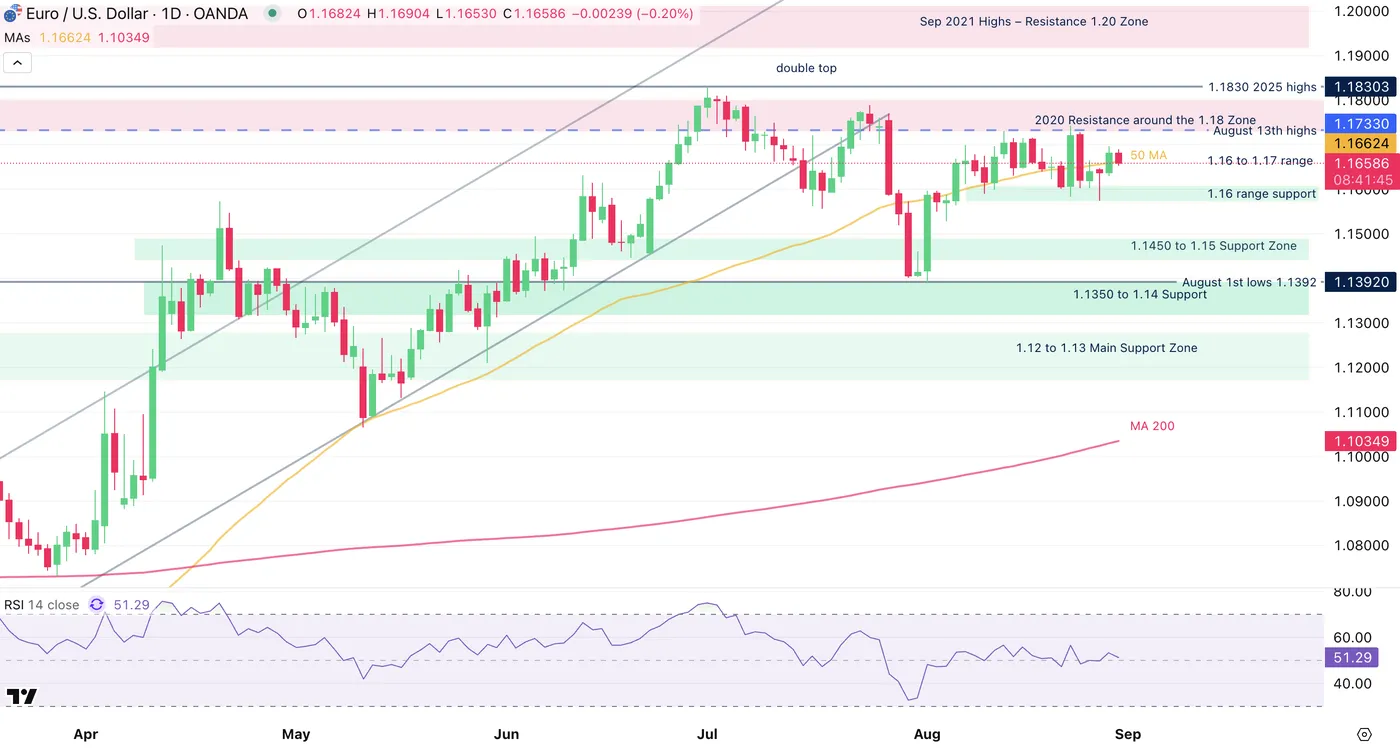
EURUSD Daily Chart, August 29, 2025 – Source: TradingView
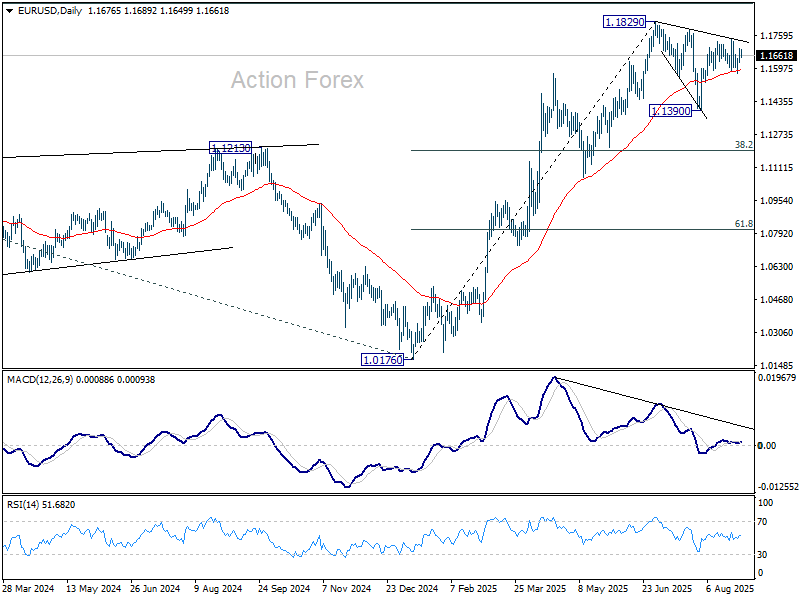
It's now been 17 sessions that EURUSD hasn't been able to find any direction.
Despite a few break attempts and data points, the pair has been held between a 1.16 to 1.17 range.
Some range extremes (1.1570 lows on Wednesday 27 – 1.16420 highs last Friday) did go further than that, but most of the volume is contained within these two psychological levels.
Momentum is dead within the neutral zone (Mid-line of the RSI) and the 50-Day MA corroborates, flat as it can be.
Let's have a closer look to see where are the range extremes.
EURUSD 4H Chart
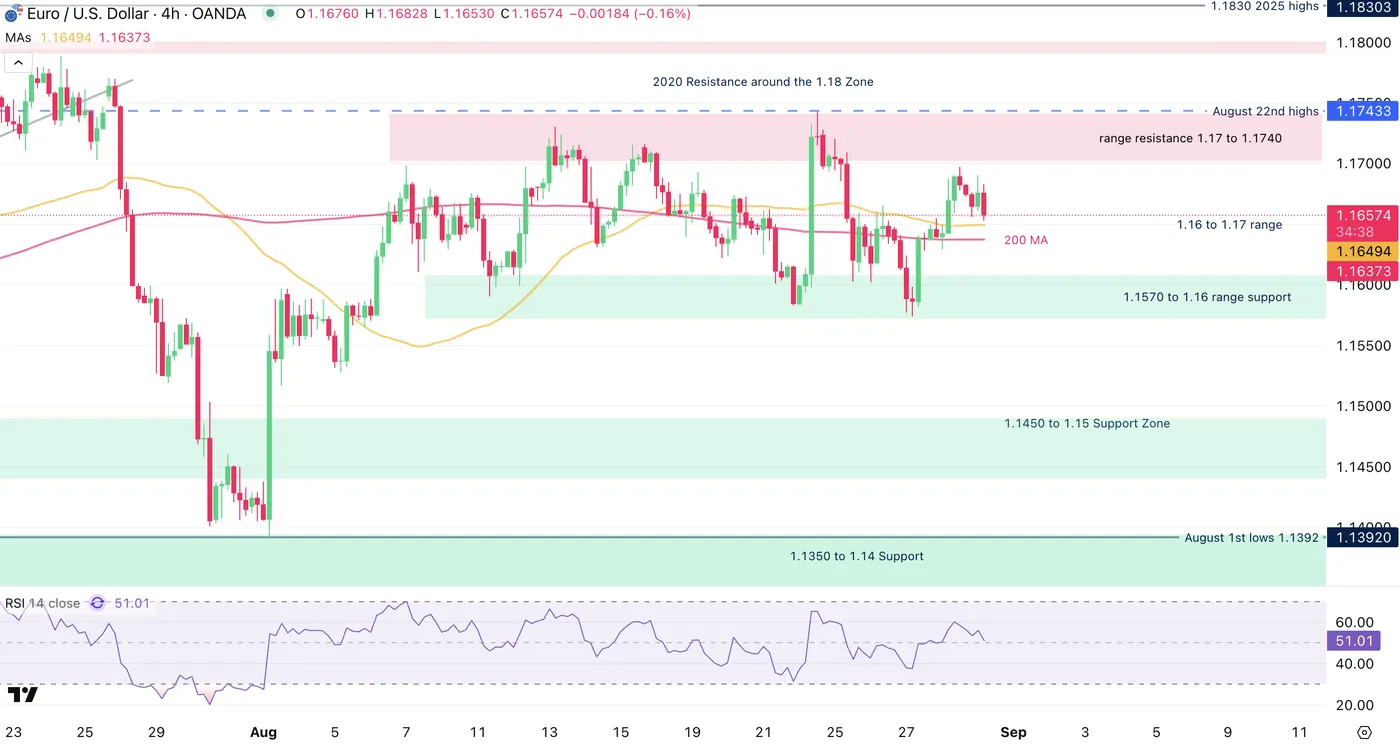
EURUSD 4H Chart
The most recent extreme hit was the resistance of the range and some (slow) selling is currently ongoing.
Watch for a higher breakout possibility after the Core PCE data, however for now the extremes are located at 1.1570 to 1.16 range support and the range resistance 1.17 to 1.1740.
Any daily close above or below these levels would imply a breakout towards other key and support levels which are:
Key levels of interest for EURUSD:
EUR/USD Levels to keep on your charts:
Resistance Levels
- 1.17430 August 22nd highs
- 2020 Resistance around 1.18 (+/- 100 pips)
- 1.1830 2025 top
Support Levels
- Range lows 1.1570 to 1.16
- 1.1450 to 1.15 Main support Level
- 1.1350 to 1.14 Support 2
Safe Trades!
Canada’s GDP Contracts in the Second Quarter
The Canadian economy contracted by 1.6% quarter/quarter annualized (q/q, AR), a steeper decline than expected by consensus, but nearly bang-on our updated tracking. The first quarter was revised slightly lower (+2.0% q/q from +2.2 q/q). Looking ahead to the third quarter, the flash estimate for July showed a 0.1% monthly increase, after a 0.1% month/month contraction in June.
Consumer spending made massive contribution to overall GDP growth, clocking in at a hefty 4.5% annualized pace. Solid spending gains were observed for durables, semi-durables, and services. Inventory accumulation was the other big growth driver.
Residential investment advanced 6% q/q in Q2 – a partial rebound from the hefty 12% q/q drop in the first quarter – driven by new construction. In contrast, non-residential investment plunged 10% q/q, weighed on by a 33% q/q decline in machinery and equipment. Meanwhile, structures investment rose 6%, although this was largely driven by the one-off import of a module for an offshore oil project in Newfoundland and Labrador.
Exports contracted by 27% q/q, while imports fell 5% q/q. The difference carved 8 percentage points from overall GDP growth. Exports were notably weak for autos, industrial machinery, equipment, and parts, as well as travel services. For imports, hefty pullbacks were recorded for passenger vehicles and travel services.
Key Implications
As expected, the economy contracted in the second quarter, as exports were walloped by the one-two punch of weaker U.S. demand and the unwind of a tariff-front running induced surge in Q1. Final domestic demand held up much better than overall GDP (+3.5% q/q), buoyed by a surprisingly strong, broad-based surge in consumer spending and one-time equipment import for an offshore oil field in Newfoundland and Labrador. Moving forward, consumption growth could ease from its hefty second quarter pace, reflecting the cooler jobs market. Note that employee compensation advanced at its slowest pace since the pandemic in the second quarter.
Today's GDP data fell in almost exactly in line with what the Bank of Canada expected in their latest forecast. However, domestic demand looks to have surprised on the upside. On the margin, this could enhance the argument for the Bank to stand pat on rates at their September 17th meeting. However, policymakers still have one more jobs and inflation report to digest before that time. The contraction in overall GDP also implies that slack built in the economy in Q2, and even with a better performance in Q3 likely on tap, the economy probably remains in excess supply. This points to further downward pressure on inflation and could pave the way for more rate cuts this year (see our updated forecast), especially with a policy rate only at the mid-point of what the Bank considers neutral for the economy. For their part, markets are pricing in a 55% chance of a cut in September, although one taking place by year's end is fully priced in.
US: Consumer Spending Rises in July, But Core PCE Inflation Edges Higher Too
Consumer spending and income growth both improved in July. Personal income rose 0.4% month-over-month (m/m), a hair above the market consensus forecast. Growth in wages and salaries picked up to 0.7% m/m from 0.1% in June, while government transfer payments were flat on the month.
Consumer spending grew 0.5% m/m in nominal terms, coming on the heels of an upwardly revised 0.4% gain in the prior month. With income and spending growing at a similar pace, the personal savings rate remained unchanged at 4.4%.
Spending was up 0.3% m/m on an inflation-adjusted basis, up from a 0.1% gain in the month prior. Goods spending strengthened, advancing by 0.9%, owing in part to a robust gain in vehicle sales last month. Real spending on durable goods rose by 2.0% m/m, while spending on non-durable goods rose more modestly (+0.3%). Meanwhile, services spending remained muted, edging up by just 0.1% and matching June's performance.
Core PCE – the Fed's preferred inflation gauge – rose by 0.3% m/m on the month, matching June's growth. In annual terms, core PCE inflation rose to 2.9% from 2.8% seen a month prior and 2.7% in May.
Key Implications
A revised GDP report released earlier this week showed that consumer spending grew at an annualized rate of 1.6% in Q2, slightly higher than the previously reported 1.4%. Today’s report builds on that positive news, indicating that consumers entered the second half of the year with decent momentum. This suggests that third quarter growth in consumer spending could come in around 1.7% - an upgrade relative to our previous 1.1% tracking. This is still a relatively modest pace and this week’s consumer confidence data showed households remain uneasy. Sentiment towards labor market prospects is deteriorating, and more consumers expect their incomes to decline. This cautiousness is reflected in the ongoing softness in services spending.
So far, the worst of the households' inflation fears have not materialized. However, given the delays and various changes in tariff implementation, it’s still early in the game. The latest inflation report showed that core goods prices are gradually rising, with two-thirds of goods categories experiencing price gains over the past three months. Today's report also showed core PCE is accelerating on an annual basis. Until now, businesses have largely avoided passing on higher costs by stockpiling inventories, substituting away from highly tariffed imports, or absorbing the increases themselves. These strategies aren’t sustainable indefinitely, and we expect greater passthrough of tariff-related price increases in the coming months.
EUR/USD Mid-Day Outlook
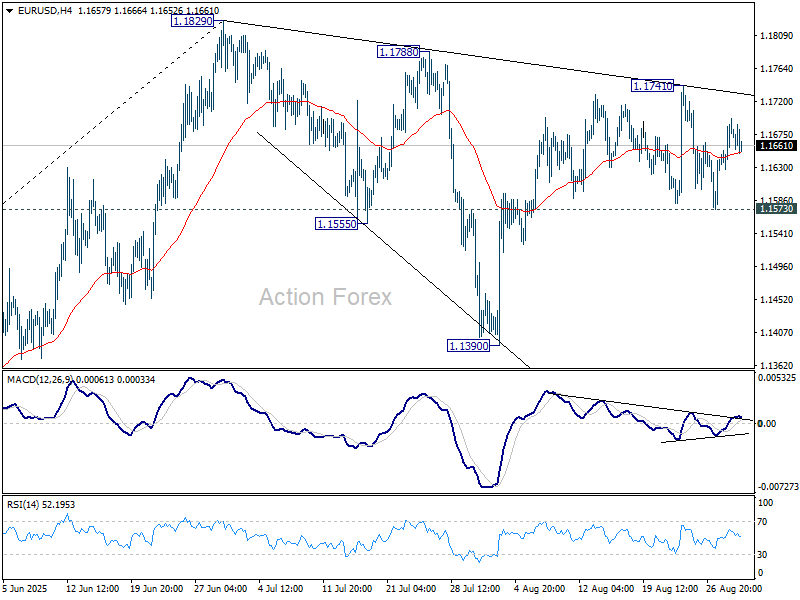
Daily Pivots: (S1) 1.1641; (P) 1.1670; (R1) 1.1710; More...
Range trading continues in EUR/USD and intraday bias remains neutral. Further rise is in favor as long as 1.1573 support holds. Break of 1.1741 will resume the rally from 1.1390 to retest 1.1829 high. Firm break there will extend larger up trend. However, decisive break of 1.1573 will extend the corrective pattern from 1.1829 with another downleg, and target 1.1390.
In the bigger picture, rise from 0.9534 long term bottom could be correcting the multi-decade downtrend or the start of a long term up trend. In either case, further rise should be seen to 100% projection of 0.9534 to 1.1274 from 1.0176 at 1.1916. This will remain the favored case as long as 1.1604 support holds.