
Sample Category Title
Gold Hits All-Time High Amid Flight to Safety
- Gold at record high: Gold surged to $3,549.66/oz, up 33% in 2025, as investors seek safe-haven assets amid global uncertainty.
- Fed policy drives momentum: Expectations of U.S. Federal Reserve rate cuts and political interference fears boost precious metals demand.
- Silver outshines gold: Silver breaks $40/oz for the first time since 2011, up 40% YTD, fueled by industrial demand and tight supply.
Gold Hits All-Time High Amid Flight to Safety
Gold prices reached a new all-time high of $3,549.66 per ounce, reflecting a broader trend of growing investor appetite for safe-haven assets amid worsening sentiment in global equity and bond markets, and rising political and economic uncertainty. In just the past seven trading sessions, gold has climbed by over 5%, and since the beginning of the year, the metal has gained more than 33%, making it one of the best-performing assets of 2025.
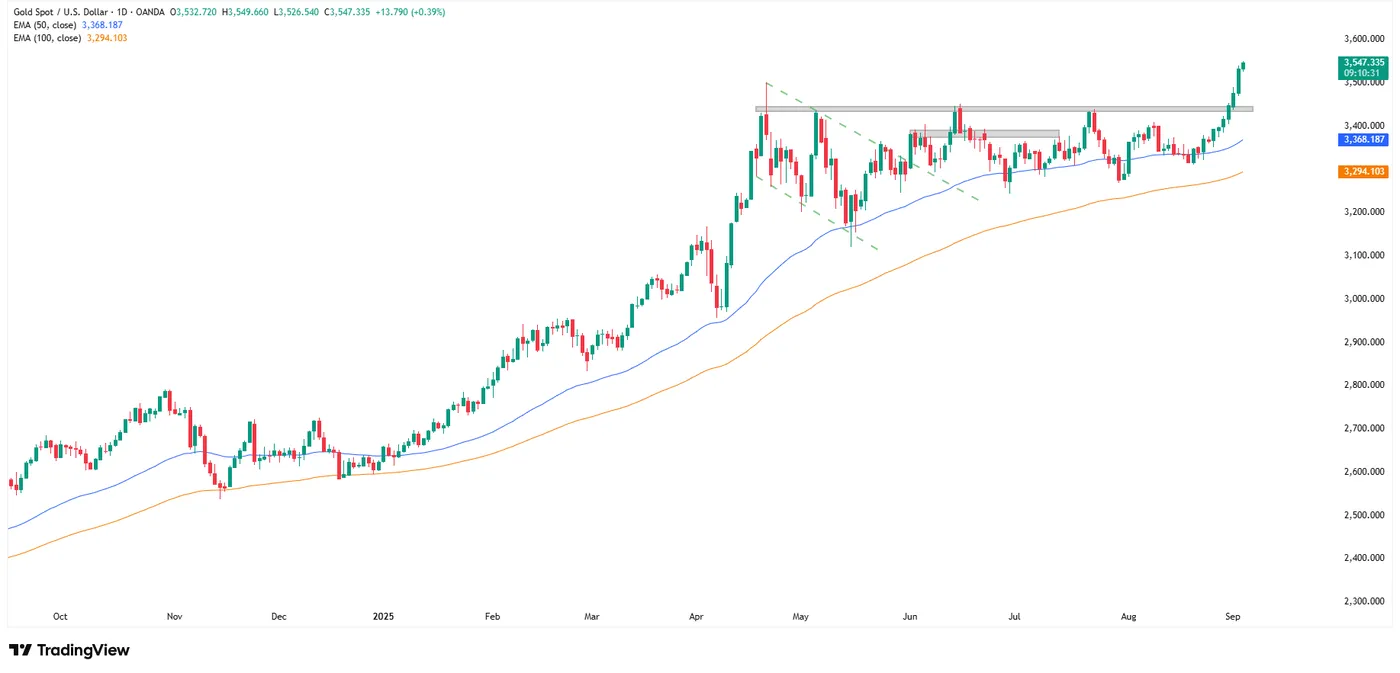
Daily chart of Gold, source: TradingView
Fed Rate Cut Expectations Fuel Momentum
The rally in gold is primarily driven by expectations of an upcoming rate-cutting cycle by the U.S. Federal Reserve, which enhances the attractiveness of non-yielding assets like gold. Investors are also reacting to growing concerns about the Fed’s independence — President Trump has reportedly considered removing one of the central bank’s board members, raising fears about the future direction of monetary policy. Additional uncertainty stems from fiscal instability in developed economies and ongoing geopolitical tensions, both of which are pushing capital toward precious metals.
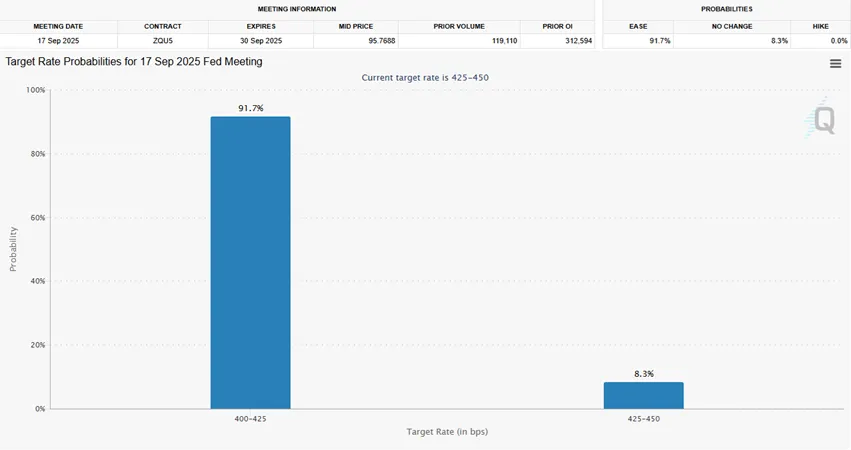
Probabilities of changes to the Fed rate, as implied by 30-Day Fed Funds futures prices., source: CME FedWatch Tool
Silver Outpaces Gold on Industrial and Investment Demand
Silver has shown an even more impressive performance, breaking above $40 per ounce for the first time since 2011. Year-to-date, silver is up by approximately 40%, outperforming gold both in terms of return and demand dynamics. Beyond macroeconomic factors, silver is also benefiting from robust industrial demand, particularly in the green technology sector — including solar panels and other renewable energy components. The physical silver market is facing its fifth consecutive year of supply deficit, which is fueling investor interest in silver-backed ETFs. Shrinking inventories in London vaults and persistently high leasing costs (around 2%) point to tight physical availability of the metal.
In the near term, the precious metals market is expected to remain highly sensitive to political and macroeconomic developments. Investors are awaiting a ruling by the U.S. Supreme Court on the legality of removing a Fed board member, as well as the announcement of a new nominee for Fed Chair — Jerome Powell is set to step down in May 2026. Upcoming U.S. labor market data will also be crucial in shaping the Fed’s next monetary policy moves. Adding to the uncertainty is the ongoing trade dispute, with President Trump announcing plans to appeal a court decision that ruled parts of existing tariffs illegal — a move that could further escalate global trade tensions.
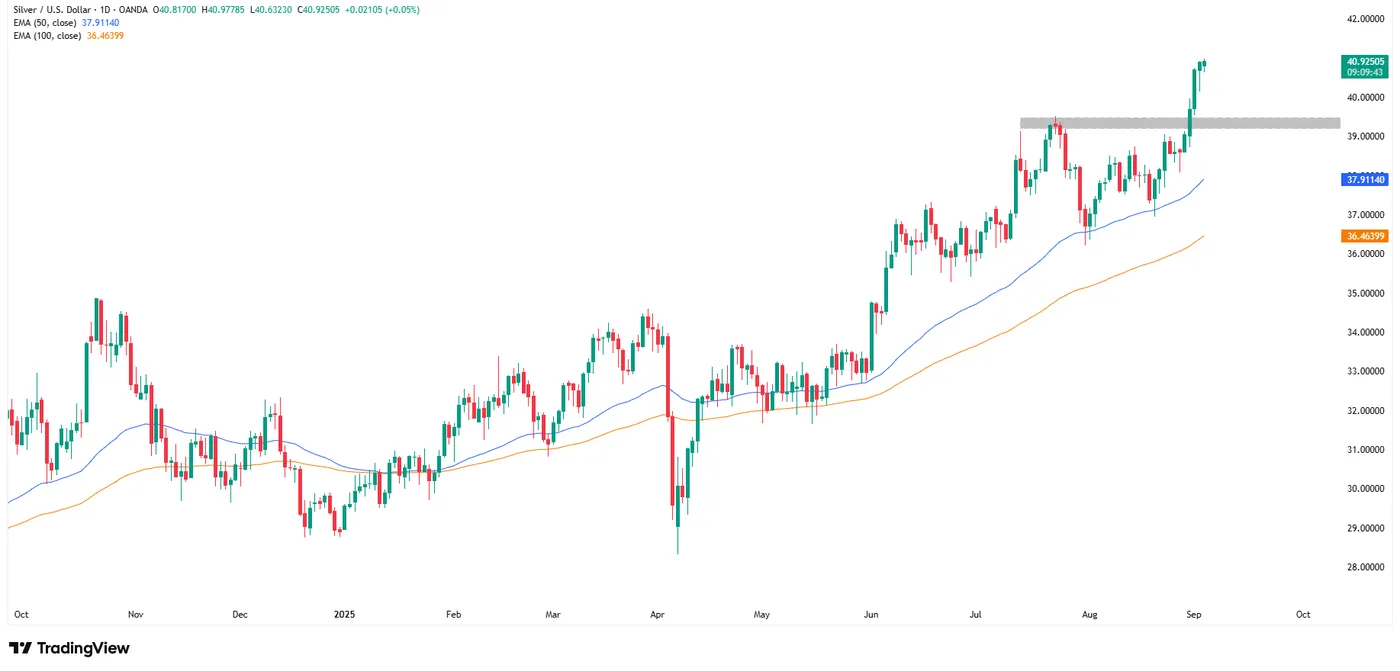
Daily chart of Silver, source: TradingView
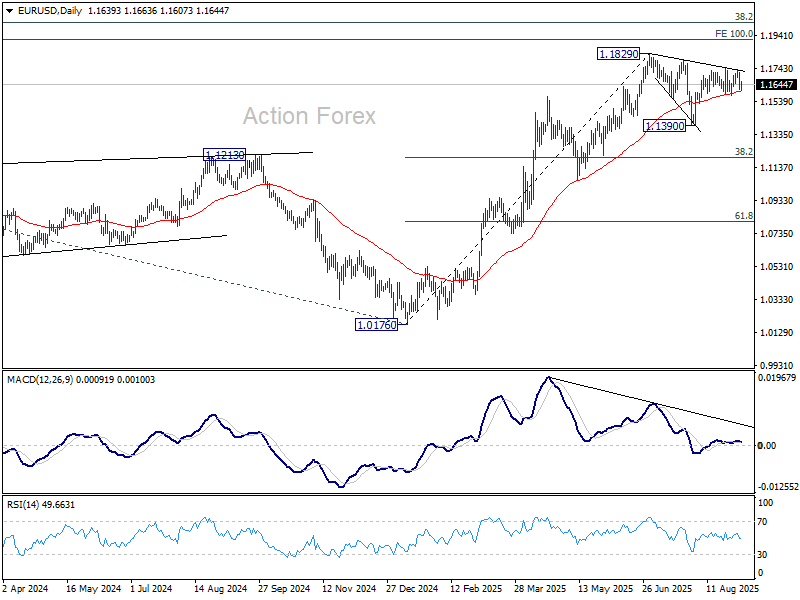
EUR/USD Mid-Day Outlook
Daily Pivots: (S1) 1.1655; (P) 1.1682; (R1) 1.1713; More...
Range trading continues in EUR/USD and outlook is unchanged. Intraday bias remains neutral and further rise is in favor as long as 1.1573 support holds. Corrective fall from 1.1829 should have completed with three waves down to 1.1390. On the upside, above 1.1741 will bring retest of 1.1829 high first. Firm break there will resume larger up trend. However, sustained break of 1.1573 will dampen this view, and indicate that corrective pattern from 1.1829 is extending with another falling leg towards 1.1390 again.
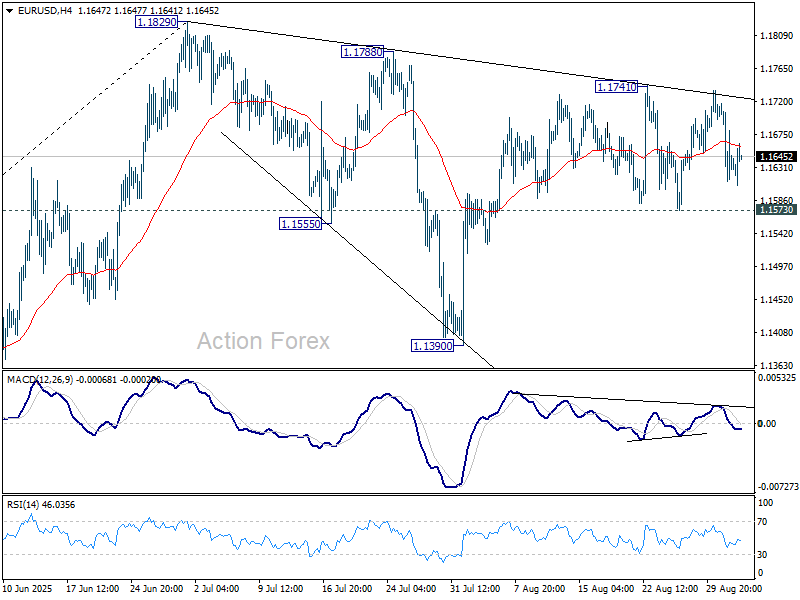
In the bigger picture, rise from 0.9534 (2022 low) long term bottom could be correcting the multi-decade downtrend or the start of a long term up trend. In either case, further rise should be seen to 100% projection of 0.9534 to 1.1274 from 1.0176 at 1.1916. This will remain the favored case as long as 1.1604 support holds.
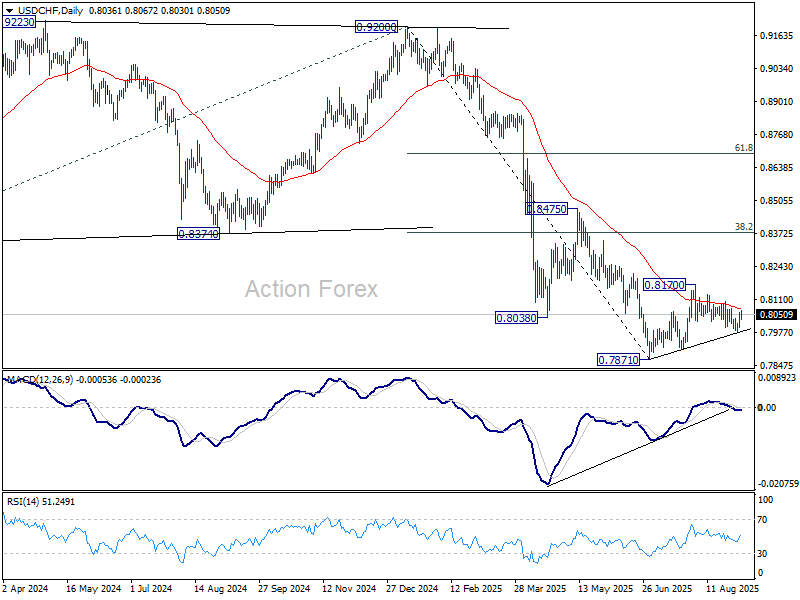
USD/CHF Mid-Day Outlook
Daily Pivots: (S1) 0.8011; (P) 0.8036; (R1) 0.8072; More….
No change in USD/CHF's outlook and intraday bias stays neutral. On the downside, break of 0.7984 will resume the fall from 0.8170 to 0.7910 support first, and then retest of 0.7871 low. However, break of 0.8103 resistance will turn bias to the upside to resume the rebound from 0.7871 through 0.8170.
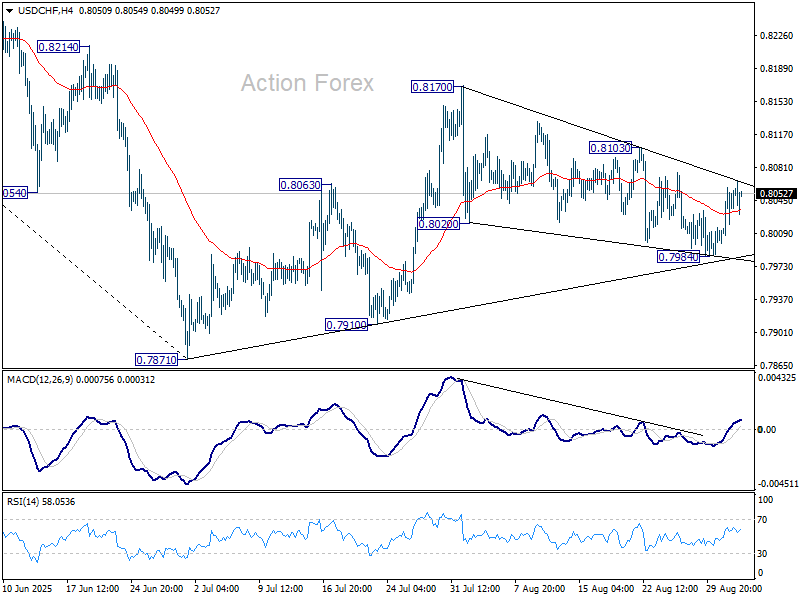
In the bigger picture, long term down trend from 1.0342 (2017 high) is still in progress. Next target is 100% projection of 1.0146 (2022 high) to 0.8332 from 0.9200 at 0.7382. In any case, outlook will stay bearish as long as 0.8475 resistance holds.
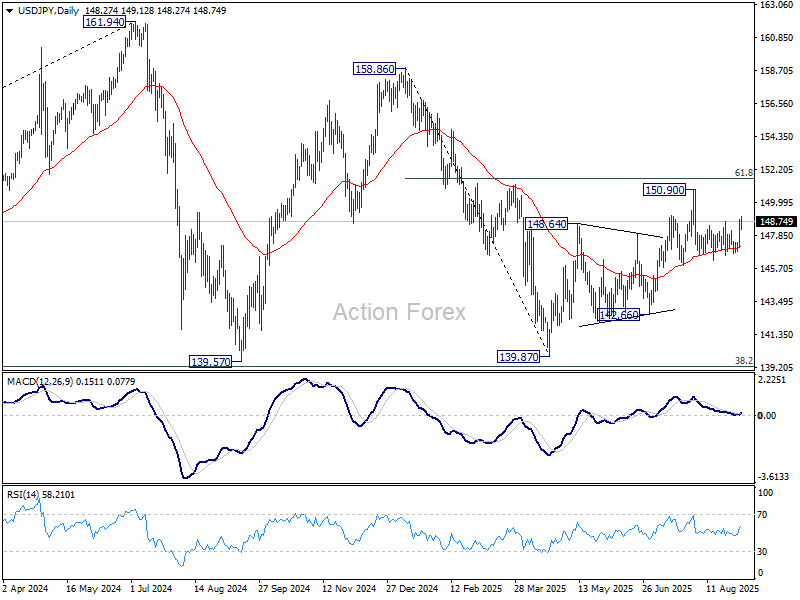
USD/JPY Mid-Day Outlook
Daily Pivots: (S1) 147.28; (P) 148.11; (R1) 149.17; More...
Intraday bias in USD/JPY remains on the upside for the moment. Further rise should be seen to retest 150.90 resistance. Break there will resume the rise from 139.87 to 151.22 fibonacci level. Firm break there will carry larger bullish implication. On the downside, however, break of 146.65 support will resume the decline from 150.90 through 146.20 instead.
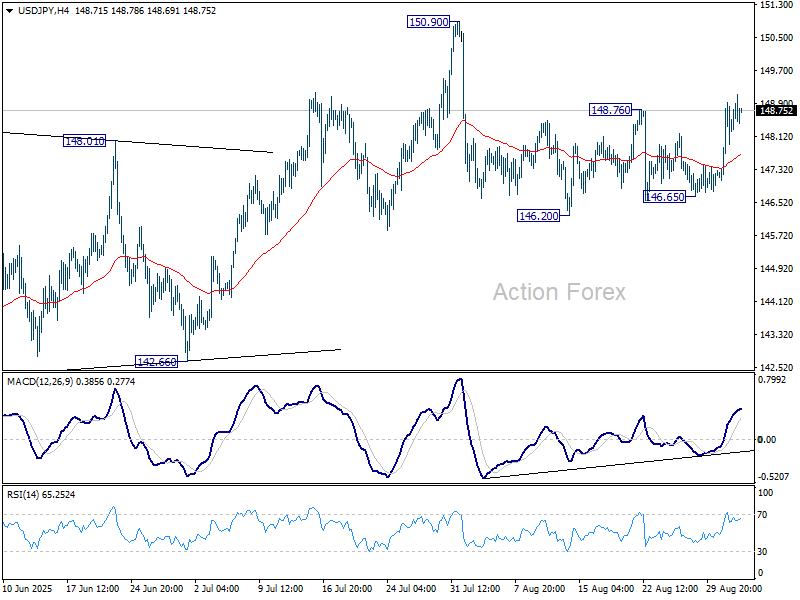
In the bigger picture, price actions from 161.94 (2024 high) are seen as a corrective pattern to rise from 102.58 (2021 low). Decisive break of 61.8% retracement of 158.86 to 139.87 at 151.22 will argue that it has already completed with three waves at 139.87. Larger up trend might then be ready to resume through 161.94 high. In case the corrective pattern extends with another fall, strong support is expected from 38.2% retracement of 102.58 to 161.94 at 139.26 to bring rebound.
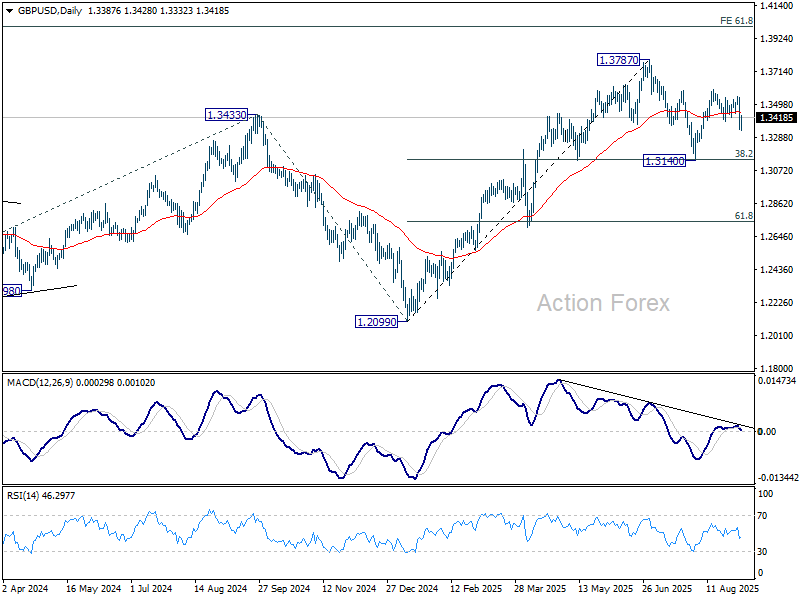
GBP/USD Mid-Day Outlook
Daily Pivots: (S1) 1.3306; (P) 1.3428; (R1) 1.3515; More...
GBP/USD recovered after dipping to 1.3332 and intraday bias is turned neutral first. Overall outlook is unchanged that corrective pattern from 1.3787 is extending. Below 1.3332 will bring deeper pullback. But downside should be contained by 38.2% retracement of 1.2099 to 1.3787 at 1.3142. On the upside, break of 1.3549 resistance should resume the rebound from 1.3140 towards 1.3787 high.
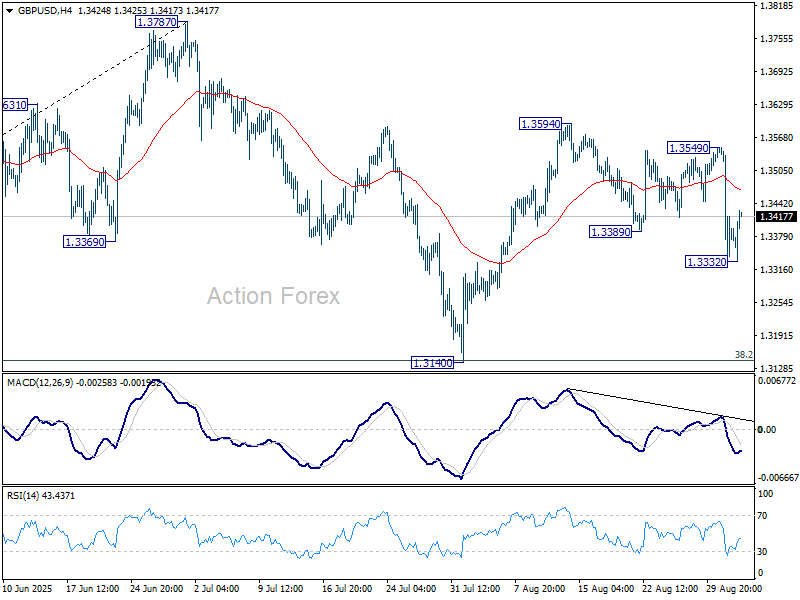
In the bigger picture, up trend from 1.3051 (2022 low) is in progress. Next medium term target is 61.8% projection of 1.0351 to 1.3433 from 1.2099 at 1.4004. Outlook will now stay bullish as long as 55 W EMA (now at 1.3104) holds, even in case of deep pullback.
Sterling Recovers Modestly, Global Yields Ease
Global markets steadied on today as benchmark treasury yields dipped modestly after this week’s sharp jump. The pullback in yields helped ease pressure on risk sentiment, with European stocks trading slightly higher while U.S. futures hovered near flat.
Sterling also managed a tentative rebound following its steep selloff yesterday. Although investor concerns over the U.K.’s fiscal trajectory remain acute, the announcement of the Autumn Budget date has shifted attention to November for a clearer view on the government’s plans.
Chancellor Rachel Reeves confirmed she will deliver the Autumn Budget on November 26, reiterating that the government “must bring inflation and borrowing costs down by keeping a tight grip on day-to-day spending through our non-negotiable fiscal rule.” Reeves’ stance was seen as a bid to reassure markets about her commitment to discipline.
Still, Reeves will likely need to raise taxes to meet her targets and preserve a fiscal buffer of around GBP 10 billion. That margin has already been squeezed by U-turns on welfare cuts and the rising cost of borrowing, leaving limited room for maneuver as the government tries to restore confidence.
For now, markets appear willing to wait for Reeves’ budget for more concrete answers, though caution prevails. Any signs that Reeves could be sidelined would likely trigger renewed panic, as investors continue to view her credibility as critical for fiscal stability.
In the currency markets, Yen remains the weakest performer for the week, followed by Sterling and Kiwi. Dollar leads the pack, while Aussie and Euro are also firmer. Loonie and Swiss Franc are trading mid-range.
In Europe, at the time of writing, FTSE is up 0.39%. DAX is up 0.73%. CAC is up 0.91%. UK 10-year yield is down 0.027 at 4.782. Germany 10-year yield is down -0.022 at 2.769. Earlier in Asia, Nikkei fell -0.88%. Hong Kong HSI fell -0.60%. China Shanghai SSE fell -1.16%. Singapore Strait Times fell -0.21%. Japan 10-year JGB yield rose 0.031 to 1.637.
Eurozone PPI beats expectations at 0.4% mom on energy surge
Eurozone producer prices rose more than expected in July, with PPI up 0.4% mom and 0.2% yoy, compared with consensus of 0.2% mom and 0.1% yoy. The data suggest some renewed pipeline pressures, largely driven by energy. Across the wider EU, PPI increased 0.6% mom and 0.1% yoy. Overall, the figures indicate modest upward pressure in the production pipeline.
Within the Eurozone, energy costs jumped 1.5% from June, offsetting a -0.2% decline in intermediate goods. Prices for capital goods rose 0.1%, durable consumer goods gained 0.2%, while non-durable consumer goods were flat. The mix highlights that energy remains the key source of volatility in producer prices, even as other categories remain stable or subdued.
Price dynamics varied sharply across member states. The largest monthly increases were recorded in Romania (+6.7%), Bulgaria (+5.7%), and Slovakia (+2.8%), while Estonia (-1.0%), Latvia (-0.7%), and Luxembourg (-0.4%) posted declines.
Australia’s GDP rebounds 0.6% qoq in Q2, as spending and exports drive recovery
Australia’s economy grew 0.6% qoq in Q2, beating expectations of 0.5% qoq and expanding 1.8% yoy from a year earlier. The Australian Bureau of Statistics noted that growth rebounded after weather disruptions depressed activity in Q1. GDP per capita also rose 0.2% qoq, reversing the decline recorded in the March quarter.
Domestic final demand was the key driver, supported by a 0.9% qoq rise in household spending and a 1.0% qoq increase in government consumption. Public investment detracted from growth, but private demand proved resilient.
Net trade added 0.1 percentage points to GDP, driven by a rebound in exports of iron ore and LNG as production normalized after severe weather disruptions earlier in the year.
BoJ’s Ueda meets PM Ishiba, stresses stable FX and policy vigilance
BoJ Governor Kazuo Ueda said he discussed economic and market conditions, including foreign exchange moves, in a meeting with Prime Minister Shigeru Ishiba today. Ueda told reporters afterward that “it’s desirable for currency rates to move stably, reflecting fundamentals,” but declined to elaborate further on the details of the exchange.
On policy, Ueda reaffirmed that the BOJ remains prepared to raise interest rates further if the economy and prices evolve in line with projections. He emphasized that the central bank will “scrutinize without any pre-conception” whether those projections materialize.
China RatingDog services PMI rises to 53.0, optimism improves
China’s services sector gained fresh momentum in August, with the RatingDog PMI rising to 53.0 from 52.6, topping expectations of 52.5 and marking the highest level since May 2024. The composite index also improved, climbing to 51.9 from 50.8.
RatingDog founder Yao Yu highlighted that new business inflows surged to the highest since May of last year, while new export orders expanded at the fastest pace since February. More stable domestic demand and a recovery in foreign demand were key drivers, with service providers also reporting stronger optimism—the highest since March.
Price trends, however, remained challenging. Input costs rose modestly but firms were unable to fully pass them on, with output prices slipping back into contraction. That indicates profit margins have been under sustained pressure since late 2023.
GBP/USD Mid-Day Outlook
Daily Pivots: (S1) 1.3306; (P) 1.3428; (R1) 1.3515; More...
GBP/USD recovered after dipping to 1.3332 and intraday bias is turned neutral first. Overall outlook is unchanged that corrective pattern from 1.3787 is extending. Below 1.3332 will bring deeper pullback. But downside should be contained by 38.2% retracement of 1.2099 to 1.3787 at 1.3142. On the upside, break of 1.3549 resistance should resume the rebound from 1.3140 towards 1.3787 high.
In the bigger picture, up trend from 1.3051 (2022 low) is in progress. Next medium term target is 61.8% projection of 1.0351 to 1.3433 from 1.2099 at 1.4004. Outlook will now stay bullish as long as 55 W EMA (now at 1.3104) holds, even in case of deep pullback.
GBP/USD Tumbles: Investors Lose Confidence in UK Fiscal Sustainability
The GBP/USD pair declined to 1.3366 on Wednesday, reflecting intensified selling pressure on the pound. Sterling’s weakness stems from a sharp rise in UK government bond yields and broader global concerns regarding fiscal stability.
The yield on 30-year gilts climbed to 5.695%, marking its highest level in 25 years. This surge highlights mounting borrowing costs and raises the risk of a debt spiral. Higher yields increase debt-servicing expenses, potentially forcing the government to borrow additional funds and further pushing yields upward.
Amid a broader sell-off in debt markets, the pound has depreciated by over 1% within 24 hours, with losses continuing into mid-week. The situation evokes memories of the Liz Truss crisis, which severely eroded confidence in the UK’s fiscal management. Markets now question whether the government can effectively address the budget deficit and curb debt accumulation without implementing stringent reforms.
Pressure on the pound is mounting from two key directions: deteriorating investor confidence in UK fiscal sustainability and a global bond market rout driven by rising debt burdens across major economies.
In the coming weeks, the government’s response to mounting criticism and upcoming budget announcements will be critical for the sterling. These statements will indicate whether policymakers are prepared to adjust their fiscal course.
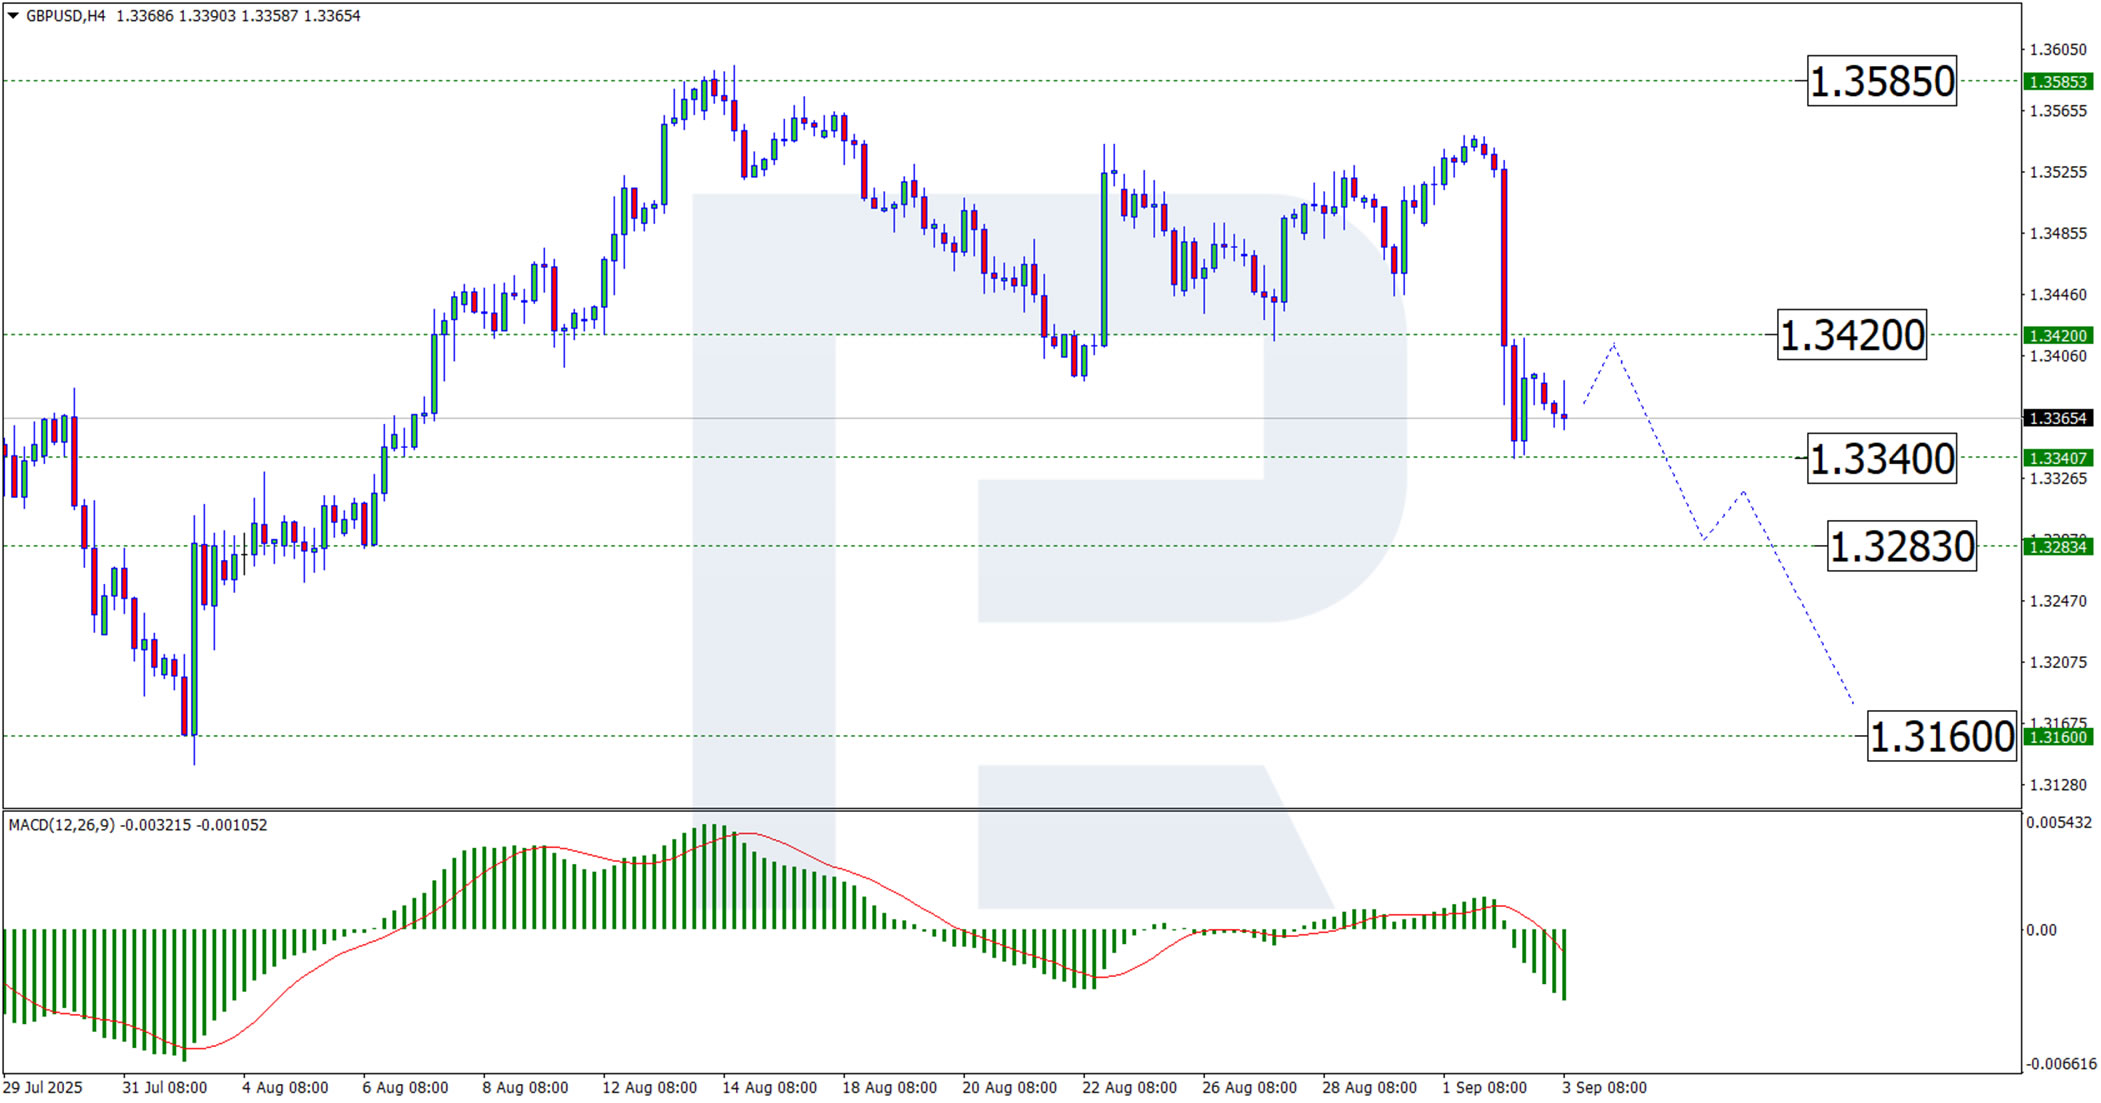
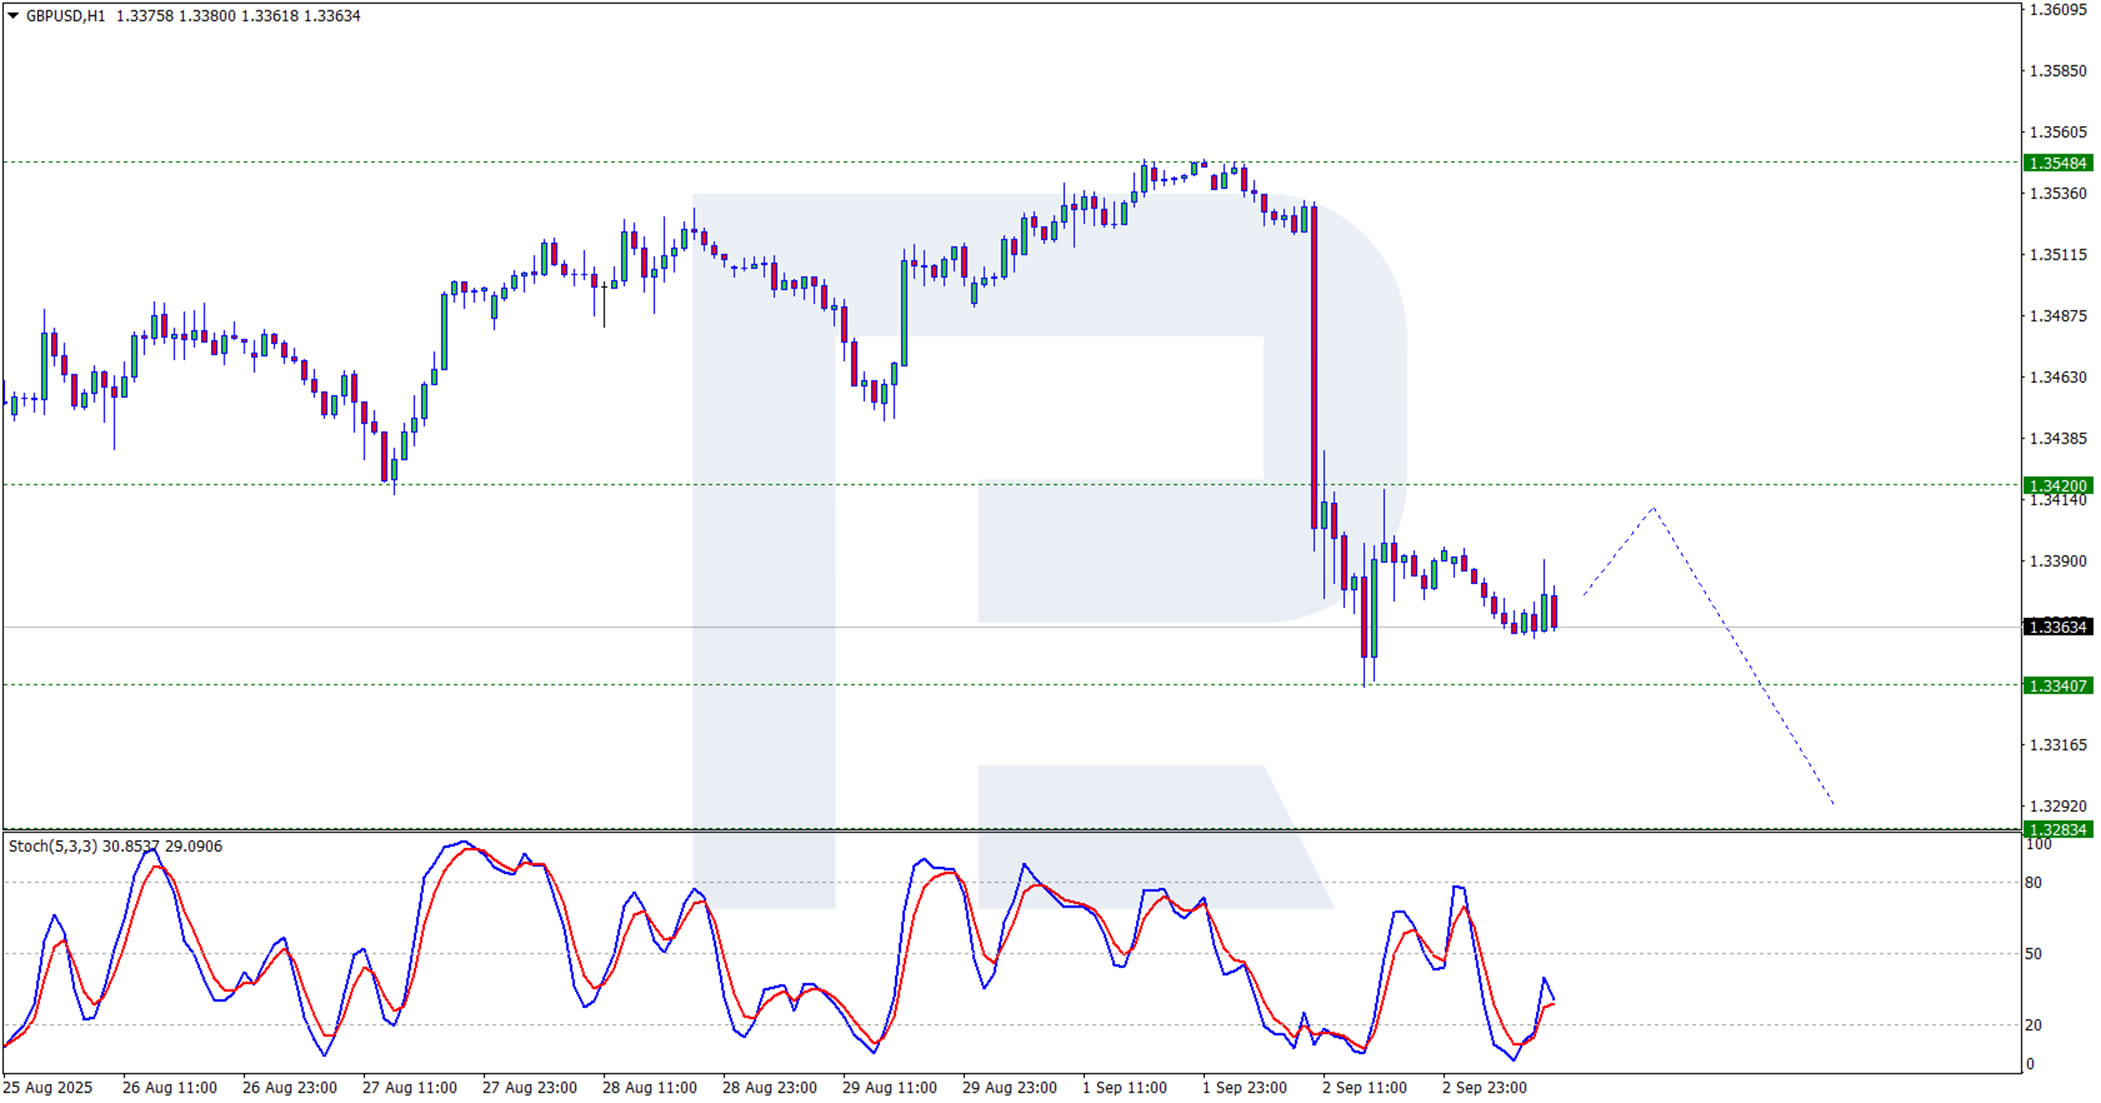
Technical Analysis: GBP/USD
H4 chart:
GBP/USD completed a downward wave towards the 1.3340 USD level. A corrective wave towards the breached support level of 1.3420 USD – now likely to act as resistance – may follow. Once this correction concludes, the pair could resume its decline, with initial support expected at 1.3340 USD, followed by a further drop towards 1.3283 USD, where another corrective wave may form. This bearish outlook is supported by the MACD indicator, where both the histogram and signal line remain below zero and continue trending downward.
H1 chart:
The pair tested the 1.3340 USD level and is forming a corrective wave. The pullback may target resistance at 1.3420 USD, where a rejection could trigger a resumption of the downtrend. The Stochastic oscillator aligns with this view: having failed to reach the 50.0 level, its signal lines are declining towards 20.0, indicating sustained bearish momentum.
Conclusion
Sterling faces intense pressure from both domestic fiscal concerns and global bond market dynamics. Technically, the pair remains in a downtrend, with any near-term corrections likely to be short-lived. The UK government’s upcoming fiscal announcements will be crucial in determining whether confidence can be restored or if further declines lie ahead.
Australian GDP Beats Estimate, Aussie Edges Higher
The Australian dollar has rebounded on Wednesday and is in postive territory. In the European session, AUD/USD is trading at 0.6532, up 0.19%. The Aussie declined 0.52% on Tuesday, ending a streak of five consecutive winning sessions.
Aussie GDP hits fastest pace in nearly two years
Australian GDP grew 1.8% y/y in the second quarter, above the revised 1.4% gain in Q1 and higher than the market estimate of 1.6%. This was the fastest pace of growth since Q3 2023. Quarterly, GDP expanded 0.6%, up from a revised 0.3% in Q1 and above the market estimate of 0.5%. The improvement was driven by stronger household consumption and increased government spending.
The stronger-than-expected GDP reading essentially rules out a rate cut at the September 30 meeting. The Reserve Bank has adopted a cautious stance to policy easing and has cut in February, May and August. The markets expect a hold in September, with a November cut priced in at around 75%. That decision will be largely based on the employment and inflation reports ahead of the November meeting.
The RBA is keeping a close eye on inflation, which jumped to 2.8% in July, up sharply from 1.9% a month earlier. This was the highest level since July 2024, but the RBA won't change policy based on one monthly inflation report. Inflation had been on a downtrend and the 1.9% gain was lower than the RBA's target range of 2-3%. The central bank is also keeping a close eye on the labor market, which has shown signs of gradual easing.
AUD/USD Technical
- AUD/USD is testing resistance at 0.6535. The next resistance lines are 0.6546 and 0.6562
- 0.6508 and 0.6492 are providing support

AUDUSD 4-Hour Chart, September 3, 2025
SPX 500 Technical: Yesterday’s Sell-off Reached Inflection Zone for Potential Bullish Reversal
The US stock market reopened on Tuesday, 2 September, with a weak start after the Labour Day holiday. All four major benchmarks tumbled between –1.3% and –1.8% in the first half of the session, pressured by fears of a global liquidity squeeze following a sharp spike in the UK’s 30-year gilt yield to 5.69%, it’s highest in 27 years, amid concerns over government budget risks.
However, losses eased later in the session. The small-cap Russell 2000 outperformed, closing flat, while the S&P 500, Nasdaq 100, and Dow Jones pared earlier declines to finish down –0.7%, –0.8%, and –0.5%, respectively.
Incoming Fed dovish pivot provides a liquidity backstop with a bull steepener
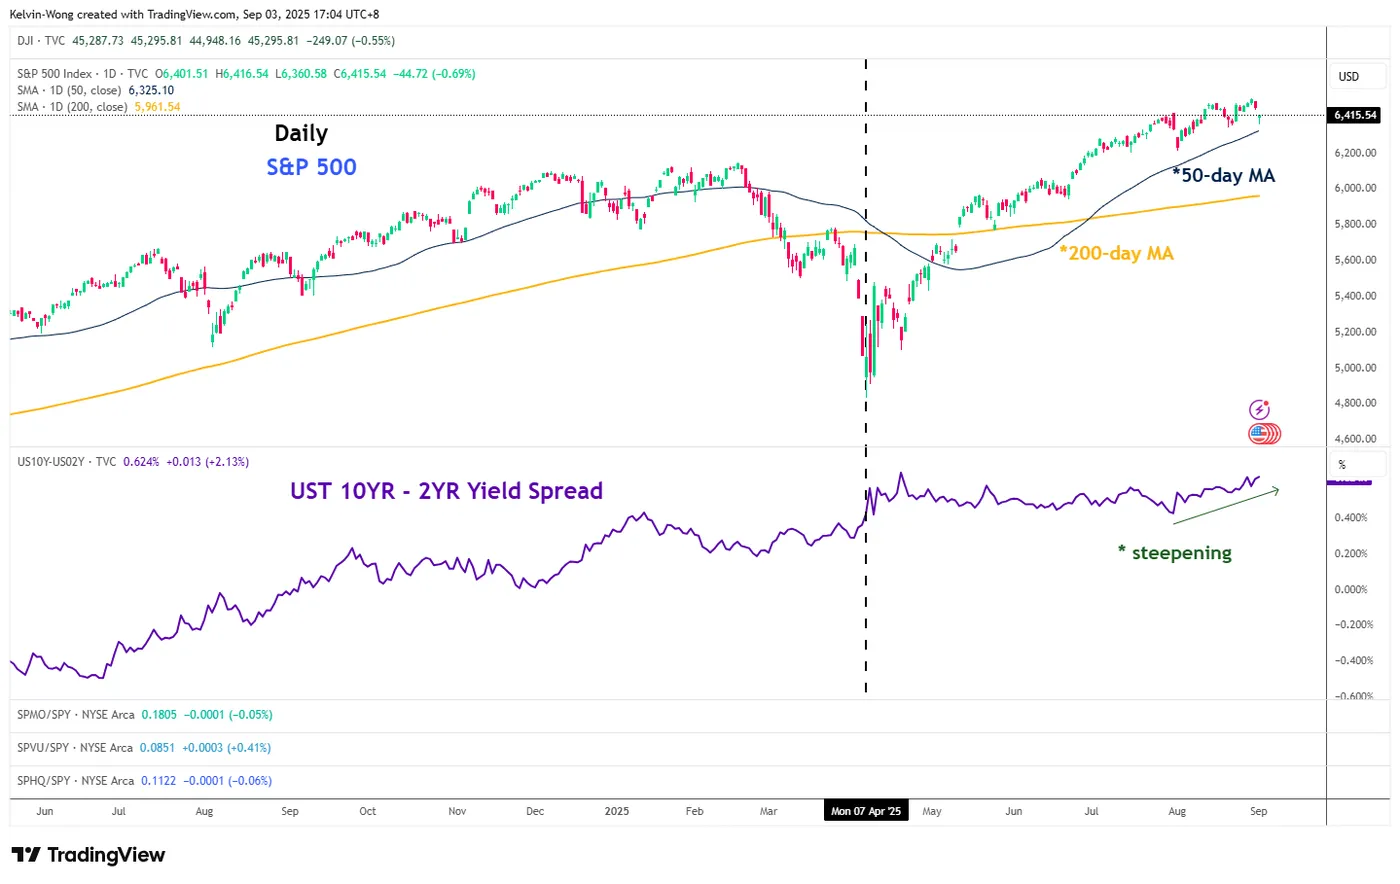
Fig. 1: SPX 500 major trend with US Treasury yield curve (10-YR minus 2-YR) as of 2 Sep 2025 (Source: TradingView)
The intraday rebound in US equities was likely driven by rising expectations of a Fed dovish pivot at the upcoming FOMC meeting on 17 September. According to the CME FedWatch Tool, Fed Funds futures now price in a 91% probability of a 25-bps rate cut to 4.00%–4.25%, up from 89% a week earlier.
Hence, the 2-year US Treasury yield, which is sensitive to the changes in the monetary policy stances of the Fed, rose by 2 bps yesterday, which is less than the 3 bps increase seen in the 10-year US Treasury yield
Stretching it out over a longer-term horizon, the 2-year US Treasury yield has fallen by 15 bps from 21 August 2025 to Tuesday, 2 September 2025, a higher magnitude in comparison to the 10-year US Treasury yield, which only dropped by 7 bps.
This observation seen on the US Treasury yield curve (10-year minus 2-year) is called a bull steepener, where short-term interest rates fall faster than long-term rates, widening the spread between them.
It tends to be bullish for the US stock market at least in the medium-term, as the liquidity infusion from the Fed can be used to negate the adverse effects of the US White House trade tariffs policies (see Fig. 1).
Let’s now take a deep dive into the short-term directional bias and key levels to watch on the US SPX CFD Index (a proxy of the S&P 500 E-mini futures) from a technical analysis perspective.
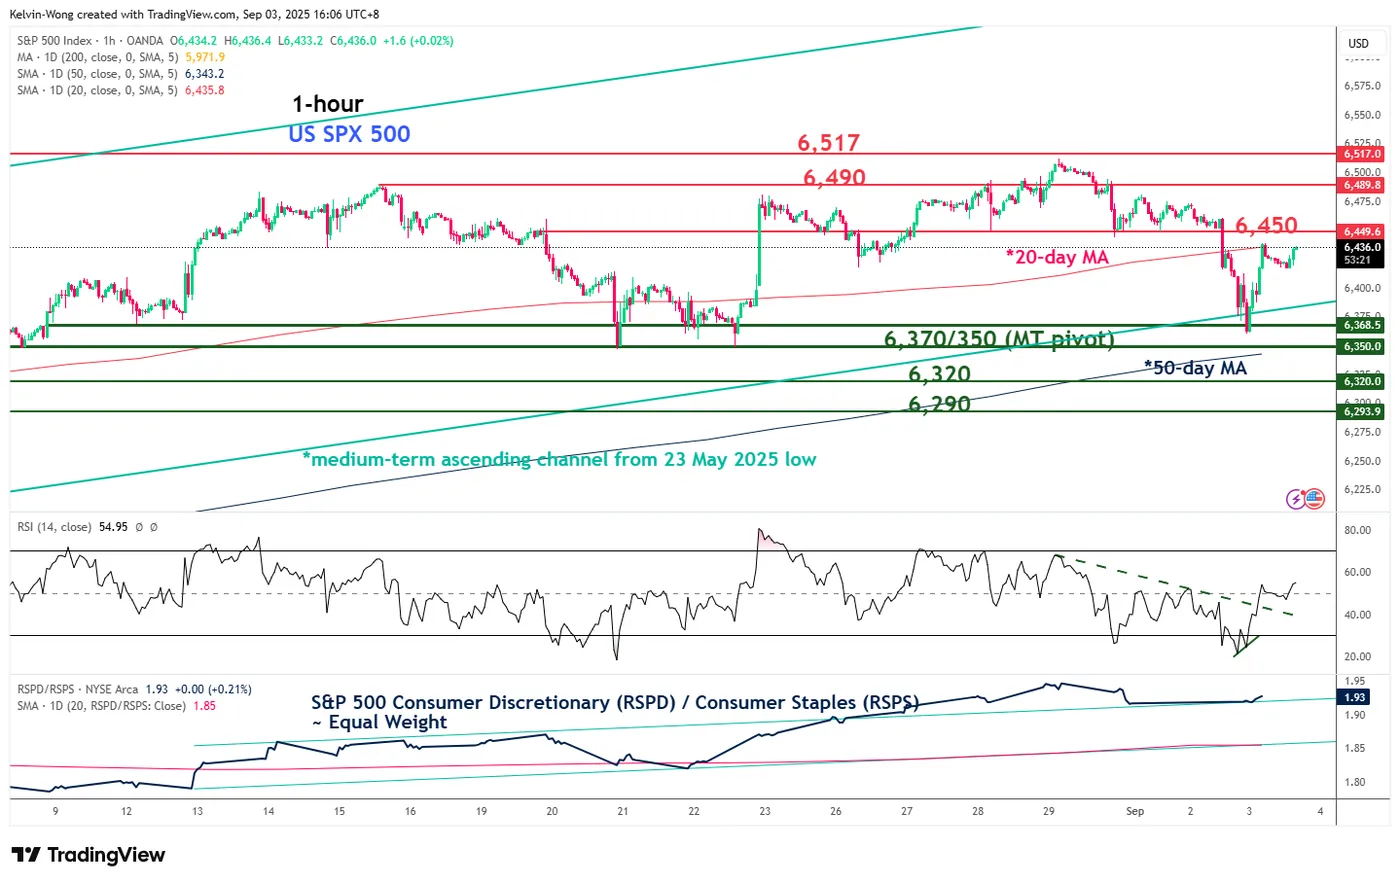
Fig. 2: US SPX 500 CFD Index minor trend as of 3 Sep 2025 (Source: TradingView)
Preferred trend bias (1-3 days)
Yesterday’s sell-off has been overdone. The medium-term uptrend phase of the US SPX 500 remains intact. Bullish bias for a short-term recovery in the first step, watch the 6,370/6,350 key medium-term pivotal support (see Fig. 2).
A clearance above 6,450 intermediate resistance increases the odds of the recovery process for the next intermediate resistances to come in at 6,490 and 6,517 (close to the current all-time high level of 6,513 and a Fibonacci extension cluster).
Key elements
- Yesterday’s sell-off seen in the US SPX CFD Index has managed to stall at the lower boundary of a medium-term ascending channel in place since the 23 May 2025 low.
- The hourly RSI momentum indicator of the US SPX CFD Index has flashed a bullish divergence condition at its oversold condition and staged a bullish breakout from a parallel descending resistance.
- The higher beta equal-weighted S&P 500 Consumer Discretionary sector ETF has continued to outperform the defensive-oriented equal-weighted S&P 500 Consumer Staples sector ETF (see Fig. 2). This observation supports a bullish reversal scenario in the US SPX 500 CFD Index.
Alternative trend bias (1 to 3 days)
Failure to hold at the 6,370/350 key medium-term support on the US SPX 500 CFD Index jeopardises its medium-term uptrend phase to expose the next intermediate supports at 6,320 and 6,290 in the first step.
Bitcoin Tries to Bounce Back Up
Market Overview
The crypto market cap has changed slightly over the past 24 hours, adding a modest 0.1% to $3.81 trillion. Short-term charts show a slight upward trend with higher local highs and lows. There is no uniformity in the dynamics among the largest coins, ranging from a 2% decline in Ethereum to a 3% increase in Solana and a 6% jump in Bitcoin Cash.
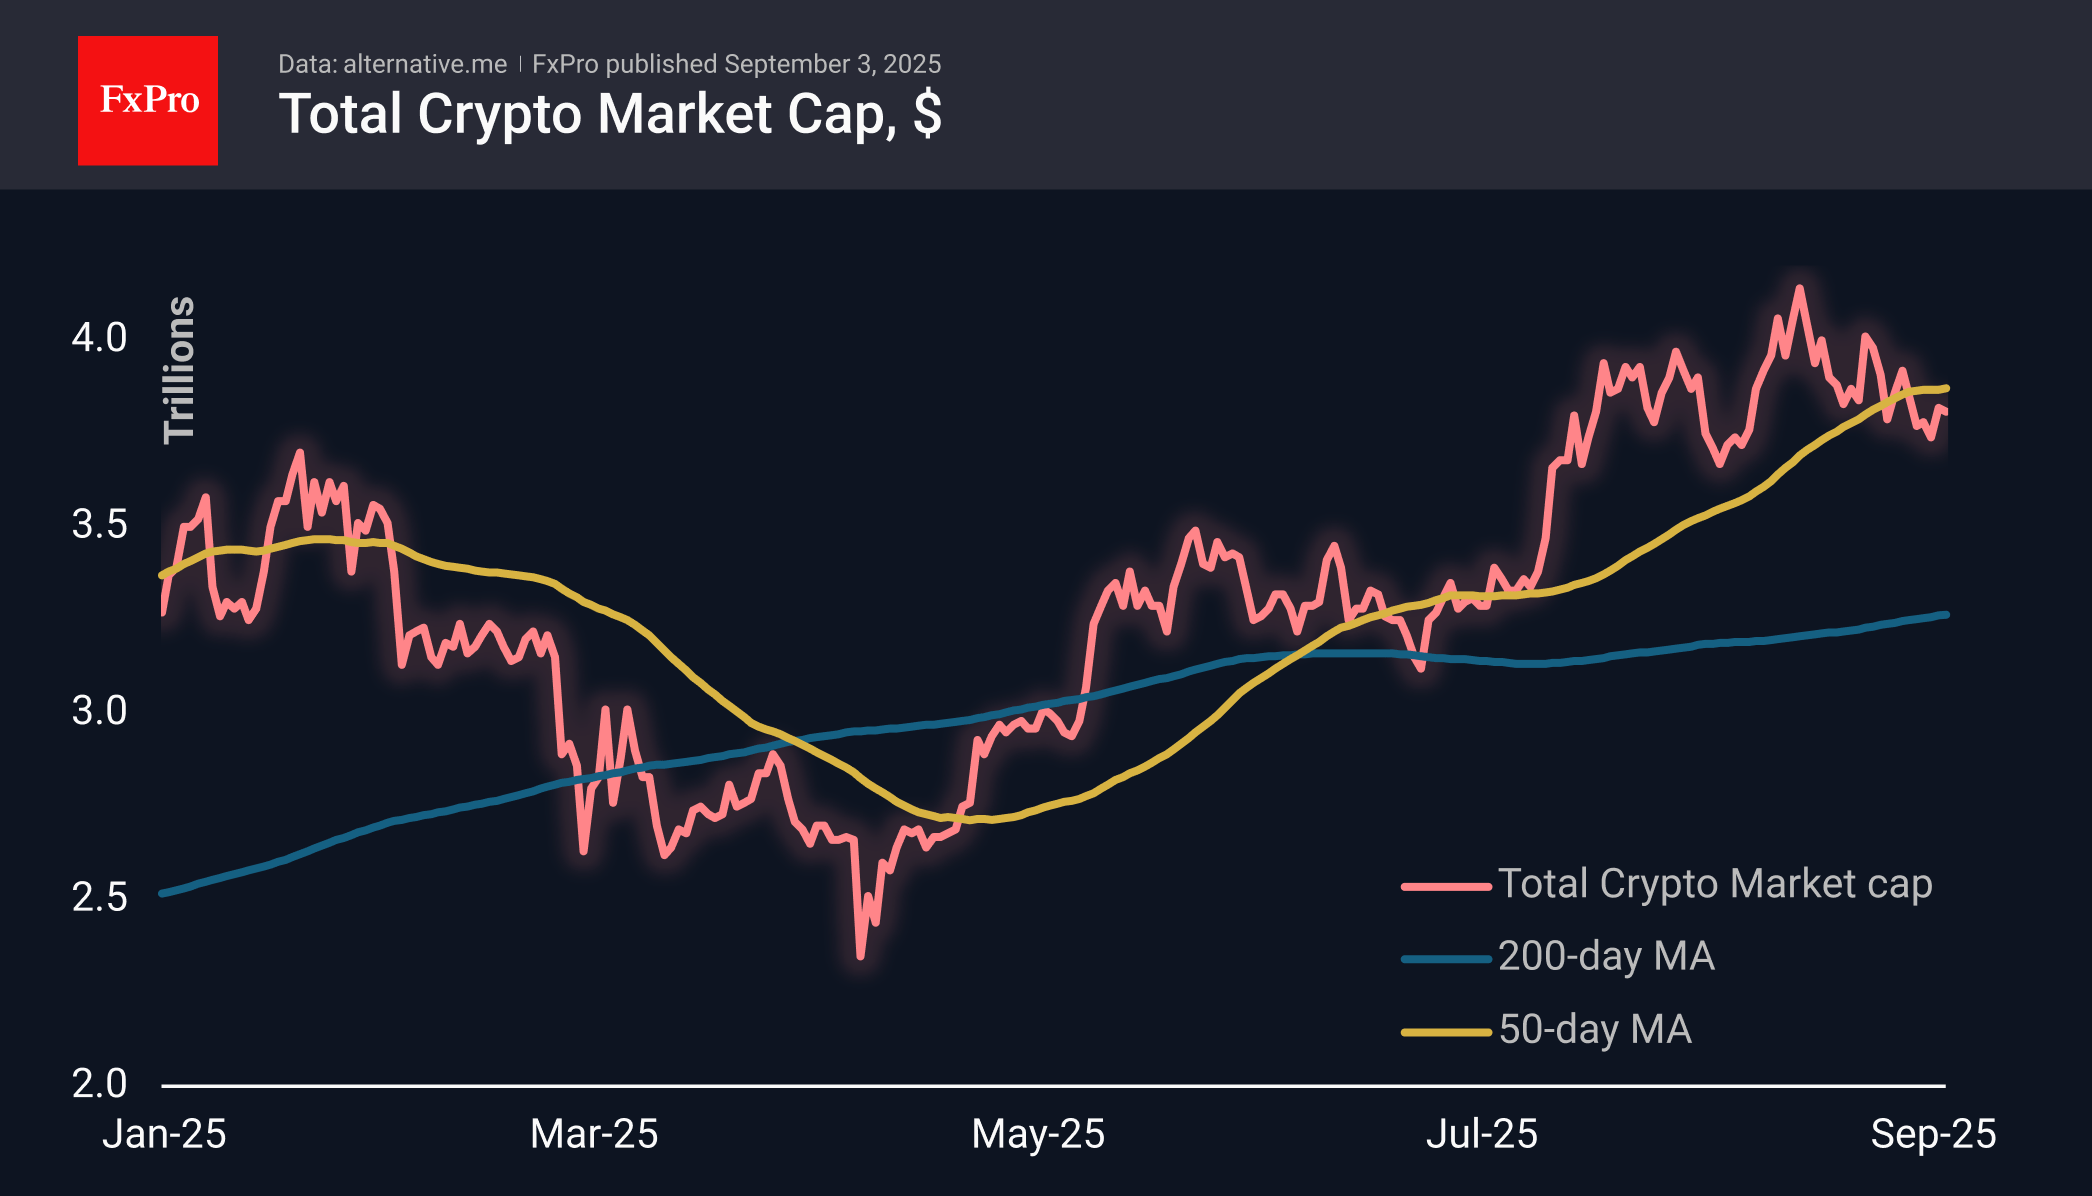
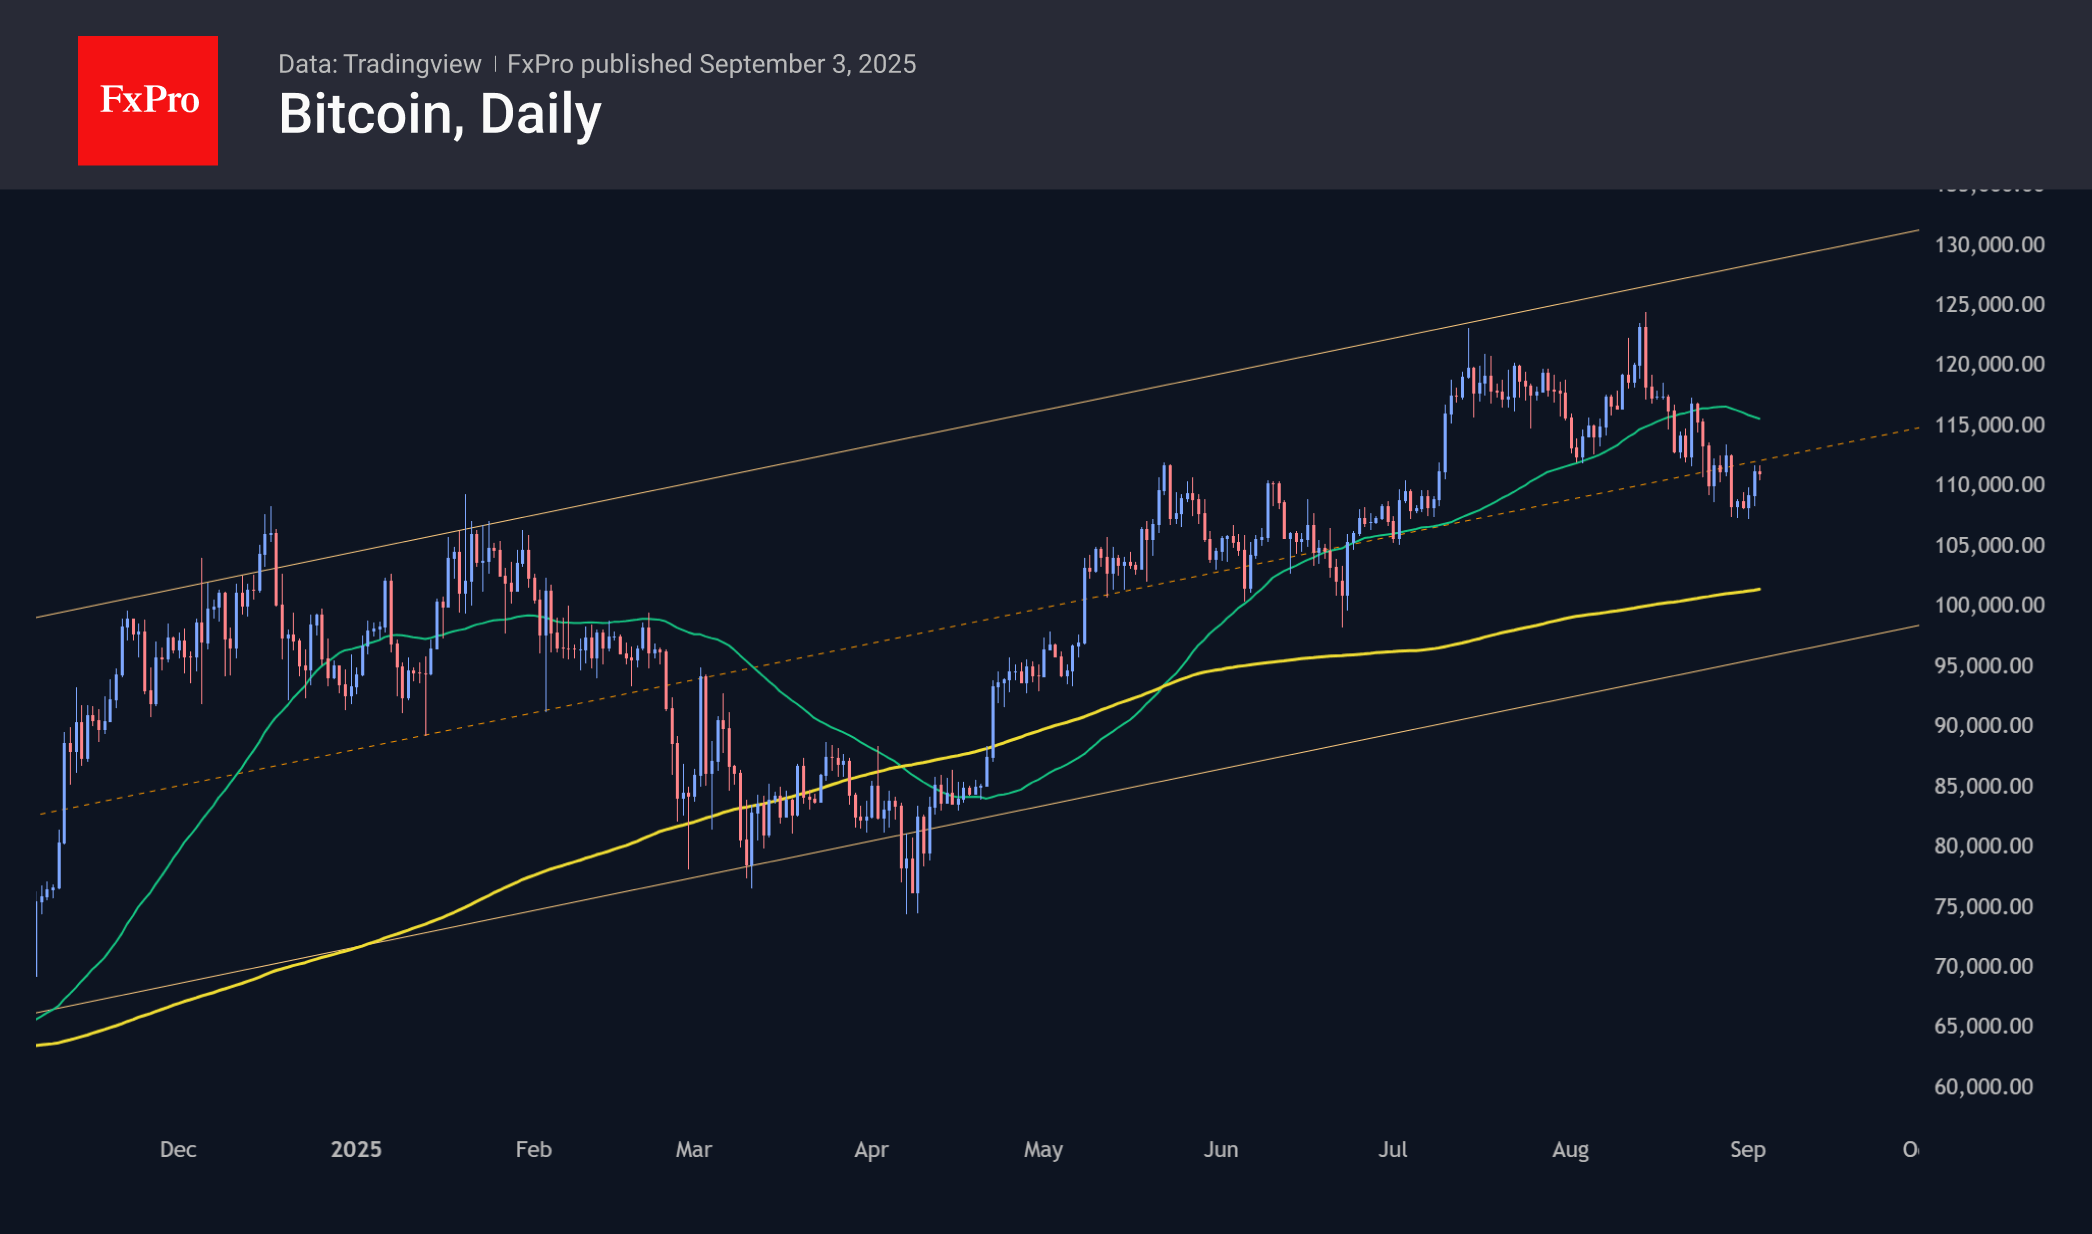
Bitcoin added 0.8% in 24 hours to $111K, bringing the 7-day change to zero and forming an upward trend since 30 August. However, a 4% increase from the lows during this time does not look like a confident bull run. Perhaps we should not expect full-fledged enthusiasm among cryptocurrencies while BTCUSD is trading below its 50-day moving average, which is currently around $115K.
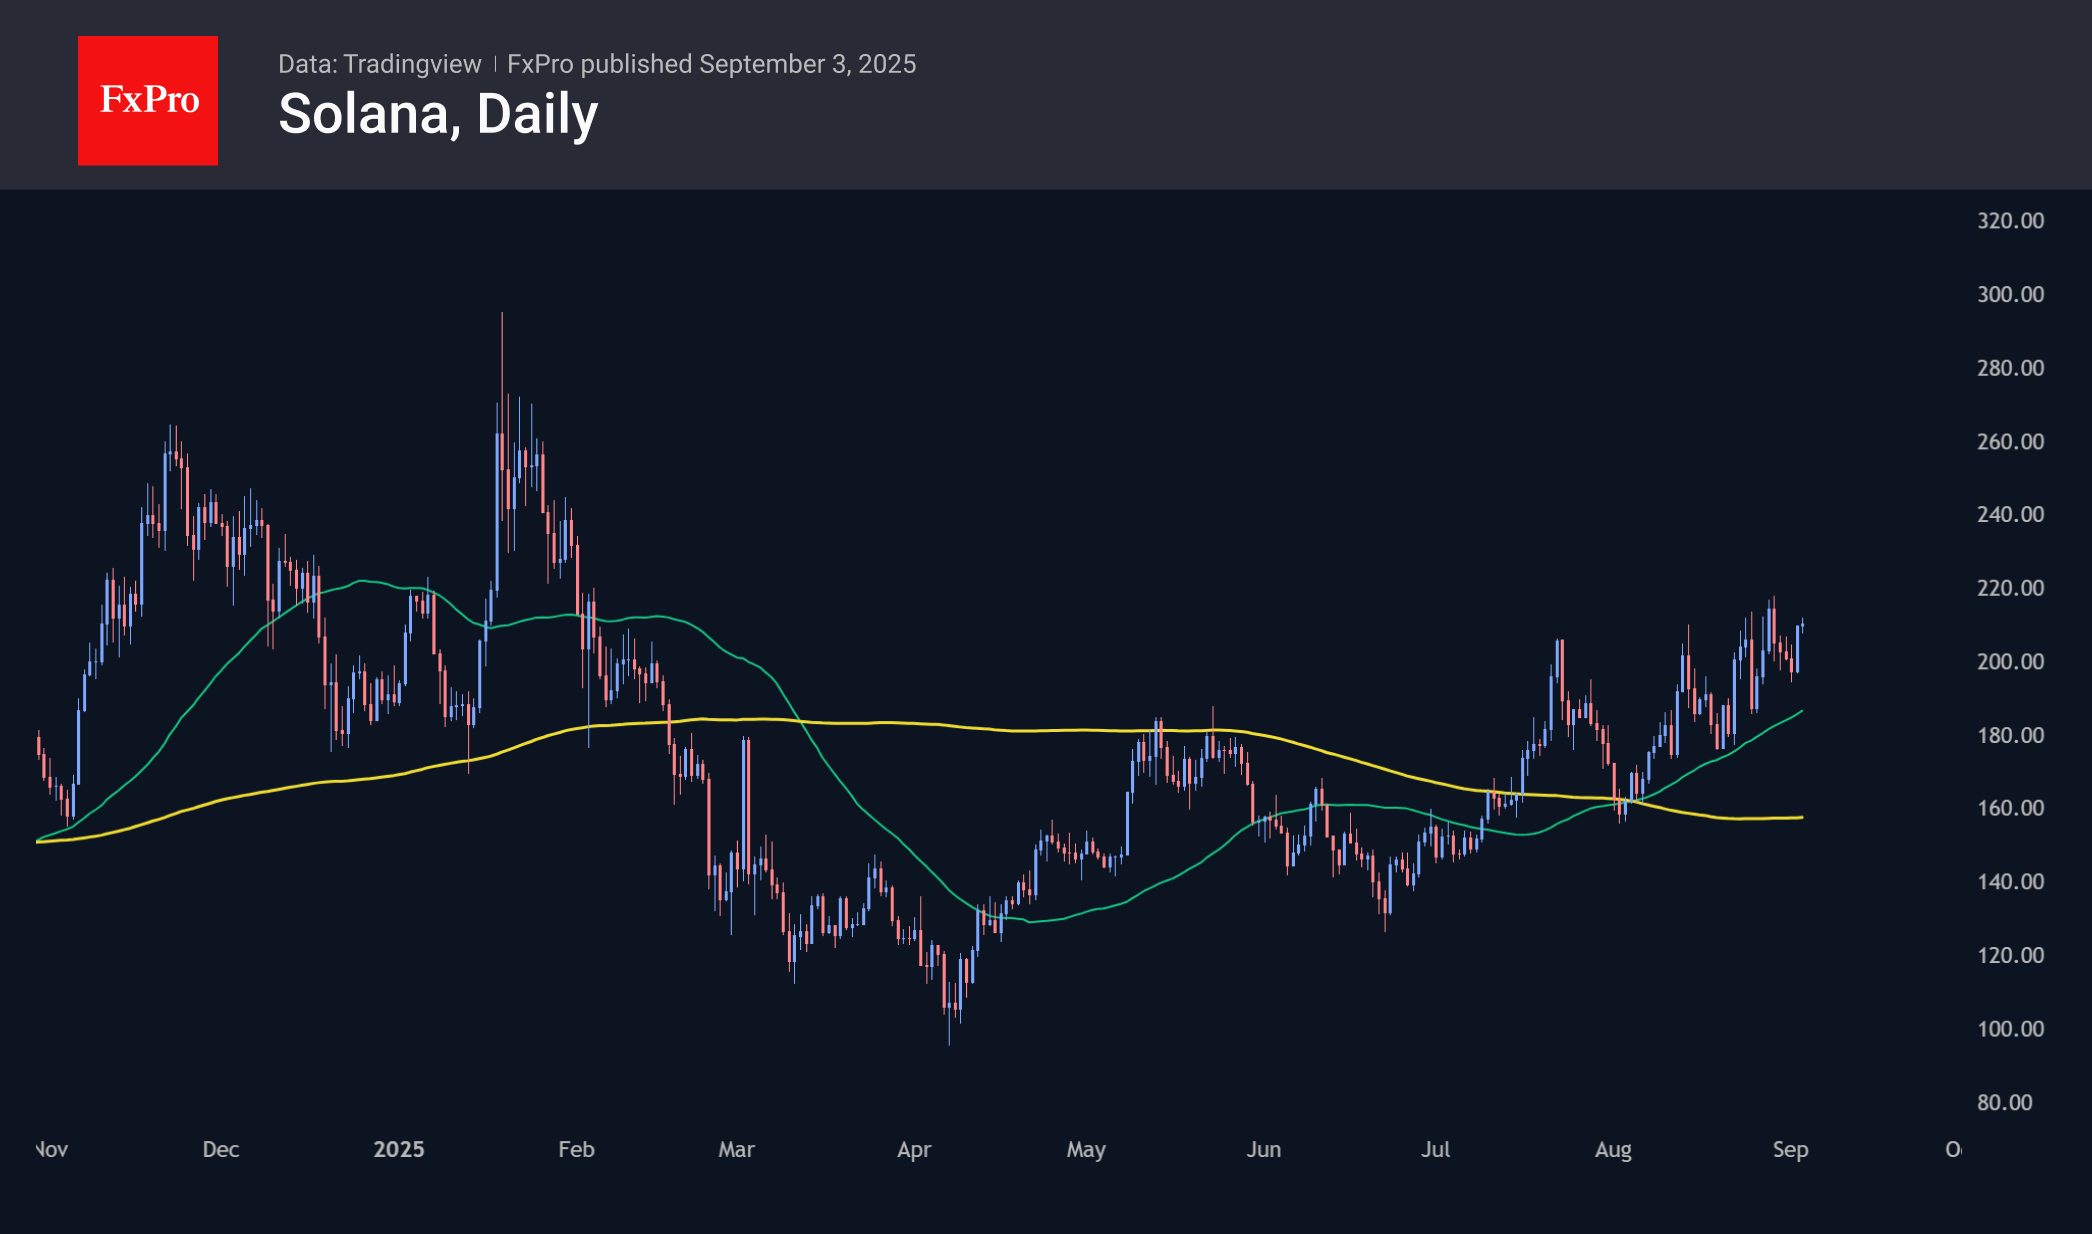
Solana is performing better than many others in the new week, trading again at $210 – the area of highs since February. Further enthusiasm in the crypto market reopens the prospects for growth towards $300, the January peak.
News Background
Strategy additionally purchased 4,048 BTC ($449.3 million) last week at an average price of $110,981 per coin, company founder Michael Saylor said. The company now owns 636,505 BTC, purchased at an average price of $73,765. The total investment is estimated at $46.95 billion.
The only reason Bitcoin is not currently at $150,000 is because of two massive whales, said Bitcoin Magazine CEO David Bailey. They have recently sold about 200,000 BTC, which has had a negative impact on cryptocurrencies.
Glassnode notes that ‘spot metrics indicate fragile demand.’ The future market situation also points to caution among players.
According to analyst Johnny Wu, the current correction in Ethereum could turn out to be a large-scale ‘bear trap’ that will end with a sharp rise in October or November. A similar scenario was observed in September 2021, but in November, ETH set a new record.
The Dogecoin Foundation has announced the creation of an official treasury of $175 million to purchase DOGE. Shares will be issued to finance the initiative. The project will be overseen by 21Shares, a crypto ETF issuer with assets of over $12 billion.