Sample Category Title
Elliott Wave Forecast: Oil (CL) Anticipating a Decline from $64.7 Level
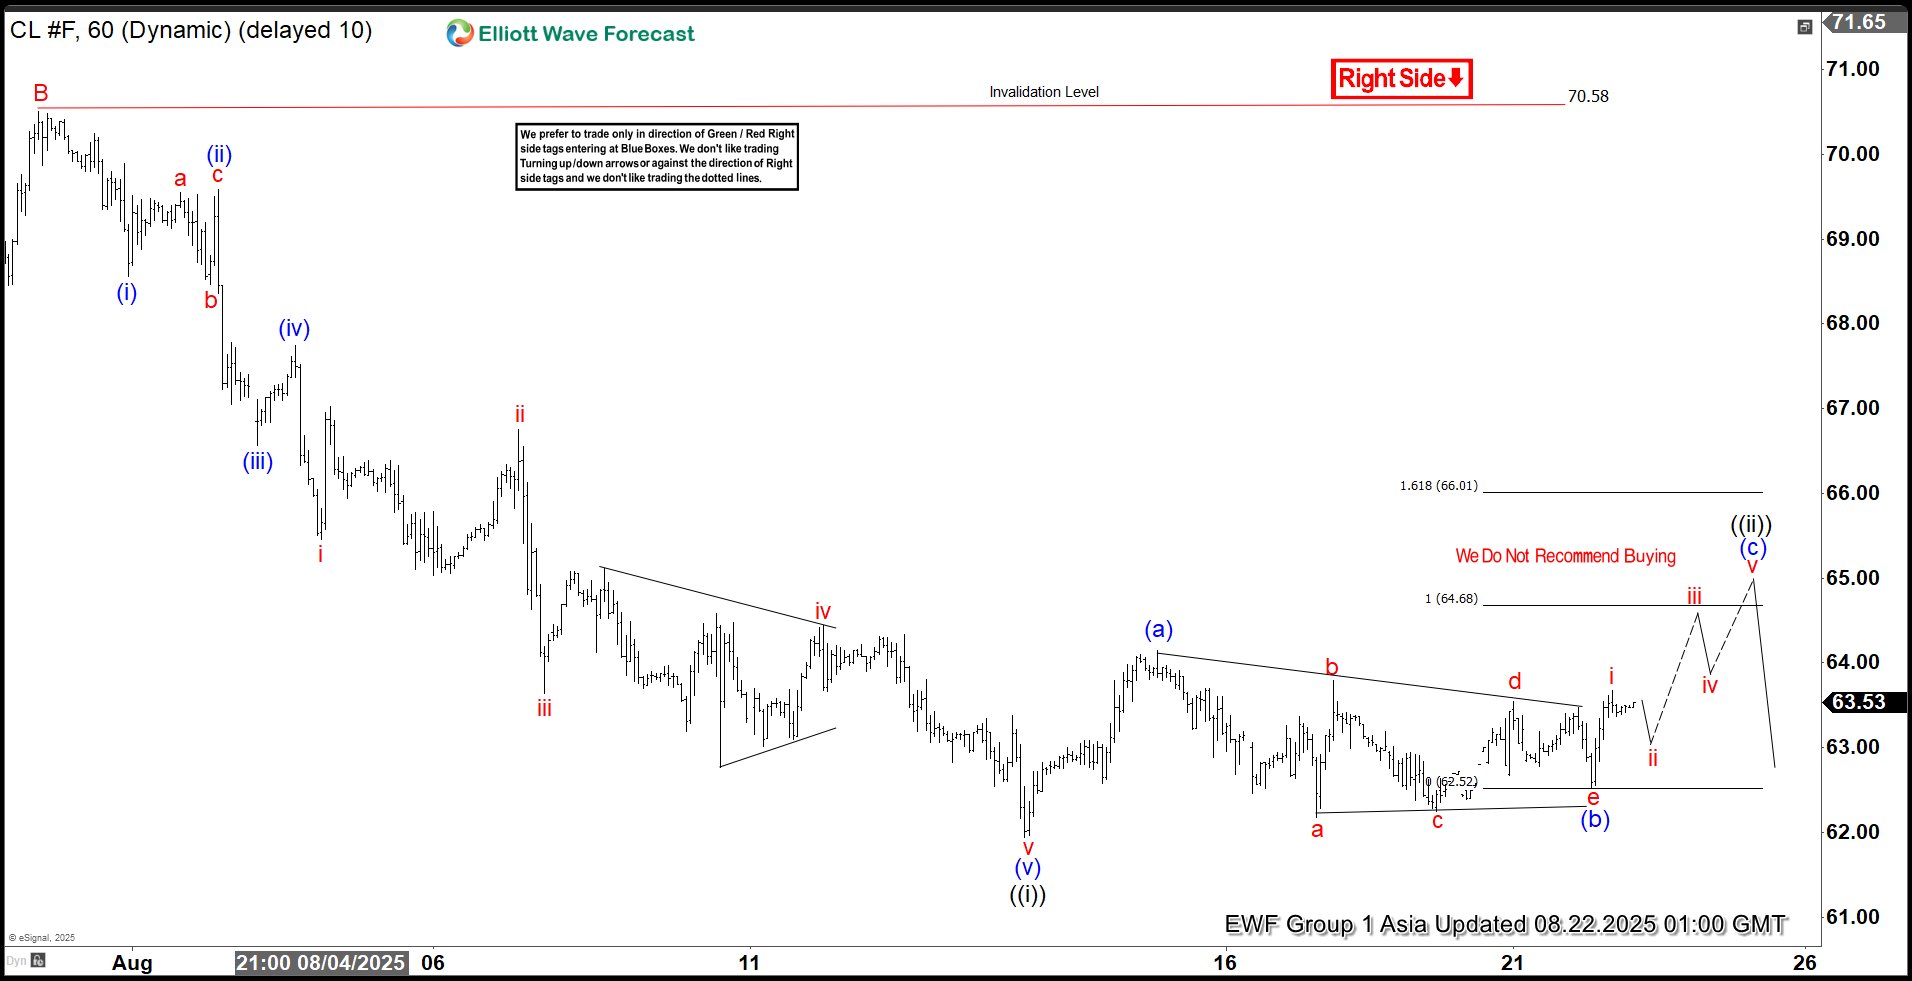
Crude oil (CL) exhibits a bearish trend following its June 23, 2025, peak, signaling further declines. The ongoing descent forms a zigzag Elliott Wave pattern. From the June high, wave A dropped to $64, while wave B rebounded to $70.58, as depicted in the accompanying one-hour chart. Wave C, now unfolding, breaks into a five-wave impulse structure. From wave B’s peak, wave (i) concluded at $68.56, followed by a wave (ii) rally to $69.58. The commodity then fell in wave (iii) to $66.56, with wave (iv) recovering to $67.74.
Currently, oil continues its decline in wave (v), reaching $61.94, completing wave ((i)) in a higher degree. A corrective rally in wave ((ii)) is underway, structured as a lesser-degree zigzag. From wave ((i)), wave (a) climbed to $64.15, followed by a wave (b) pullback forming a triangle, ending at $62.52. Wave (c) is now advancing toward the $64.68–$66.01 range, corresponding to a 100%–161.8% Fibonacci extension of wave (a), to complete wave ((ii)) before resuming the downtrend. In the near term, as long as the $70.58 pivot holds, expect corrective rallies to falter in a 3, 7, or 11-swing pattern, paving the way for further declines.
Oil (CL_F) – 60 Minute Elliott Wave Technical Chart:
CL_F – Elliott Wave Technical Video:
https://www.youtube.com/watch?v=YUbOWRARnzI
USD/JPY Holds Support Strong, Bulls Target Renewed Upside Action
Key Highlights
- USD/JPY formed a base above 146.20 and recovered some losses.
- It cleared a key contracting triangle with resistance at 147.50 on the 4-hour chart.
- EUR/USD could react to the downside if it stays below 1.1720 for a long time.
- Gold could eye a fresh upward move if it settles above $3,365.
USD/JPY Technical Analysis
The US Dollar remained supported above 146.50 against the Japanese Yen. USD/JPY formed a base and recovered above the 147.00 resistance zone.
Looking at the 4-hour chart, the pair cleared a key contracting triangle with resistance at 147.50. The pair even climbed above the 23.6% Fib retracement level of the last main decline from the 150.91 swing high to the 146.21 low.
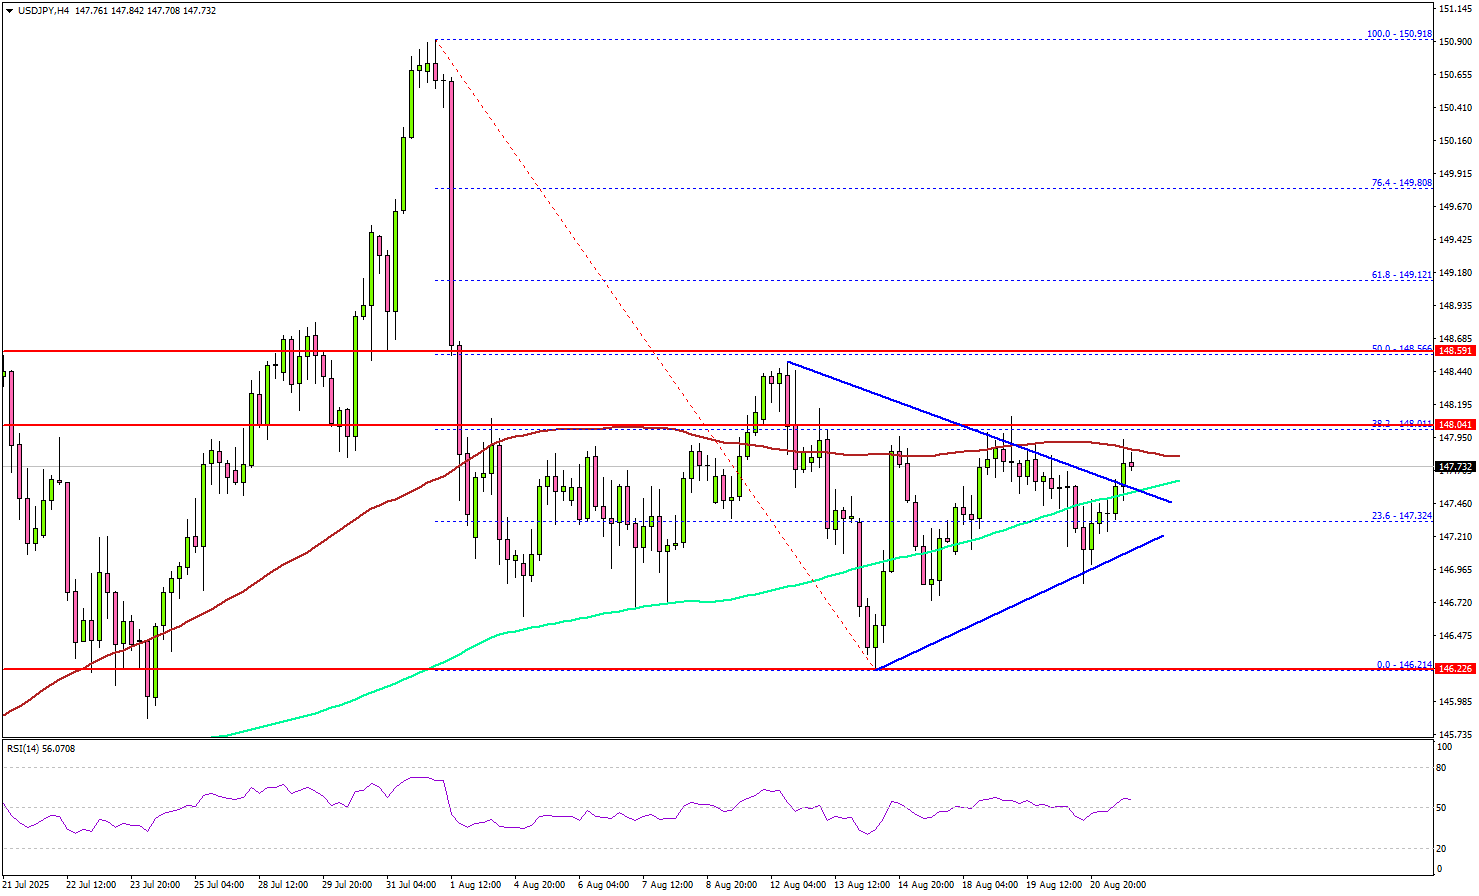
The pair is now consolidating near the 100 simple moving average (red, 4-hour) and the 200 simple moving average (green, 4-hour). On the upside, the pair now faces resistance near 148.00.
The next key resistance sits at 148.50 and the 50% Fib retracement level of the last main decline from the 150.91 swing high to the 146.21 low. A close above 148.50 could set the pace for another increase. In the stated case, the pair could rise toward 149.20, above which the bulls could aim for a move toward 150.00.
On the downside, immediate support is 147.20. The next key support sits at 146.80. Any more losses could send the pair toward the 146.20 support zone.
Looking at EUR/USD, the pair started a consolidating phase and remains below the key barrier at 1.1720.
Upcoming Key Economic Events:
- Fed's Chair Powell speech.
Cliff Notes: A Promising Trend
Key insights from the week that was.
For Australia, the only data release of note this week was the August Westpac-MI Consumer Sentiment Survey. It did not disappoint though, the headline index surging 5.7% to 98.5, the closest it has been to outright ‘optimism’ in 3½ years. This bounce in confidence follows the RBA’s 3rd rate cut of the year and the sustainable return of inflation to the middle of the target range. In the underlying detail, assessments of current family finances vs last year rose a solid 6.2%, while the analogous measure for the year ahead increased 5.4%. Consumers’ spending intentions – which are a consequence not only of current conditions but also the cumulative change in cost-of-living since the pandemic – are steadily improving but still a long way from ‘normal’ levels, ‘time to buy a major household item’ 22pts below its long-run average despite a 4.2% gain in August.
While official and Westpac estimates of consumer spending firmed through Q2, the sustainability of these gains are yet to be tested beyond the end-of-financial-year sales. Typically though, persistent improvements in sentiment and a robust labour market boost spending over time. Such an expectation is incorporated into our forecast recovery in GDP growth to 1.7%yr by end-2025 and 2.2%yr at end-2026. Our latest Quarterly Business Snapshot provides an assessment of how Australian firms are faring currently. Looking out to the medium and long term, this week’s essay by Westpac Chief Economist Luci Ellis considers the path dependency of long-run activity and productivity growth.
Turning to New Zealand, the RBNZ delivered a 25bp rate cut at their August meeting as expected, but the accompanying communications were very dovish. Near-term growth prospects have been revised down, the RBNZ’s 2025 view now 1.6%yr compared to Westpac’s 2.4%yr. However, an additional 1.5 rate cuts into year-end are, along with policy easing to date, still expected to support a robust recovery from 2026. As a consequence, the unemployment rate is expected to peak near the current level and then decline through 2026 and 2027. Our NZ economics team now expect another 2 cuts this year, while remaining of the view that higher interest rates will ultimately prove necessary to manage inflation risks from late-2026.
In the northern hemisphere, the event of the week is still to come – Chair Powell’s address the Kansas City Federal Reserve’s Jackson Hole Symposium. Market participants will put considerable effort into parsing his remarks for any guide on the path ahead for US monetary policy. That said, Chair Powell is unlikely to stray too far from the consensus opinion of the FOMC as outlined in the July FOMC minutes, particularly with a number of key data points due between now and the September meeting.
The July meeting minutes had a clear focus on inflation. "Participants judged that considerable uncertainty remained about the timing, magnitude, and persistence of the effects of this year's increase in tariffs". Though, members were clear on who is paying the price, with "a few participants [describing] a mix of strategies as being undertaken to avoid fully passing on tariff costs to customers… [including] negotiating with or switching suppliers, changing production processes, lowering profit margins, exerting more wage discipline, or exploiting cost-saving efficiency measures such as automation and new technologies.” "Regarding inflation persistence, a few participants emphasized that they expected higher tariffs to lead only to a one-time increase.... [but a] few [other] participants remarked that tariff-related factors, including supply chain disruptions, could lead to stubbornly elevated inflation and that it may be difficult to disentangle tariff-related price increases from changes in underlying trend inflation."
On the labour market, the Committee remains sanguine, "participants observ[ing] that the unemployment rate remained low and that employment was at or near estimates of maximum employment". "Several participants noted that the low and stable unemployment rate reflected a combination of low hiring and low layoffs."
On the policy outlook then, a "majority of participants judged the upside risk to inflation as the greater of these two risks". "Almost all participants agreed that, with the labor market still solid and current monetary policy moderately or modestly restrictive, the Committee was well positioned to respond in a timely way to potential economic developments."
Japan core CPI slows to 3.1% as rice inflation cools, but underlying pressures persist
Japan’s inflation slowed again in July, with core CPI (ex-fresh food) easing to 3.1% yoy from 3.3% yoy, slightly above expectations of 3.0% yoy. Headline CPI also dipped to 3.1% yoy. The moderation was driven in part by cooling rice prices, which rose 90.7% yoy after surging 100.2% yoy in June, alongside the reintroduction of energy subsidies. Together, these helped bring core inflation down from May’s 3.7% peak.
However, price pressures remain entrenched. Food inflation excluding fresh items actually quickened to 8.3% yoy from 8.2% yoy. Core-core CPI (ex-food and energy) stayed unchanged, elevated at 3.4%. Energy prices provided some relief with a -0.3% yoy annual decline, the first drop since March 2024, but this was not enough to counter stubborn underlying strength.
For policymakers at BoJ, the data paints a mixed picture: rice and energy are finally easing their grip on consumer prices, but persistently high core inflation highlights why interest rate hikes remain on the table. While inflation is clearly off its May peak, the road back toward the 2% target looks slow and uneven.
Fed’s Goolsbee cautious on cuts, Collins open to September easing
Chicago Fed President Austan Goolsbee struck a cautious tone, telling Bloomberg TV that while next month’s FOMC meeting is “live,” the recent pickup in services inflation has made him hesitant about supporting a rate cut.
He pointed to the latest CPI report, where services costs accelerated in a way “probably not driven by tariffs,” calling it a “dangerous data point” for Fed’s inflation fight.
In contrast, Boston Fed President Susan Collins signaled a greater willingness to cut rates soon, telling the Wall Street Journal she could back easing as early as September. Collins emphasized that higher tariffs could weigh on consumer purchasing power and ultimately weaken spending, while also warning that labor market risks are becoming more visible.
Collins acknowledged that she expects inflation to keep rising through the end of 2025 before easing again in 2026, but still viewed the risks to growth and employment as important factors that justify keeping the option of cuts on the table.
Fed’s Hammack: No case for rate cuts as inflation trends wrong way
Cleveland Fed President Beth Hammack signaled little appetite for near-term easing, telling Yahoo Finance that if the FOMC were meeting tomorrow she “would not see a case for reducing interest rates.” She stressed that inflation has been “too high for the past four years” and it's been "trending in the wrong direction" currently, justifying a stance that remains “modestly restrictive.”
Hammack noted that the economy has so far shown resilience, with no significant signs of downturn that would warrant easier policy. Instead, she emphasized the Fed’s responsibility to ensure inflation expectations remain anchored, cautioning that premature cuts risk undermining that effort.
On tariffs, Hammack flagged that their effects are only beginning to filter through. Typically, it takes "three to four months" for the first signs to emerge, meaning the bulk of the impact will not be seen until 2026. She expects further pass-through of higher costs next year, adding another reason to proceed cautiously on easing.
What If We Have It All Backwards?
Slow productivity growth is now recognised as not requiring tight monetary policy to keep demand in check. But what if tight monetary (and other) policies make productivity worse?
- Traditionally, economic theory has assumed that monetary policy is ‘neutral’ in the long run. That is, it can affect inflation, and short-run fluctuations in growth and the labour market but it has no implications for growth or unemployment in the long run. In Australia, the standard discourse also assumes that productivity growth is more or less fixed, or else determined by government policy. And until recently, it was assumed in many quarters that weak productivity growth meant that demand had to be constrained – by monetary and other policies – to match the weak growth in supply.
- What if we have it all backwards? A growing body of research suggests that tight monetary policy can in fact reduce long-run growth. One way this might happen is that by slowing demand, tight monetary policy reduces the incentive to invest, and thus the future capital stock and future productivity. This is on top of the ‘scarring’ effects on workers that we normally think of as long-run effects of recessions.
- We should not pick only on monetary policy here. Policies that reduce the incentive to invest in the right labour Skills and Smarts or labour-saving Stock of capital reduce future productivity growth. More broadly, we need to remember that Skills and Stocks are stocks, not flows. Short-run changes to the stock of something – whether a workforce, a capital stock or a housing stock – can have long-lasting effects on economic outcomes.
This week’s Productivity Roundtable (together with the pre-roundtable roundtables that preceded it) responds to growing concerns about slow growth in productivity and thus potential growth. There are many ways to boost potential growth: the Treasury ‘Three Ps’ of Population, Participation and Productivity. Recall that only the latter two unambiguously boost living standards, along with Price: what we get for what we sell to the world relative to how much we pay for the things we buy from the world. The recent downward revisions to the RBA’s assumptions about potential growth look to be equally split between a slowdown in trend growth in labour productivity (from 1.0%yr to 0.7%yr) and a slower rate of population growth (1.2%–1.3%) compared with the 1.5–1.6%yr rates typical in the years before the pandemic.
Recall also that labour productivity comes from labour Skills, the Stock of capital, and the Smarts involved in putting the two together (multifactor productivity). Any of the deeper drivers of productivity – be it the level of competition, regulation, technology or tax – work through one or more of these three aspects of productivity.
It has long been known that deep downturns stemming from wars and financial crises have long-running effects on future growth potential. Destruction of capital, or lack of funding for investment both weigh on the capital stock. This is on top of the long-recognised effects of deep downturns on the labour market – the ‘scarring’ effect of long-term unemployment, or of entering the labour market at the wrong moment.
More recently, it has been recognised that this kind of path dependence does not only apply to the deep downturns borne out of crisis. Some research finds that downswings in the business cycle more generally do not end with a strong cyclical bounce-back to the prior trend. It can be a slow grind, never quite getting back to the previous path.
A growing body of research (for example, here, here, here and here) also suggests that tight monetary policy affects potential growth and productivity. One way this can happen is by influencing investment decisions, which would add to the capital stock. While studies do not typically find that the level of interest rates helps predict investment directly, it does affect the level of demand. This in turn affects investment because there has to be a market for the output to make the investment worthwhile. A separate but related mechanism involves the re-allocation of capital to the most productive uses.
We can see, then, why an extended period of weak demand is so toxic: by discouraging current investment or shifts of capital into the most productive uses, it reduces the capacity to meet future demand. The fires of recession (and plain old soggy growth) are not cleansing – they are just destructive. Unfortunately, the same literature generally finds that loose monetary policy does not directly add to capacity in the long run, though a short-run boost to productivity from reallocation is implied by some models.
This is why the RBA’s pivot to no longer believing that weak productivity growth requires it to tamp down demand is so consequential – and so welcome. That change of heart avoids what could have become a significant policy error.
We should not only pick on monetary policy here. Other policies might also contribute to a low productivity growth malaise. Consider the skilled migration program. While it is widely admired as being targeted on skills shortages and effective in its operations, an issue arises where a skill shortage is defined to be any moment where you cannot find the right person at the current wage. If you can obtain an essentially infinite supply of people with the necessary skills from offshore at the current wage rate, why try to entice the local worker with a somewhat higher wage? And more to the point, why train local workers, or invest in labour-saving capital when you can always get someone from offshore at the current wage rate?
This suggests that it would help to set the bar for defining a skills shortage higher than the current wage rate. That would let local market forces take some of the adjustment. It would also ensure that firms sometimes have an incentive to invest in labour-saving technology – the Stock of capital – or better processes – the Smarts around how labour and capital combine.
The broader point here is that policy discussions need to allow for long-running consequences coming from things that are a stock – a quantity at a point in time like the number of workers with a particular skill, or the number of homes – rather than a flow, such as the amount of consumer spending in a quarter. The Stock of capital and the Skills of workers are stocks of this kind. The Smarts of the way we design our business processes are also long-lasting. Flows, by contrast, are inherently more ephemeral.
Getting things wrong with the stocks is far more consequential than the problems that many current policy proposals are designed to fix.
Gold (XAU/USD) Eyes $3383/oz After Bullish Pennant Breakout. Will Fed Chair Powell Add Fuel to the Rally?
Gold prices have remained choppy this week with the precious metal remaining in the range between $3300-$3350/oz for the majority of the week. Two key levels which for now it appears buyers and sellers are defending ahead of the Jackson Hole Symposium and Geopolitical developments.
Strong US PMI Data Fails to Inspire Breakout
A strong PMI release may have just aided Fed Chair Jerome Powell. The S&P Global US Composite PMI rose to 55.4 in August 2025, up from 55.1 in July, showing growth for the 31st straight month, according to flash estimates.
This was also the fastest growth seen this year. The services sector continued to grow strongly, though activity slightly slowed from July’s peak (55.4 vs 55.7). Meanwhile, manufacturing bounced back, with the PMI rising to 53.3 from 49.8 in July, its highest level since May 2022.
Hiring picked up, with job creation hitting one of the fastest rates in three years. Businesses also reported the biggest backlog of unfinished work since May 2022.
Now all of this sounds like a solid economy and looking at the data more closely we see a few other interesting points.
S&P Global’s Chris Williamson noted the survey also showed mounting inflation pressures. Businesses are increasingly passing tariff-related costs through to consumers, and the PMI price indices are now running at their highest levels in three years. Selling prices for goods and services have moved higher, suggesting that consumer inflation will “rise further above the Fed’s 2% target in the coming months.
The PMI results create more uncertainty for the Fed. Instead of supporting the idea of immediate rate cuts, the data suggest the economy is closer to conditions that typically lead to rate hikes.
“With increased business activity, hiring, and rising prices shown in the survey, the PMI data lean more toward rate hikes than cuts,” Williamson explained.
The move did lead to an immediate bounce for the US Dollar Index which has since continued its advance. However as has been the case with Gold of late, the precious metal saw an immediate drop but has since recovered to a near daily high at $3345/oz.
This highlights the indecision in Gold at the moment with market participants likely keeping an eye on the Jackson Hole Symposium and Fed Chair Powell.
Jackson Hole and Gold Prices Moving Forward
Heading into Fed Chair Jerome Powell's speech at Jackson Hole tomorrow Gold appears in desperate need of a catalyst.
The Russia-Ukraine situation has a lot of variables to contend with before an actual peace deal may be agreed. Thus geopolitical risk premium is likely to remain in play in the near-term.
This leaves monetary policy, where like we discussed above today's PMI data has created more uncertainty for the Fed. The FED minutes also did not really provide anything new to the equation so will there be sparks tomorrow or will the market reaction be muted?
Technical Analysis - Gold (XAU/USD)
Technical analysis paints a nice picture for bulls though with a break of a bullish pennant pattern which was in play.
If you believe the old trading adage ‘technicals hint at what's to come from the fundamentals’ then the question is, are we getting a hint of a dovish speech by Fed Chair Powell tomorrow?
From a technical standpoint, Gold has broken the bullish pennant on the four-hour chart. A pullback and retest occurred today so Gold is on its way toward a potential target of $3383/oz.
There is significant resistance just ahead which Gold needs to overcome. The 50 and 100-day MA rest at 3343 and 3348 respectively and at this stage are providing a significant hurdle.
Supporting a bullish narrative is the period-14 RSI remains above the 50 level which hints that the momentum remains bullish.
Gold (XAU/USD) Daily Chart, August 21, 2025
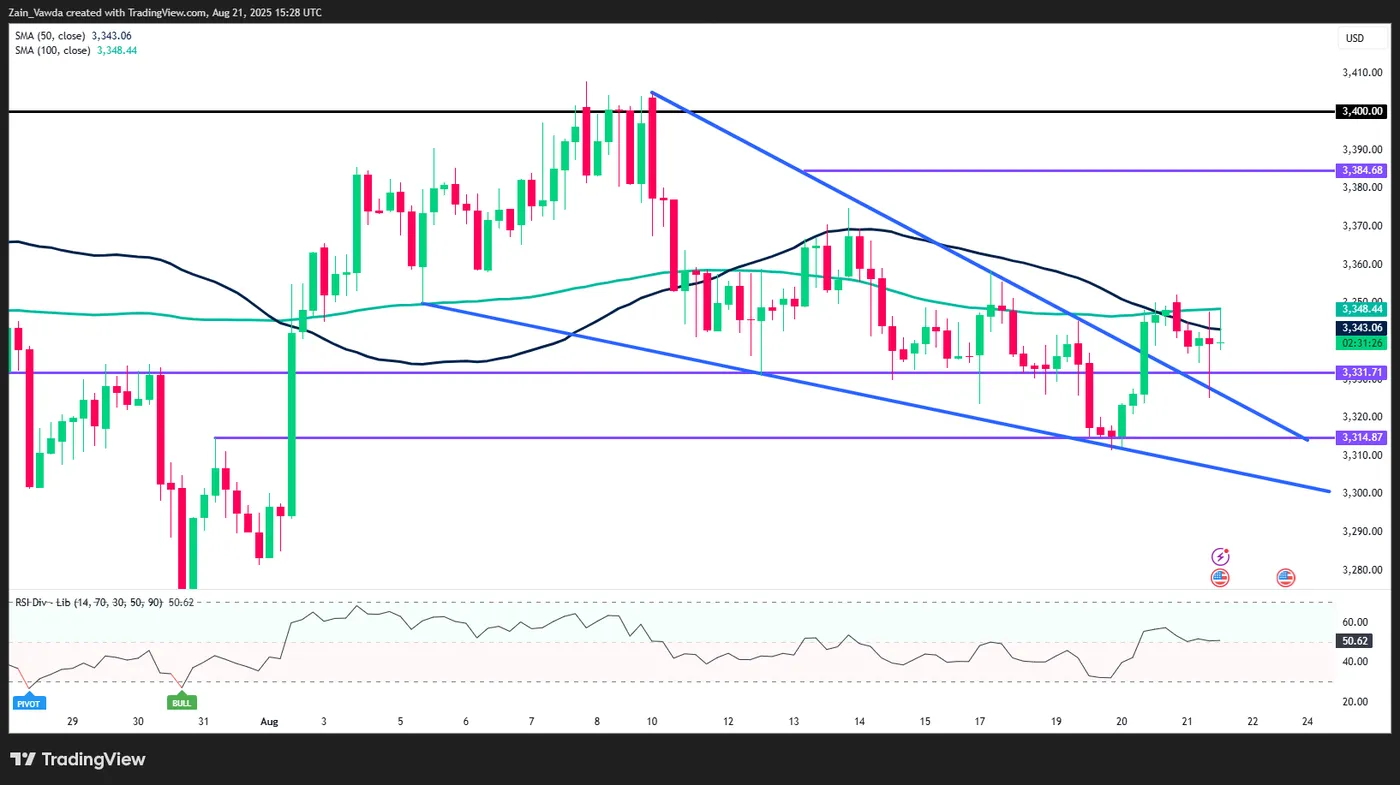
Source: TradingView (click to enlarge)
Client Sentiment Data - XAU/USD
Looking at OANDA client sentiment data and market participants are Long on Gold with 70% of traders net-long. I prefer to take a contrarian view toward crowd sentiment and thus the fact that the majority of traders are net-long suggests that Gold prices could continue to slide in the near-term.
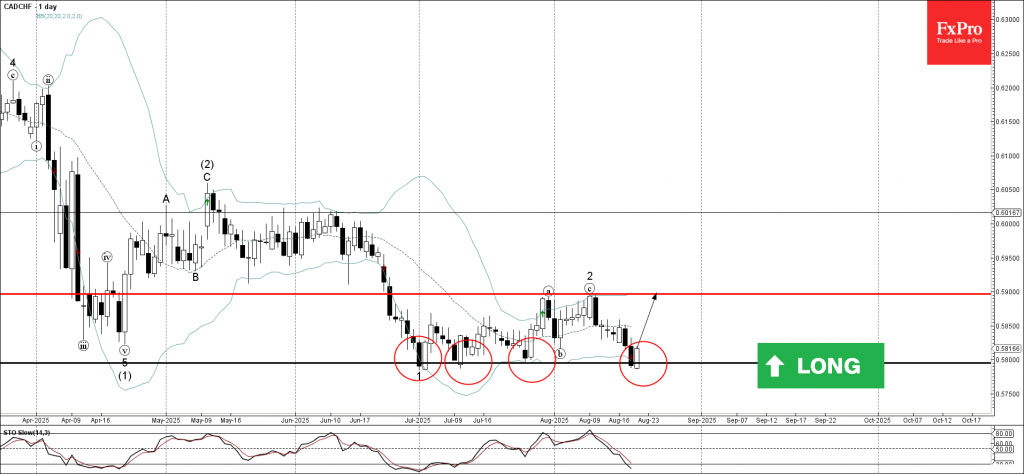
CADCHF Wave Analysis
CADCHF: ⬆️ Buy
- CADCHF reversed from support level 0.5800
- Likely to rise to resistance level 0.5900
CADCHF currency pair recently reversed from the support area between the key support level 0.5800 (which has been reversing the price from June) and the lower daily Bollinger Band.
The upward reversal from this support zone created the daily Japanese candlesticks reversal pattern Piercing Line.
CADCHF currency pair can be expected to rise to the next resistance level 0.5900, which stopped the previous waves a and 2.
Brent Crude Oil Wave Analysis
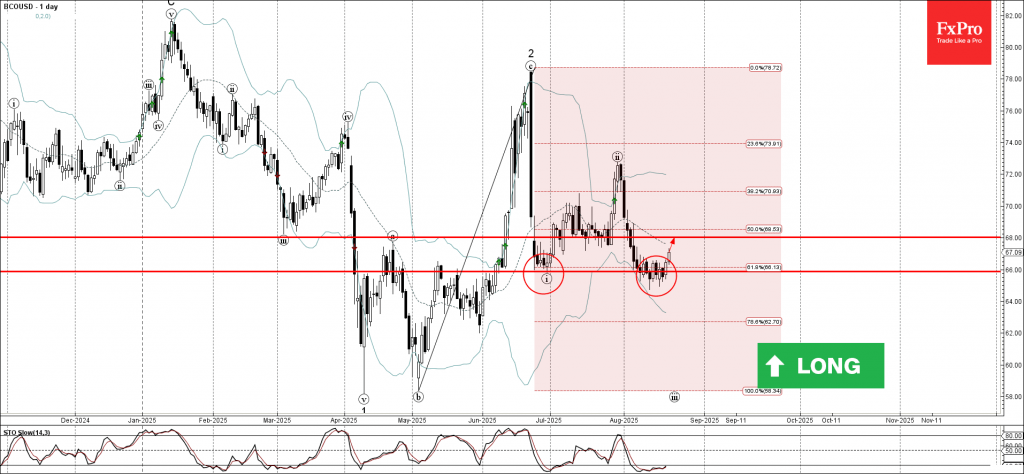
Brent Crude Oil: ⬆️ Buy
- Brent Crude Oil reversed from support area
- Likely to rise to resistance level 68.00
Brent Crude Oil recently reversed from the support area between the support level 66.00 (which has been reversing the price from June) and the lower daily Bollinger Band.
The support level 66.00 was further strengthened by the intersecting 61.8% Fibonacci correction level of the previous impulse wave c.
Brent Crude Oil can be expected to rise to the next resistance level 68.00, which is the former strong support from July.