Sample Category Title
Gold (XAU/USD) Eyes $3383/oz After Bullish Pennant Breakout. Will Fed Chair Powell Add Fuel to the Rally?
Gold prices have remained choppy this week with the precious metal remaining in the range between $3300-$3350/oz for the majority of the week. Two key levels which for now it appears buyers and sellers are defending ahead of the Jackson Hole Symposium and Geopolitical developments.
Strong US PMI Data Fails to Inspire Breakout
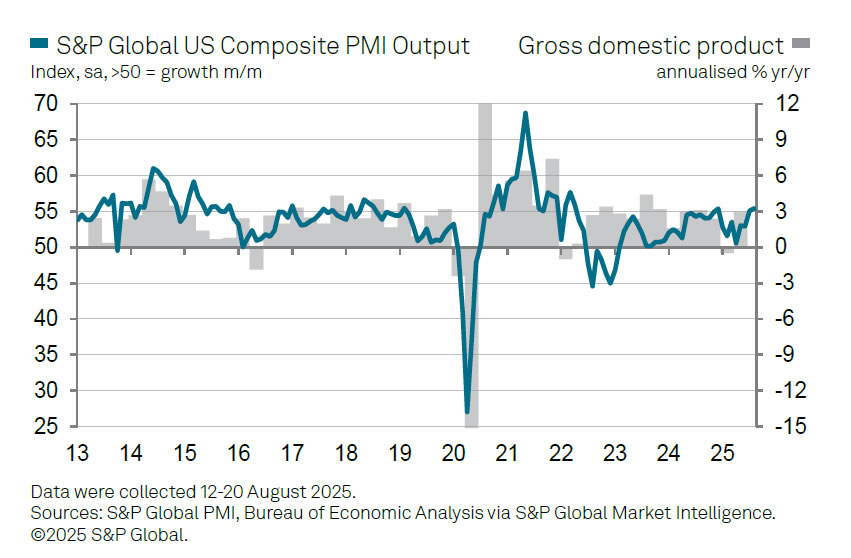
A strong PMI release may have just aided Fed Chair Jerome Powell. The S&P Global US Composite PMI rose to 55.4 in August 2025, up from 55.1 in July, showing growth for the 31st straight month, according to flash estimates.
This was also the fastest growth seen this year. The services sector continued to grow strongly, though activity slightly slowed from July’s peak (55.4 vs 55.7). Meanwhile, manufacturing bounced back, with the PMI rising to 53.3 from 49.8 in July, its highest level since May 2022.
Hiring picked up, with job creation hitting one of the fastest rates in three years. Businesses also reported the biggest backlog of unfinished work since May 2022.
Now all of this sounds like a solid economy and looking at the data more closely we see a few other interesting points.
S&P Global’s Chris Williamson noted the survey also showed mounting inflation pressures. Businesses are increasingly passing tariff-related costs through to consumers, and the PMI price indices are now running at their highest levels in three years. Selling prices for goods and services have moved higher, suggesting that consumer inflation will “rise further above the Fed’s 2% target in the coming months.
The PMI results create more uncertainty for the Fed. Instead of supporting the idea of immediate rate cuts, the data suggest the economy is closer to conditions that typically lead to rate hikes.
“With increased business activity, hiring, and rising prices shown in the survey, the PMI data lean more toward rate hikes than cuts,” Williamson explained.
The move did lead to an immediate bounce for the US Dollar Index which has since continued its advance. However as has been the case with Gold of late, the precious metal saw an immediate drop but has since recovered to a near daily high at $3345/oz.
This highlights the indecision in Gold at the moment with market participants likely keeping an eye on the Jackson Hole Symposium and Fed Chair Powell.
Jackson Hole and Gold Prices Moving Forward
Heading into Fed Chair Jerome Powell's speech at Jackson Hole tomorrow Gold appears in desperate need of a catalyst.
The Russia-Ukraine situation has a lot of variables to contend with before an actual peace deal may be agreed. Thus geopolitical risk premium is likely to remain in play in the near-term.
This leaves monetary policy, where like we discussed above today's PMI data has created more uncertainty for the Fed. The FED minutes also did not really provide anything new to the equation so will there be sparks tomorrow or will the market reaction be muted?
Technical Analysis - Gold (XAU/USD)
Technical analysis paints a nice picture for bulls though with a break of a bullish pennant pattern which was in play.
If you believe the old trading adage ‘technicals hint at what's to come from the fundamentals’ then the question is, are we getting a hint of a dovish speech by Fed Chair Powell tomorrow?
From a technical standpoint, Gold has broken the bullish pennant on the four-hour chart. A pullback and retest occurred today so Gold is on its way toward a potential target of $3383/oz.
There is significant resistance just ahead which Gold needs to overcome. The 50 and 100-day MA rest at 3343 and 3348 respectively and at this stage are providing a significant hurdle.
Supporting a bullish narrative is the period-14 RSI remains above the 50 level which hints that the momentum remains bullish.
Gold (XAU/USD) Daily Chart, August 21, 2025
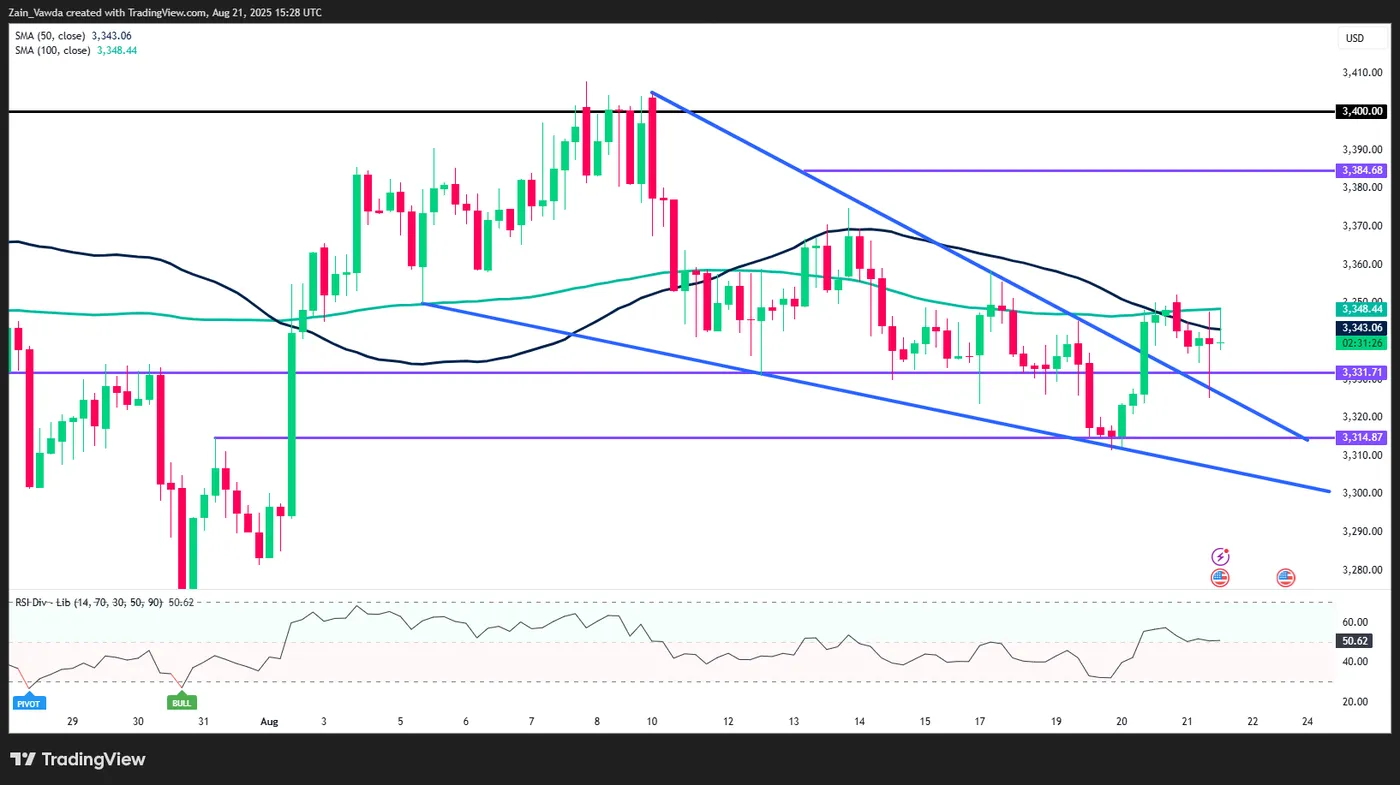
Source: TradingView (click to enlarge)
Client Sentiment Data - XAU/USD
Looking at OANDA client sentiment data and market participants are Long on Gold with 70% of traders net-long. I prefer to take a contrarian view toward crowd sentiment and thus the fact that the majority of traders are net-long suggests that Gold prices could continue to slide in the near-term.
CADCHF Wave Analysis
CADCHF: ⬆️ Buy
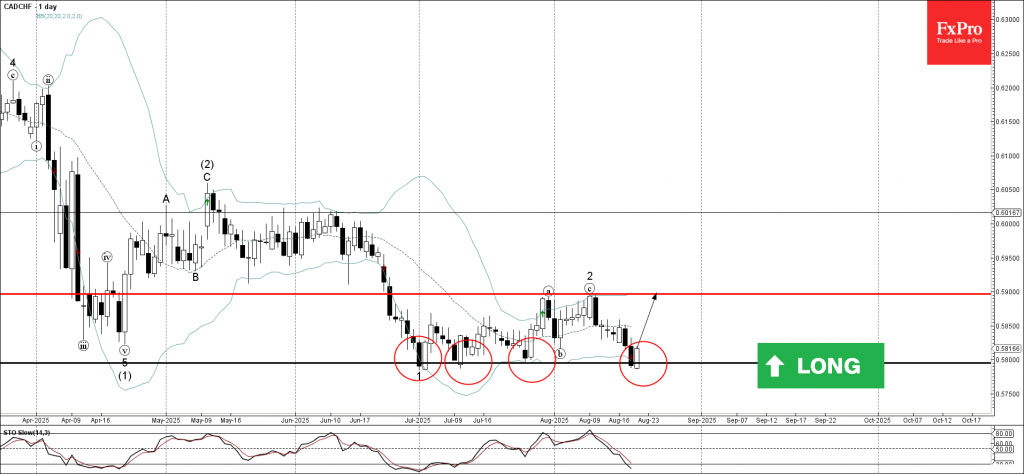
- CADCHF reversed from support level 0.5800
- Likely to rise to resistance level 0.5900
CADCHF currency pair recently reversed from the support area between the key support level 0.5800 (which has been reversing the price from June) and the lower daily Bollinger Band.
The upward reversal from this support zone created the daily Japanese candlesticks reversal pattern Piercing Line.
CADCHF currency pair can be expected to rise to the next resistance level 0.5900, which stopped the previous waves a and 2.
Brent Crude Oil Wave Analysis
Brent Crude Oil: ⬆️ Buy
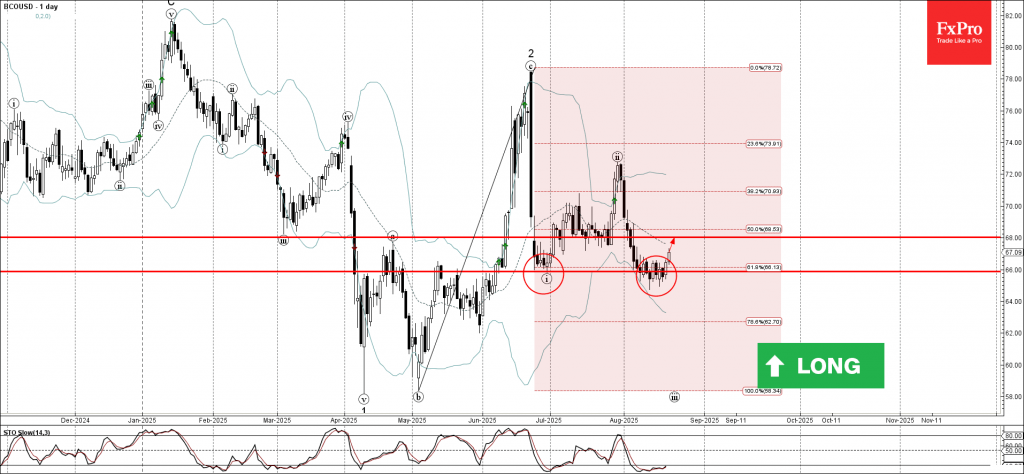
- Brent Crude Oil reversed from support area
- Likely to rise to resistance level 68.00
Brent Crude Oil recently reversed from the support area between the support level 66.00 (which has been reversing the price from June) and the lower daily Bollinger Band.
The support level 66.00 was further strengthened by the intersecting 61.8% Fibonacci correction level of the previous impulse wave c.
Brent Crude Oil can be expected to rise to the next resistance level 68.00, which is the former strong support from July.
UK Services PMI Improves, Pound Continues Losing Streak
The British pound is down for a fourth straight day and has dropped 0.9% this week. In the North American session, GBP/USD is trading at 1.3432, down 0.16% on the day.
The UK was scheduled to release July retail sales on Friday, with a market estimate of 0.4%, but that has been delayed until September 5.
UK PMIs: services accelerates, manufacturing weakens
UK PMIs were a mixed bag in August. The Services PMI improved to 53.6, up from 51.8 in July and above the market estimate of 51.8. Business activity rose for a fourth straight month and hit its fastest pace in a year. There was an increase in new orders and business confidence rose on expectations that consumer demand will improve.
The manufacturing sector continues to struggle and the contraction worsened in August. The PMI fell to 47.3 in August from 48.0 in July. New orders decreased and employment losses deepened as the uncertainty over US tariffs has resulted in subdued global demand. The silver lining was that manufacturers' optimism improved.
Fed minutes points to split
The Federal Reserve released the minutes of the July meeting on Wednesday. The Fed didn't surprise anyone by maintaining rates but the meeting made headlines when two FOMC members voted against the majority in favor of a rate cut. This was the first time in over 30 years that more than one member has voted against a rate decision.
The minutes noted the differing views on the Fed's dual mandate of inflation and employment. The economy faces an upside risk to inflation and a downside risk to employment, complicating rate decisions. At the meeting, the majority judged higher inflation as the greater risk while the minority believed that the deterioration in the labour market was the greater risk.
The Fed is expected to lower rates in September for the first time since December 2024, with an 80% probability of a quarter-point cut according to CME's FedWatch.
GBP/USD Technical
- GBPUSD is testing support at 1.3431. Below, there is support at 1.3416
- There is resistance at 1.3457 and 1.3472
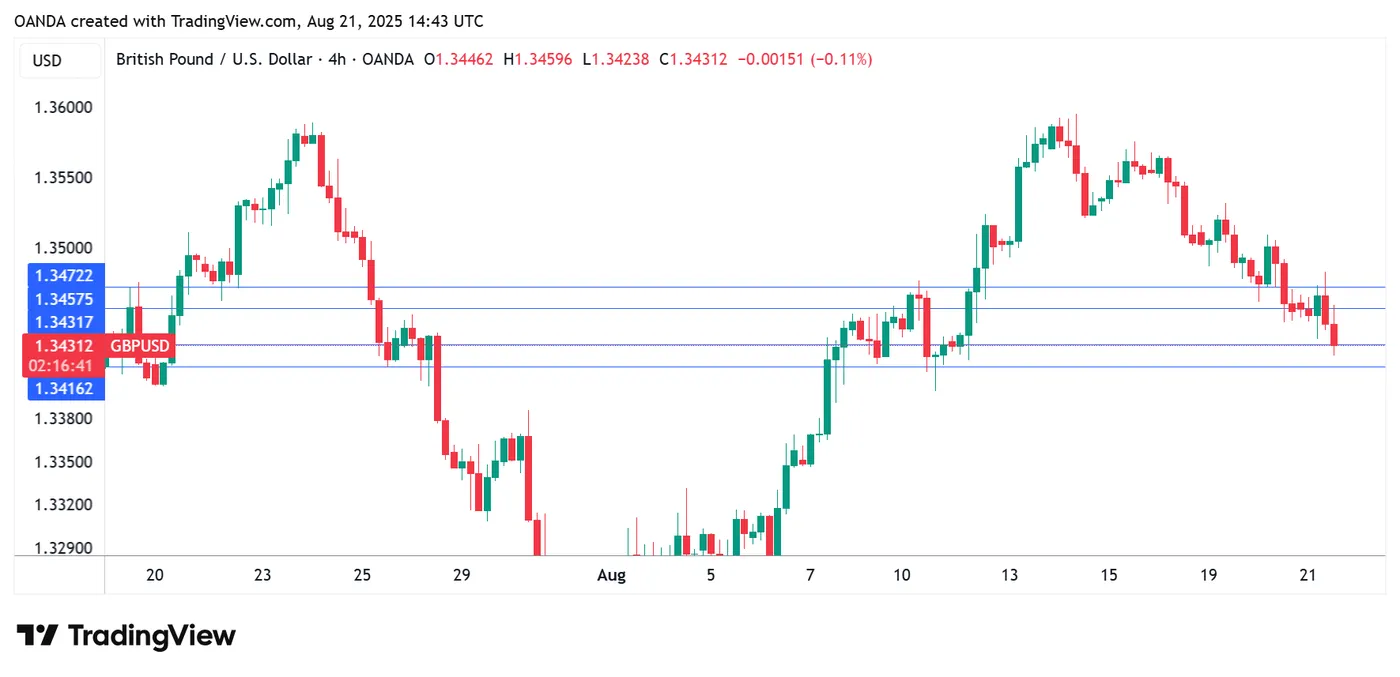
GBPUSD 4-Hour Chart, Aug. 21, 2025
Japan’s Inflation Rate Expected to Ease, Yen Dips
The Japanese yen is slightly lower on Thursday. In the European session, USD/JPY is trading at 147.87, up 0.39% on the day.
Japan's inflation expected to continue slowing
Japan releases the July inflation report on Friday. The markets will be especially interested in the core rate, which is expected to ease to 3.0% y/y, from 3.3% in June. Core CPI includes energy but excludes fresh food
Core CPI has remained above the Bank of Japan's 2% target for over three years but the central bank has been slow to raise interest rates. BoJ Governor Ueda has said that the Bank will not raise rates until underlying inflation, which is generated by domestic demand and wages, is sustainably at 2%.
The BoJ raised rates to 0.5% in January but took its foot off the rate-hike pedal when Donald Trump became President and imposed a hard-hitting tariff policy which shook up the financial markets. Now that the US and Japan have reached a trade agreement and greatly reduced the uncertainty over tariffs, a major obstacle to raising rates has been removed.
Fed minutes point to dissension
The Federal Reserve released the minutes of the July meeting on Wednesday. The Fed's decision at the meeting to maintain rates was widely expected but the meeting made headlines when two FOMC members went against the majority and voted for a rate cut. This was the first time in over 30 years that more than one member voted against a rate decision.
The minutes reflected this dissension, noting the differing views on the Fed's dual mandate of inflation and employment. The economy faces an upside risk to inflation and a downside risk to employment, complicating rate decisions. At the meeting, the majority judged higher inflation as the greater risk while the minority believed that the deterioration in the labour market was the greater risk.
The Fed is widely expected to lower rates in September, after holding rates since December 2024.
USD/JPY
- USD/JPY has pushed above resistance at 147.33 and is testing 147.79 Above, there is resistance at 148.28
- 146.84 and 146.38 are providing support
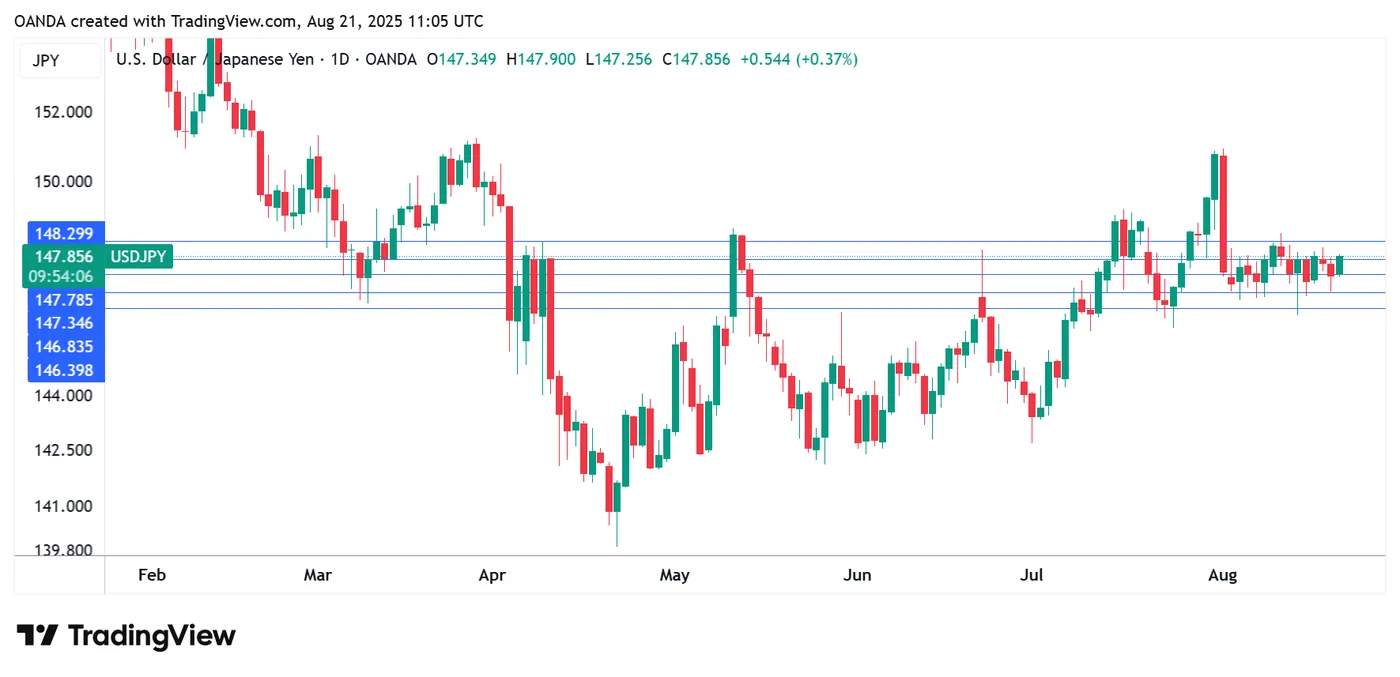
USDJPY 1-Day Chart, Aug. 21, 2025
Sunset Market Commentaryt
Markets
The HCOB flash Eurozone PMI’s provided a guarded, but after all constructive picture as the economy navigates a new era post the EU-US trade deal. The output composite index increased to from 50.9 to 51.1, the best in 15 months and marking an eight consecutive month of expansion. According to S&P global, the improvement was driven by a further solid improvement in the manufacturing output (output index 52.3; 41 month high). Services activity also rose, albeit only slightly (50.7) and at a slower pace compared to July. Promising: new orders returned to growth for the first time after 14 months of decline, with new business increasing slightly both in the manufacturing and services sectors even as exports orders continue to decline. Better activity and orders also caused companies to extend the recent sequence of job creation, be it at a modest pace and limited to the services sector. The report also mentions inflationary pressures to have picked up in August, with both input and out prices increasing at a faster pace than last month. Despite the rather positive current assessment, business confidence eased for the second consecutive month, suggesting ongoing uncertainty going forward. Regarding the major countries, activity in Germany expanded further (50.9). France neared stabilization (49.8). The rest of the Eurozone continued to register increasing output, albeit with the pace of growth easing slightly from July. After some ‘hesitation’ this week, German yields are again trending north, rising between 4 bps (2-5-y) and 3 bps (30-y). The PMI report provides a perfect narrative for the ECB to adhere a ‘sine die’ policy pause. Markets further scaled back expectations on a final ECB rate cut to about 60% somewhere next year. The Eurostoxx 50 cedes 0.5%. US indices also continue their recent correction (S&P 500 -0.45%). UK yields rebounded after yesterday’s surprise (higher inflation) setback on a decent UK PMI (cf infra) and better than expected monthly UK government budget data. While positive, the latter are highly volatile. Sterling gains marginally against the single currency (EUR/GBP 0.8653).
US data evidently still face a long shadow from tomorrow’s Jackson Hole address from Fed Chair Powell. US yields and the dollar eased slightly/briefly after weaker than expected weekly jobless claims (235k from 224k) and a softer than expected Philly Fed business outlook, but the move was soon reversed going into the US PMI’s release.US PMI’s printed much stronger than expected. The composite measure improved to 55.4 from (55.1) as manufacturing activity rebounded sharply (53.3 from 49.8). Services also continued to grow solidly (55.4). S&P also assess that the ‘rise in selling prices for goods and services suggests that consumer price inflation will rise further above the Fed’s 2% target in the coming months. Indeed, combined with the upturn in business activity and hiring, the rise in prices signaled by the survey puts the PMI data more into rate hiking, rather than cutting, territory’. Even so, the market reaction remains guarded; US yields add about 3 bps across the curve. The dollar gains (DXY 98.4, EUR/USD 1.163.
News & Views
The UK composite PMI joined the global move in August, rising from 51.8 to 53.6 (vs 51.8 expected). It was the strongest rise in private sector business activity since August of last year, led by a solid upturn in the services economy (53.6 from 51.8). New business volumes expanded at the strongest pace since October 2024 while employment was a weak spot, decreasing for the eleventh month running and at a marked pace. Business activity expectations for the year ahead edged up to the highest since October 2024 even as companies report concerns over the impact of recent government policy changes as well as unease emanating from broader geopolitical uncertainty. Input cost inflation meanwhile edged up to its highest since May. Suppliers try to pass on increased National Insurance costs with higher payroll costs also resulting in another robust rise in prices charged.
Belgian consumer confidence rose to its highest level in a year in August (-2 from -4). The increase was mainly driven by reduced fears over a rise in unemployment (1 from 7; lowest since February 2022). Consumer expectations for the general economic situation remain unchanged at -26. On a personal level, households intend to save more (21 from 19) and have slightly raised their expectations regarding their own financial situation (-1 from -2). On Monday, the National Bank of Belgium releases its August business confidence indicator with Belgian inflation numbers out next Thursday.
US PMI surge suggests Fed may need to tighten rather than ease
US flash PMI survey showed the sharpest manufacturing rebound in over three years, as the index jumped from 49.8 to 53.3. Services held firm at 55.4, down slightly from 55.7, lifting Composite PMI to an eight-month high of 55.4. The data point to an economy expanding at a 2.5% annualized pace, well above the average 1.3% seen in the first half of 2025.
S&P Global’s Chris Williamson noted that companies across both sectors are seeing stronger demand, with rising backlogs suggesting capacity constraints reminiscent of the early 2022 supply bottlenecks. This surge has also underpinned a pickup in hirin.
Yet, the survey also showed mounting inflation pressures. Businesses are increasingly passing tariff-related costs through to consumers, and the PMI price indices are now running at their highest levels in three years. Selling prices for goods and services have moved higher, suggesting that consumer inflation will "rise further above the Fed’s 2% target in the coming months."
For the Fed, the PMI results raise more questions than answers. Far from reinforcing the case for imminent rate cuts, the data place the economy closer to historical conditions that align with policy tightening.
"Combined with the upturn in business activity and hiring, the rise in prices signaled by the survey puts the PMI data more into rate hiking, rather than cutting," Williamson noted.
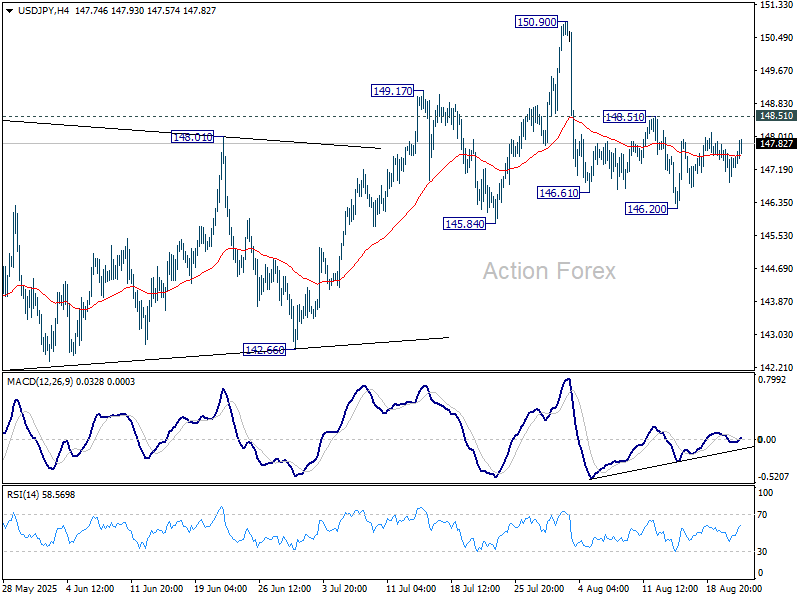
USD/JPY Mid-Day Outlook
Daily Pivots: (S1) 146.84; (P) 147.33; (R1) 147.79; More...
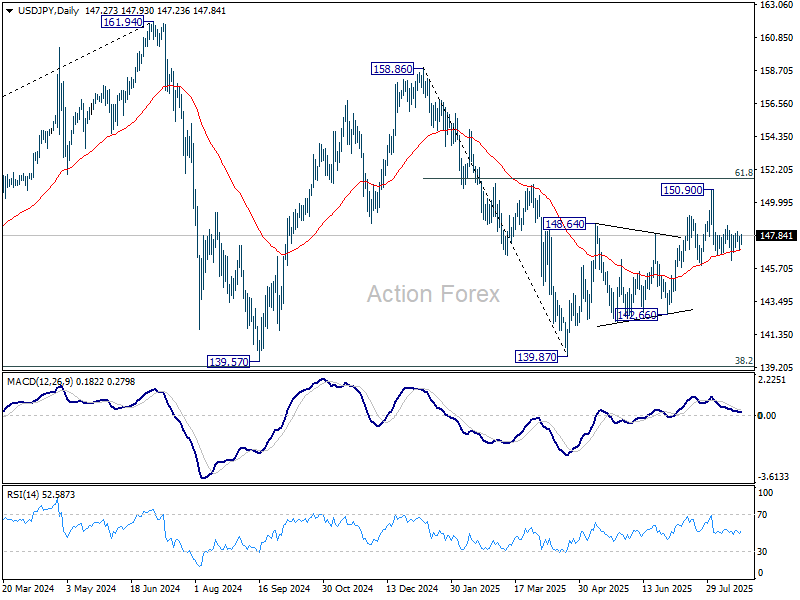
Range trading continues in USD/JPY and intraday bias stays neutral. On the upside, break of 148.51 will indicate that the pullback from 150.90 has completed, and bring retest of this high. This will also keep the whole rise from 139.87 alive. However, firm break of 145.84 support will argue that the rebound from 139.87 has completed, and turn near term outlook bearish.
In the bigger picture, price actions from 161.94 (2024 high) are seen as a corrective pattern to rise from 102.58 (2021 low). Decisive break of 61.8% retracement of 158.86 to 139.87 at 151.22 will argue that it has already completed with three waves at 139.87. Larger up trend might then be ready to resume through 161.94 high. In case the corrective pattern extends with another fall, strong support is expected from 38.2% retracement of 102.58 to 161.94 at 139.26 to bring rebound.
USD/CHF Mid-Day Outlook
Daily Pivots: (S1) 0.8018; (P) 0.8055; (R1) 0.8080; More….
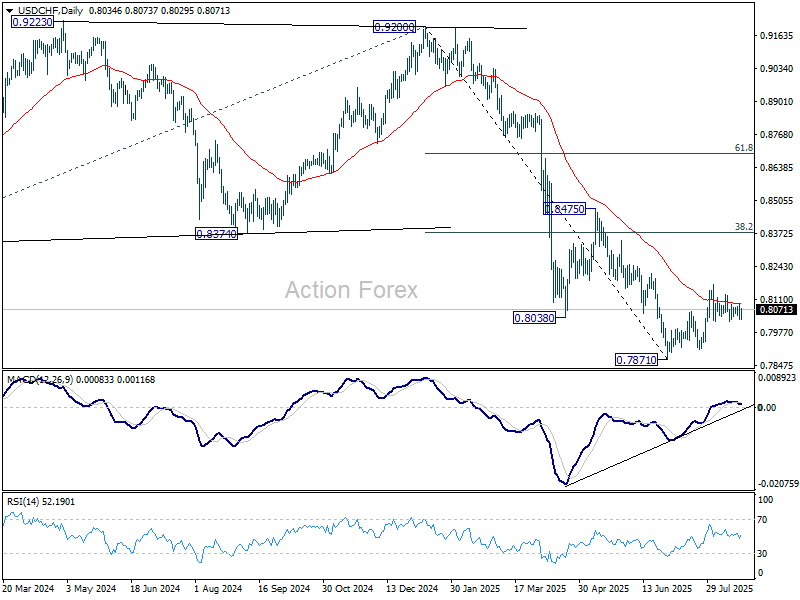
Range trading continues in USD/CHF and intraday bias stays neutral. On the downside, break of 0.8020 will revive that case that the corrective pattern from 0.7871 has completed, and target a retest on 0.7871 low. On the upside, firm break of 0.8710 will resume the corrective from 0.7871. Intraday bias will be back on the upside for 38.2% retracement of 0.9200 to 0.7871 at 0.8379.
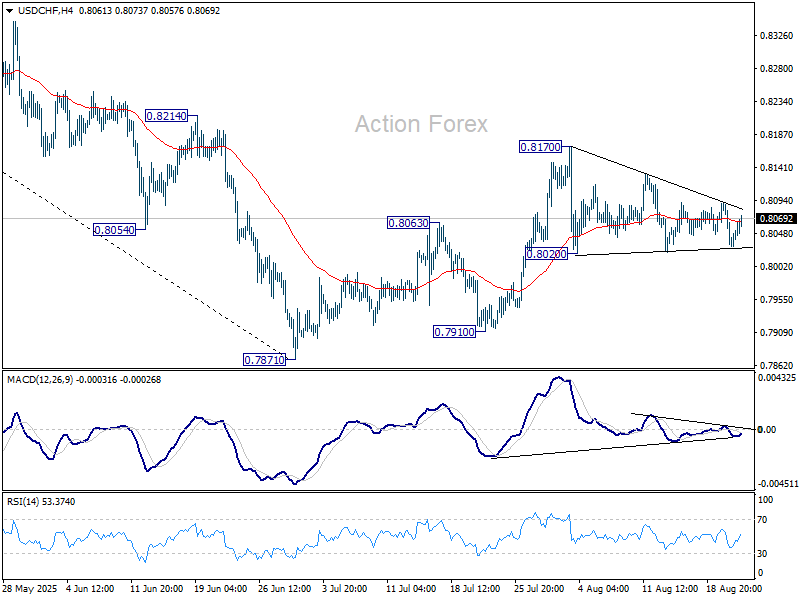
In the bigger picture, long term down trend from 1.0342 (2017 high) is still in progress. Next target is 100% projection of 1.0146 (2022 high) to 0.8332 from 0.9200 at 0.7382. In any case, outlook will stay bearish as long as 0.8475 resistance holds.