Sample Category Title
Nikkei 225 Wave Analysis
Nikkei 225: ⬆️ Buy
– Nikkei 225 broke resistance zone
– Likely to rise to resistance level 72000.00
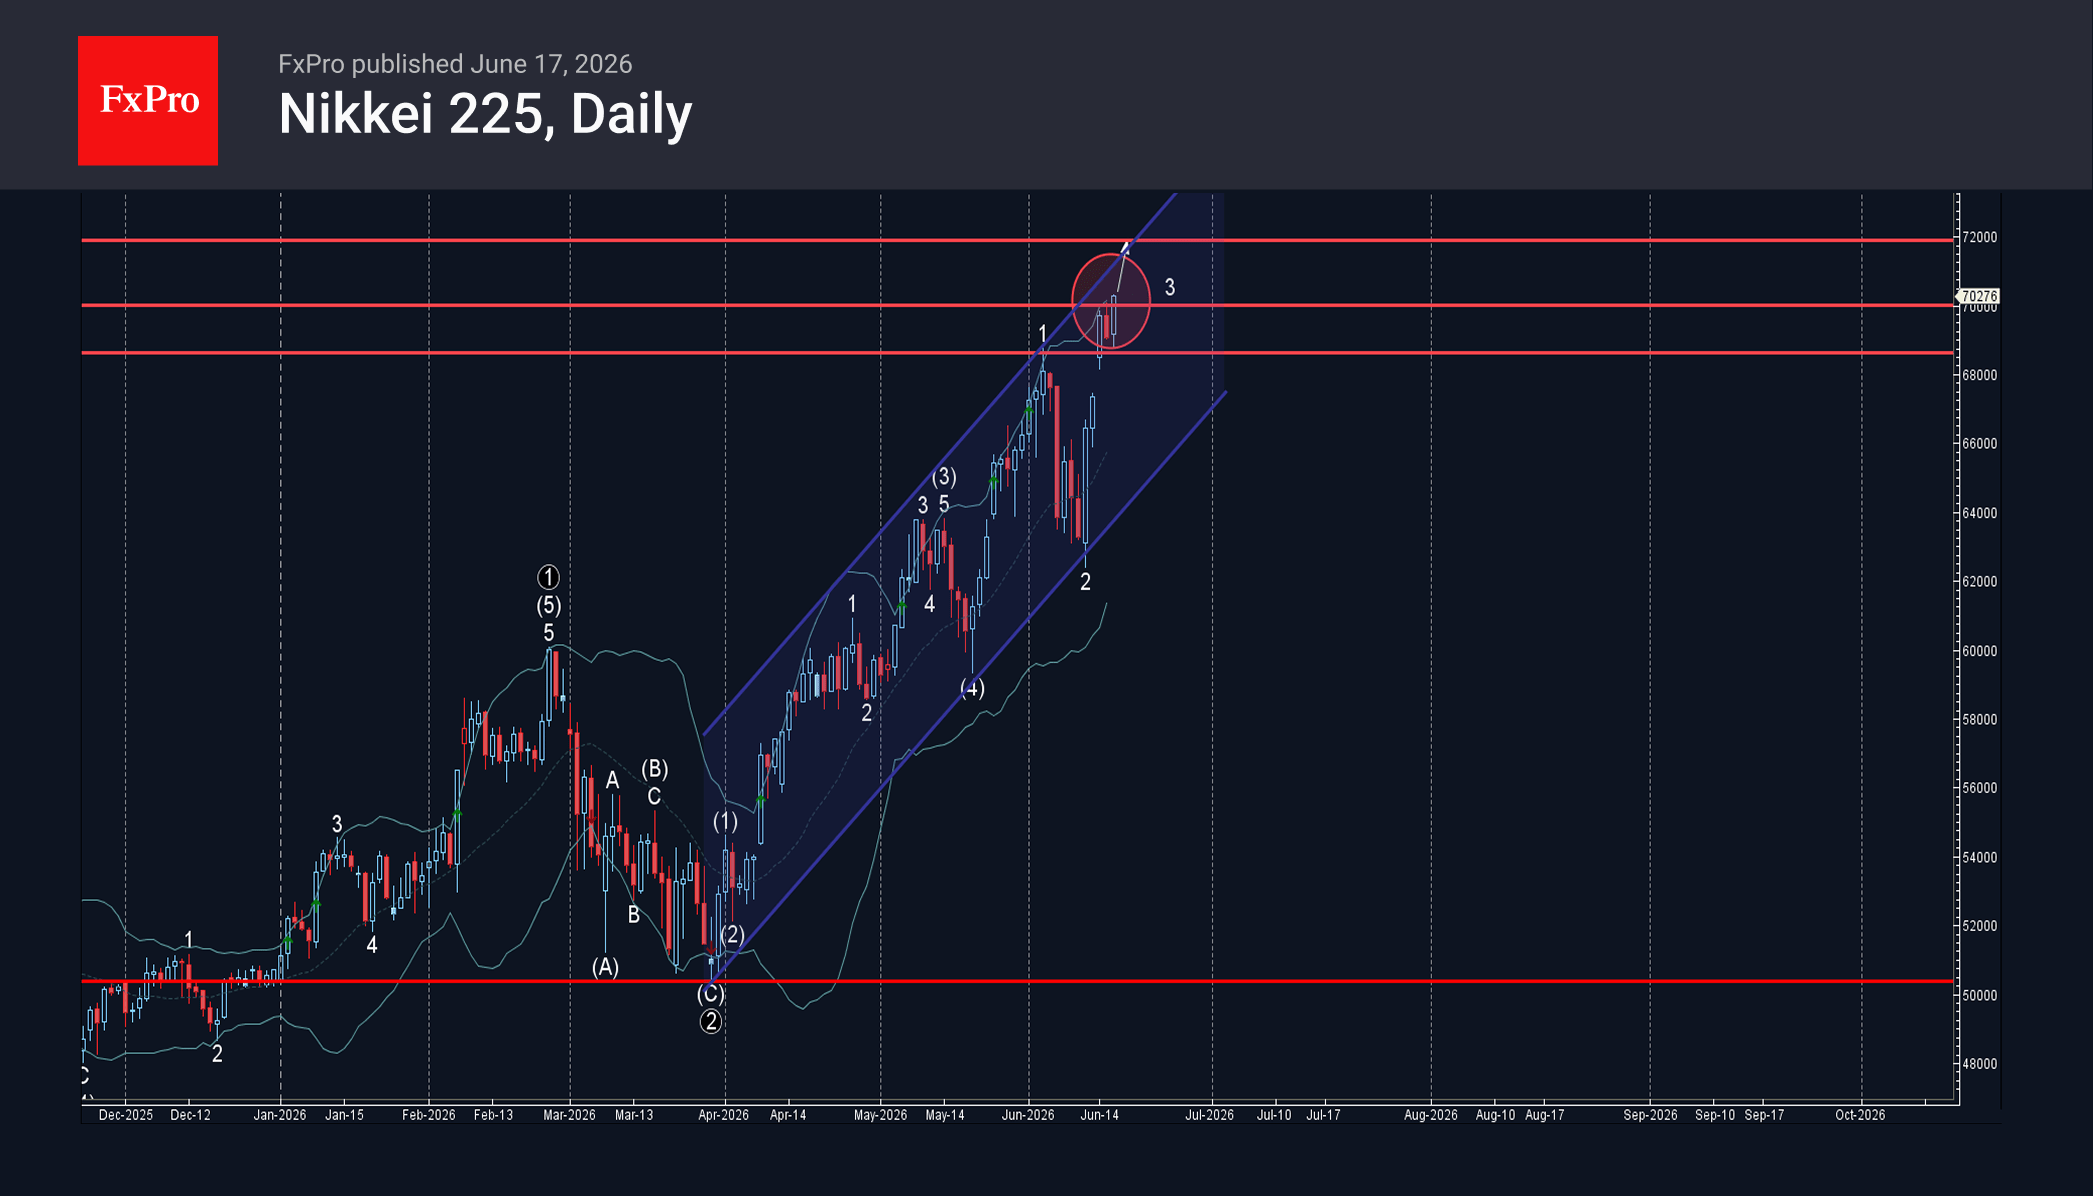
Nikkei 225 index recently broke the resistance zone between the strong resistance level 68615.00 (which stopped the previous sharp impulse wave 1, can be seen from the daily Nikkei 225 chart below) and the round resistance level 70000.00
The breakout of this resistance zone should accelerate the active impulse waves 3 and (5).
Given the clear daily uptrend, Nikkei 225 index can be expected to rise to the next resistance level 72000.00 (target for the completion of the active impulse wave 3).
Fed Day Arrives: Dot Plot Holds the Key as Markets Await Warsh’s Debut
Markets are entering the Federal Reserve decision with remarkably little uncertainty about what policymakers will do, but considerable uncertainty about what they will signal next. The first FOMC meeting under Kevin Warsh as Chair is widely expected to deliver an unchanged federal funds rate at 3.50%-3.75%, with little chance of dissent. Following Stephen Miran's departure from the Committee, there is no obvious constituency for an immediate rate cut, while even the Fed's hawkish members have not signaled that conditions warrant a hike at this stage.
That leaves investors focused on two issues: the updated dot plot and Warsh's first press conference as Chair. Across markets, positioning reflects caution rather than conviction. NASDAQ futures are modestly higher, but S&P 500 and DOW futures are largely unchanged. The 10-year Treasury yield is slightly lower on the day but remains comfortably above 4.43%, while Gold continues to trade in a narrow range around 4300. In currency markets, the Dollar is broadly rangebound against its major peers as traders await a catalyst for a directional breakout.
Several aspects of today's announcement are already largely priced in. The Fed is expected to remove the easing bias from its statement, acknowledging that recent inflation developments have reduced the likelihood that the next policy move will be a cut. Similarly, the median projection in the Summary of Economic Projections is expected to shift from one cut this year, as projected in March, to no change through year-end. Neither development would be particularly surprising given the recent rise in inflation and resilience of economic activity.
The real question is whether the Fed is merely abandoning its easing bias or beginning to contemplate tightening again. The answer lies in the distribution of the dots rather than the median itself. If two or three policymakers project a future rate hike, markets are likely to dismiss those projections as the views of the Committee's traditional hawks. However, if four or more officials place their dots above the current policy range, investors may conclude that the Fed is moving beyond a "higher for longer" framework and beginning to actively discuss the possibility of additional tightening.
The other wild card is Kevin Warsh himself. Investors want to know whether he views recent inflation pressures as a temporary energy shock or the beginning of a more persistent second-round inflation cycle. Yet there is a catch. Warsh has long argued that central bankers should communicate less rather than more. As a result, investors may find that the Fed's new Chair offers fewer policy signals than markets have become accustomed to receiving.
In foreign exchange markets, the Dollar remains trapped between competing forces. The Swiss Franc is currently the strongest performer for the week, followed by the Euro and Australian Dollar. The New Zealand Dollar, Canadian Dollar and Yen lag behind. Sterling and the Dollar sit in the middle of the rankings. By the time the Fed decision is announced, markets will already know the rate outcome. What they do not know is how many policymakers now believe the next move could eventually be higher. That question may ultimately determine the Dollar's next major move.
Sterling Slips on UK Inflation Misses, But GBP/CAD Bullish Case Remains Intact
Today's data may delay a hike. It probably won't cancel one. Markets may push back expectations for the next BoE move, but elevated services inflation means tightening remains a live possibility. GBP/CAD still has two powerful tailwinds. A significant UK yield advantage and collapsing oil prices continue to support the pair even as Sterling digests softer inflation data. Read More.
DOW Hits Record High as Falling Oil Prices Offset Fed Fears
The real risk isn't today's rate decision. It may be how many Fed officials are quietly starting to project another rate hike. For now, though, falling oil prices are keeping the DOW record run strong. Read More.
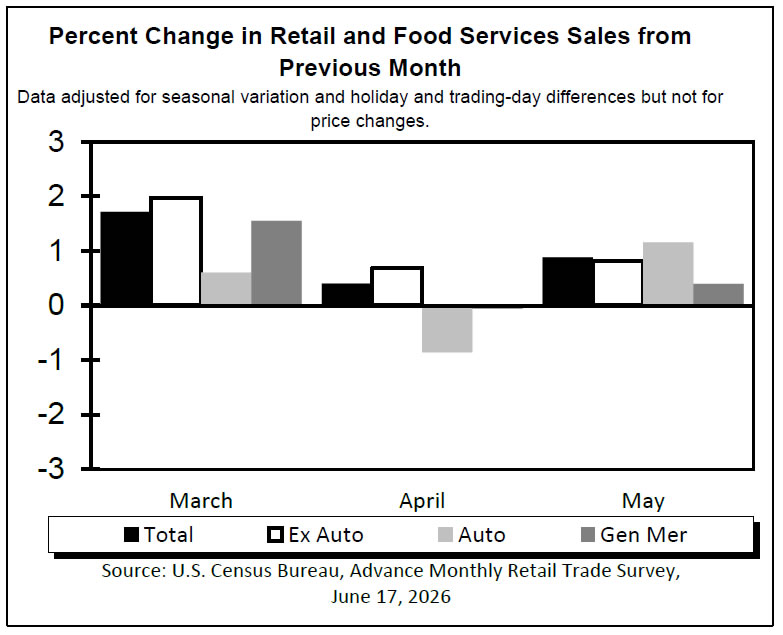
US Retail Sales Surge 0.9% in May, Signaling Resilient Consumer Demand
Higher rates haven't stopped consumers from spending. Strong gains in headline and core retail sales suggest demand remains resilient despite inflation and tighter financial conditions. Read More.
Eurozone Core Inflation Accelerates to 2.6% as Services and Energy Drive Prices Higher
The headline rose. The core story got stronger. Eurozone inflation accelerated in May, but the bigger development was a jump in core CPI from 2.2% to 2.6%, signaling that underlying price pressures remain stubborn. Read More.
UK Inflation Holds at 2.8% as Goods Disinflation Offsets Services Pressure
The Bank of England got some breathing room. Headline and core inflation both undershot forecasts, reducing pressure for an immediate policy response ahead of this week's rate decision. Read More.
Japan Exports Beat Expectations as AI Demand Offsets War-Related Disruptions
Japan's export boom looks stronger than it really is. Headline exports jumped 17.0% in May, but volumes rose just 0.5%, suggesting higher prices and a weaker Yen did most of the heavy lifting. Read More.
USD/CAD Daily Outlook
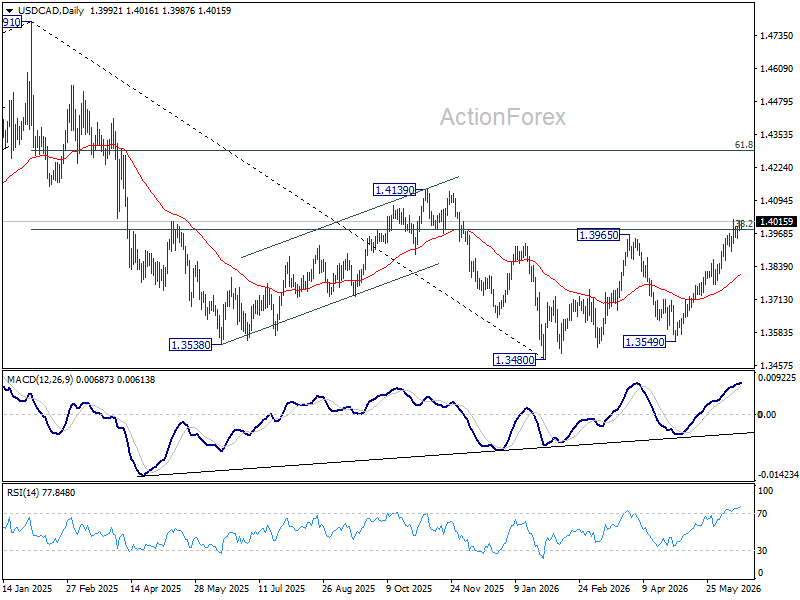
USD/CAD is still bounded in range below 1.4023 and intraday bias stays neutral. Further rise is expected as long as 1.3897 support holds. On the upside, sustained break of 38.2% retracement of 1.4791 to 1.3480 at 1.3981. Decisive break there will carry larger bullish implications and target 61.8% retracement at 1.4290 next. However, firm break of 1.3897 will turn bias back to the downside for deeper pullback.
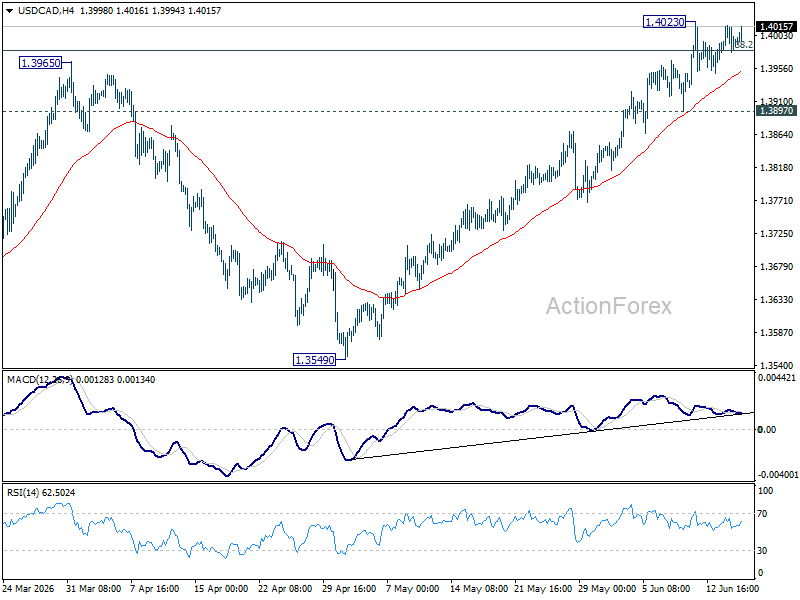
In the bigger picture, price actions from 1.4791 are seen as a corrective pattern to the whole up trend from 1.2005 (2021 low). Rejection by 38.2% retracement of 1.4791 to 1.3480 at 1.3981 will keep the decline intact, and bring another fall through 1.3480 at a later stage. However, firm break of 1.3981 will argue that the decline has completed, and set up further rise back to retest 1.4791 instead.
US Retail Sales Surge 0.9% in May, Signaling Resilient Consumer Demand
US retail sales rose 0.9% mom to USD 763.7B in May, comfortably exceeding expectations of 0.5% mom and accelerating from the previous month's 0.4% mom. The gain suggests that consumer spending remained resilient despite elevated inflation, high borrowing costs and growing uncertainty over the economic outlook.
Excluding automobiles, retail sales increased 0.8% mom to USD 623.4B, also beating expectations of 0.5% mom. Retail sales excluding gasoline rose 0.7% mom to USD 700.0B, indicating that the increase was not simply driven by higher fuel prices. Total retail sales for the March through May period were up 5.3% from a year earlier.
Given that household consumption accounts for roughly two-thirds of US economic activity, the latest figures provide further evidence that domestic demand remains a key pillar supporting growth.
| Indicator | May 2026 | Expected |
|---|---|---|
| Retail Sales M/M | 0.9% | 0.5% |
| Retail Sales Ex-Autos M/M | 0.8% | 0.5% |
| Retail Sales Ex-Gasoline M/M | 0.7% |
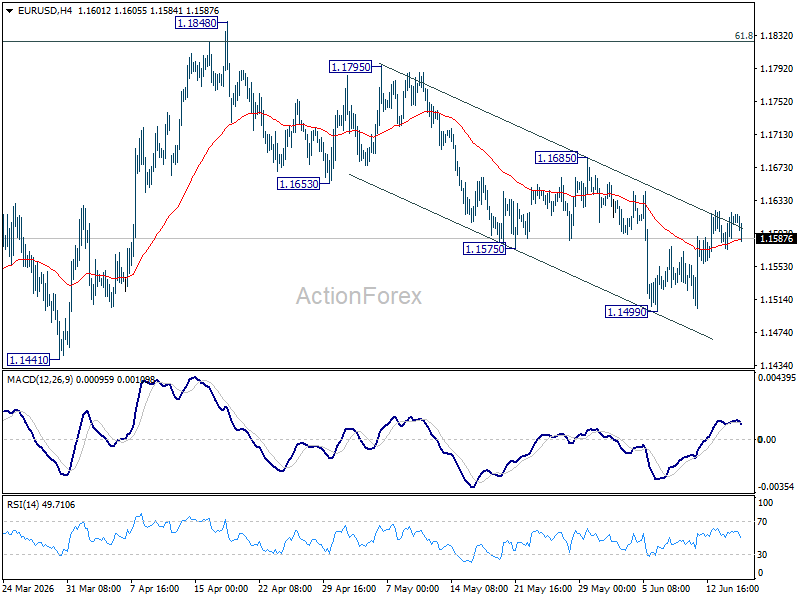
EUR/USD Daily Outlook
Range trading continues in EUR/USD and intraday bias stays neutral. Risk will stay on the downside as long as 1.1685 resistance holds. Break of 1.4990 will resume the fall from 1.1848 to retest 1.1408 low next.
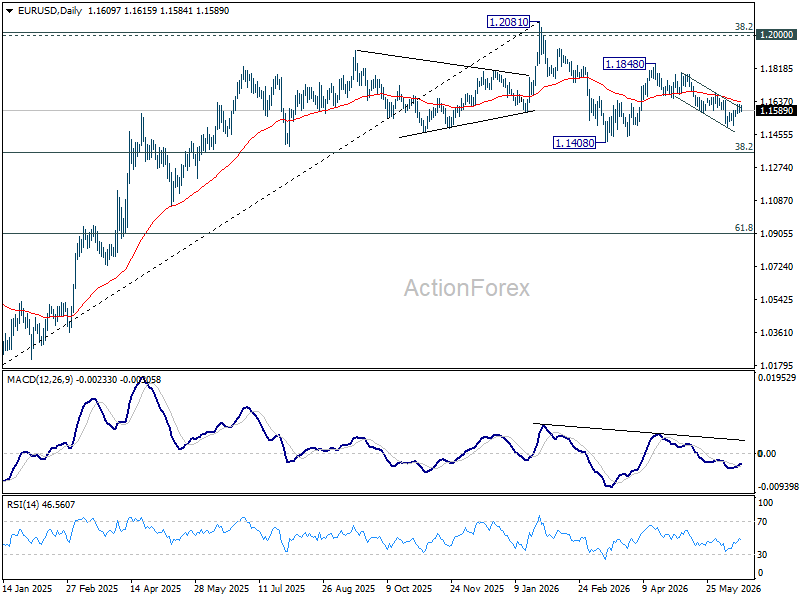
In the bigger picture, the strong support from 38.2% retracement of 1.0176 to 1.2081 at 1.1353 suggests that the pullback from 1.2081 is more likely a corrective move. Strong support was also found in 55 W EMA (now at 1.1547). Focus is back on 1.2 key cluster resistance level. Decisive break there will carry long term bullish implications. Nevertheless, break of 1.1408 support will revive the case of medium term bearish trend reversal.
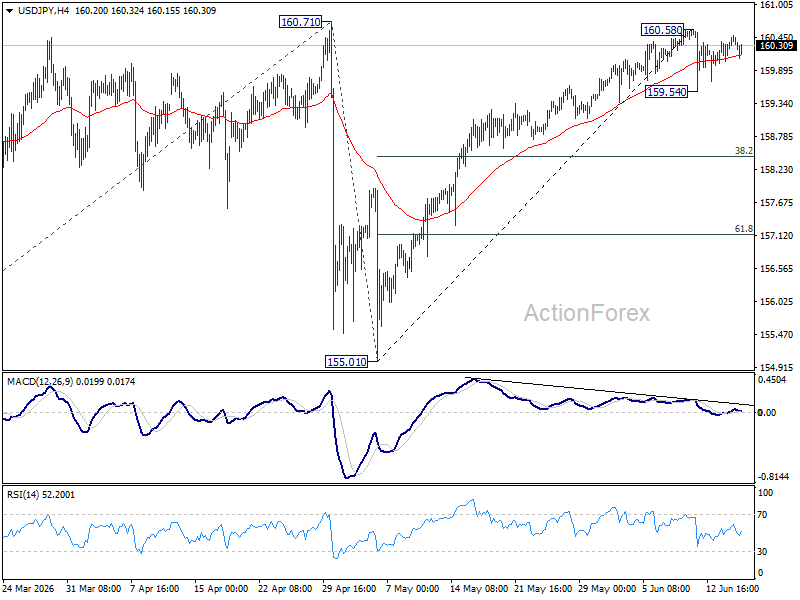
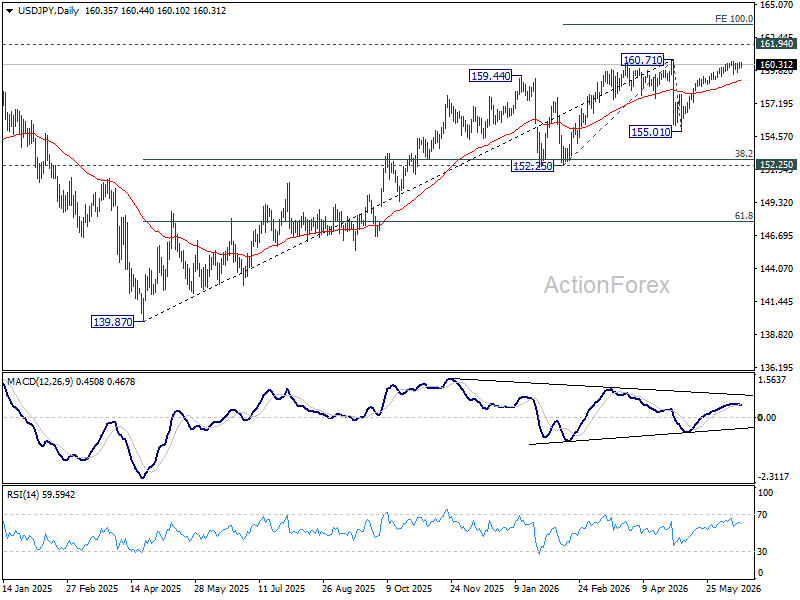
USD/JPY Daily Outlook
Intraday bias in USD/JPY remains neutral for the moment. On the downside, break of 159.54 will extend the fall from 160.58 short term top to 38.2% retracement of 155.01 to 160.58 at 158.45. However, decisive break of 160.71 will confirm up trend resumption. That should push USD/JPY through 161.94 to 100% projection of 152.25 to 160.71 from 155.01 at 163.47 next.
In the bigger picture, for now, corrective pattern from 161.94 (2024 high) is still seen as completed at 139.87. Rise from there is seen as resuming the long term up trend. So, break of 161.94 is expected at a later stage to resume the long term up trend. However, sustained break of 55 W EMA (now at 155.13) will dampen this view and bring deeper fall back towards 139.87 to extend the pattern from 161.94.
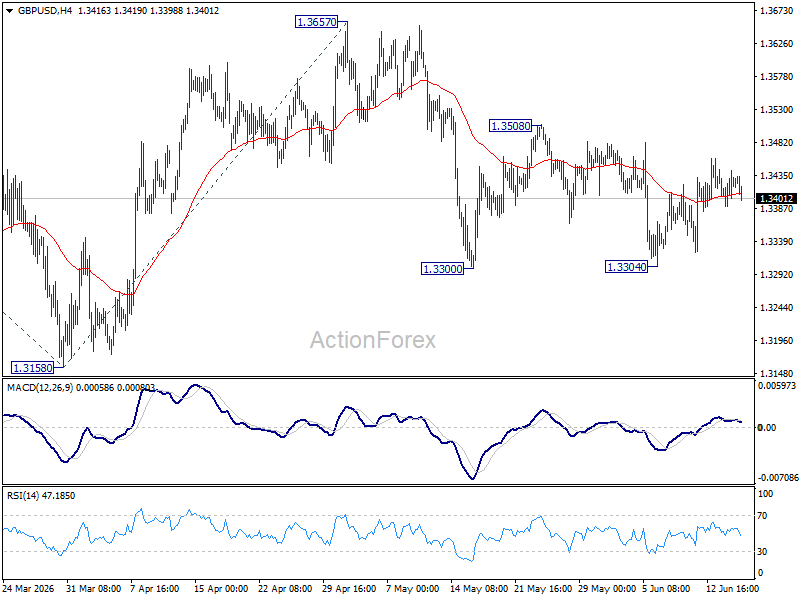
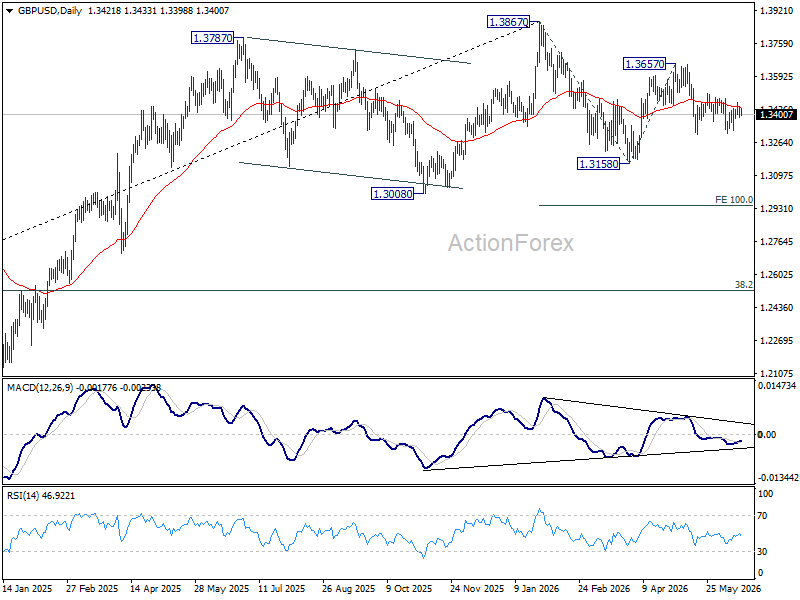
GBP/USD Daily Outlook
Intraday bias in GBP/USD remains neutral at this point, as range trading continues. Risk will stay mildly on the downside as long as 1.3508 resistance holds. Firm break of 1.3300 will resume the decline from 1.3657 to 1.3158 support next. However, break of 1.3508 will turn bias back to the upside for retesting 1.3657 instead.
In the bigger picture, price actions from 1.3867 are a corrective pattern within the broader up trend from 1.0351 (2022 low). With 1.3008 support intact, medium term bullishness is maintained and break of 1.3867 is in favor for a later stage, towards 1.4248 key resistance (2021 high). However, firm break of 1.3008 will at least bring deeper fall to 38.2% retracement of 1.0351 to 1.3867 at 1.2524, with increased risk of bearish reversal.
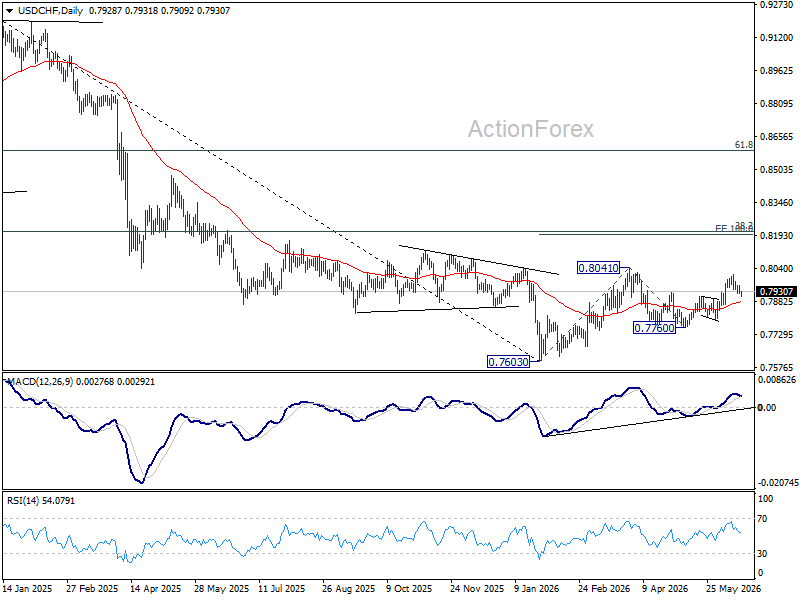
USD/CHF Daily Outlook
USD/CHF is still holding above 0.7906 resistance turned support. Intraday bias remains neutral and further rise is still in favor. Above 0.8012 will bring retest 0f 0.8041 high. Firm break there will resume the rise from 0.7603 and target 100% projection 0.7603 to 0.841 from 0.7600 at 0.8198 next. However, sustained break break of 0.7906 will turn bias back to the downside for 0.7795 support instead.
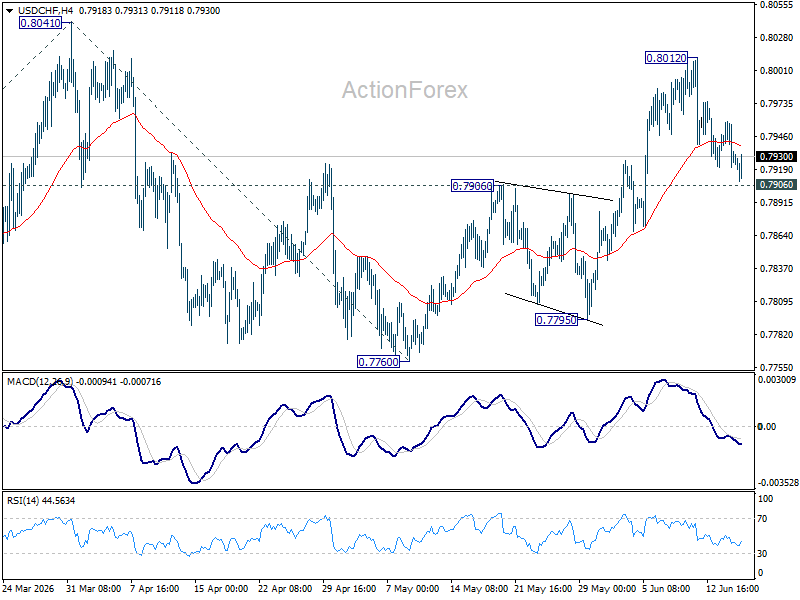
In the bigger picture, while a medium term bottom was formed at 0.7603, it's still early to call for bullish trend reversal. As long as 38.2% retracement of 0.9200 (2025 high) to 0.7603 at 0.8213 holds, the larger down trend could still continue through 0.7603 at a later stage. However, firm break of 0.7603 will argue that the trend has reversed and turn focus to 0.8332 support turned resistance (2023 low) for confirmation.
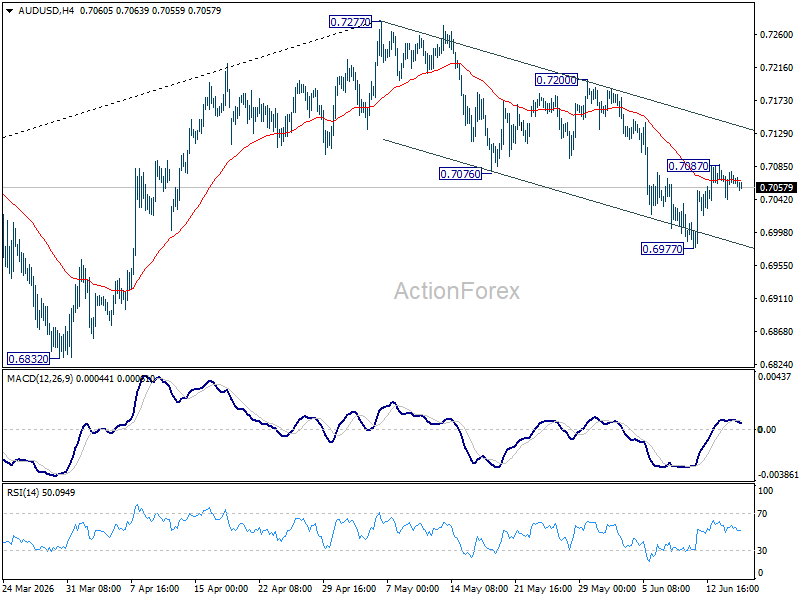
AUD/USD Daily Report
Intraday bias in AUD/USD is turned neutral with current retreat. Some consolidations would be seen. Fall from 0.7277 might have completed as a three wave correction at 0.6977. Above 0.7087 will target 0.7200 resistance. On the downside, though, break of 0.6977 will resume the fall towards 0.6832 support.
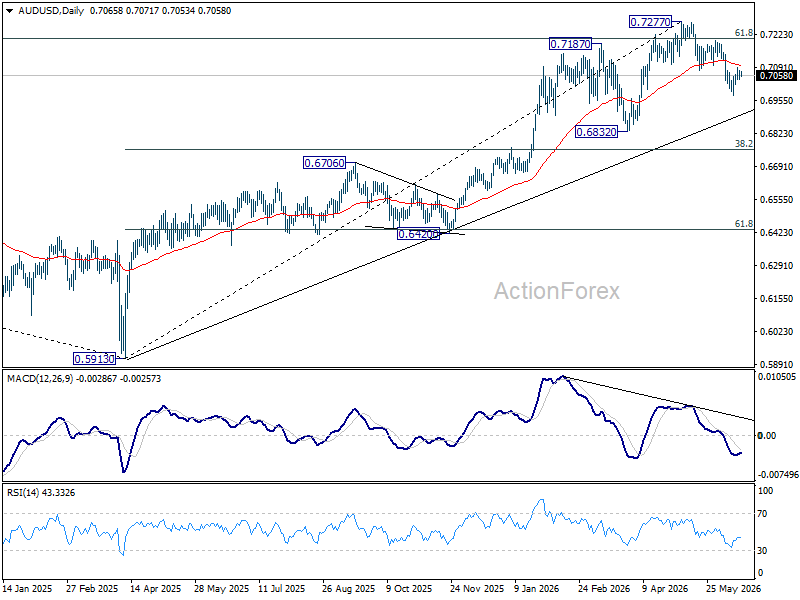
In the bigger picture, considering bearish divergence condition in D MACD, a medium term top could be formed at 0.7277 after failing to sustain above 61.8% retracement of 0.8006 (2021 high) to 0.5913 (2024 low) at 0.7206). Deeper fall could be seen to 38.2% retracement of 5913 to 0.7277 at 0.6756 as a correction. But strong support should be seen there to bring rebound. Consolidations would continue below 0.7277 for a while.
USD/CAD Daily Outlook
USD/CAD is still bounded in range below 1.4023 and intraday bias stays neutral. Further rise is expected as long as 1.3897 support holds. On the upside, sustained break of 38.2% retracement of 1.4791 to 1.3480 at 1.3981. Decisive break there will carry larger bullish implications and target 61.8% retracement at 1.4290 next. However, firm break of 1.3897 will turn bias back to the downside for deeper pullback.
In the bigger picture, price actions from 1.4791 are seen as a corrective pattern to the whole up trend from 1.2005 (2021 low). Rejection by 38.2% retracement of 1.4791 to 1.3480 at 1.3981 will keep the decline intact, and bring another fall through 1.3480 at a later stage. However, firm break of 1.3981 will argue that the decline has completed, and set up further rise back to retest 1.4791 instead.
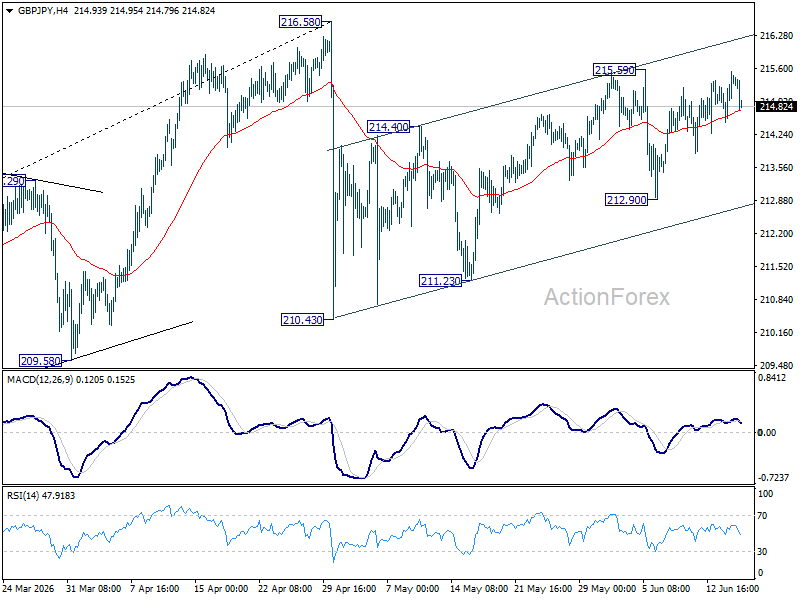
GBP/JPY Daily Outlook
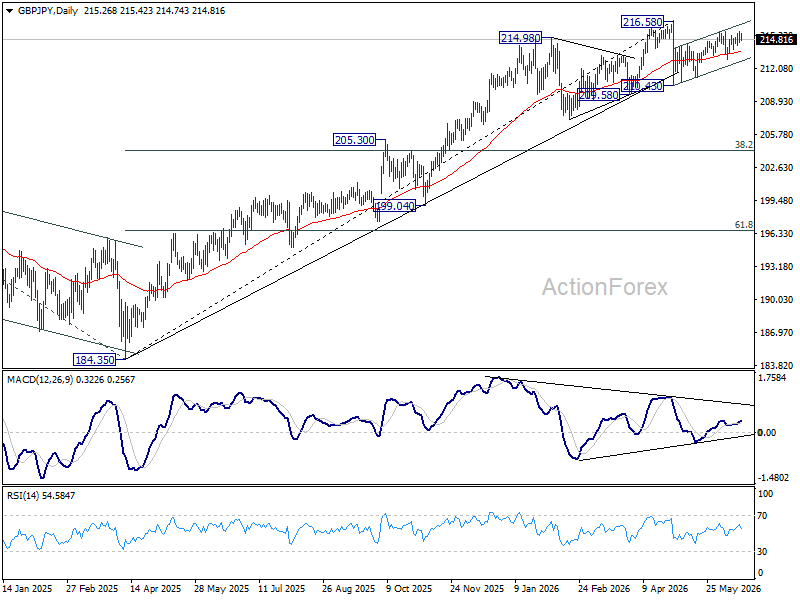
No change in GBP/JPY's outlook and intraday bias stays neutral for the moment. On the upside, above 215.59 will resume the rise from 210.43 to retest 216.58 high. On the downside, break of 212.90 will resume the fall from 215.59 to 211.23 support first.
In the bigger picture, there is no clear sign of trend reversal yet. The long term up trend could still extend to 61.8% projection of 148.93 (2022 low) to 208.09 (2024 high) from 184.35 at 220.90 on resumption. However, sustained break of 55 W EMA (now at 207.11) will argue that it's already in medium term down trend for 184.35 support.