Sample Category Title
EUR/AUD Daily Outlook
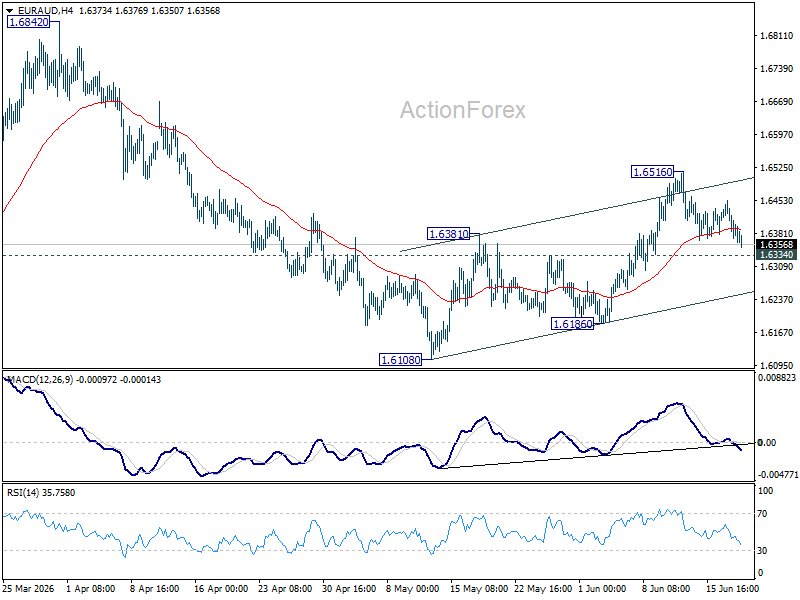
EUR/AUD gyrated lower today but stays above 1.6334 minor support. Intraday bias stays neutral and further rise will remain in favor as long as 1.6334 minor support holds. Above 1.6516 will resume the rebound from 1.6108, and target 1.6842 resistance. However, firm break of 1.6334 will turn bias back to the downside for 1.6108/6186 support zone instead.
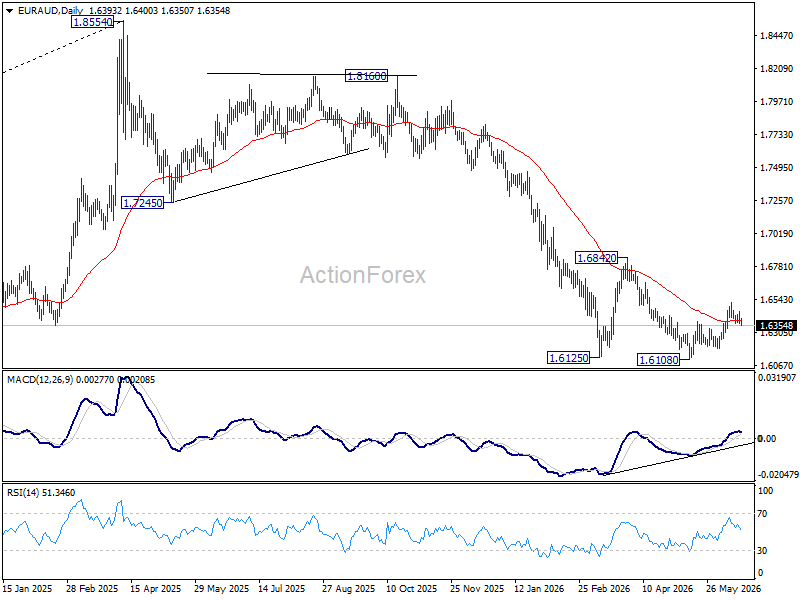
In the bigger picture, outlook will stay bearish as long as 1.6842 resistance holds. Fall from 1.8554 (2025 high) is expected to continue to 61.8% retracement of 1.4281 to 1.8554 at 1.5913. Decisive break there will pave the way back to 1.4281 (2022 low). However, firm break of 1.6842 should confirm medium term bottoming, and bring stronger rally.
EUR/CHF Daily Outlook
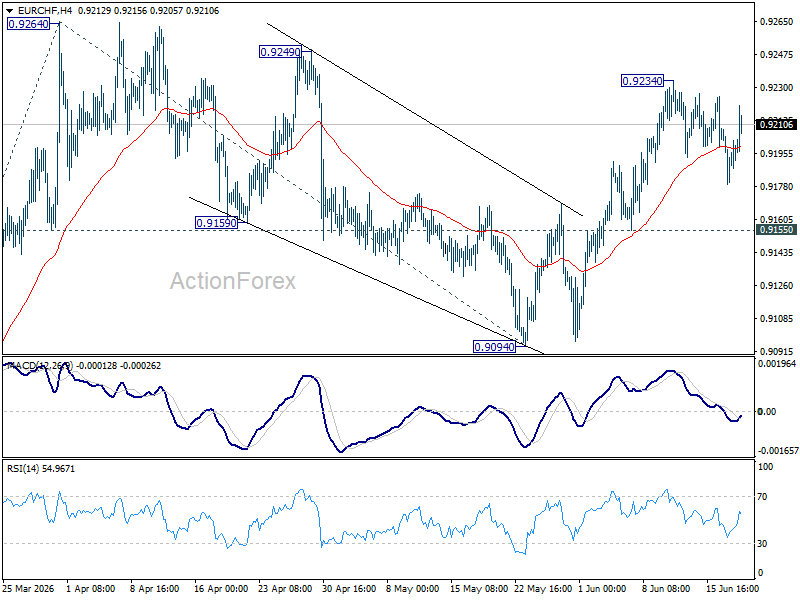
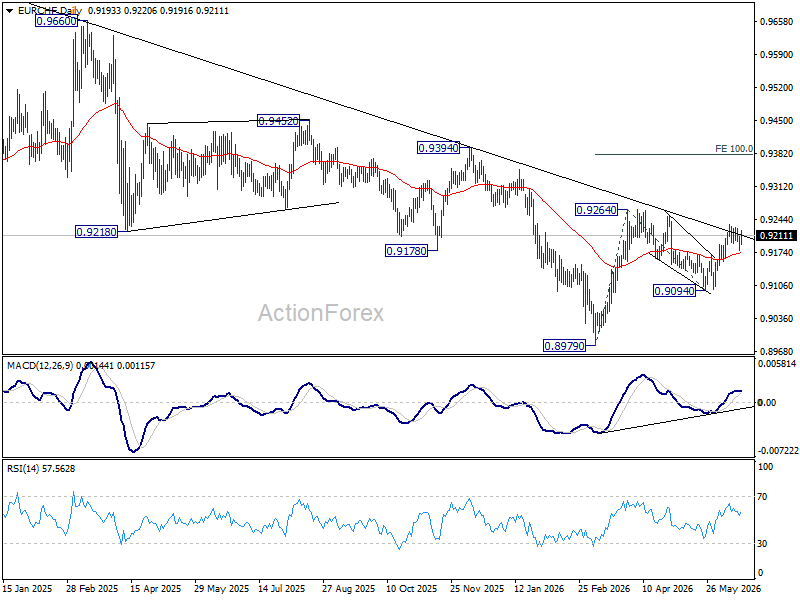
EUR/CHF recovered notably today but stays below 0.9234 temporary top. Intraday bias remains neutral and more sideway consolidations could be seen. But further rally is still expected as long as 0.9155 support holds. On the upside, above 0.9234 will bring retest of 0.9264 first. Firm break there will resume the rally from 0.8979 to 100% projection of 0.8979 to 0.9264 from 0.9094 at 0.9379. However, decisive break of 0.9155 will turn bias back to the downside for 0.9094 support instead.
In the bigger picture, as long as 0.9394 resistance holds, down trend from 0.9928 (2024 high) could still be in progress. Firm break of 0.8979 will confirm down trend resumption. However, decisive break of 0.9394 will be an important sign of medium term bullish reversal.
BoE Holds at 3.75%, But 7-2 Vote Keeps Rate Hike Risk Alive
The Bank of England left Bank Rate unchanged at 3.75%, as widely expected, but the vote split and accompanying statement underscored that the debate within the Monetary Policy Committee remains firmly tilted toward inflation risks. The MPC voted 7-2 to keep rates unchanged, with Megan Greene and Huw Pill preferring an immediate 25 basis point increase to 4.0%. Policymakers acknowledged that global energy prices have fallen since the previous meeting following progress toward a Middle East peace deal, but stressed that prices remain elevated and volatile compared with pre-conflict levels.
The Committee's central concern remains whether higher energy costs eventually feed into broader domestic inflation pressures. In its statement, the BoE warned that "the risk of material second-round effects in price and wage-setting... is greater the longer higher energy prices persist." While CPI inflation has fallen to 2.8% and recent data suggest that underlying disinflation was continuing before the energy shock, policymakers remain cautious about declaring victory. The MPC reiterated that it "stands ready to act as necessary" to ensure inflation returns sustainably to the 2% target.
At the same time, several developments argued against tightening immediately. The labor market continues to loosen gradually, demand remains subdued, and financial conditions have already tightened significantly since the conflict began. The Committee noted that interest rates facing households and businesses remain materially higher than before the Middle East crisis, helping to restrain inflation without additional policy action. Governor Andrew Bailey said recent inflation data provided "greater confidence that gradual underlying disinflation has continued," while emphasizing that policymakers would respond promptly if stronger second-round effects emerged.
The overall message was one of patience rather than comfort. Most members judged that current financial conditions are already restrictive enough while policymakers gather more evidence on how the energy shock propagates through the economy. Nevertheless, the presence of two dissenters calling for an immediate hike and repeated references to inflation persistence suggest that the tightening bias remains intact.
(BOE) Bank Rate maintained at 3.75%
Monetary Policy Summary, June 2026
At its meeting ending on 17 June 2026, the Monetary Policy Committee (MPC) voted by a majority of 7–2 to maintain Bank Rate at 3.75%. Two members voted to increase Bank Rate by 0.25 percentage points, to 4%.
Global energy prices have fallen since the previous meeting in response to events in the Middle East. But they remain higher than pre-conflict and have continued to be volatile. The impact of the energy shock on the UK economy remains uncertain. Monetary policy cannot influence energy prices but is being set to ensure that the economic adjustment to them occurs in a way that achieves the 2% inflation target sustainably. The policy stance required to achieve this will depend on the scale and duration of the shock, and how it propagates through the economy.
CPI inflation has fallen to 2.8% since the previous meeting, although it is expected to rise later this year as the effects of higher energy prices continue to pass through. The risk of material second-round effects in price and wage-setting, against which policy needs to lean, is greater the longer higher energy prices persist. But the labour market continues to loosen, and signs of a weakening economy could contain inflationary pressures. Interest rates faced by households and businesses remain higher than prior to the conflict, which will act to reduce inflation over time.
Taking all the risks to the economic outlook into account, the Committee judges that it is appropriate to maintain Bank Rate at this meeting.
The Committee will continue to monitor closely the situation in the Middle East and how its impact propagates through the economy. The Committee stands ready to act as necessary to ensure that CPI inflation remains on track to meet the 2% target in the medium term.
Minutes of the Monetary Policy Committee meeting ending on 17 June 2026
1: Before turning to its immediate policy decision, the Monetary Policy Committee (MPC) discussed recent developments in global and UK economic and financial conditions, and how these could affect the medium-term outlook and the MPC’s strategy.
Global economic and financial conditions
2: Global energy prices had fallen since the previous meeting in response to events in the Middle East. But they remained higher than pre-conflict and had continued to be volatile. The spot price of Brent crude and UK wholesale gas had averaged $100 per barrel and 116 pence per therm respectively since the April Monetary Policy Report, compared to $66 per barrel and 87 pence per therm in the period leading up to the February Report. In the days immediately leading up to the June MPC meeting, plans for a Middle East peace deal had been announced. Oil and gas prices had fallen in response to around $79 per barrel and 100 pence per therm respectively. Futures curves continued to slope downwards for both oil and gas.
3: The Committee discussed the risks around the outlook for energy prices. Prior to the announcement of a peace deal, there had been some partial mitigants to the impact of the disruption to global energy supply on energy prices, but it was uncertain how long these could be sustained. The coordinated release of strategic oil reserves by the member countries of the International Energy Agency was one such mitigant. There had also been some switching from the use of gas to coal as well as evidence of reduced demand for energy in response to higher prices, particularly in Asia. To some extent this reduction in demand might reflect the temporary deferral of economic activity, meaning it was uncertain how long it could persist in the event of a more prolonged reduction in energy supply from the Middle East.
4: Oil products and broader commodity prices had remained higher than before the conflict and there had been some emerging signs of global supply chain disruption. The price of diesel and jet fuel had increased significantly relative to Brent crude oil when the conflict began. These spreads had remained elevated relative to pre-conflict but had reduced since the Committee’s April meeting. Other commodity prices, such as for fertiliser and metals, had also remained higher than pre-conflict. Some indicators of global supply chain disruption had risen sharply since the start of the war, including some shipping cost indices and a PMI-based global supply chain index calculated by Bank staff.
5: Interest rates faced by households and businesses had remained higher than prior to the conflict. This tightening in financial conditions had been driven mainly by a significant upward shift in short-term overnight index swap (OIS) rates. These rates had also risen materially in the United States and in the euro area, reflecting the global nature of the energy supply shock and its implications for inflation. UK two-year OIS rates were currently around 70 basis points above their pre-war level. There had been full and fast pass-through from increases in such rates to key lending rates for households and businesses. The quoted rate on two-year fixed-rate mortgages was around 80 basis points higher than prior to the conflict and UK investment grade corporate bond yields had risen by around 50 basis points.
6: In the June Market Participants Survey (MaPS), median expectations had been for Bank Rate to remain unchanged at this MPC meeting and, thereafter, for Bank Rate to remain unchanged for the year ahead. That represented a tightening in the median path of around 50 basis points relative to expectations prior to the conflict, at which point reductions in Bank Rate had been expected.
7: In contrast to market participants’ broadly flat most likely path for Bank Rate, the UK short-term interest rate curve sloped upwards over the year ahead. The conflict had led to increased volatility that was correlated across energy, inflation-linked and interest rate markets. The UK OIS curve had continued to oscillate since the April meeting, but within a range that was consistently materially higher than the pre-conflict curve. In the lead up to this MPC meeting, the announcement of a peace deal had contributed to a shift in the OIS curve towards the bottom of its recent range, with an upward slope of around 30 basis points by end-2026. Models used by Bank staff suggested that the upward slope of the OIS curve was driven largely by risk premia. Consistent with that, respondents to the June MaPS survey had attributed most of the gap between the April MaPS median Bank Rate profile and the current market curve to asymmetric risks and compensation for uncertainty.
UK current economic conditions
8: Twelve-month CPI inflation had been 2.8% in May, unchanged from April, but down from 3.3% in March. The May outturn had been 0.4 percentage points below the short-term forecast published in the April Report. Downside news relative to the April Report had been spread across food, core goods and services, with an outsized contribution to the news from food price inflation, which had fallen to 2.2%. Some direct effects of the energy shock, especially from the initial post-conflict increase in fuel prices, had already pushed up on CPI inflation.
9: Energy prices had remained volatile. Based on energy prices as of close of business on 15 June, CPI inflation was now expected to be a little under 3% in 2026 Q3 and pick up to a little over 3¼% in Q4. This was below the path expected in the April Report, reflecting both lower energy and non-energy prices.
10: Ofgem’s headline energy price cap for July to September had been increased by £221 (13.5%) to £1862, broadly in line with expectations at the time of the April Report. On 21 May, the government had announced a postponement of the increase in fuel duty planned for September, as part of a set of policy measures to support households and energy-intensive industries.
11: Forward-looking survey indicators of the indirect effects of the energy shock had remained consistent with near-term expectations in the April Report projections. For businesses responding to the DMP Survey, one-year-ahead own-price inflation expectations had fallen in May to 4.0%, from 4.4% in April, although this was 0.6 percentage points higher than the pre-conflict rate in February.
12: Households’ near-term inflation expectations had picked up materially since the start of the conflict. The Bank/Ipsos measure of year-ahead expected inflation had risen sharply, from 3.2% in February to 4.0% in May. The corresponding Citi/YouGov measure had remained well above its pre-Covid average at 4.7% in May, although it had fallen back from its immediate post-conflict peak. Medium-term household expectations had also risen, with the Bank/Ipsos two and five-year ahead measures having increased by 0.3 and 0.2 percentage points respectively in May relative to February.
13: Annual growth in private sector regular Average Weekly Earnings in the three months to April had been 2.9%, a touch lower than had been expected in the April Report. On the face of it, this was below the estimates of target-consistent wage growth published in the February Report, but, adjusting for changes in industry mix, private sector AWE growth was around half a percentage point higher. Growth in bonus payments, which were not included in measures of regular pay, had also been strong. In addition, public sector regular pay had grown by 5.1%, although this strength had in part reflected that the twelve-month comparison had included both the 2025 and 2026 uplifts for some NHS staff.
14: There had been no change since the April Report to the Bank’s Agents’ estimate that basic private sector pay settlements were expected to average 3.5% over 2026. The Agents reported that most of these settlements had been agreed before the recent rise in energy prices, and that contacts did not generally expect that they would be re-opened. Some contacts had expressed concerns that the pace of wage disinflation could slow next year as a result of the conflict. DMP respondents had reported that they expected one-year-ahead wage growth of 3.4%, which had been stable since before the start of the conflict.
15: UK GDP had increased by 0.6% in 2026 Q1, 0.1 percentage points higher than had been expected in the April Report. Evidence from business surveys, however, suggested that this headline figure overstated the underlying momentum, which had remained subdued. In April, monthly GDP had fallen by 0.1%, consistent with a partial unwind of the strength in activity in Q1. The S&P Global UK composite output PMI in May had fallen below the 50 no-change mark for the first time in more than a year as growth in manufacturing had been offset by weaker growth in services. Bank staff estimated that underlying quarterly GDP growth had been around 0.2% in Q1, and would remain at around that rate in Q2.
16: To date, surveys and faster indicators had not generally provided much evidence that the conflict had led to a rapid deterioration in the outlook for growth, although growth was expected to be subdued. The Bank’s Agents’ contacts had reported a further weakening in demand expectations in May, alongside growing concerns about potential future supply shortages. Confidence more generally had been weak, as, according to a range of opinion polls, households and firms had reported persistent negative economic sentiment, both relative to the past and relative to other countries.
17: There had been a mixed picture on labour demand in recent data. The Labour Force Survey (LFS) unemployment rate had fallen to 4.9% in the three months to April, slightly lower than had been expected in the April Report. LFS employment had grown by 0.3%, slightly higher than had been expected in the April Report, but underlying employment growth had remained close to zero. Vacancies had continued to decline, by 2.6% in the three months to May compared to the previous three months, although the redundancy rate had also fallen. Overall, these data continued to be consistent with a gradual loosening in the labour market. This was supported by intelligence from the Bank’s Agents’ contacts, many of whom had reported that weak or delayed demand was leading them to operate below desired utilisation.
Overview and the Committee’s discussions
18: The conflict in the Middle East, and its impact on energy prices and the UK economy, remained the dominant source of uncertainty for the inflation outlook. As had been outlined in the April Monetary Policy Report and Minutes, monetary policy could not influence global energy prices. And it would take time for monetary policy to work through the economy, so any action the MPC might take would not prevent higher inflation in coming months. What the MPC would do is set monetary policy to make sure that the effects of the shock did not become embedded into broad-based inflationary pressures, so that inflation fell back to the 2% target and stayed there.
19: In setting policy at this meeting, the Committee continued to judge that weakness in demand and the labour market was likely to lessen the strength of second-round effects from higher global energy prices. But these effects were likely to be stronger, the larger and more persistent was the rise in global energy prices. In ensuring that inflation returned sustainably to the 2% target, monetary policy would continue to need to balance the costs of leaning too little against second-round effects and the costs of responding too much. The right balance was likely to change depending on how events unfolded and propagated through the economy.
20: The Committee was also continuing to consider the three scenarios set out in the April Report, which illustrated a range of possible outcomes for the UK economy given the uncertainty stemming from the conflict. In Scenario A, energy prices were conditioned on market futures curves in the 15 days to 22 April 2026. In Scenarios B and C, the paths of energy prices were assumed to be higher and more persistent to varying degrees. There were no second-round effects from the energy shock in Scenario A. Second-round effects were incorporated in Scenarios B and C, and materially so in Scenario C.
21: At this meeting, the Committee’s discussions focused on: the extent of underlying UK disinflation prior to the conflict; the near-term outlook for inflation and energy prices; the degree to which economic slack would continue to restrain inflation persistence; the evidence of any second-round effects from the energy shock so far; and what continued uncertainty around the impact of geopolitical tensions on the UK economy implied for current and prospective policy-setting.
22: Recent data outturns had provided some greater reassurance that there had been sustained disinflation pre-conflict. Prior to the conflict, expectations had been for inflation to be close to the 2% target from April, and news in energy prices owing to the conflict had more than accounted for the higher outturns in headline inflation in April and May, relative to the February Report. Non-energy price inflation, particularly of goods, had been moderating but in aggregate remained above a target-consistent pace. Wage growth was close to target-consistent levels, although forward-looking indicators suggested that the pace of decline could stall in future.
23: The immediate direct effects of the energy shock on inflation, and some indirect effects through higher input costs for firms, had so far evolved broadly as had been expected in April. The short-term inflation forecast was lower than at the time of the previous meeting, reflecting recent news in energy prices as well as downside news in the May CPI outturn. The Committee re-iterated that monetary policy should typically look through the direct effects and some indirect effects of an energy price shock, but should act to the extent required to prevent those effects becoming embedded in domestic wage and price-setting.
24: Members judged that risks to energy prices were still skewed to the upside. While noting global energy prices had recently moved lower, members judged that even in the event of prompt conflict resolution there could be a logistical delay in restoring energy production and transportation, and they noted the possibility of lingering instability. Accordingly, members were attentive to the risk that prices could remain elevated for a longer period, even if the risk of another sharp spike upwards had diminished somewhat.
25: In considering the potential impact of energy prices on medium-term inflation, as in April, the Committee judged that continued weakness in activity would limit the strength of some second-round effects. Members broadly agreed that a margin of slack had continued to emerge including in the labour market. Demand had remained subdued and consumption growth weak, and both household and business sentiment was weak. Taken together, this would restrain firms’ ability to pass through higher costs to higher prices, and would dampen wage bargaining. At the same time, some members cautioned that the attentiveness of households’ and firms’ inflation expectations after a period of above-target inflation, or structural changes, could increase the magnitude of second-round effects.
26: Clear evidence of signs of second-round effects would only ever emerge with a lag, and the Committee therefore agreed that it was too early to conclude one way or the other from the initial tentative and mixed evidence. On the one hand, firms’ own-price expectations were a little softer than had been expected in April. On the other hand, some members noted that household inflation expectations could have become more sensitive to near-term inflation news than in the past. This could affect the economy via price-setting behaviour as well as wage-setting in 2027.
27: The Committee would monitor the evolution of a wide range of forward-looking data and intelligence to allow timely assessments of the inflation outlook. The size and duration of direct effects of energy prices on UK inflation would clearly be important, as would the scale of indirect effects via increased business costs and the extent to which these were passing through via higher consumer prices or reduced profit margins. Second-round effects were also being monitored through indicators of price and wage-setting behaviour, including inflation expectations, firms’ own price expectations and future wage growth and settlements. The impact of the shock on the real economy would also be monitored, including through indicators of the labour market and economic slack.
28: In considering the near-term policy outlook, members agreed that financial conditions had tightened materially since before the conflict, which was already imparting some restraint to the economy. There had been a significant upward shift in UK short-term interest rates that had passed through to mortgage rates. This in part reflected the pricing out of Bank Rate cuts that had been expected before the conflict. Some of the upward slope in the yield curve also reflected ongoing uncertainty around the scale and duration of the conflict in the Middle East and the associated upside risks to the inflation outlook.
29: The Committee discussed how best policy should respond to uncertainty about the scale and duration of the energy shock. There were risks to balance from the trade-off between returning inflation to target too slowly and prolonged weakness in economic activity. All members nevertheless agreed that the appropriate policy response would depend primarily on the outlook for second-round effects. If higher inflation were to reflect mainly direct energy effects and second-round effects were to remain contained, there was a stronger case for tolerating a slower return of inflation to target, in the context of weak activity. However, there would be a more challenging trade-off if higher energy prices appeared to be feeding into more persistent domestic inflation. In that event, the weight placed on output stabilisation would be likely to diminish, and policy would need to remain restrictive for longer, or become more restrictive.
30: Members agreed that the appropriate policy response should be robust across a range of scenarios, given the uncertainty around how the outlook could evolve. There was a range of views around whether the tightening in financial conditions relative to pre-conflict was sufficient, was reflected in real restrictiveness, and would endure. Most members judged that this tightening provided insurance against inflation risks, while preserving optionality to adjust course as more conclusive evidence emerged. Some members noted that a modest rise in Bank Rate would help to ensure that financial conditions remained consistent with the intended degree of monetary restraint and reduce the risk of later, larger tightening.
The immediate policy decision
31: Seven members preferred to maintain Bank Rate at 3.75% at this meeting. For six of these members (Andrew Bailey, Sarah Breeden, Swati Dhingra, Clare Lombardelli, Dave Ramsden and Alan Taylor), recent data outturns provided some further evidence that underlying disinflation had been on track pre-conflict. Upside risks to energy prices had receded, although they remained. The higher interest rates facing households and businesses were already acting to reduce inflation over time and therefore a hold in Bank Rate at this meeting was appropriate. There was nevertheless a range of views on how the energy shock might propagate and therefore the policy response that might be required in future. For one member (Catherine L Mann) upside inflation risks were more prominent across possible future outcomes, but an immediate increase in Bank Rate was not required given their view that policy tightening would transmit to the economy rapidly.
32: Two members (Megan Greene and Huw Pill) preferred a 0.25 percentage point increase in Bank Rate at this meeting. These members were less confident in the pace of the underlying disinflation pre-conflict. They were more concerned that households’ and firms’ greater attention to inflation outturns than in the past would lead to larger second-round effects for a given energy price profile. And they noted that the tightening in financial conditions could reverse in the absence of an increase in Bank Rate. Given significant uncertainty about the extent of second-round effects, they preferred to raise rates as part of a risk management strategy.
33: The Chair invited the Committee to vote on the proposition that:
- Bank Rate should be maintained at 3.75%.
34: Seven members (Andrew Bailey, Sarah Breeden, Swati Dhingra, Clare Lombardelli, Catherine L Mann, Dave Ramsden and Alan Taylor) voted in favour of the proposition. Two members (Megan Greene and Huw Pill) voted against the proposition, preferring to increase Bank Rate by 0.25 percentage points, to 4%.
MPC members’ views
35: Members set out the rationale underpinning their individual votes on Bank Rate.
Members are listed alphabetically under each vote grouping. References to scenarios relate to those set out in Section 3 of the April Monetary Policy Report.
Votes to maintain Bank Rate at 3.75%
Andrew Bailey: There has been a marked fall in energy prices in recent days, reflecting progress on talks involving US and Iran. But the situation remains unpredictable, and there is clearly a risk that energy prices remain elevated for an extended duration. Recent inflation outturns give greater confidence that gradual underlying disinflation has continued. Labour market data show some further softening, and there are further signs of demand weakness. Our remit recognises that attempting to bring inflation back to the target too quickly may cause undesirable volatility in output. Given the context at present of softness in the real economy and uncertainty around the scale and duration of the shock to energy prices, tolerating temporarily above-target inflation as part of a return to target is an appropriate way to approach the trade-off, providing inflation expectations remain contained. I am content at the present time with holding, while accepting that risks to inflation and interest rates are on the upside, as reflected in the upward slope in the sterling yield curve, which appears to be accounted for more by risk premia than expected rates. I would respond promptly to any signals that an extended period of elevated energy prices could be leading to stronger possible second-round effects.
Sarah Breeden: Despite recent developments, the outlook for energy prices remains highly uncertain. Monetary policy should look through the direct effects of the energy shock, partially through the indirect effects and act forcefully and early against any material second-round effects. The economic environment means the chance of material second-round effects is small and, although it is early days, there has been nothing in the news since April to change that assessment. Recent releases suggest that, absent the shock, disinflation was firmly on track, and the weak demand outlook should continue to feed through to firms’ pricing decisions. The financing conditions facing households and firms have tightened materially since the conflict, leaning against inflationary pressures and leaving us well placed to monitor how the economy evolves. There are risks around this. Household inflation expectations have risen materially, and although their impact on wage growth should be moderated by the loose labour market, they pose an upside risk to inflation. On the other side, weak demand might pull inflation below target in the medium term. In my view, the current stance of financial conditions balances these risks, but I remain committed to acting early and decisively should material second‑round effects become likely.
Swati Dhingra: Although the likelihood of extreme outcomes on both sides appears to have receded, I continue to see the uncertainty around the size of the global commodity shock as dominating the degree to which inflationary pressures risk getting embedded in domestic sources of inflation. Absent the shock, monetary policy would be too restrictive for the cyclical position. Disinflation appeared on track pre-conflict, with nominal indicators trending consistently in the right direction, and broad-based evidence of emerging slack and cumulative weakness in the economy. While these initial conditions would dampen momentum in second-round effects, there remain significant risks from overlapping adjustments to the subsequent supply shocks that have occurred in the recent past. I see the balance of risks to the upside on prices and downside on activity. Maintaining current restrictiveness would weigh against second-round effects and provide time to learn more about the size and duration of the first-round energy and commodity price shocks in the near term. If the situation were to worsen, this may warrant some further tightening. But I do not see a compelling case to increase Bank Rate pre-emptively without new evidence of more intense first-round shocks.
Clare Lombardelli: Developments since our last meeting point in different directions for inflation. Disruption to energy prices and supply chains from events in the Middle East has persisted. This will prolong the time that inflation will remain above target due to direct and indirect effects, increasing the risk of second-round effects. Whereas the economic data has continued to show that, absent the energy shock, disinflation was gradually continuing. It is too early to draw any conclusions on second-round effects from the energy shock. So far, evidence has been mixed and the signal is broadly consistent with standard pass‑through. To date there is also no evidence of a rapid deterioration in demand. There are risks for inflation in both directions. Consumers and businesses have faced sustained above-target inflation in recent years which will affect behaviour, expectations and reactions to price rises. They also report negative sentiment which risks further weakening demand. Financing costs have risen since before the conflict, which continues to weigh against the greater inflation pressures. Holding Bank Rate remains appropriate as we learn more about the scale and duration of the shock and its propagation. Were signals to indicate inflation would persist above target, this would require policy to respond more forcefully to inflationary pressures.
Catherine L Mann: Activity, labour market, and nominal pressures have moderated. However, there remain differences in pace across public and private sector, as well as between the most recent data and inflation expectations. Private sector wage growth is near target-consistent, but whole economy wage growth has increased. Market-sector services output is soft, although manufacturing and government have provided some momentum to GDP. Volatility in both inflation and financial markets has increased; both are headwinds for business investment. Higher inflation and volatility tend to encourage households to maintain high savings buffers. Hypotheticals for the Middle East conflict include resolution, sporadic continuance, and escalation. Consider the first two. With rapid resolution, activity rebounds, uncertainty clears, but energy prices remain high with infrastructure and inventory rebuild: an activist hike could be needed. With sporadic continuance, uncertainty weighs on activity, but energy prices increase, which could trigger threshold effects: a worsening trade-off, but needing an activist hike. Why wait? Research shows that a forceful Bank Rate decision can have a quick effect on inflation and inflation expectations. So I have time to continue to evaluate measures of inflation expectations and financial restrictiveness to determine whether firms’ pricing and 2027 wage negotiations are on a target-consistent path for the medium term.
Dave Ramsden: Events in the Middle East remain the key determinant for inflation, and there remain upside risks from continued energy supply disruption as well as downside risks from subdued activity. There has been a material tightening in financial conditions, which is providing necessary restrictiveness, weighing against the upside balance of risks in the near term. I continue to place about equal weight on Scenarios A and B materialising after the summer, but even less weight than before on Scenario C. The evidence so far on how the economy will be impacted by the energy price shock is uncertain. Data outturns continue to confirm our understanding of the pre-conflict economy. The labour market has continued to loosen steadily, and the domestic disinflation process has also continued. Early, necessarily tentative, indications suggest that second-round effects might be limited, absent further escalation of the energy cost shock. Holding Bank Rate at this meeting keeps options open as we continue to learn more about the path of the conflict. My reaction function will remain state-contingent on both the development of the conflict, and what that means for the outlook for the economy.
Alan Taylor: The conflict and its implications for energy prices remain of central importance, even as a deal emerges. Potential second-round effects are an endogenous consequence of the shock. That does not negate a key role for the starting position of slack in the economy and of our restrictive policy stance. Recent data point further against a need for tightening. Absent mechanical direct and indirect energy effects from the conflict, CPI inflation would have been at target in April. Backward-looking wage data suggest that pay growth did not get stuck at elevated levels. Material second-round effects require changes in price and wage-setting behaviour. I believe this channel is likely to be weak given the slack that has accumulated. Policy is restrictive, 75 basis points above my estimate of neutral and where we might have been quite soon. The yield curve shows we have tightened a lot just by holding. One could articulate a case for tightening in risk space, but that is far from my assessment given my own scenario probabilities and trade-offs. Absent worse news, I cannot see a case for tightening now, and an active hold is reasonable. If the conflict resolution holds, and risks diminish, lower rates could be preferred.
Votes to increase Bank Rate to 4%
Megan Greene: The implementation of a reported peace deal and the evolution of energy prices remain uncertain. Slack should mitigate the extent of second-round effects triggered by the energy shock, but households and businesses are more attentive to rises in inflation today. This is reflected in households’ and firms’ inflation expectations and the sensitivity of long-term expectations to short-term inflation surprises, which suggest expectations may be less solidly anchored. Given significant uncertainty about the extent of second-round effects, we should pursue a risk management strategy. Analysis conducted using the Bank’s endogenous policy toolkit demonstrates that holding Bank Rate assuming lower second-round effects (Scenario B) but discovering next year they were greater (Scenario M, from my latest speech) and course-correcting results in inflation that peaks higher and remains above target the entire outlook. Hiking Bank Rate assuming greater second-round effects, then discovering they were smaller and course-correcting results in a very moderately lower output gap and inflation returns to target at the end of the forecast period. These risks are asymmetric, so we should insure against the possibility of larger second-round effects until we have evidence to determine they are not materialising. A proactive hike now in Bank Rate should help anchor inflation expectations.
Huw Pill: Upside risks to the lasting achievement of the 2% inflation target have increased in recent months on account of events in the Gulf and their implications for commodity prices and supply chains. Recognising the significant uncertainty that surrounds the UK inflation outlook, raising Bank Rate to 4% continues to be the most robust monetary policy response to the intensification of these risks. Global energy prices remain volatile, and elevated compared with their pre-hostilities level, despite the announcement of a new ceasefire. Even with a looser labour market, the risk that second-round effects will create greater intrinsic persistence in UK inflation remains. One potentially pernicious channel of second-round effects is catch-up dynamics in pricing decisions as firms and households seek to defend their margins and purchasing power in the face of higher food and energy prices. While overall UK financial conditions have tightened since the conflict began, I continue to favour prompt but modest action on Bank Rate now. This would establish a stance of monetary policy that is well-placed to address the significant uncertainties the MPC faces. It will also put the MPC in a good place from which to respond to the evolution of events from here.
Operational considerations
36: On 17 June, the stock of UK government bonds held for monetary policy purposes was £522 billion.
37: The following members of the Committee were present:
- Andrew Bailey, Chair
- Sarah Breeden
- Swati Dhingra
- Megan Greene
- Clare Lombardelli
- Catherine L Mann
- Huw Pill
- Dave Ramsden
- Alan Taylor
Brian Bell was present as the Treasury representative.
Jonathan Bewes was present on 9 June, as an observer for the purpose of exercising oversight functions in his role as a member of the Bank’s Court of Directors.
Bitcoin at $64K: Sell-Off Triggered by Hawkish Comments from the New Fed Chair
Market Overview
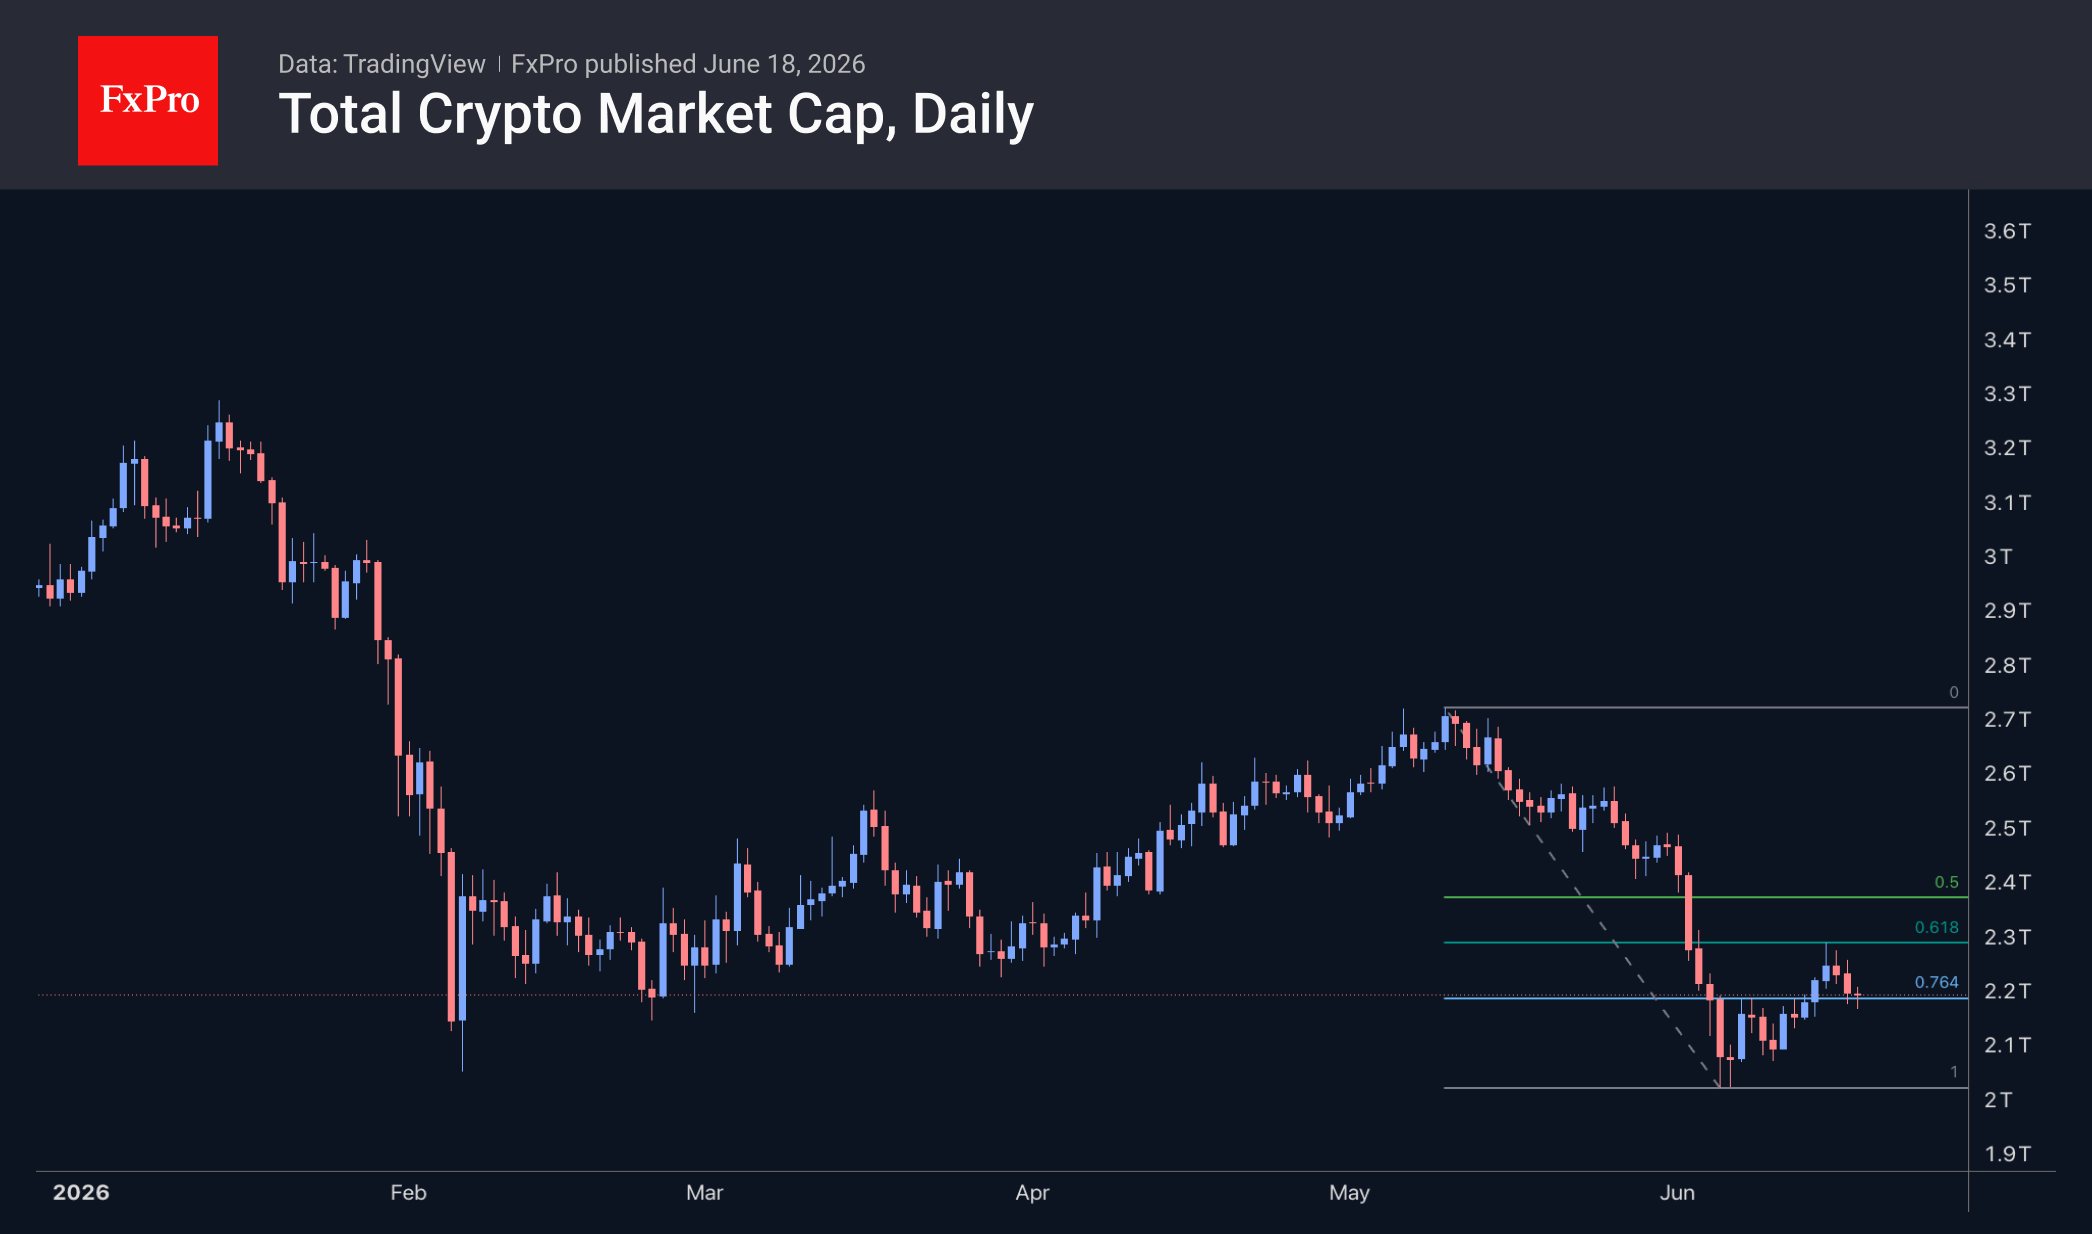
The crypto market capitalisation fell 2.6% over the day to $2.2T, following a global sell-off of risky assets triggered by hawkish comments from the new Fed Chair, Warsh. However, after the initial sell-off, buyers appear to be returning to the markets, in line with a recovery in risk appetite in the equity market. Whether this is good or bad, cryptocurrencies have once again become tied to the movements of the dollar and the equity market. Among the popular coins, the best performers over the last 24 hours were Stellar (+7.3%), Algorand (+1%) and Tron (+0.7%), which were rare exceptions against the backdrop of a broadly falling market. The biggest fallers were Uniswap (-14%), Zcash (-7.7%) and SushiSwap (-6.1%).
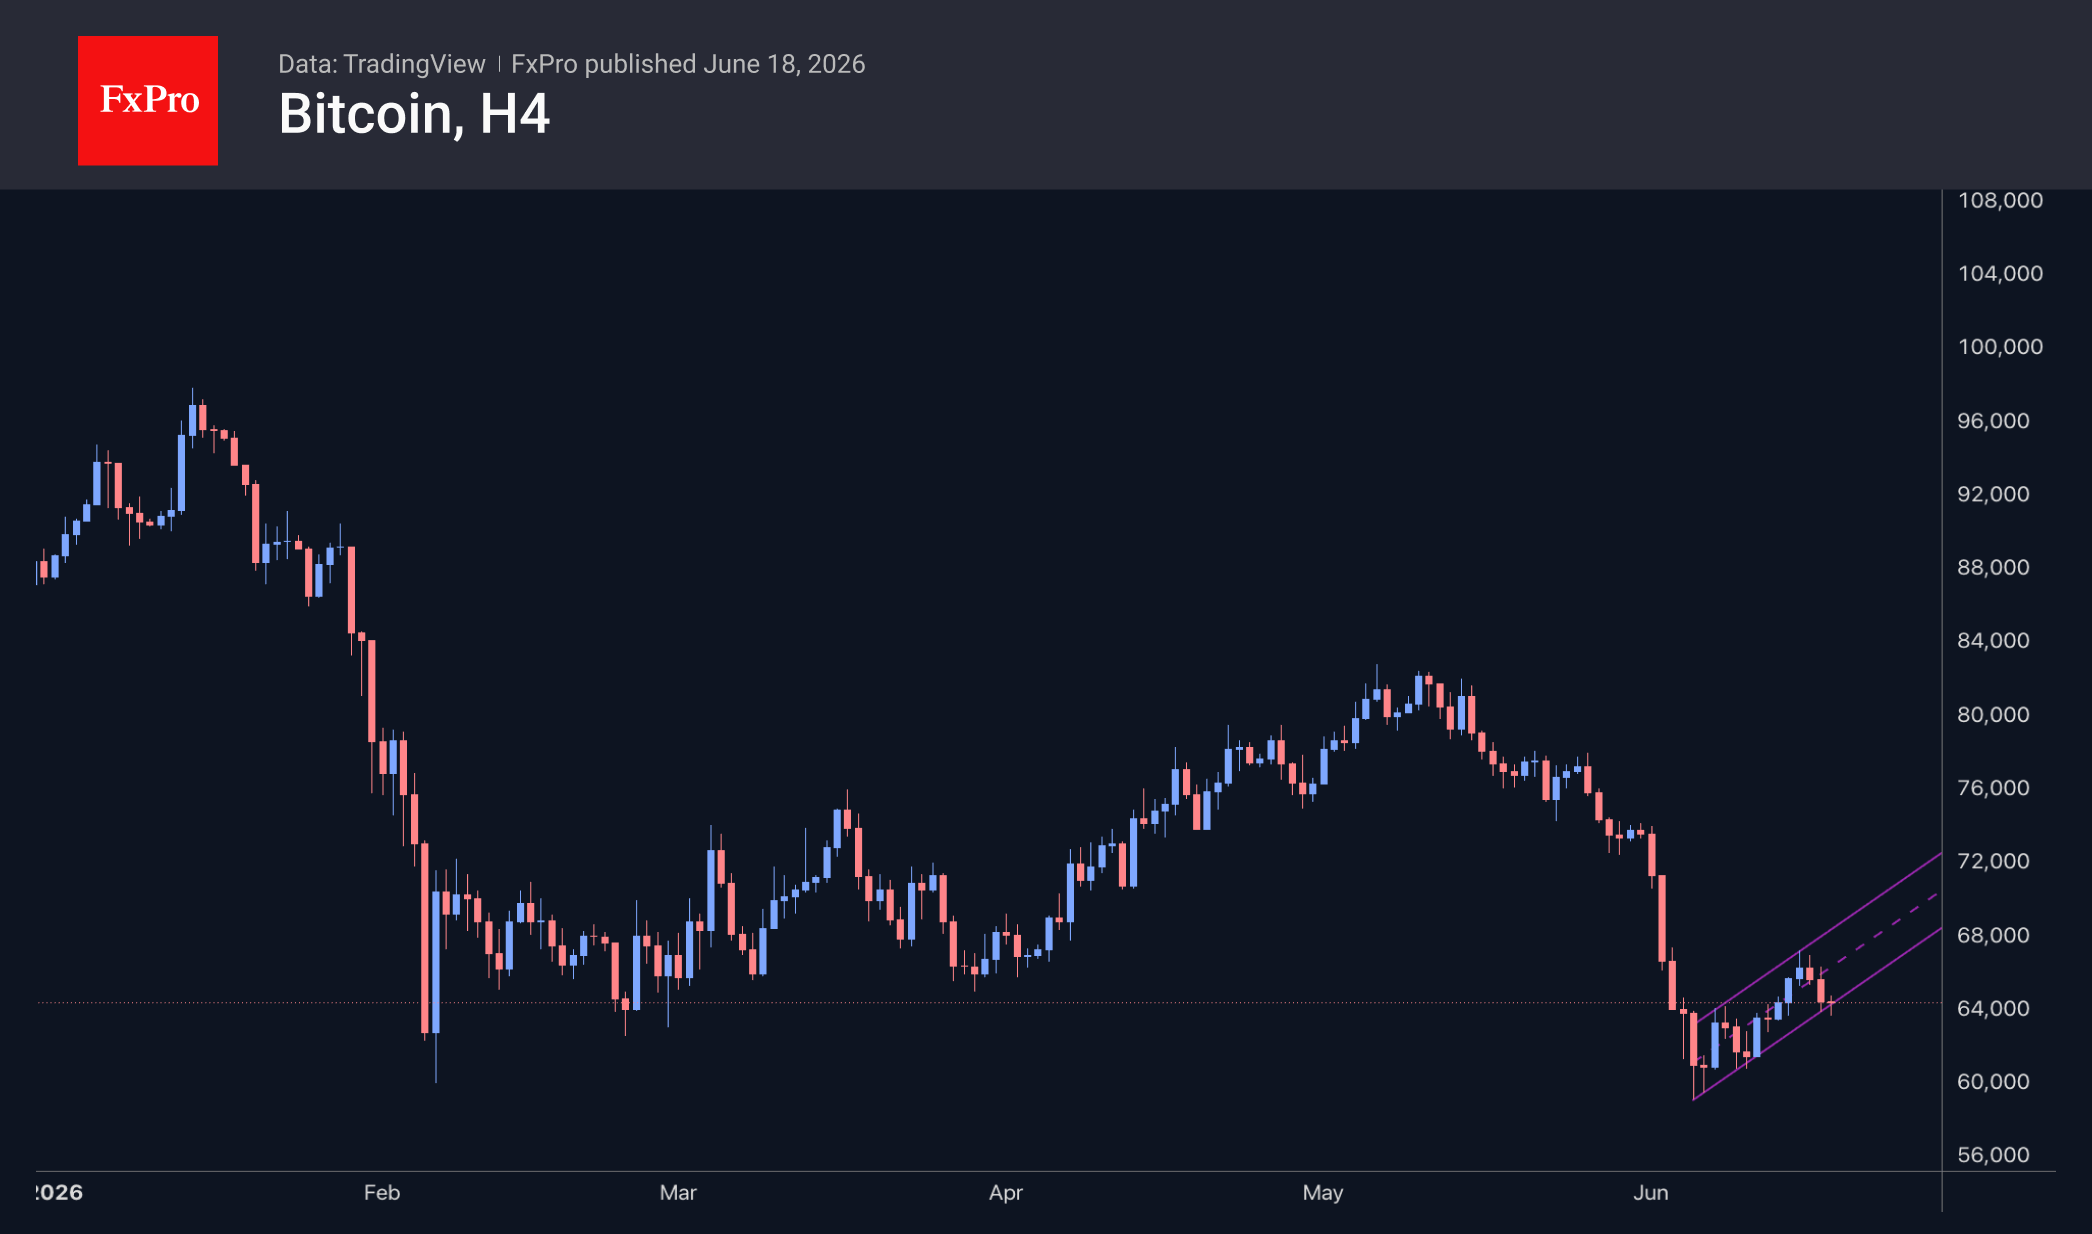
Bitcoin took a hit amid a global sell-off in risky assets, plunging below $64K and towards the lower boundary of the upward trading range in place for almost two weeks. Unless there is a rebound from current levels, we will have grounds to conclude that the rally has ended. A break below the recent lows in the $59K–$60K range would confirm that the sell-off has reached a new level, with a potential target for bears near $45K.
News Background
Bitcoin remains under pressure amid fears of further selling by Strategy, according to QCP Capital. The company may need to sell more BTC to fund its dividend payments.
One of Strategy’s main mechanisms for buying Bitcoin has ceased to function normally. Stretch (STRC) preference shares have traded below their $100 par value for several weeks, limiting the company’s ability to raise funds through them to buy new BTC.
BitMEX co-founder Arthur Hayes has begun increasing his holdings in the second-largest cryptocurrency following the altcoin sell-off. According to Onchain Lens, 4,400 Ethereum, worth approximately $7.9 million, were deposited into a wallet linked to him over two days.
Selling pressure in the altcoin market has reached its highest level in the past five years. The cumulative net selling volume on centralised exchanges has approached $209 billion, according to CryptoQuant. This is the worst figure since records began in 2020.
The largest platform for launching meme coins has seen a significant drop in activity. The number of ‘successful’ meme coins on Pump.fun has plummeted by 80% over three months, and the negative trend has affected the entire Solana blockchain ecosystem.
The FxPro Analyst Team
GBPUSD Awaits Bank of England Meeting Near April Lows
GBPUSD is attempting to stabilise near 1.3317 on Thursday morning.
The pound sterling barely reacted on Wednesday to weaker-than-expected UK inflation data. Investors preferred to take a wait-and-see approach ahead of today’s labour market statistics and the Bank of England meeting. However, GBP still had to respond to movements in the US dollar following the Federal Reserve meeting.
Inflation in May remained at 2.8% y/y, while the market had expected it to accelerate to 3.0%. The weaker-than-forecast data revived the debate over whether the Bank of England will need to raise interest rates at all this year.
Market participants are still pricing in one rate hike before the end of the year. However, if the regulator signals that it is ready to maintain the current policy stance without taking additional steps, this could increase pressure on the British currency.
The Bank of England meeting itself is expected to end with no change in the interest rate. Nevertheless, some members of the Monetary Policy Committee, including Chief Economist Huw Pill, may once again vote in favour of tighter policy. This will be closely watched by the market.
Investors will also pay close attention to employment data, which will serve as an important reference point for the Bank of England’s future decisions. At the same time, the market is monitoring political developments in the UK, as possible changes within the ruling Labour Party could add a political risk premium to the pound.
For now, GBP remains relatively stable. However, the next 24 hours may prove decisive for expectations regarding the Bank of England’s interest rate path and the further dynamics of the British currency.
GBP/USD Technical Analysis
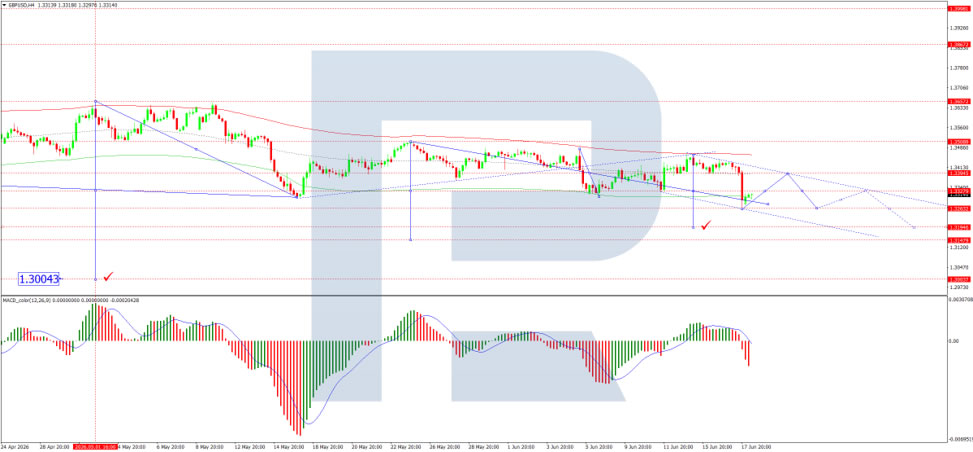
On the H4 chart of GBP/USD, the market has completed a downward wave to 1.3262. A growth link towards 1.3340 is expected. In practice, a broad consolidation range is forming below this level. If the price breaks out of the range upwards, the potential will open for the wave to continue towards 1.3500. If the price breaks out downwards, the potential will open for a further decline towards 1.3194. Technically, this scenario is confirmed by the MACD indicator: its signal line is below zero and directed firmly downwards.
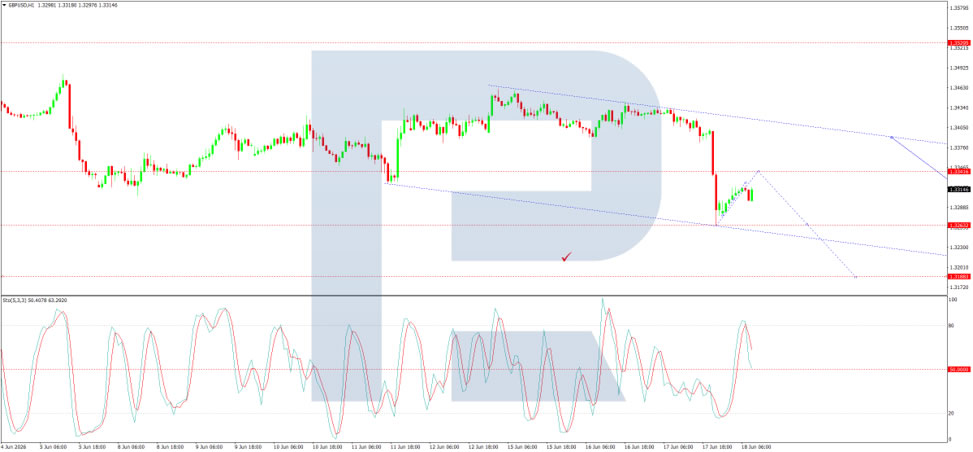
On the H1 chart of GBPUSD, the market has formed a compact consolidation range around 1.3300. At the moment, the range has expanded downwards to 1.3297. Further growth towards 1.3340 is expected. Technically, this scenario is also confirmed by the Stochastic oscillator: its signal line is above 50 and directed firmly upwards towards 80.
GBP/JPY: Ascending Triangle Under Pressure
The GBP/JPY pair has come under pressure after the Bank of Japan raised its policy rate to 1.0% on 16 June. The Bank of England is following the opposite path: at its 30 April meeting, the Monetary Policy Committee (MPC) voted 8–1 to keep the base rate at 3.75%, with one member advocating an increase to 4%. The June MPC meeting, scheduled for 18 June, is expected by analysts to result in another hold, as inflation remains above the target level. The narrowing interest rate differential between the two central banks continues to build a fundamentally supportive backdrop for the yen.
Technical Picture
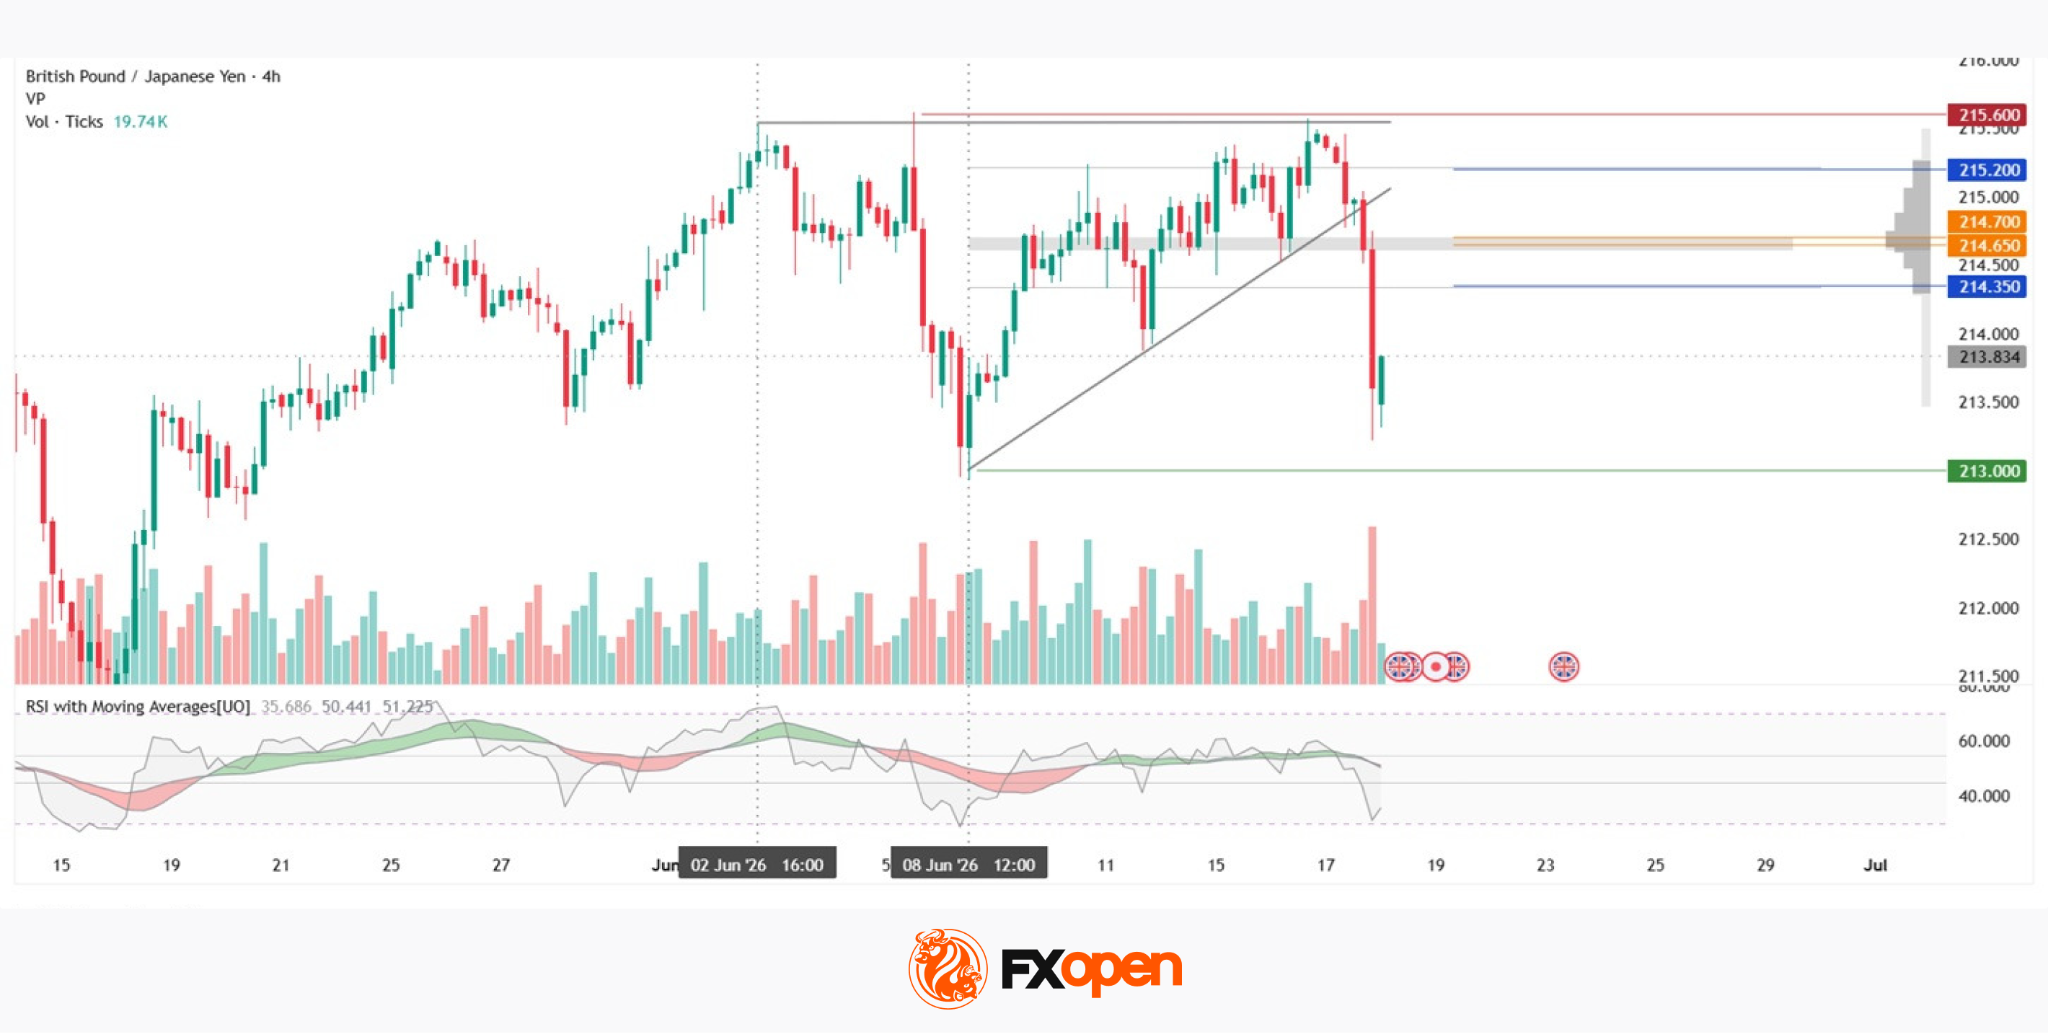
On the 4-hour GBP/JPY chart, an ascending triangle structure can be observed: since 8 June, an upward-sloping support has been forming against a horizontal resistance near the red 215.60 level. On 17 June, a strong bearish candle formed on elevated volume, and price broke below the pattern as well as the current market profile. If the downward momentum continues, the next key level on the downside is 213.00, which represents the base of the pattern.
In the event of a reversal, price may find support at the lower boundary of the profile at 214.35 and the POC zone at 214.65–214.70. If the upward move resumes and buyers manage to break above the upper profile boundary at 215.20, the 215.60 resistance area would come back into focus. RSI + MAs shows readings of 35, 50, 51 — the oscillator is approaching oversold territory, while its moving averages remain in neutral conditions.
Key Takeaways
The narrowing interest rate gap between the Bank of Japan and the Bank of England is creating a fundamentally supportive environment for the yen. RSI is approaching oversold levels, although the MAs remain in neutral territory. The next directional move is likely to be driven by the Bank of England’s decision on 18 June.
Trade over 50 forex markets 24 hours a day with FXOpen. Take advantage of low commissions, deep liquidity, and spreads from 0.0 pips (additional fees may apply). Open your FXOpen account now or learn more about trading forex with FXOpen.
This article represents the opinion of the Companies operating under the FXOpen brand only. It is not to be construed as an offer, solicitation, or recommendation with respect to products and services provided by the Companies operating under the FXOpen brand, nor is it to be considered financial advice.
Gold and Silver Rejected Key Resistance, 4,000 and 60 at Risk If Fed Hikes Twice
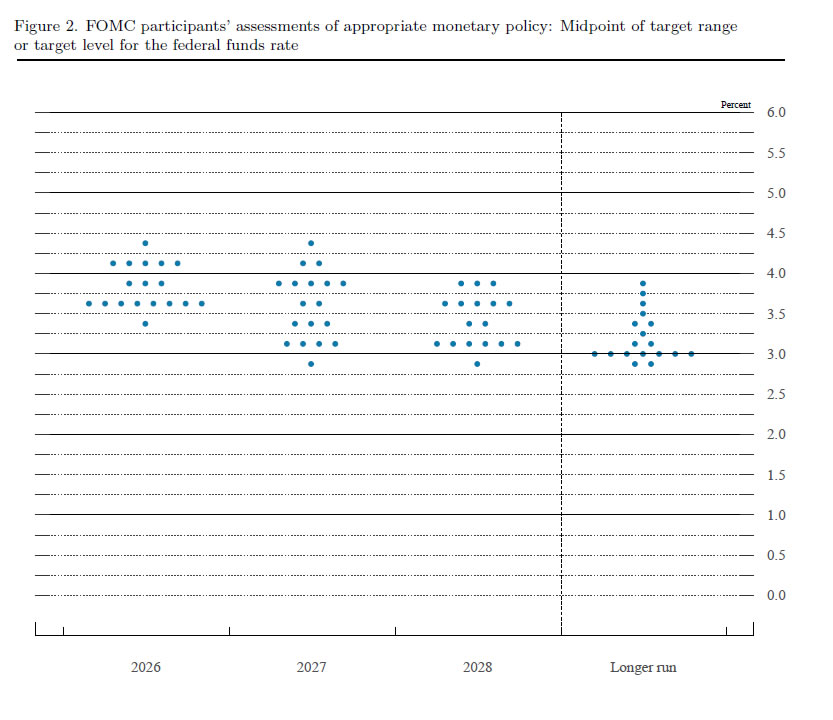
Gold and Silver came under renewed pressure after the Federal Reserve delivered a more hawkish-than-expected set of projections, prompting investors to quickly price in another rate hike later this year. While the Fed left rates unchanged at 3.50%-3.75%, the updated dot plot showed that policymakers have become increasingly concerned about inflation persistence. The median projection now implies one additional hike before year-end, a significant shift from expectations just a few months ago.
However, the bigger story may lie beneath the median. Markets have focused on the fact that nine policymakers now project at least one hike this year. Less attention has been paid to the six members who already see two or more hikes as appropriate, including one official projecting three increases. That means one-third of the Committee believes inflation risks could require considerably tighter policy than markets currently anticipate. If core CPI or PCE data remain elevated through the summer, it would take only a modest shift in projections for the median outlook to move from one hike to two.
That possibility matters greatly for precious metals. For now, markets are pricing one additional move, with September increasingly viewed as the most likely window given the release of a new Summary of Economic Projections. But if investors begin to contemplate a second hike, expectations for higher real yields and a stronger Dollar could intensify. In that scenario, Gold's 4,000 psychological support and Silver's 60 level may come under much greater pressure than they do today.
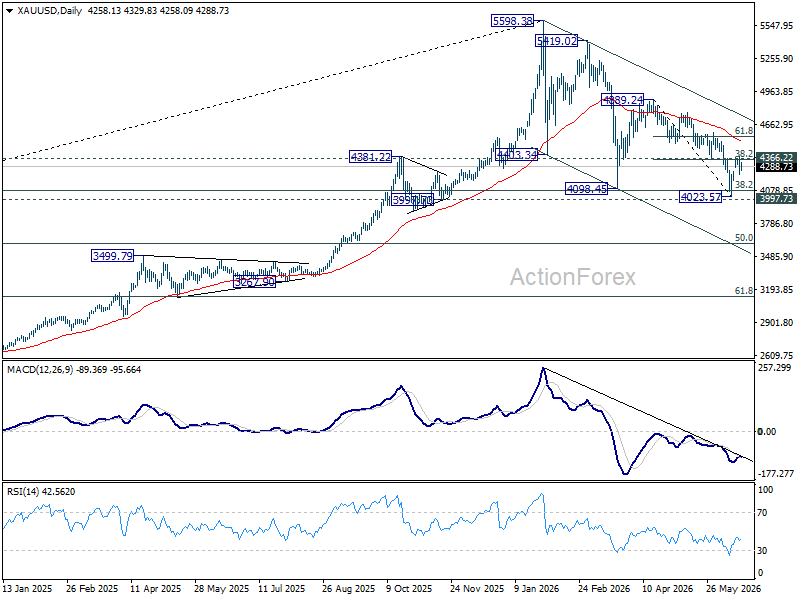
Technically, Gold's rally have stalled at exactly the wrong place. The spike to 4,382.84 looks like a bull trap after prices quickly fell back below the 4,354.25-4,366.22 cluster resistance zone, which includes 38.2% retracement of 4,889.24 to 4,023.57. The failure to establish a foothold above that barrier suggests the rebound from 4,023.57 may already be complete. Near-term bias has turned mildly bearish for a retest of that low, while the broader decline from 4,889.24 and the larger downtrend from 5,598.38 remain intact.
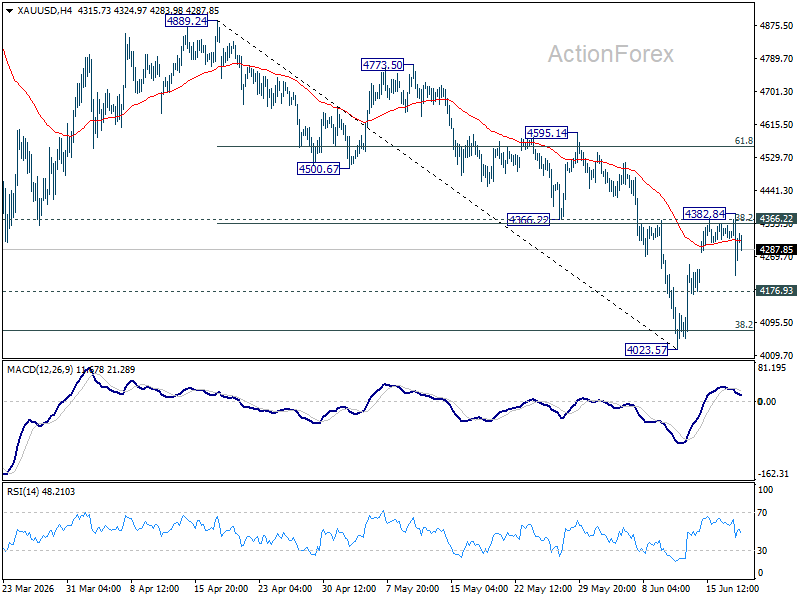
The technical backdrop remains challenging. Gold continues to trade comfortably below its falling 55 D EMA, now at 4,517.79, while remaining inside the medium-term descending channel that has guided price action throughout this year. These conditions favor an eventual break below the 4,000 psychological level. Nevertheless, a decisive move back above the 4,354-4,366 resistance zone would force a reassessment and raise the probability that a more durable bullish reversal is underway.
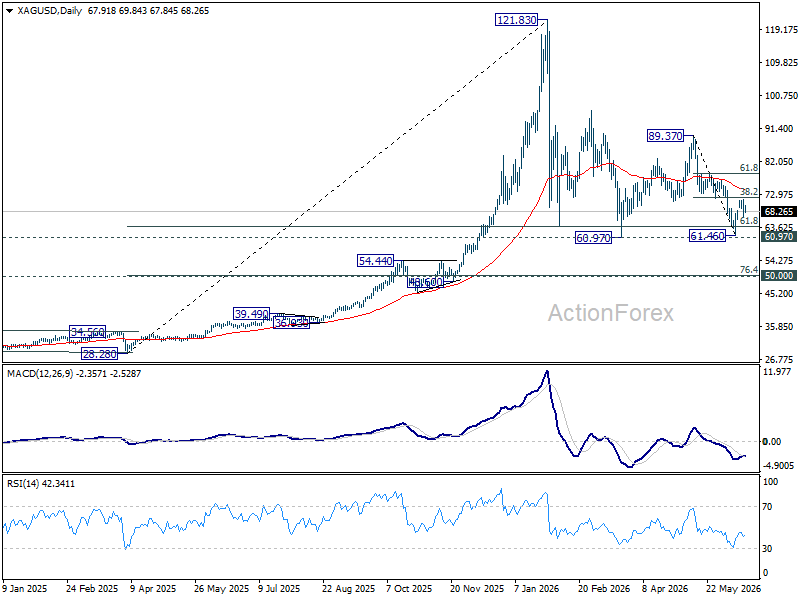
Silver is telling a similar story. The rebound from 61.46 appears to have completed at 71.54, just ahead of a key resistance cluster around 71.75 and 38.2% retracement of 89.37 to 61.46 at 72.12. The rejection there suggests the recovery was corrective rather than the start of a new uptrend. As a result, deeper losses toward a retest of 61.46 are favored.
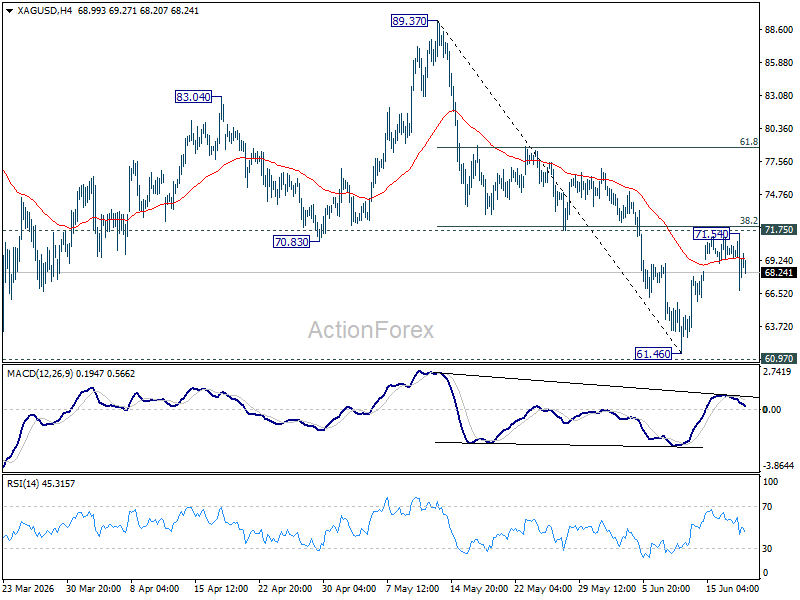
Silver also remains capped well below its falling 55 D EMA at 74.30, preserving the broader bearish structure. While 60.97 remains important support, the balance of risks still points toward an eventual break if Fed tightening expectations continue to build.
For now, range trading may dominate as investors wait for more clarity on the inflation outlook and the Fed's next move. But the message from both the charts and the dot plot is aligned. One hike is now the base case, and that would keep Gold and Silver in range. If the market starts to believe there could be two, Gold and Silver may face a much tougher second half of the year.
Pound Under Pressure: Markets Await Bank of England and SNB Decisions
The British pound remains under pressure following weaker-than-expected inflation data, which has reinforced expectations of further monetary easing by the Bank of England. Investors are staying cautious ahead of today’s policy meetings of both the UK central bank and the Swiss National Bank, which is affecting both GBP/USD and GBP/CHF.
The latest data published yesterday showed a slowdown in inflationary pressures in the UK. The annual consumer price index remained at 2.8%, while monthly price growth came in at just 0.2% compared with expectations of 0.4%. Core inflation also came in below forecasts, easing to 2.6% versus expectations of 2.7%. Additional signs of cooling price pressures came from a slowdown in the retail price index and weaker dynamics across several producer price indicators.
The easing of inflation pressures has increased expectations that the Bank of England could continue its gradual policy easing in the coming months. Although no change in interest rates is widely expected today, markets will focus on the accompanying statement, the voting split within the Monetary Policy Committee, and guidance on future policy steps.
GBP/USD
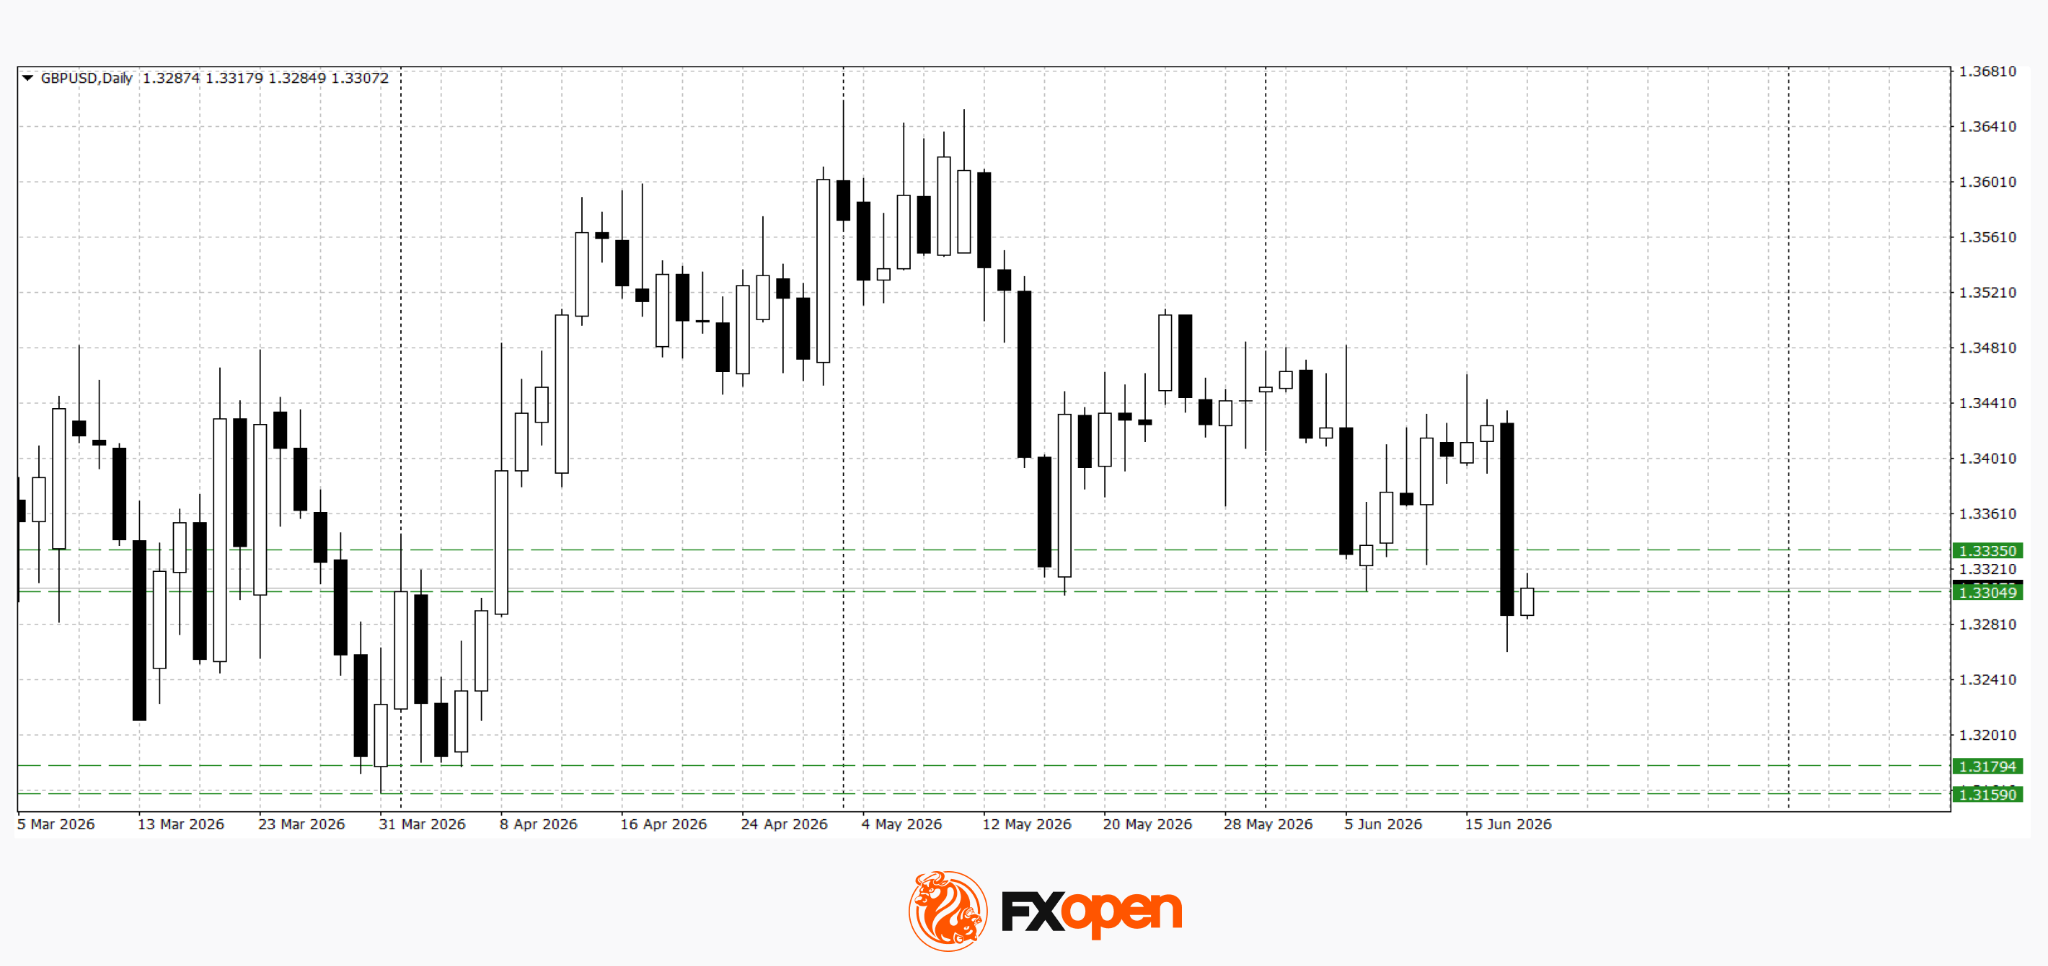
Yesterday, following Jerome Powell’s press conference, the pair fell sharply, renewing its recent low at 1.3300. If the 1.3300–1.3330 range, which has contained the pair’s decline for more than a month, turns into resistance, further downside towards 1.3180–1.3200 may follow. A break of the bearish scenario would require a sustained move above 1.3330.
Key events for GBP/USD:
- today at 09:00 (GMT+3): UK unemployment rate;
- today at 09:00 (GMT+3): UK average earnings (including bonuses);
- today at 15:30 (GMT+3): US Philadelphia Fed manufacturing index.
GBP/CHF
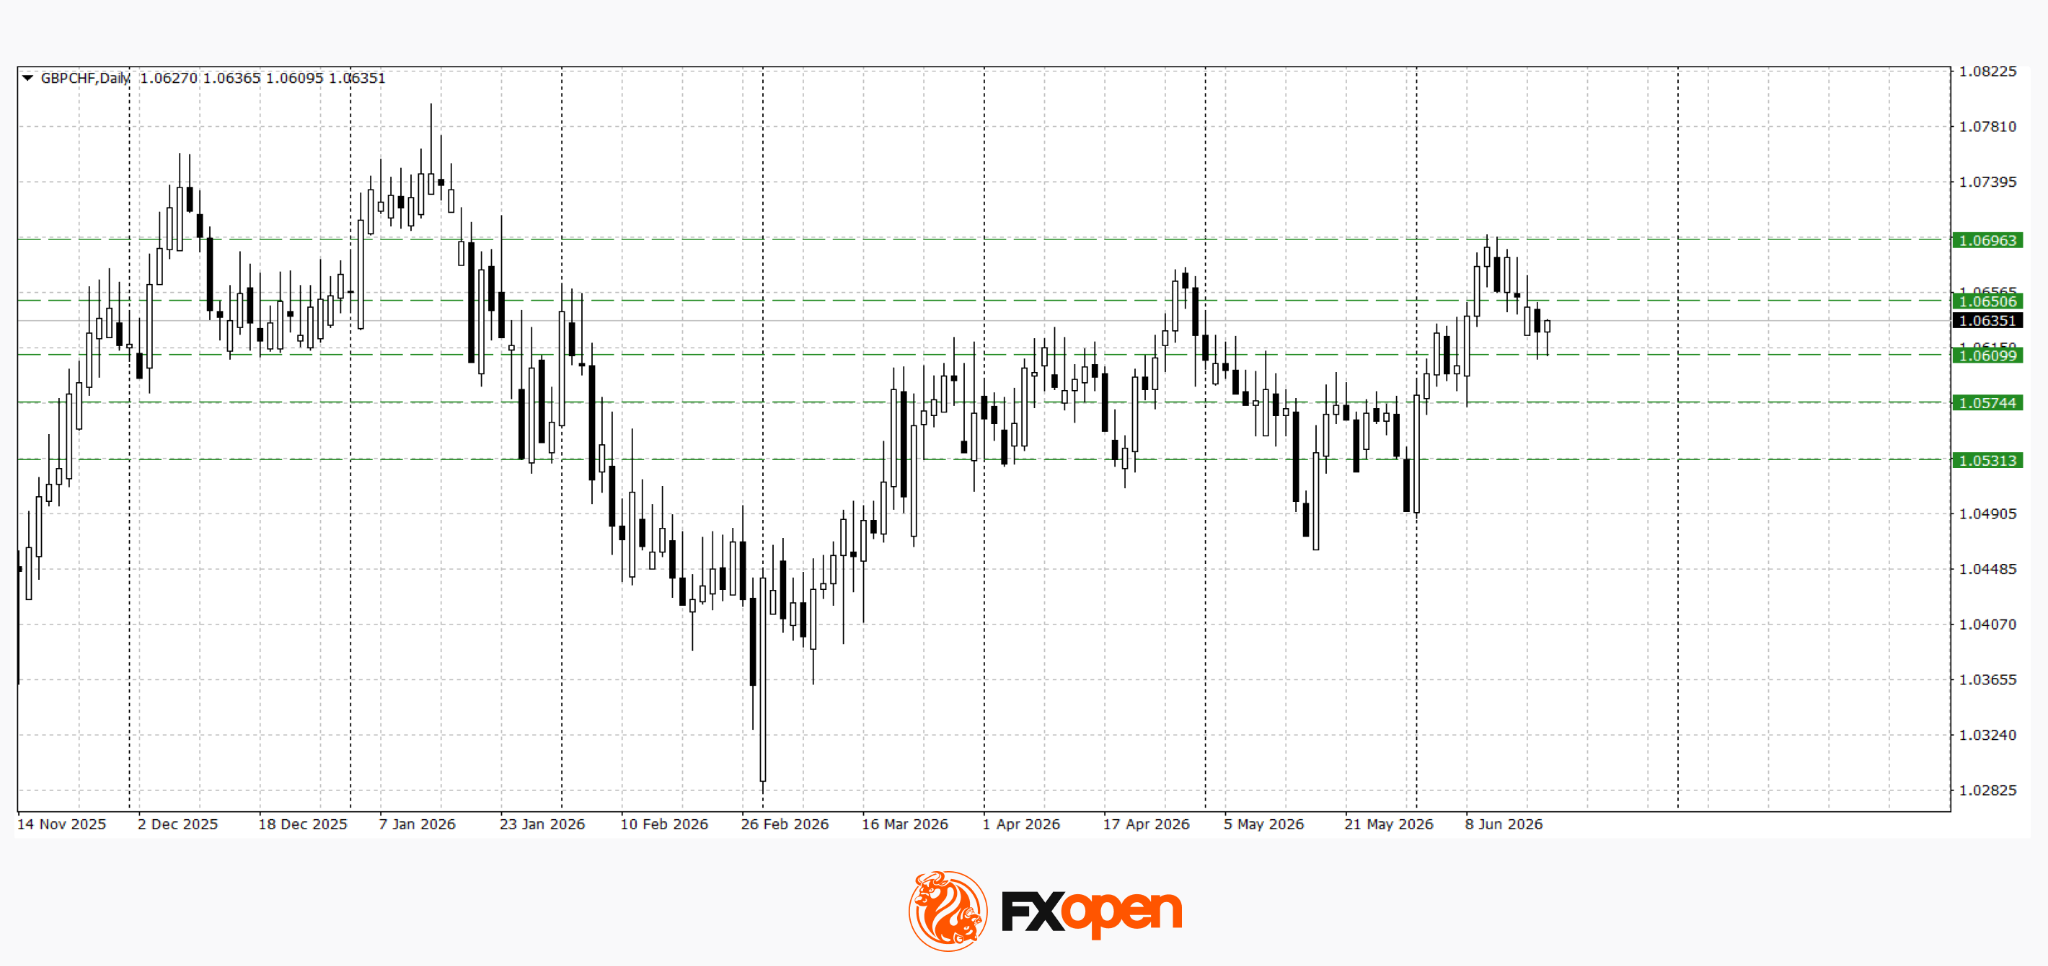
The GBP/CHF pair is showing a relatively modest decline. Price has found support at 1.0600 and is consolidating within the 1.0600–1.0650 range. A breakout from this range would provide clearer direction for the next move. A sustained move above 1.0650 could trigger a retest of the recent high at 1.0700, while a break below the lower boundary could lead to a deeper corrective decline.
Key events for GBP/CHF:
- today at 10:30 (GMT+3): Swiss National Bank interest rate decision;
- today at 11:30 (GMT+3): Swiss National Bank press conference;
- today at 14:00 (GMT+3): Bank of England interest rate decision.
Thus, the key drivers for GBP/USD and GBP/CHF today will be the Bank of England and Swiss National Bank decisions. Following weaker-than-expected inflation data, the market will be looking for confirmation of the UK central bank’s policy stance, while any shifts in expectations for future monetary policy could significantly influence GBP price action in the coming days.
Trade over 50 forex markets 24 hours a day with FXOpen. Take advantage of low commissions, deep liquidity, and spreads from 0.0 pips (additional fees may apply). Open your FXOpen account now or learn more about trading forex with FXOpen.
This article represents the opinion of the Companies operating under the FXOpen brand only. It is not to be construed as an offer, solicitation, or recommendation with respect to products and services provided by the Companies operating under the FXOpen brand, nor is it to be considered financial advice.
SNB Holds at 0%, Sees Energy-Driven Inflation as Temporary
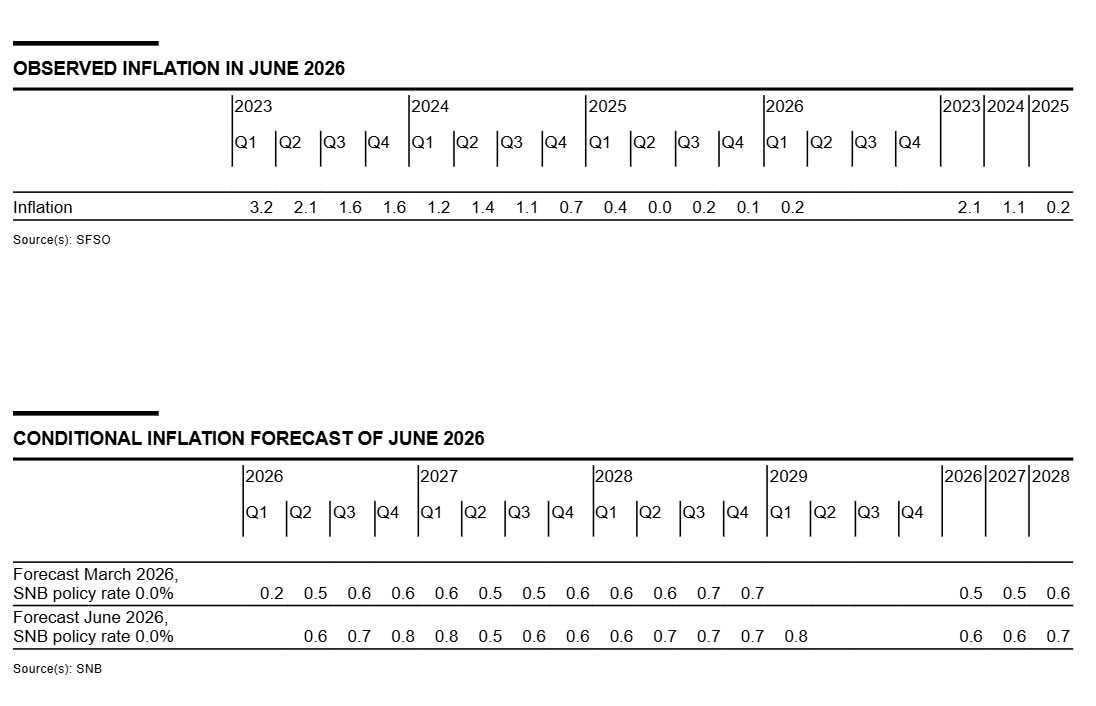
The Swiss National Bank delivered one of the least surprising decisions of the week, leaving its policy rate unchanged at 0% and signaling little urgency to alter its policy stance anytime soon. Despite inflation rising to 0.6% in May from 0.1% in February, the SNB made clear that it views the increase as largely an energy story rather than the start of a broader inflation problem. Policymakers emphasized that "medium-term inflationary pressure... is virtually unchanged" and described current policy settings as appropriate for maintaining price stability.
A key focus of the statement was the Swiss franc. The SNB reiterated that it has an "increased willingness to intervene in the foreign exchange market" and explicitly stated that it would act against a "rapid and excessive appreciation of the Swiss franc." That language underscores the bank's long-standing concern that an overly strong currency could push inflation too low and weigh on economic activity. In effect, the SNB continues to view franc strength as a greater policy challenge than inflation itself.
The central bank expects inflation to rise slightly in the near term before easing again as the effects of higher energy prices gradually fade. According to its latest projections, inflation will average 0.6% in both 2026 and 2027 before edging up to 0.7% in 2028. Importantly, the bank stressed that inflation remains within its definition of price stability across the entire forecast horizon, reinforcing expectations that rates can stay at 0% for an extended period.
The statement also highlighted significant uncertainty surrounding the global outlook, particularly developments in the Middle East and commodity markets. Nevertheless, the SNB described the Swiss economy as resilient, even though unemployment has risen somewhat in recent months. For markets, the takeaway is straightforward: unlike some major central banks that are increasingly worried about inflation becoming entrenched, the SNB still sees the current inflation pickup as temporary and remains prepared to use foreign exchange intervention if franc appreciation becomes excessive.