Sample Category Title
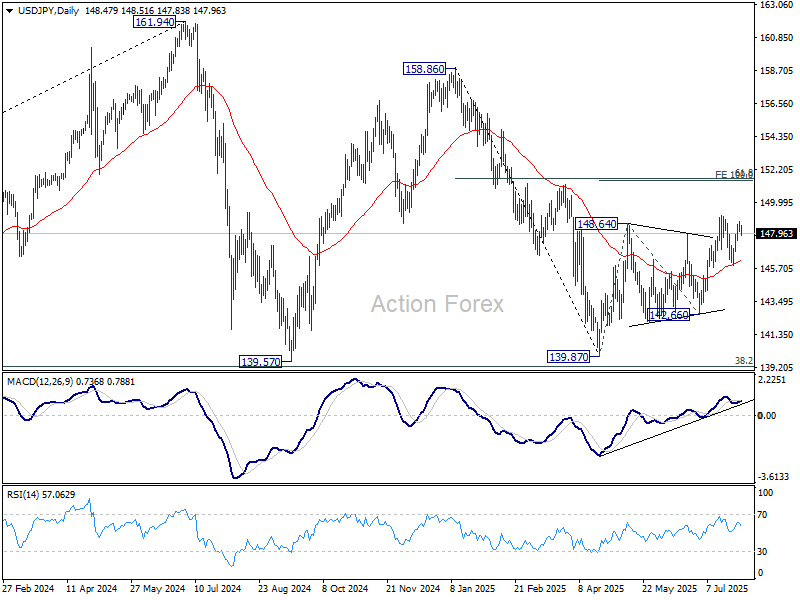
USD/JPY Daily Outlook
Daily Pivots: (S1) 148.15; (P) 148.48; (R1) 148.80; More...
Intraday bias in USD/JPY is turned neutral as it retreated ahead of 149.17 resistance. On the upside, firm break of 149.17 will resume the whole rise from 139.87 to 100% projection of 139.87 to 148.64 from 142.66 at 151.43, which is close to 151.22 fibonacci level. However, break of 147.50 support will extend the corrective pattern from 149.17, and target 145.84 support.
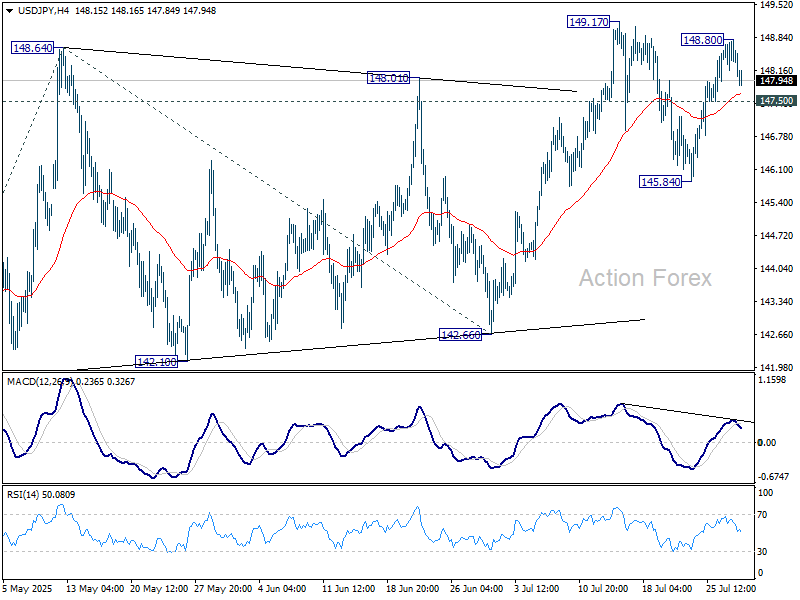
In the bigger picture, price actions from 161.94 (2024 high) are seen as a corrective pattern to rise from 102.58 (2021 low). Decisive break of 61.8% retracement of 158.86 to 139.87 at 151.22 will argue that it has already completed with three waves at 139.87. Larger up trend might then be ready to resume through 161.94 high. In case the corrective pattern extends with another fall, strong support is expected from 38.2% retracement of 102.58 to 161.94 at 139.26 to bring rebound.
GBP/USD Daily Outlook
Daily Pivots: (S1) 1.3316; (P) 1.3342; (R1) 1.3376; More...
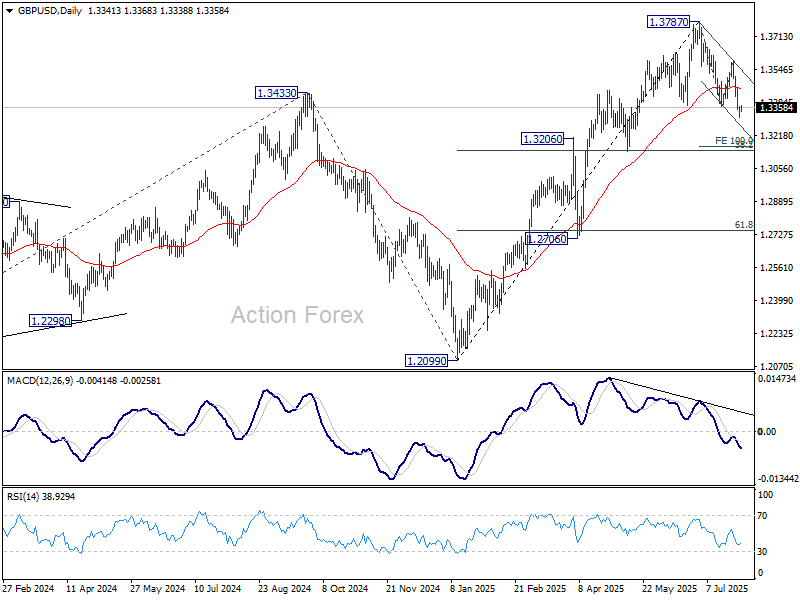
Intraday bias in GBP/USD is turned neutral with 4H MACD crossed above signal line. Some consolidations would be seen but risk will stay on the downside as long as 1.3587 resistance holds. Fall from 1.3787 is seen as a correction to the whole rise from 1.2099. Below 1.3306 will target 100% projection of 1.3787 to 1.3363 from 1.3587 at 1.3163.
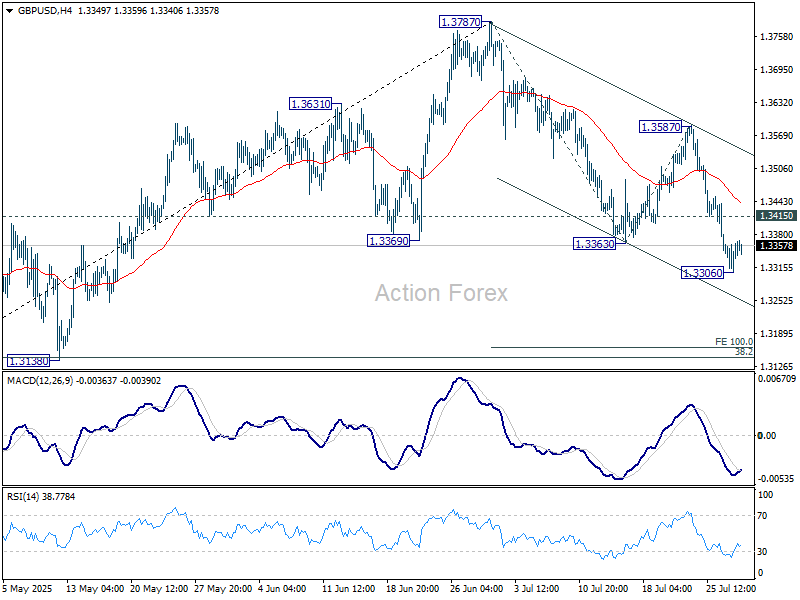
In the bigger picture, up trend from 1.3051 (2022 low) is in progress. Next medium term target is 61.8% projection of 1.0351 to 1.3433 from 1.2099 at 1.4004. Outlook will now stay bullish as long as 55 W EMA (now at 1.3045) holds, even in case of deep pullback.
USD/CHF Daily Outlook
Daily Pivots: (S1) 0.8022; (P) 0.8050; (R1) 0.8090; More….
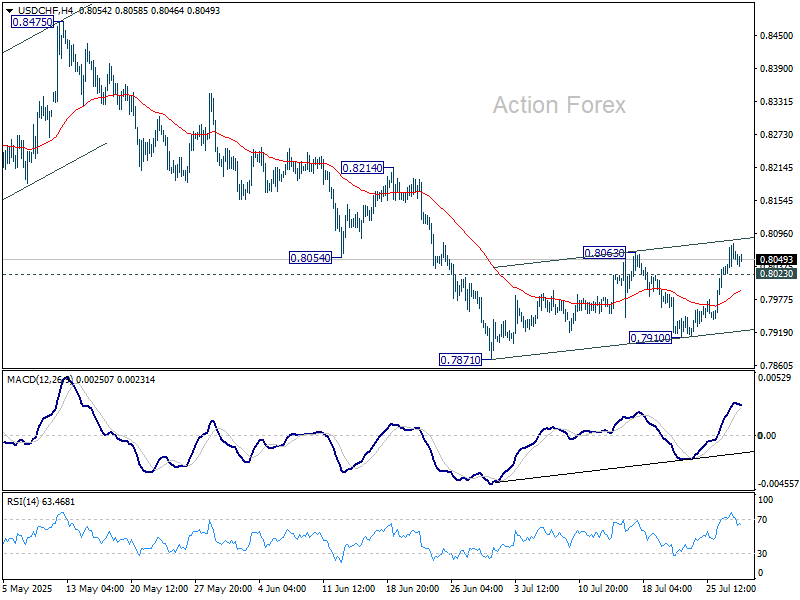
USD/CHF's corrective bounce from 0.7871 might extend higher. But upside should be limited by 55 D EMA (now at 0.8105). On the downside, below 0.8023 minor support will turn intraday bias neutral first. However, sustained trading above 55 D EMA will indicate medium term bottoming, and target 0.8475 resistance next.
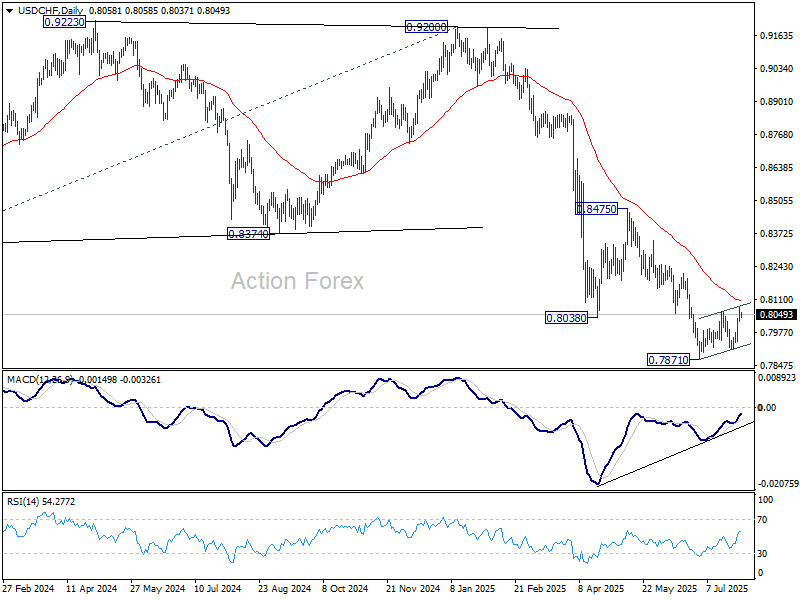
In the bigger picture, long term down trend from 1.0342 (2017 high) is still in progress. Next target is 100% projection of 1.0146 (2022 high) to 0.8332 from 0.9200 at 0.7382. In any case, outlook will stay bearish as long as 0.8475 resistance holds.
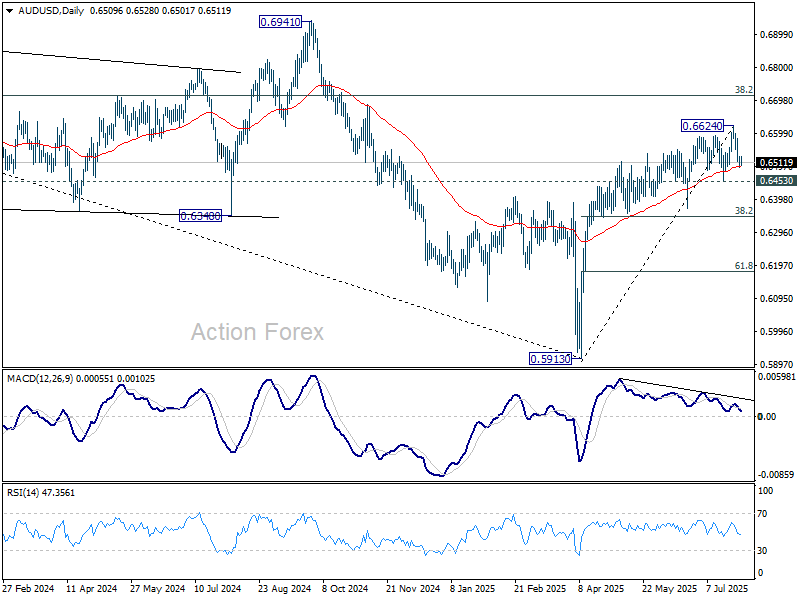
AUD/USD Daily Report
Daily Pivots: (S1) 0.6494; (P) 0.6512; (R1) 0.6528; More...
Intraday bias in AUD/USD remains neutral for the moment. Rally from 0.5913 might still extend through 0.6624. However, considering bearish divergence condition in D MACD, upside should be limited by 0.6713 fibonacci level on next rise. Meanwhile, firm break of 0.6453 will turn bias back to the downside for deeper fall.
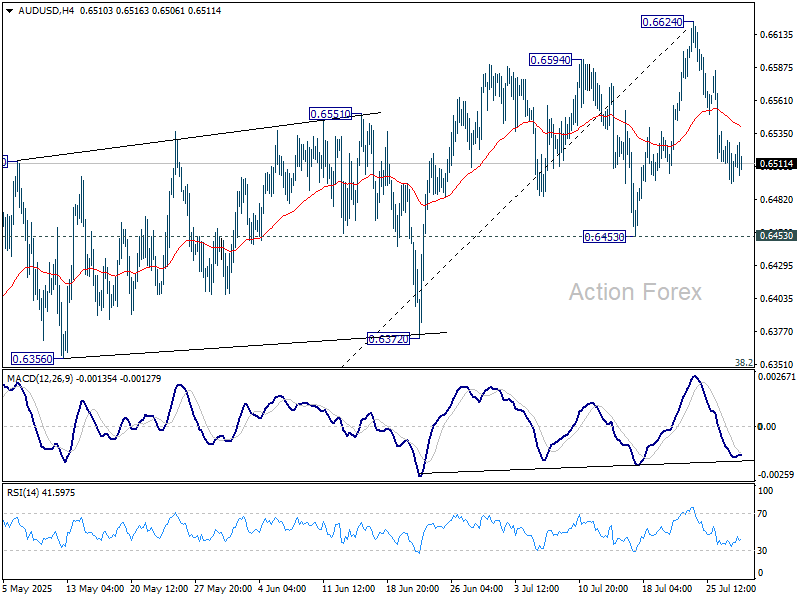
In the bigger picture, there is no clear sign that down trend from 0.8006 (2021 high) has completed. Rebound from 0.5913 is seen as a corrective move. While stronger rally cannot be ruled out, outlook will remain bearish as long as 38.2% retracement of 0.8006 to 0.5913 at 0.6713 holds. Nevertheless, considering bullish convergence condition in W MACD, even in case of another fall through 0.5913, downside should be contained above 0.5506 (2020 low).
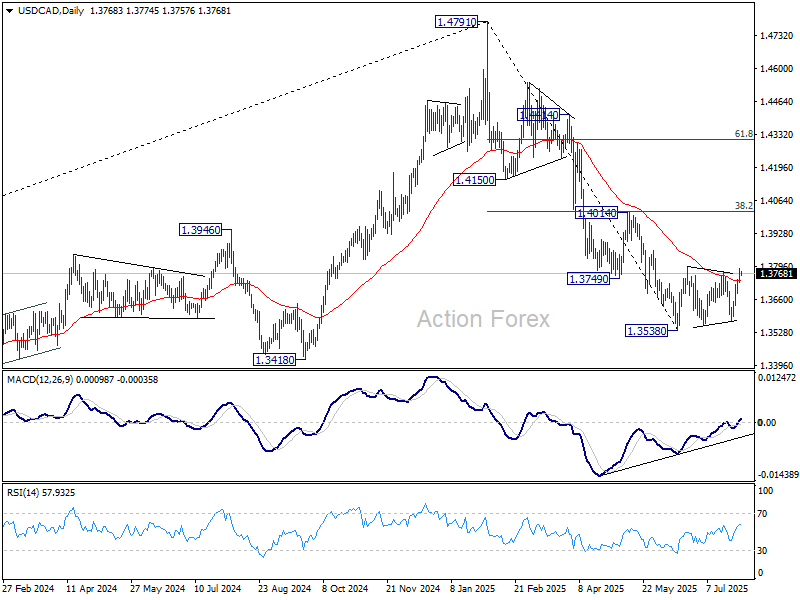
USD/CAD Daily Outlook
Daily Pivots: (S1) 1.3738; (P) 1.3763; (R1) 1.3797; More...
USD/CAD's break of 1.3773 resistance and 55 D EMA suggests that price actions from 1.3538 are already correcting the whole fall from 1.4791. Intraday bias is back on the upside with further rally, possibly towards 1.4014 cluster resistance (38.2% retracement of 1.4791 to 1.3538 at 14017). But strong resistance should be seen there to limit upside. On the downside, below 1.3687 minor support will turn intraday bias neutral first.
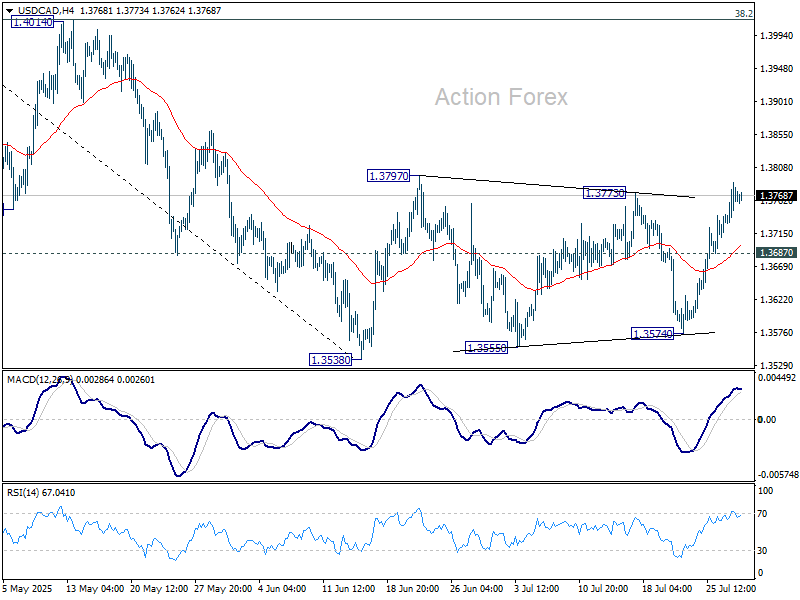
In the bigger picture, price actions from 1.4791 medium term top could either be a correction to rise from 1.2005 (2021 low), or trend reversal. In either case, further decline is expected as long as 1.4014 resistance holds. Next target is 61.8% retracement of 1.2005 (2021 low) to 1.4791 at 1.3069.
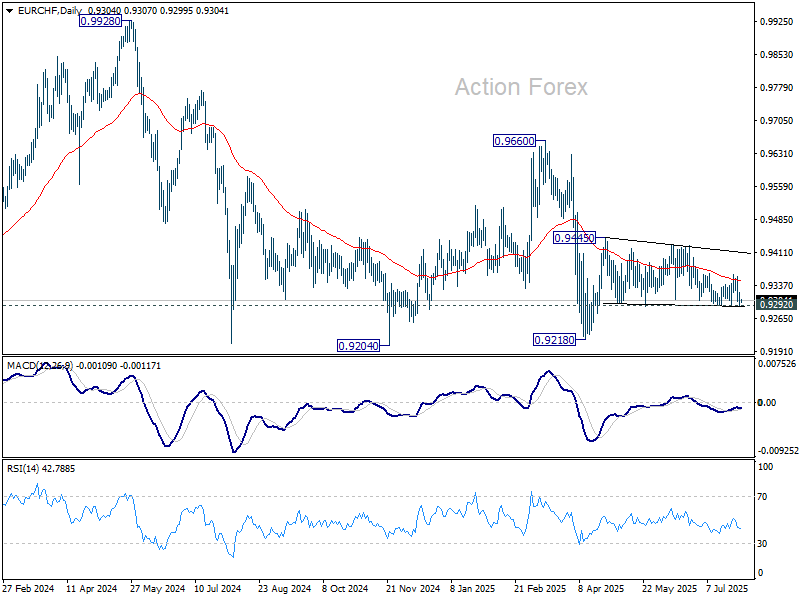
EUR/CHF Daily Outlook
Daily Pivots: (S1) 0.9287; (P) 0.9306; (R1) 0.9325; More....
EUR/CHF is still bounded in sideway trading and intraday bias stays neutral. On the upside, break of 0.9365 will be the first sign that corrective pattern from 0.9445 has already completed. Further rise should then be seen to 0.9428/45 resistance zone. However, decisive break of 0.9292 will bring retest of 0.9218 instead.
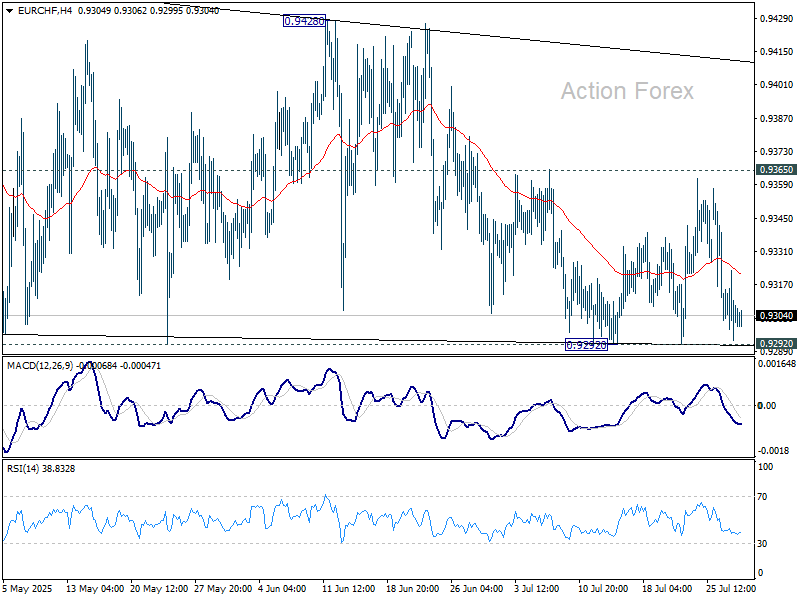
In the bigger picture, while downside momentum has been diminishing as seen in W MACD, there is no sign of bottoming yet. EUR/CHF is still staying below 55 W EMA (now at 0.9424) and well inside long term falling channel. Outlook will stay bearish as long as 0.9660 resistance holds. Break of 0.9204 (2024 low) will confirm resumption of down trend from 1.2004 (2018 high).
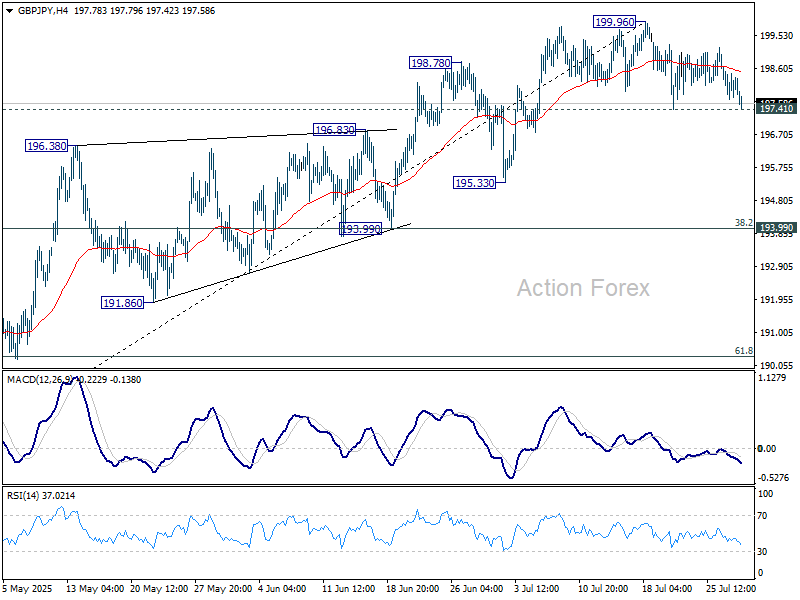
GBP/JPY Daily Outlook
Daily Pivots: (S1) 197.79; (P) 198.17; (R1) 198.59; More...
The extended pullback from 199.96 suggests that a short term top is likely in place. On the downside, firm break of 197.41 will turn bias to the downside for 193.99 cluster support (38.2% retracement of 184.35 to 199.96 at 193.99), as correction to the rally from 184.35. On the upside, through, break of 199.96 will resume recent rally from 180.00.
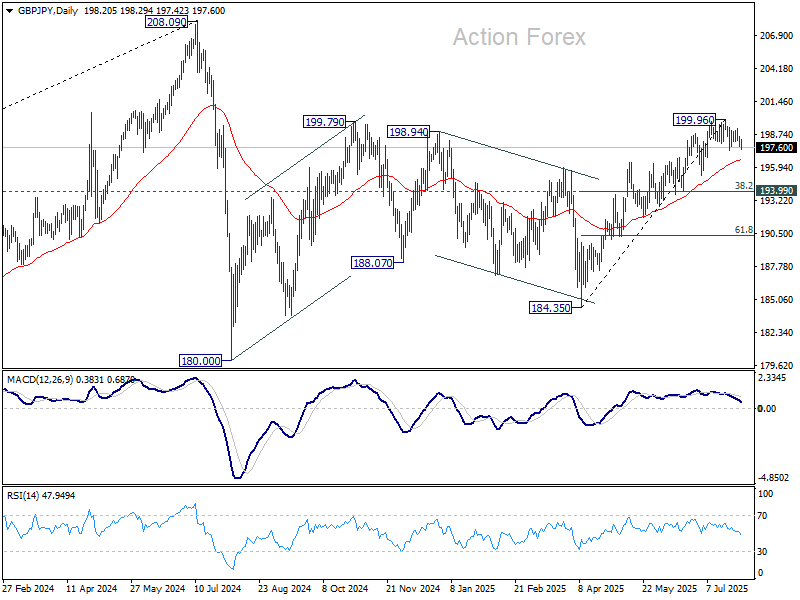
In the bigger picture, price actions from 208.09 (2024 high) are seen as a correction to rally from 123.94 (2020 low). The pattern might still extend with another falling leg. But in that case, strong support should be seen from 38.2% retracement of 123.94 to 208.09 at 175.94 to contain downside. Meanwhile, decisive break of 208.09 will confirm long term up trend resumption.
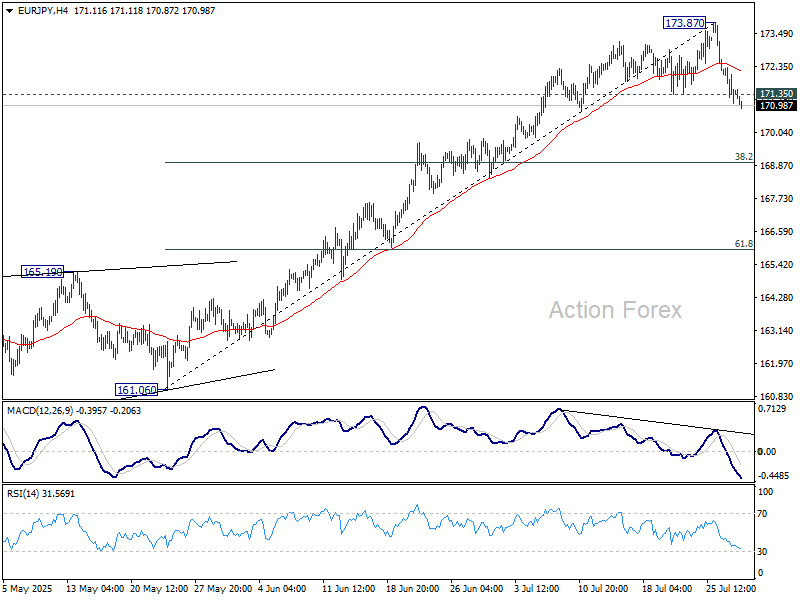
EUR/JPY Daily Outlook
Daily Pivots: (S1) 170.86; (P) 171.60; (R1) 172.14; More...
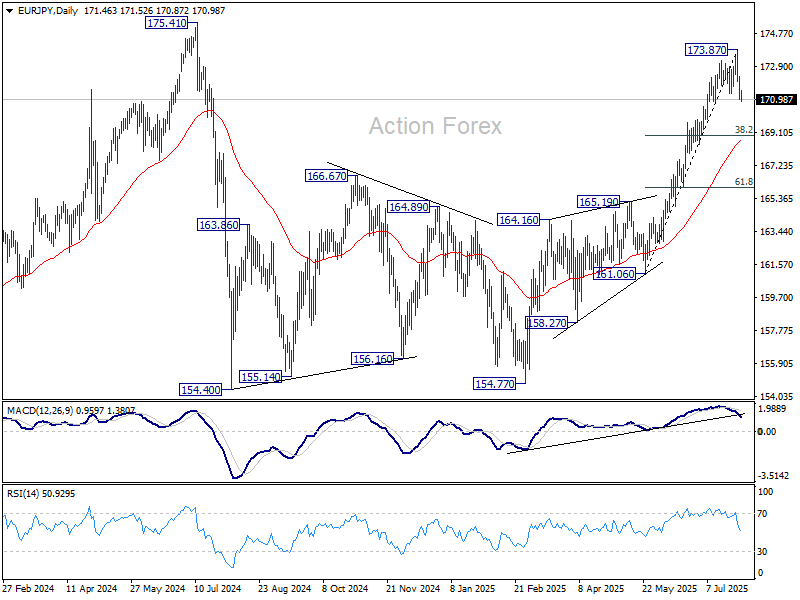
EUR/JPY's break of 171.35 support suggests short term topping at 173.87, on bearish divergence condition in 4H MACD. Fall from there is seen as corrective the rally from 161.06. Intraday bias is now on the downside for 38.2% retracement of 161.06 to 173.87 at 168.97. For now, near term outlook is neutral as long as 173.87 resistance holds, in case of recovery.
In the bigger picture, considering current strong momentum as seen in the rally from 154.77, corrective pattern from 175.41 could have already completed. Decisive break there will confirm long term up trend resumption. Next target is 61.8% projection of 124.37 to 175.41 from 154.77 at 186.31. However, rejection by 175.41, followed by firm break of 55 D EMA (now at 168.69) will delay this bullish case.
EUR/GBP Daily Outlook
Daily Pivots: (S1) 0.8632; (P) 0.8658; (R1) 0.8675; More...
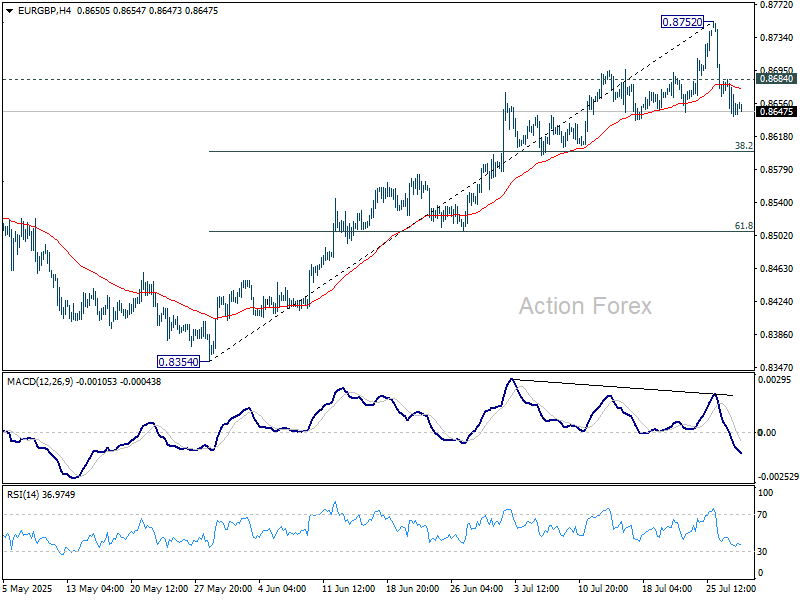
The firm break of 55 4H EMA (now at 0.8672) confirms short term topping at 0.8752. Fall from there is seen as correcting the rise from 0.8354. Intraday bias is mildly on the downside for 38.2% retracement of 0.8354 to 0.8752 at 0.8600. On the upside, above 0.8684 minor resistance will turn intraday bias neutral again first.
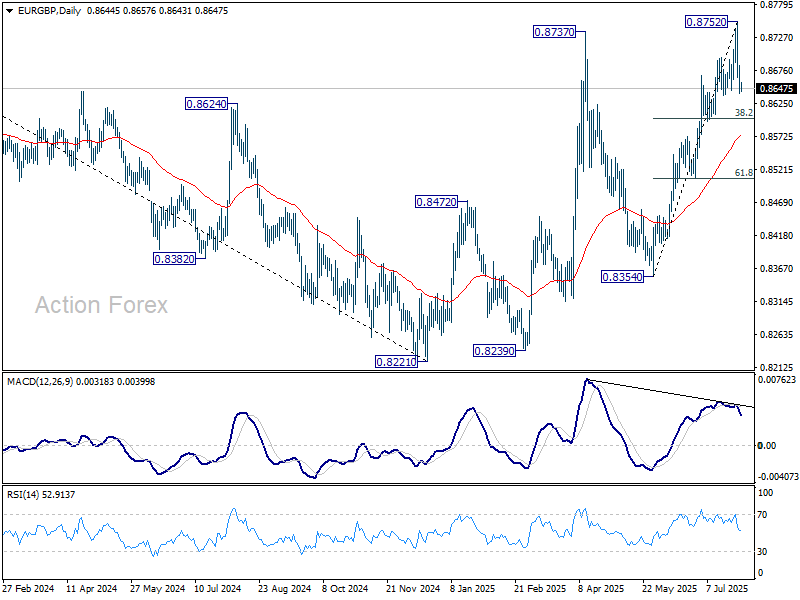
In the bigger picture, the structure from 0.8221 medium term bottom are not impulsive enough to suggest that it's reversing the down trend from 0.9267 (2022 high). But even if it's a correction, further rise is expected to 61.8% retracement of 0.9267 to 0.8221 at 0.8867. This will remain the favored case as long as 55 W EMA (now at 0.8486) holds.
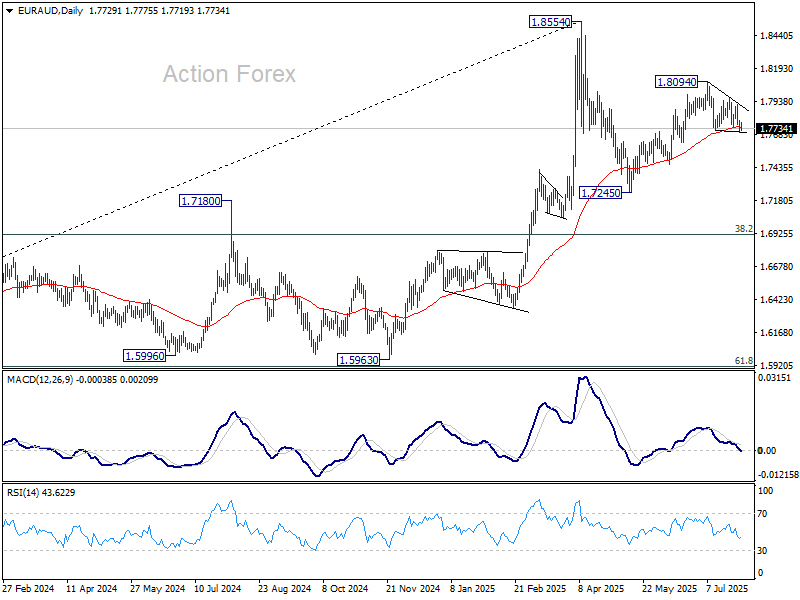
EUR/AUD Daily Outlook
Daily Pivots: (S1) 1.7694; (P) 1.7746; (R1) 1.7787; More...
EUR/AUD recovered after hitting 1.7717 support and intraday bias stays neutral. On the downside, decisive break of 1.7717 will revive the case that rise from 1.7245 has completed. Corrective pattern from 1.8554 should have then started the third leg. Deeper decline should be seen to 1.7459 support first. Nevertheless, strong bounce from current level, followed by break of 1.7972 resistance, will resume the rise from 1.7245 through 1.8094.
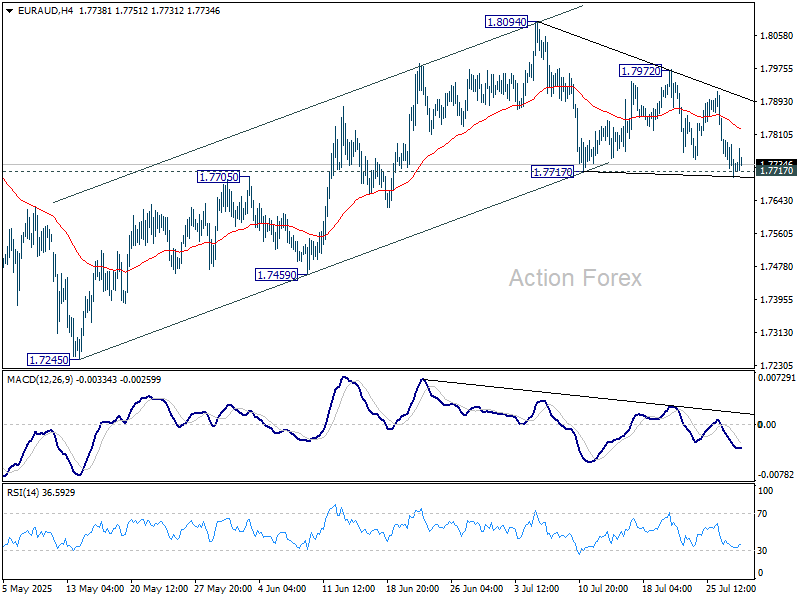
In the bigger picture, price actions from 1.8554 medium term top are seen as a corrective pattern. While deeper pullback might be seen, downside should be contained by 38.2% retracement of 1.4281 (2022 low) to 1.8554 at 1.6922 to bring rebound. Up trend from 1.4281 is expected to resume at a later stage.