
Sample Category Title
BoC keeps powder dry, signals easing if tariff impact deepens
BoC left its policy rate unchanged at 2.75% as expected, but opened the door to future easing. In its statement, the central bank noted that if economic weakness continues to weigh on inflation and upward pressures from trade disruptions are contained, “there may be a need for a reduction in the policy interest rate.”
The Canadian economy is reeling from recent U.S. tariffs. After a strong Q1, likely driven by pre-emptive export surges, GDP is projected to have shrunk -1.5% in Q2. The BoC sees a modest rebound in H2, forecasting 1% growth under the current trade conditions. But the path ahead diverges sharply depending on whether the trade standoff worsens or eases. A tariff escalation scenario would seen the Canadian economy "contracts through the rest of this year".
Inflation is expected to remain close to 2% in the current tariff scenario. While de-escalation could ease price pressures, higher tariffs and rising supply-chain costs pose upside risks. Businesses are already reporting increased expenses as they adjust sourcing strategies—raising the potential for broader consumer price impacts.
(BOC) Bank of Canada holds policy rate at 2¾%
The Bank of Canada today maintained its target for the overnight rate at 2.75%, with the Bank Rate at 3% and the deposit rate at 2.70%.
While some elements of US trade policy have started to become more concrete in recent weeks, trade negotiations are fluid, threats of new sectoral tariffs continue, and US trade actions remain unpredictable. Against this backdrop, the July Monetary Policy Report (MPR) does not present conventional base case projections for GDP growth and inflation in Canada and globally. Instead, it presents a current tariff scenario based on tariffs in place or agreed as of July 27, and two alternative scenarios—one with an escalation and another with a de-escalation of tariffs.
While US tariffs have created volatility in global trade, the global economy has been reasonably resilient. In the United States, the pace of growth moderated in the first half of 2025, but the labour market has remained solid. US CPI inflation ticked up in June with some evidence that tariffs are starting to be passed on to consumer prices. The euro area economy grew modestly in the first half of the year. In China, the decline in exports to the United States has been largely offset by an increase in exports to the rest of the world. Global oil prices are close to their levels in April despite some volatility. Global equity markets have risen, and corporate credit spreads have narrowed. Longer-term government bond yields have moved up. Canada’s exchange rate has appreciated against a broadly weaker US dollar.
The current tariff scenario has global growth slowing modestly to around 2½% by the end of 2025 before returning to around 3% over 2026 and 2027.
In Canada, US tariffs are disrupting trade but overall, the economy is showing some resilience so far. After robust growth in the first quarter of 2025 due to a pull-forward in exports to get ahead of tariffs, GDP likely declined by about 1.5% in the second quarter. This contraction is mostly due to a sharp reversal in exports following the pull-forward, as well as lower US demand for Canadian goods due to tariffs. Growth in business and household spending is being restrained by uncertainty. Labour market conditions have weakened in sectors affected by trade, but employment has held up in other parts of the economy. The unemployment rate has moved up gradually since the beginning of the year to 6.9% in June and wage growth has continued to ease. A number of economic indicators suggest excess supply in the economy has increased since January.
In the current tariff scenario, after contracting in the second quarter, GDP growth picks up to about 1% in the second half of this year as exports stabilize and household spending increases gradually. In this scenario, economic slack persists in 2026 and diminishes as growth picks up to close to 2% in 2027. In the de-escalation scenario, economic growth rebounds faster, while in the escalation scenario, the economy contracts through the rest of this year.
CPI inflation was 1.9% in June, up slightly from the previous month. Excluding taxes, inflation rose to 2.5% in June, up from around 2% in the second half of last year. This largely reflects an increase in non-energy goods prices. High shelter price inflation remains the main contributor to overall inflation, but it continues to ease. Based on a range of indicators, underlying inflation is assessed to be around 2½%.
In the current tariff scenario, total inflation stays close to 2% over the scenario horizon as the upward and downward pressures on inflation roughly offset. There are risks around this inflation scenario. As the alternative scenarios illustrate, lower tariffs would reduce the direct upward pressure on inflation and higher tariffs would increase it. In addition, many businesses are reporting costs related to sourcing new suppliers and developing new markets. These costs could add upward pressure to consumer prices.
With still high uncertainty, the Canadian economy showing some resilience, and ongoing pressures on underlying inflation, Governing Council decided to hold the policy interest rate unchanged. We will continue to assess the timing and strength of both the downward pressures on inflation from a weaker economy and the upward pressures on inflation from higher costs related to tariffs and the reconfiguration of trade. If a weakening economy puts further downward pressure on inflation and the upward price pressures from the trade disruptions are contained, there may be a need for a reduction in the policy interest rate.
Governing Council is proceeding carefully, with particular attention to the risks and uncertainties facing the Canadian economy. These include: the extent to which higher US tariffs reduce demand for Canadian exports; how much this spills over into business investment, employment and household spending; how much and how quickly cost increases from tariffs and trade disruptions are passed on to consumer prices; and how inflation expectations evolve.
We are focused on ensuring that Canadians continue to have confidence in price stability through this period of global upheaval. We will support economic growth while ensuring inflation remains well controlled.
Information note
The next scheduled date for announcing the overnight rate target is September 17, 2025.
USD/JPY Mid-Day Outlook
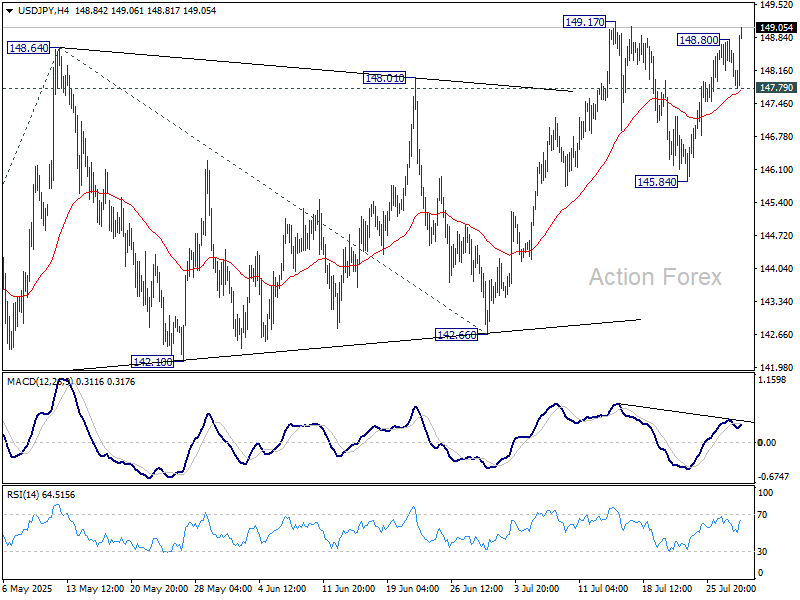
Daily Pivots: (S1) 148.15; (P) 148.48; (R1) 148.80; More...
USD/JPY's rise from 145.84 resumed after brief retreat and intraday bias back on the upside. Firm break of 149.17 resistance will resume whole rally from 139.87 to 100% projection of 139.87 to 148.64 from 142.66 at 151.43, which is close to 151.22 fibonacci level. On the downside, below 147.79 minor support will turn intraday bias neutral again.
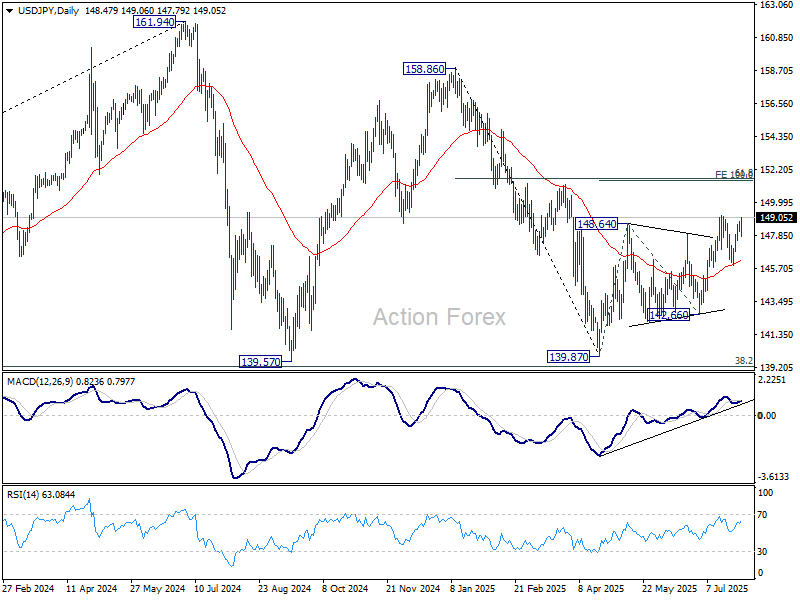
In the bigger picture, price actions from 161.94 (2024 high) are seen as a corrective pattern to rise from 102.58 (2021 low). Decisive break of 61.8% retracement of 158.86 to 139.87 at 151.22 will argue that it has already completed with three waves at 139.87. Larger up trend might then be ready to resume through 161.94 high. In case the corrective pattern extends with another fall, strong support is expected from 38.2% retracement of 102.58 to 161.94 at 139.26 to bring rebound.
USD/CHF Mid-Day Outlook
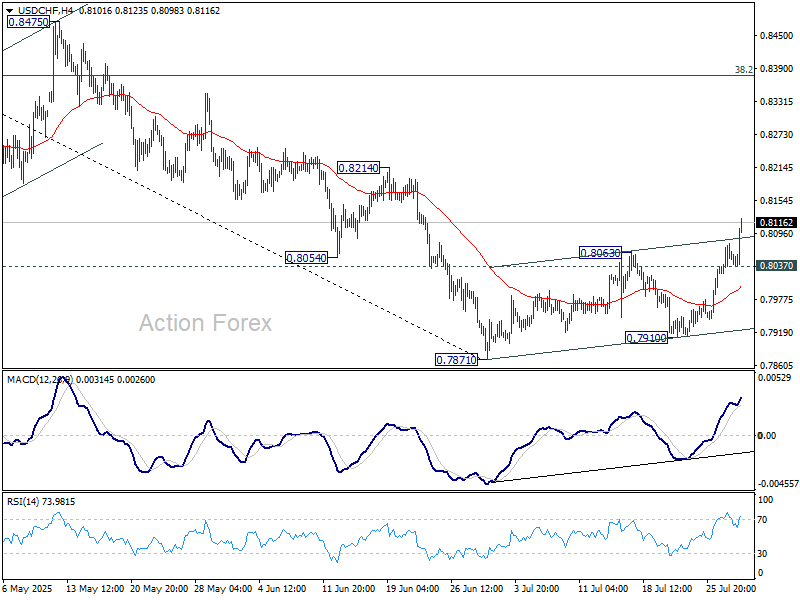
Daily Pivots: (S1) 0.8022; (P) 0.8050; (R1) 0.8090; More….
USD/CHF's upside acceleration and break of 55 D EMA (now at 0.8105) argues that it's at least correcting the fall from 09022. Intraday bias is staying on the upside for 38.2% retracement of 0.9200 to 0.7871 at 0.8379 next. On the downside, below 0.8037 minor support will turn intraday bias neutral and bring consolidations first, before staging another rally.
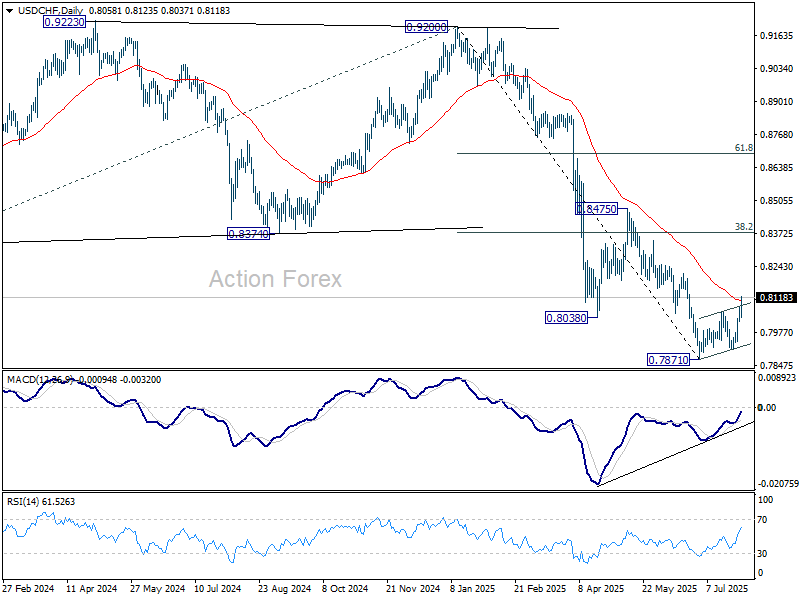
In the bigger picture, long term down trend from 1.0342 (2017 high) is still in progress. Next target is 100% projection of 1.0146 (2022 high) to 0.8332 from 0.9200 at 0.7382. In any case, outlook will stay bearish as long as 0.8475 resistance holds.
GBP/USD Mid-Day Outlook
Daily Pivots: (S1) 1.3316; (P) 1.3342; (R1) 1.3376; More...
GBP/USD's fall from 1.3787 resumed after brief recovery and intraday bias is back on the downside. The decline is seen as correcting the whole rise from 1.2099. Deeper fall should be seen to 100% projection of 1.3787 to 1.3363 from 1.3587 at 1.3163. On the upside, above 1.3385 minor resistance will turn intraday bias neutral again first.

In the bigger picture, up trend from 1.3051 (2022 low) is in progress. Next medium term target is 61.8% projection of 1.0351 to 1.3433 from 1.2099 at 1.4004. Outlook will now stay bullish as long as 55 W EMA (now at 1.3045) holds, even in case of deep pullback.

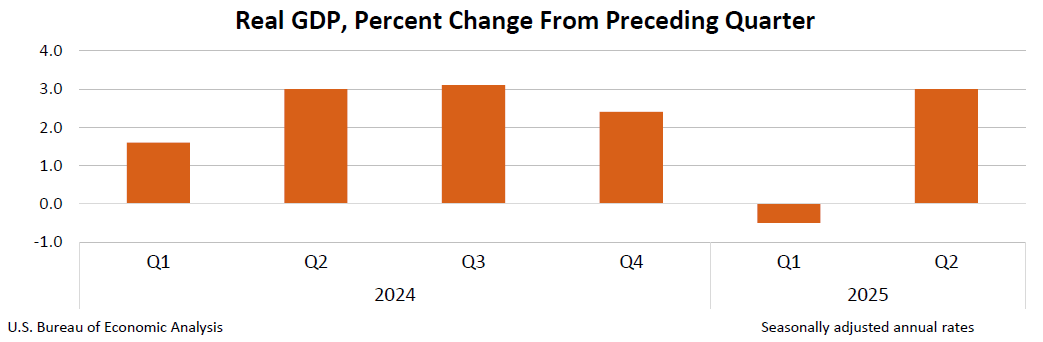
US: Q2 GDP Flattered by Unwinding of Q1’s Tariff Front-Running
The U.S. economy expanded by 3.0% quarter-on-quarter (q/q, annualized) in the second quarter – slightly above the consensus forecast of 2.6% – and up sharply from Q1's contraction of 0.5%.
Consumer spending rose 1.4% q/q, a modest acceleration from Q1's 0.5%. Spending on both goods (2.2% from 0.1%) and services (1.1% from 0.6%) accelerated relative to Q1.
Business investment rose 1.9% q/q, but that came after a very strong gain in the first quarter – largely driven by firms front-loading capital spending ahead of the tariffs. In terms of the breakdown, both equipment (+4.8% q/q) and intellectual property products (6.4%) were higher, while spending on structures (-10.3% q/q) declined for a second consecutive quarter.
Residential investment declined 4.6% q/q, as homebuilding reached a new cyclical low in Q2. Home sales trended lower and remain 30% below its level prior to the Fed initiating its tightening cycle in 2022.
Government spending rose a modest 0.4%, as an uptick in state & local spending (+3.0%) more than offset the pullback at the federal level (-3.7% q/q).
As was the case in Q1, international trade was a major factor influencing growth last quarter. Imports plummeted by 30.3% q/q – following a gain of 37.9% q/q in Q1 – largely owing to a sharp pullback in goods imports (-35.3% q/q). Meanwhile, exports contracted by a more modest 1.8% q/q, resulting in net trade adding 5.0 percentage points (pp) to Q2 GDP. Meanwhile, inventory investment subtracted 3.2pp from headline growth.
Final sales to private domestic purchasers, a better gauge of underlying demand as it includes only household consumption and fixed investment slowed to 1.2% from 1.9% in Q1.
Core PCE inflation – the Fed's preferred inflation gauge – was 2.5% q/q (annualized), a notable deceleration from Q1's 3.5%.
Key Implications
Headline GDP growth for the second quarter overstated the degree of strength in the U.S. economy. An unwinding of Q1's tariff front-running resulted in imports contracting by the largest amount (outside of the pandemic) since the height of the global financial crisis, resulting in a massive positive contribution to GDP. Once the effects of net trade, inventories and government were removed, sales to private domestic purchasers, expanded by just 1.2% or its slowest rate of growth in 2.5 years.
Tomorrow's release of personal income & spending for June will shed more light on how consumer spending ended last quarter. Retail sales for June (released on July 17th) suggest spending turned higher last month, but that's only after falling sharply the month prior – leaving June's level roughly unchanged from April. With inflationary pressures likely to heat-up over the coming months alongside some expected softening in the labor market, the backdrop for consumer spending is looking increasingly fragile. Our current GDP tracking has the economy expanding by around 1.0% in Q3.
EUR/USD Mid-Day Outlook
Daily Pivots: (S1) 1.1510; (P) 1.1554; (R1) 1.1590; More...
EUR/USD's current downside acceleration and strong break of 55 D EMA (now at 1.1536) suggests that fall from 1.1829 is already correcting the whole rally from 1.0176. Intraday bias stays on the downside for 38.2% retracement of 1.0176 to 1.1829 at 1.1198. On the upside, above 1.1571 minor resistance will turn intraday bias neutral and bring consolidations first, before staging another decline.
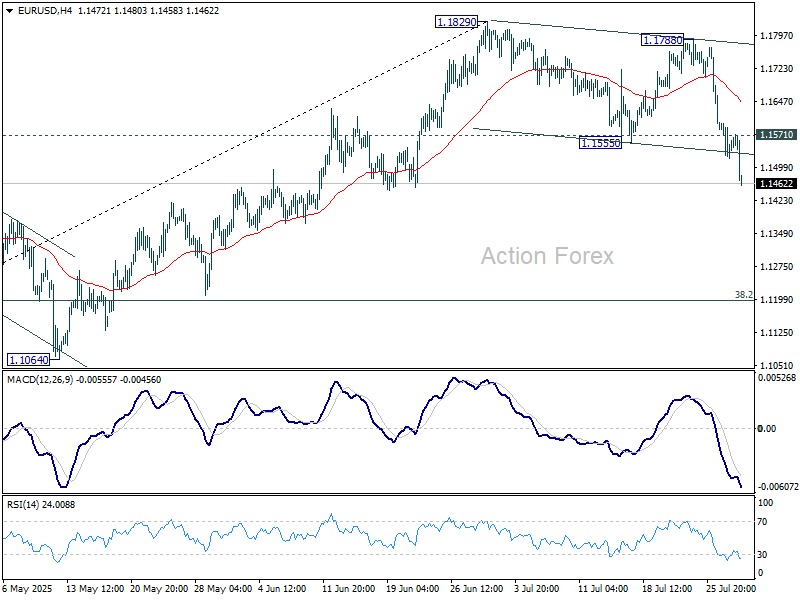
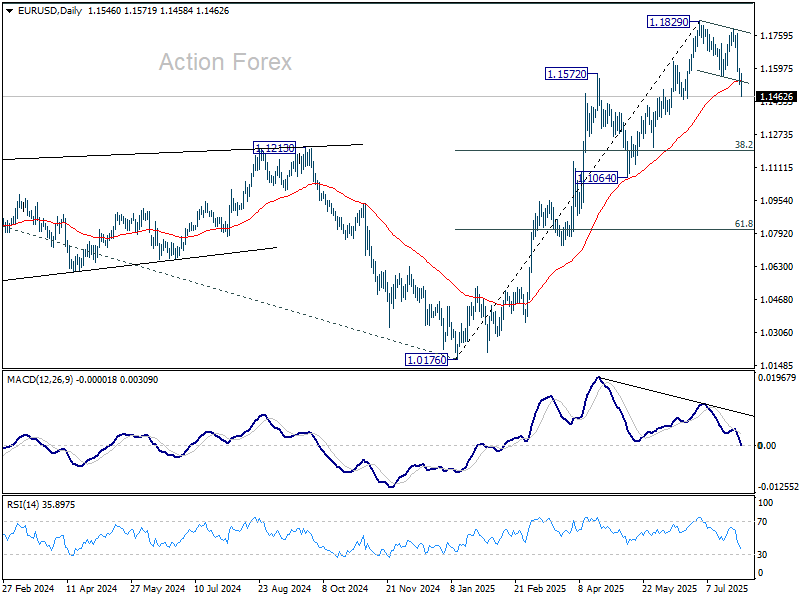
In the bigger picture, rise from 0.9534 long term bottom could be correcting the multi-decade downtrend or the start of a long term up trend. In either case, further rise should be seen to 100% projection of 0.9534 to 1.1274 from 1.0176 at 1.1916. This will remain the favored case as long as 1.1604 support holds.
Hot US GDP Lifts Dollar, Eyes Now on Fed
Dollar strength resumed in early US session after US Q2 GDP blew past expectations with a 3.0% annualized growth rate. The data added further confirmation that the US economy remains remarkably resilient, reinforcing bullish bets on the greenback. Currency markets reacted swiftly, with traders piling back into Dollar longs after briefly taking profit earlier in the week.
Equity markets, however, were more subdued. Futures on major US indexes remained near flat, as investors chose to wait out the FOMC decision. Even with inflation clearly cooling, there's little pressure on the Fed to act swiftly. Instead, today's events may reaffirm a "higher for longer" stance as long as growth remains robust.
The Fed is widely expected to keep its policy rate unchanged at 4.25–4.50%. Attention will be on whether dovish members like Waller and Bowman continue to call for a cut, and if others show signs of joining them. Given today’s solid data, the bar for broader support for immediate easing likely remains high.
Attention will also be squarely on Chair Jerome Powell's press conference and the FOMC statement for any hints of a September move. With market pricing hovering around a 65% chance for a cut, any less-than-dovish language could see Dollar bulls press further.
So far, the greenback is leading currency performance on the day, followed by Yen and Sterling. On the weak side, Aussie continues to lag after soft Q2 inflation readings. Euro and Swiss Franc also remain under pressure, while Kiwi and Loonie are stuck in the middle of the pack.
Looking ahead, the spotlight will shift quickly to BoJ’s decision in the Asian session. While a hold at 0.50% is expected, Deputy Governor Shinichi Uchida’s earlier remarks flagged that economic projections would reflect the positive impact of the US-Japan trade deal. That sets the stage for a potential hawkish twist. If BoJ drops even subtle hints that a rate hike later this year is back in play, Yen shorts may find themselves squeezed.
Technically, AUD/JPY's price actions from 97.41 short term top are seen as a near term corrective pattern only. Another rally is still expected to 61.8% projection of 86.03 to 95.63 from 92.30 at 98.23. However, sustained break of 55 D EMA (now at 95.00) will raise the chance of bearish reversal, and target 92.30 support first.

In Europe, at the time of writing, FTSE is down -0.22%. DAX is up 0.10%. CAC is up 0.42%. UK 10-year yield is down -0.032 at 4.607. Germany 10-year yield is down -0.003 at 2.708. Earlier in Asia, Nikkei fell -0.05%. Hong Kong HSI fell -1.36%. China Shanghai SSE rose 0.17%. Singapore Strait Times fell -0.24%. Japan 10-year JGB yield fell -0.13 to 1.563.
US GDP surges 3.0% annualized in Q2, inflation gauges ease
US GDP growth accelerated to 3.0% annualized in Q2, far above expectations, as falling imports and firmer consumer spending powered the expansion. These gains were partially offset by weaker investment and exports, though the data suggest domestic demand remains firm.
Notably, inflation pressures eased significantly. The PCE price index rose just 2.1% in Q2, down from 3.7% in Q1, while the core PCE gauge slowed to 2.5% from 3.5%.
US ADP jobs grow 75k, ongoing labor market resilience
U.S. private payrolls grew 104k in July, beating expectations of 75k and suggesting continued strength in the labor market. Gains were broad-based, with 31k new jobs in goods-producing industries and 74k in services. Hiring was evenly spread across firm sizes, with both medium and large companies contributing 46k each.
Wage pressures held steady, with pay up 4.4% yoy for job-stayers and 7% for job-changers, unchanged for the fourth consecutive month.
ADP’s Chief Economist Nela Richardson noted the data points to “a healthy economy” as employers grow more confident in consumer resilience.
Eurozone GDP beats with 0.1% qoq growth, but Germany and Italy contract
Eurozone GDP grew 0.1% qoq in Q2, slightly above market expectations of flat growth, while the broader EU expanded 0.2% qoq. On a year-over-year basis, GDP rose 1.4% yoy in the Eurozone and 1.5% yoy in the EU—marking a mild deceleration from Q1's annual pace of 1.5% yoy and 1.6% yoy respectively. .
Spain led the quarter with a strong 0.7% qoq gain, followed by Portugal (0.6%) and Estonia (0.5%). However, Germany and Italy both posted marginal contractions of -0.1%, and Ireland saw the largest drop at -1.0%. Despite the mixed quarterly results, all member states reported positive year-on-year growth.
Australia CPI cools to 2.1% in Q2, June reading undershoots
Australia’s inflation pressures continued to ease in Q2, reinforcing expectations for further policy easing from the RBA.
Headline CPI rose 0.7% qoq, down from Q1’s 0.9% qoq and under the 0.8% qoq consensus. On an annual basis, CPI slowed from 2.4% yoy to 2.1% yoy, the lowest since early 2021, and below expectation of 2.2% yoy.
Trimmed mean inflation, the RBA’s preferred gauge, also moderated from 0.7% qoq to 0.6% qoq. Annual rate fell from 2.9% to 2.7% yoy, matched expectations, and marking the lowest since Q4 2021.
Underlying disinflation is broadening too. Annual services inflation cooled from 3.7% yoy to 3.3% yoy, the weakest since Q2 2022. Goods inflation dipped back to 1.1% yoy after a brief uptick from Q4's 0.8% yoy to Q1's 1.3% yoy.
The June monthly CPI dropped from 2.1% yoy to 1.9% yoy, also below expectations of 2.1% yoy, and undershoots RBA's 2-3% target band.
NZ ANZ business confidence ticks up to 47.8, easing inflation signals more RBNZ cuts ahead
New Zealand’s ANZ Business Confidence ticked higher in July, rising from 46.3 to 47.8. Own Activity Outlook edged down slightly from 40.9 to 40.6. The share of firms expecting to raise prices over the next three months dropped to 43.5%—the lowest since December 2024. Inflation expectations also dipped from 2.71% to 2.68%.
ANZ described the inflation signals as “benign,” noting declines across both cost and pricing expectations. The bank suggested that RBNZ may soon shift from worrying about inflation staying too high to concerns about it falling too low, implying a greater likelihood of deeper monetary easing than currently priced in by markets or flagged by the RBNZ itself.
EUR/USD Mid-Day Outlook
Daily Pivots: (S1) 1.1510; (P) 1.1554; (R1) 1.1590; More...
EUR/USD's current downside acceleration and strong break of 55 D EMA (now at 1.1536) suggests that fall from 1.1829 is already correcting the whole rally from 1.0176. Intraday bias stays on the downside for 38.2% retracement of 1.0176 to 1.1829 at 1.1198. On the upside, above 1.1571 minor resistance will turn intraday bias neutral and bring consolidations first, before staging another decline.
In the bigger picture, rise from 0.9534 long term bottom could be correcting the multi-decade downtrend or the start of a long term up trend. In either case, further rise should be seen to 100% projection of 0.9534 to 1.1274 from 1.0176 at 1.1916. This will remain the favored case as long as 1.1604 support holds.
US GDP surges 3.0% annualized in Q2, inflation gauges ease
US GDP growth accelerated to 3.0% annualized in Q2, far above expectations, as falling imports and firmer consumer spending powered the expansion. These gains were partially offset by weaker investment and exports, though the data suggest domestic demand remains firm.
Notably, inflation pressures eased significantly. The PCE price index rose just 2.1% in Q2, down from 3.7% in Q1, while the core PCE gauge slowed to 2.5% from 3.5%.
US ADP jobs grow 75k, ongoing labor market resilience
U.S. private payrolls grew 104k in July, beating expectations of 75k and suggesting continued strength in the labor market. Gains were broad-based, with 31k new jobs in goods-producing industries and 74k in services. Hiring was evenly spread across firm sizes, with both medium and large companies contributing 46k each.
Wage pressures held steady, with pay up 4.4% yoy for job-stayers and 7% for job-changers, unchanged for the fourth consecutive month.
ADP’s Chief Economist Nela Richardson noted the data points to “a healthy economy” as employers grow more confident in consumer resilience.