Sample Category Title
Hang Seng Index Forecast: New Bullish Leg Supported by Southbound Flows and Improvement in China Services Activities
Key takeaways
- Hong Kong 33 CFD Index rose 6% after a bullish breakout but retraced by 5% due to a stronger US dollar, testing key support at 24,290.
- July's Caixin Services PMI surged to 56.6, the highest since May 2024, signaling renewed expansion driven by new business and foreign demand.
- Net capital inflows from mainland China into Hong Kong equities have turned positive, supporting a medium-term bullish outlook.
- Key technical indicators suggest renewed upside momentum for the Hong Kong 33 CFD Index, with 24,290 acting as a pivotal support for a potential move toward 26,200 and 27,500.
Since our last publication, the Hong Kong 33 CFD Index (a proxy for the Hang Seng Index futures) has staged the expected bullish move and rallied by 6%. It surpassed the first medium-term resistance of 25,080 and printed an intraday high of 25,738 on 24 July 2025.
Thereafter, the Hong Kong 33 CFD Index recorded a decline of -5% that almost wiped out the prior gains to print a recent intraday low of 24,246 on 1 August on the backdrop of a firmer US dollar.
Right now, let's examine the latest relevant macro and momentum factors to determine whether the two-week corrective decline may extend further to the downside or a new bullish impulsive up move has been reignited.
Services activities in China have improved
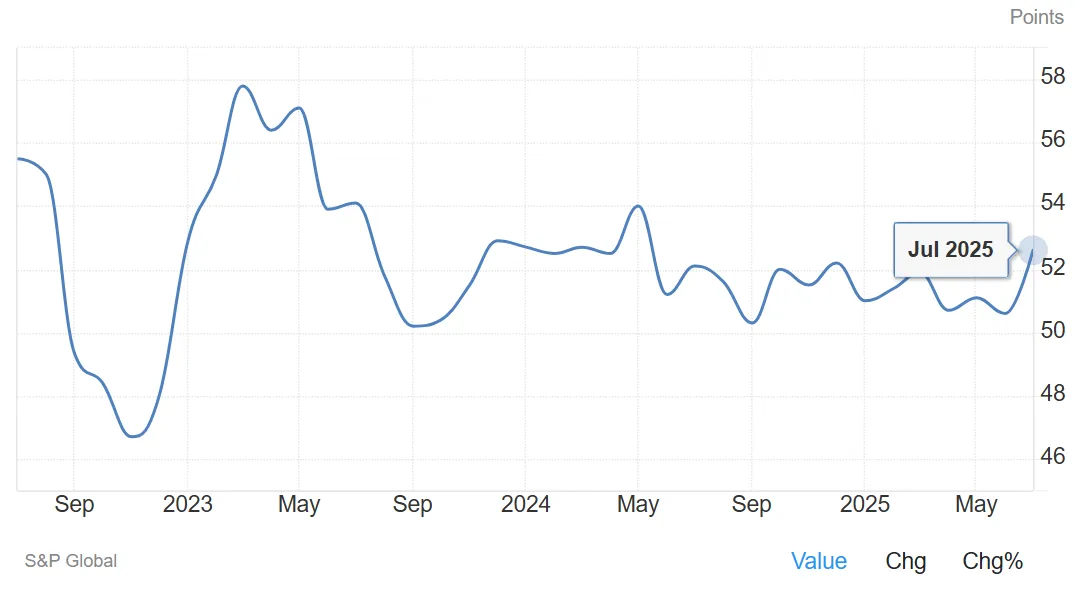
Fig. 1: China Caixin Services PMI as of Jul 2025 (Source: Trading Economics)
Manufacturing activities continued to show a lacklustre performance since April, where the official NBS Manufacturing PMI for July contracted for the fourth consecutive month with a reading of 49.3, its steepest decline since January.
In contrast, the services sector has started to show signs of picking up after a slew of expansionary stimulus measures to improve consumer sentiment and negate the risk of a deflationary spiral.
China Caixin Services PMI, a leading indicator to gauge services activities that includes small and medium enterprises, rose to 56.6 in July, from June’s nine-month low of 50.6 and exceeding market expectations of 50.4. The reading signalled the fastest expansion in the services sector since May 2024, driven by rising inflows of new business and a renewed increase in foreign demand (see Fig. 1).
The latest pick-up in the services activities in China is likely to act as a positive cushion to boost consumer sentiment to negate the negative feedback loop from the trade tension between the US and China, where a trade truce is likely to be extended for 90 days from the 12 August deadline, pending approval from US President Trump.
Southbound fund inflows from China have ticked up
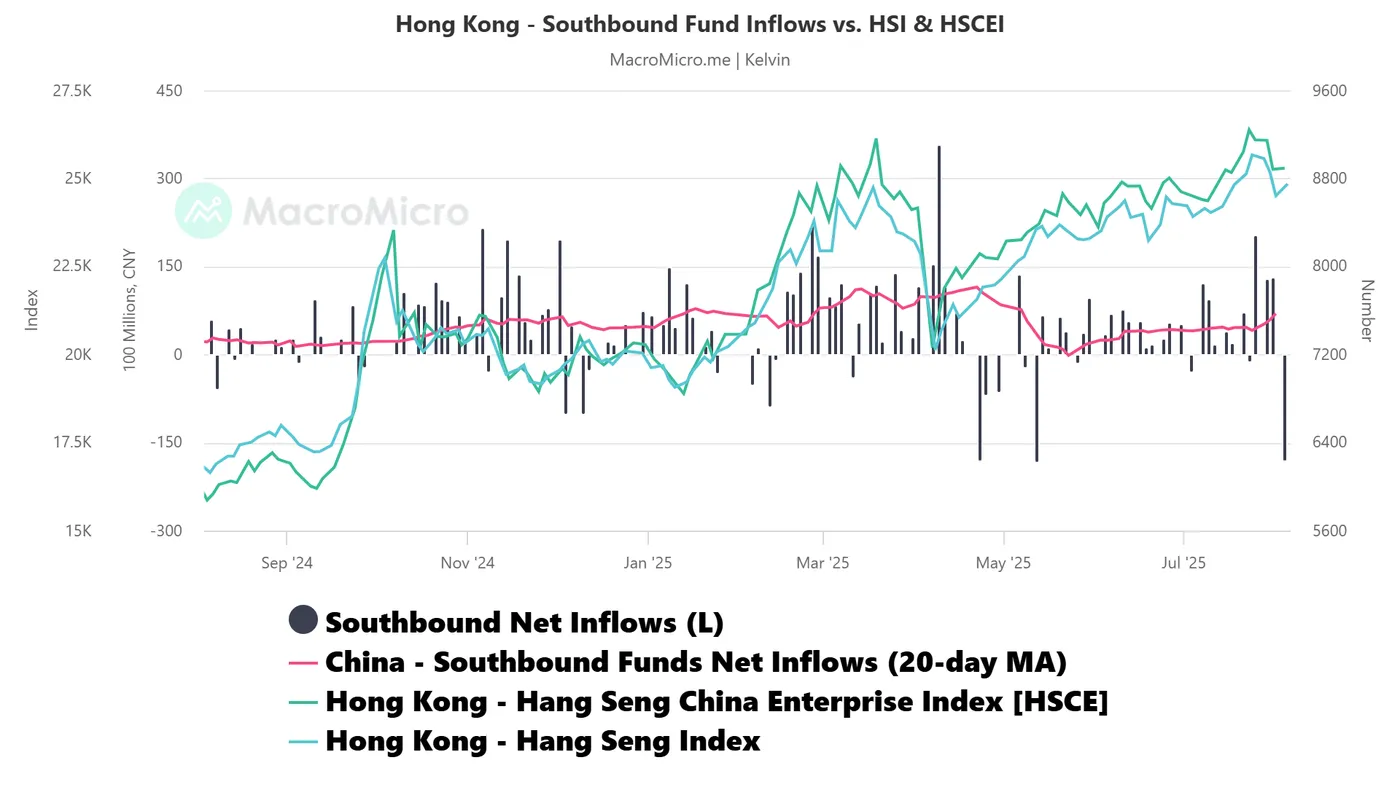
Fig. 2: Southbound net inflows with 20-day moving average trend as of 1 Aug 2025 (Source: MacroMicro)
A pickup in Chinese consumer sentiment may see an increase in mainland China investment in equities bound for Hong Kong via the Shanghai-Hong Kong and Shenzhen-Hong Kong Stock Connect Programmes. The total number of the two programmes is known as southbound fund inflows.
Southbound fund flows have shown signs of recovery, with net inflows improving steadily after a decline from 22 April to 23 May. The 20-day moving average of southbound inflows rose to 6.959 billion yuan as of 1 August, up from a negative 1.48 billion yuan on 23 May (see Fig. 2).
This uptrend in capital inflows from mainland China is likely to support a medium-term bullish outlook for the Hong Kong Hang Seng Index.
Start of a new potential impulsive bullish leg for the Hang Seng index
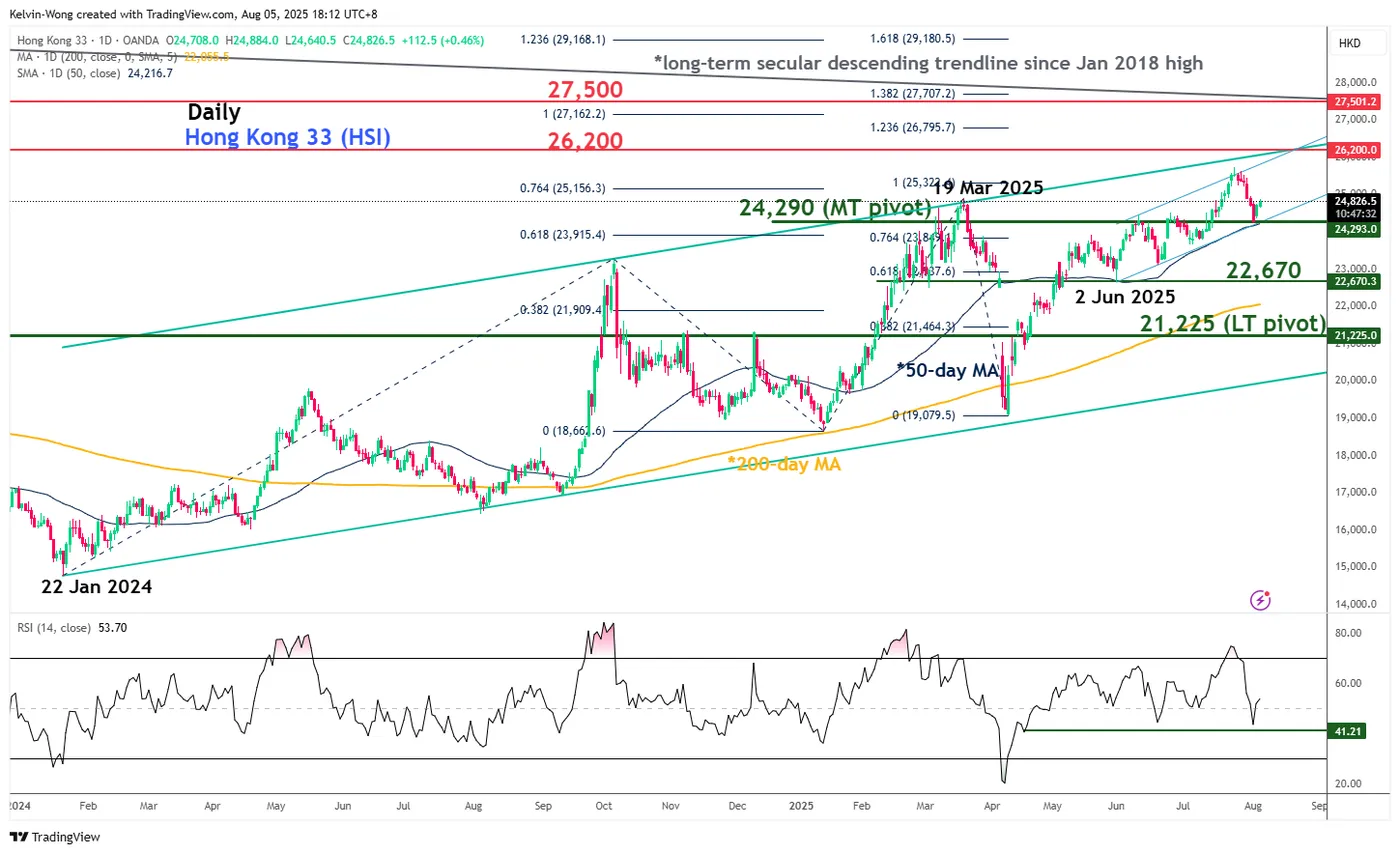
Fig. 3: Hong Kong 33 CFD Index major & medium-term trends as of 5 Aug 2025 (Source: TradingView)
The recent 6% corrective decline seen in the Hong Kong 33 CFD Index (a proxy of the Hang Seng Index futures) has managed to stall at a key support/inflection level of 24,290, which is defined by the 50-day moving average, lower boundary of the medium-term ascending channel from the 2 June 2025 low, and Fibonacci retracement.
In addition, the daily RSI momentum indicator has managed to stage a bounce right above a parallel horizontal support at the 41 level and inched back up above 50, which suggests the revival of medium-term bullish momentum (see Fig. 3).
Bullish bias; 24,290 as the key medium-term pivotal support for the next medium-term resistance to come in at 26,200 before the major resistance of 27,500 (Fibonacci extension cluster and long-term secular descending trendline from January 20218 swing high).
On the other hand, a break below 24,290 invalidates the bullish scenario for an extension of the corrective decline sequence to expose the next medium-term support at 22,670.
EUR/USD Pressured by External Factors
The EUR/USD pair edged lower on Tuesday, dipping to 1.1556 amid subdued trading activity. Market participants are cautiously assessing the latest trade signals and recalibrating their expectations for monetary policy.
Trade tensions resurfaced as US President Donald Trump threatened India with steep tariff hikes over its continued purchases of Russian oil. Meanwhile, the European Union postponed retaliatory tariffs against the US by six months, with both sides pledging further negotiations.
The US dollar faced downward pressure last week following the release of a disappointing US employment report. July’s figures fell short of forecasts, reinforcing market bets on a Fed rate cut in September. Investors are now pricing in over 60 basis points’ worth of easing by year-end.
Political uncertainty also weighed on sentiment. The resignation of a Federal Reserve Board member and the dismissal of a key statistical agency head under Trump’s administration have fuelled concerns over stability in the US economic leadership.
Market focus now shifts to June’s foreign trade data and the latest ISM PMI report, which could offer fresh insights into the health of the US economy.
Technical Analysis: EUR/USD
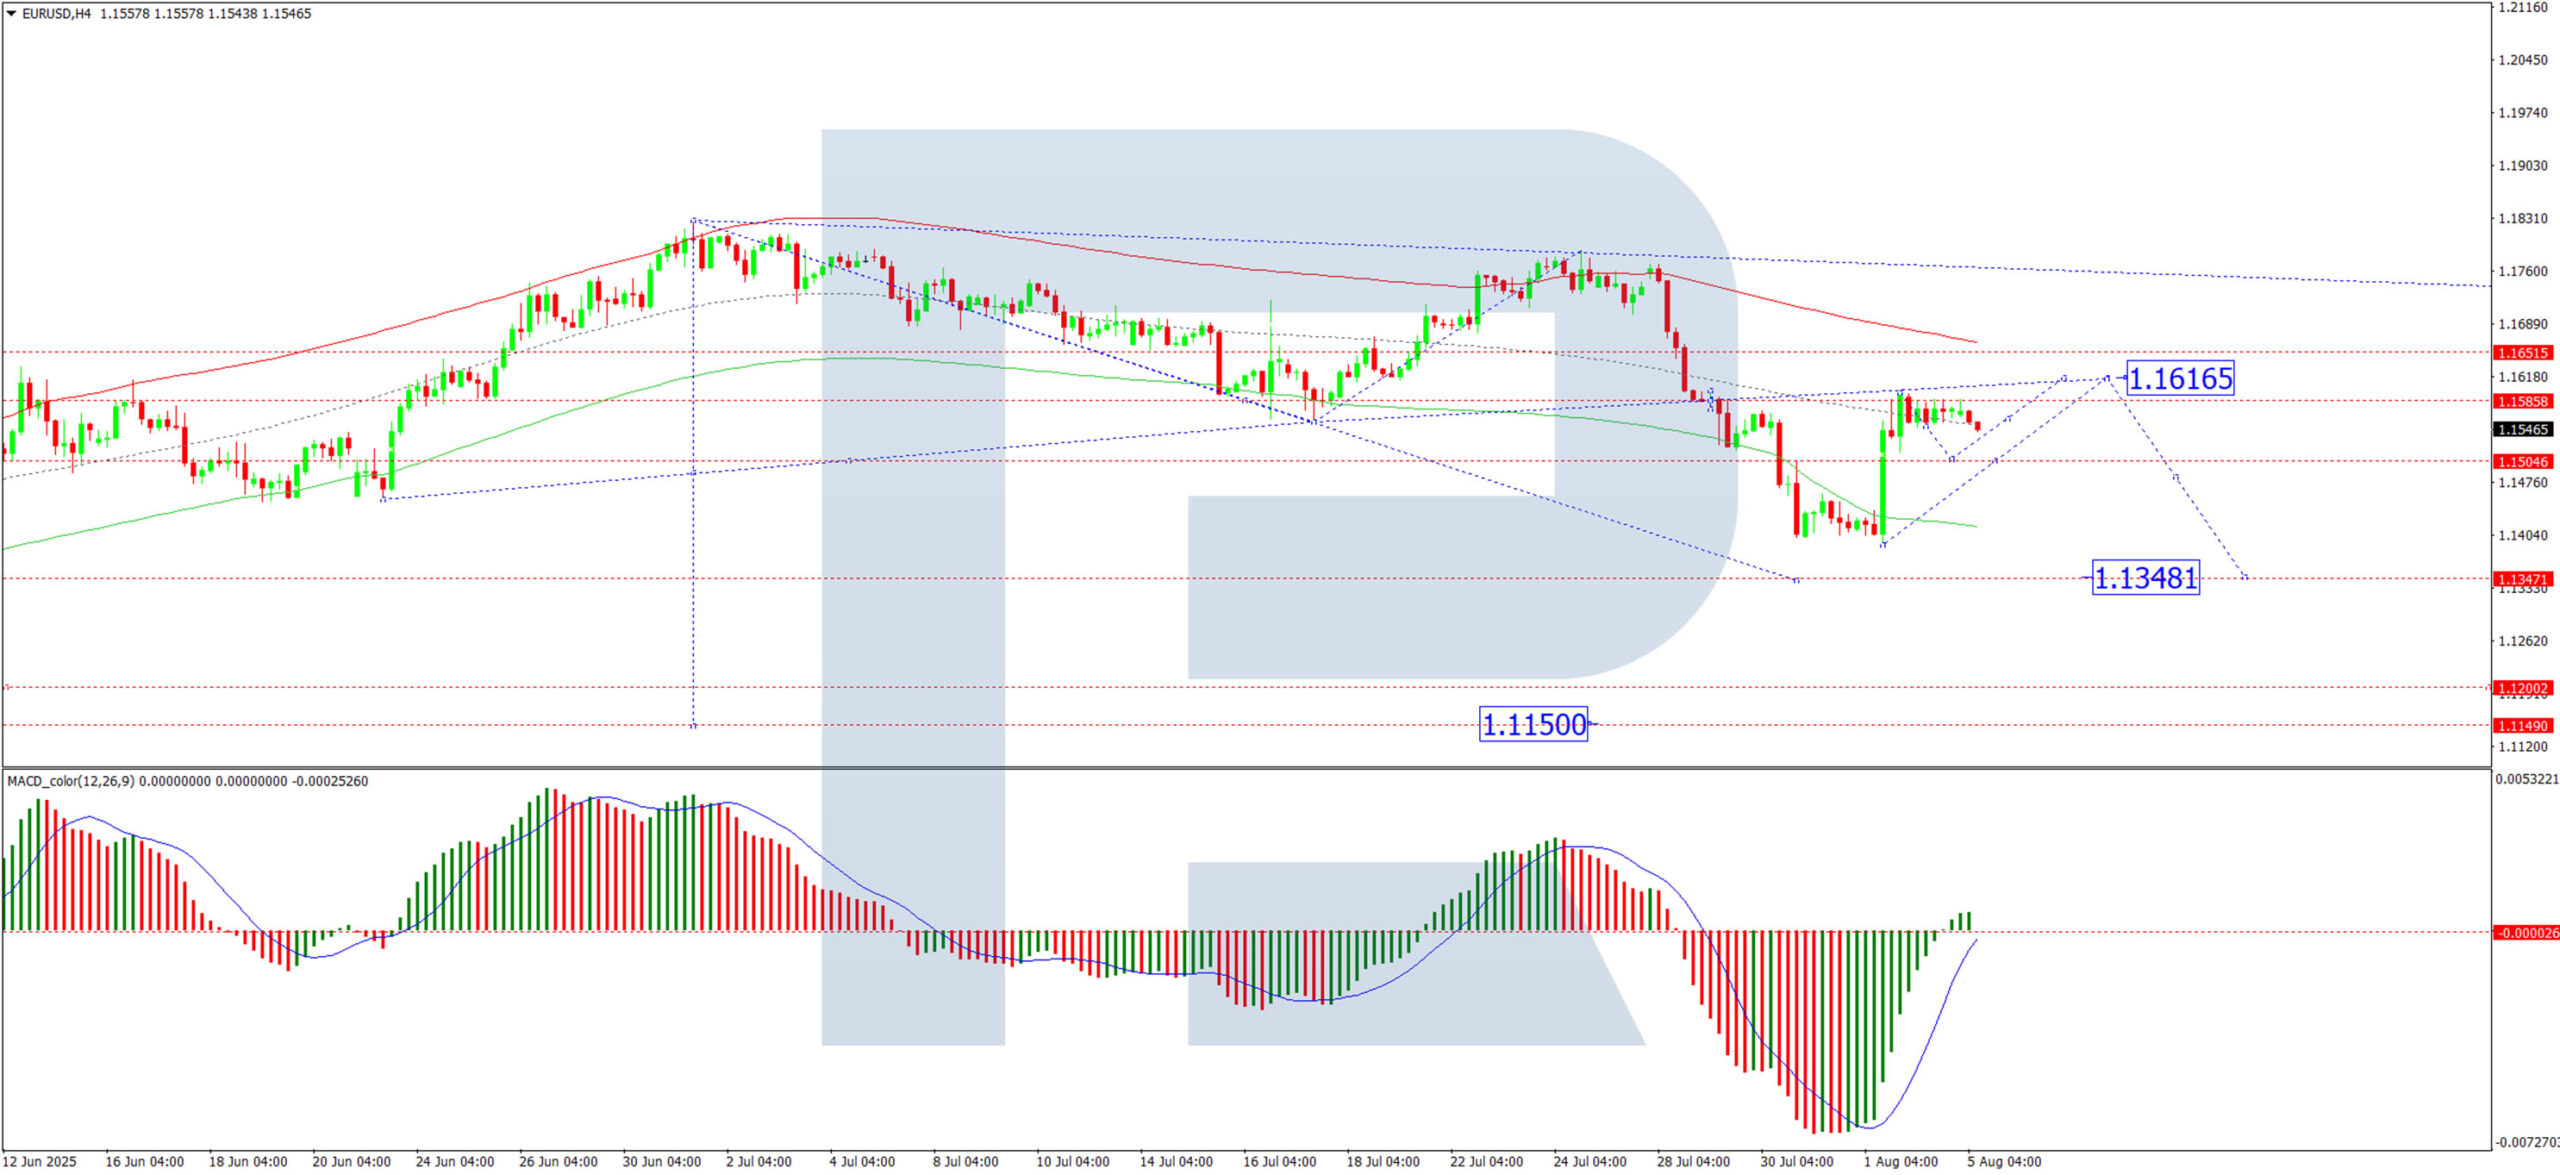
H4 Chart:
The EUR/USD corrected to 1.1590 before entering consolidation below this level. A breakout towards 1.1615 remains possible, but the primary expectation is a resumption of the downtrend, targeting 1.1348 as the next key support. This bearish view is supported by the MACD indicator, with its signal line firmly below zero and pointing downward.
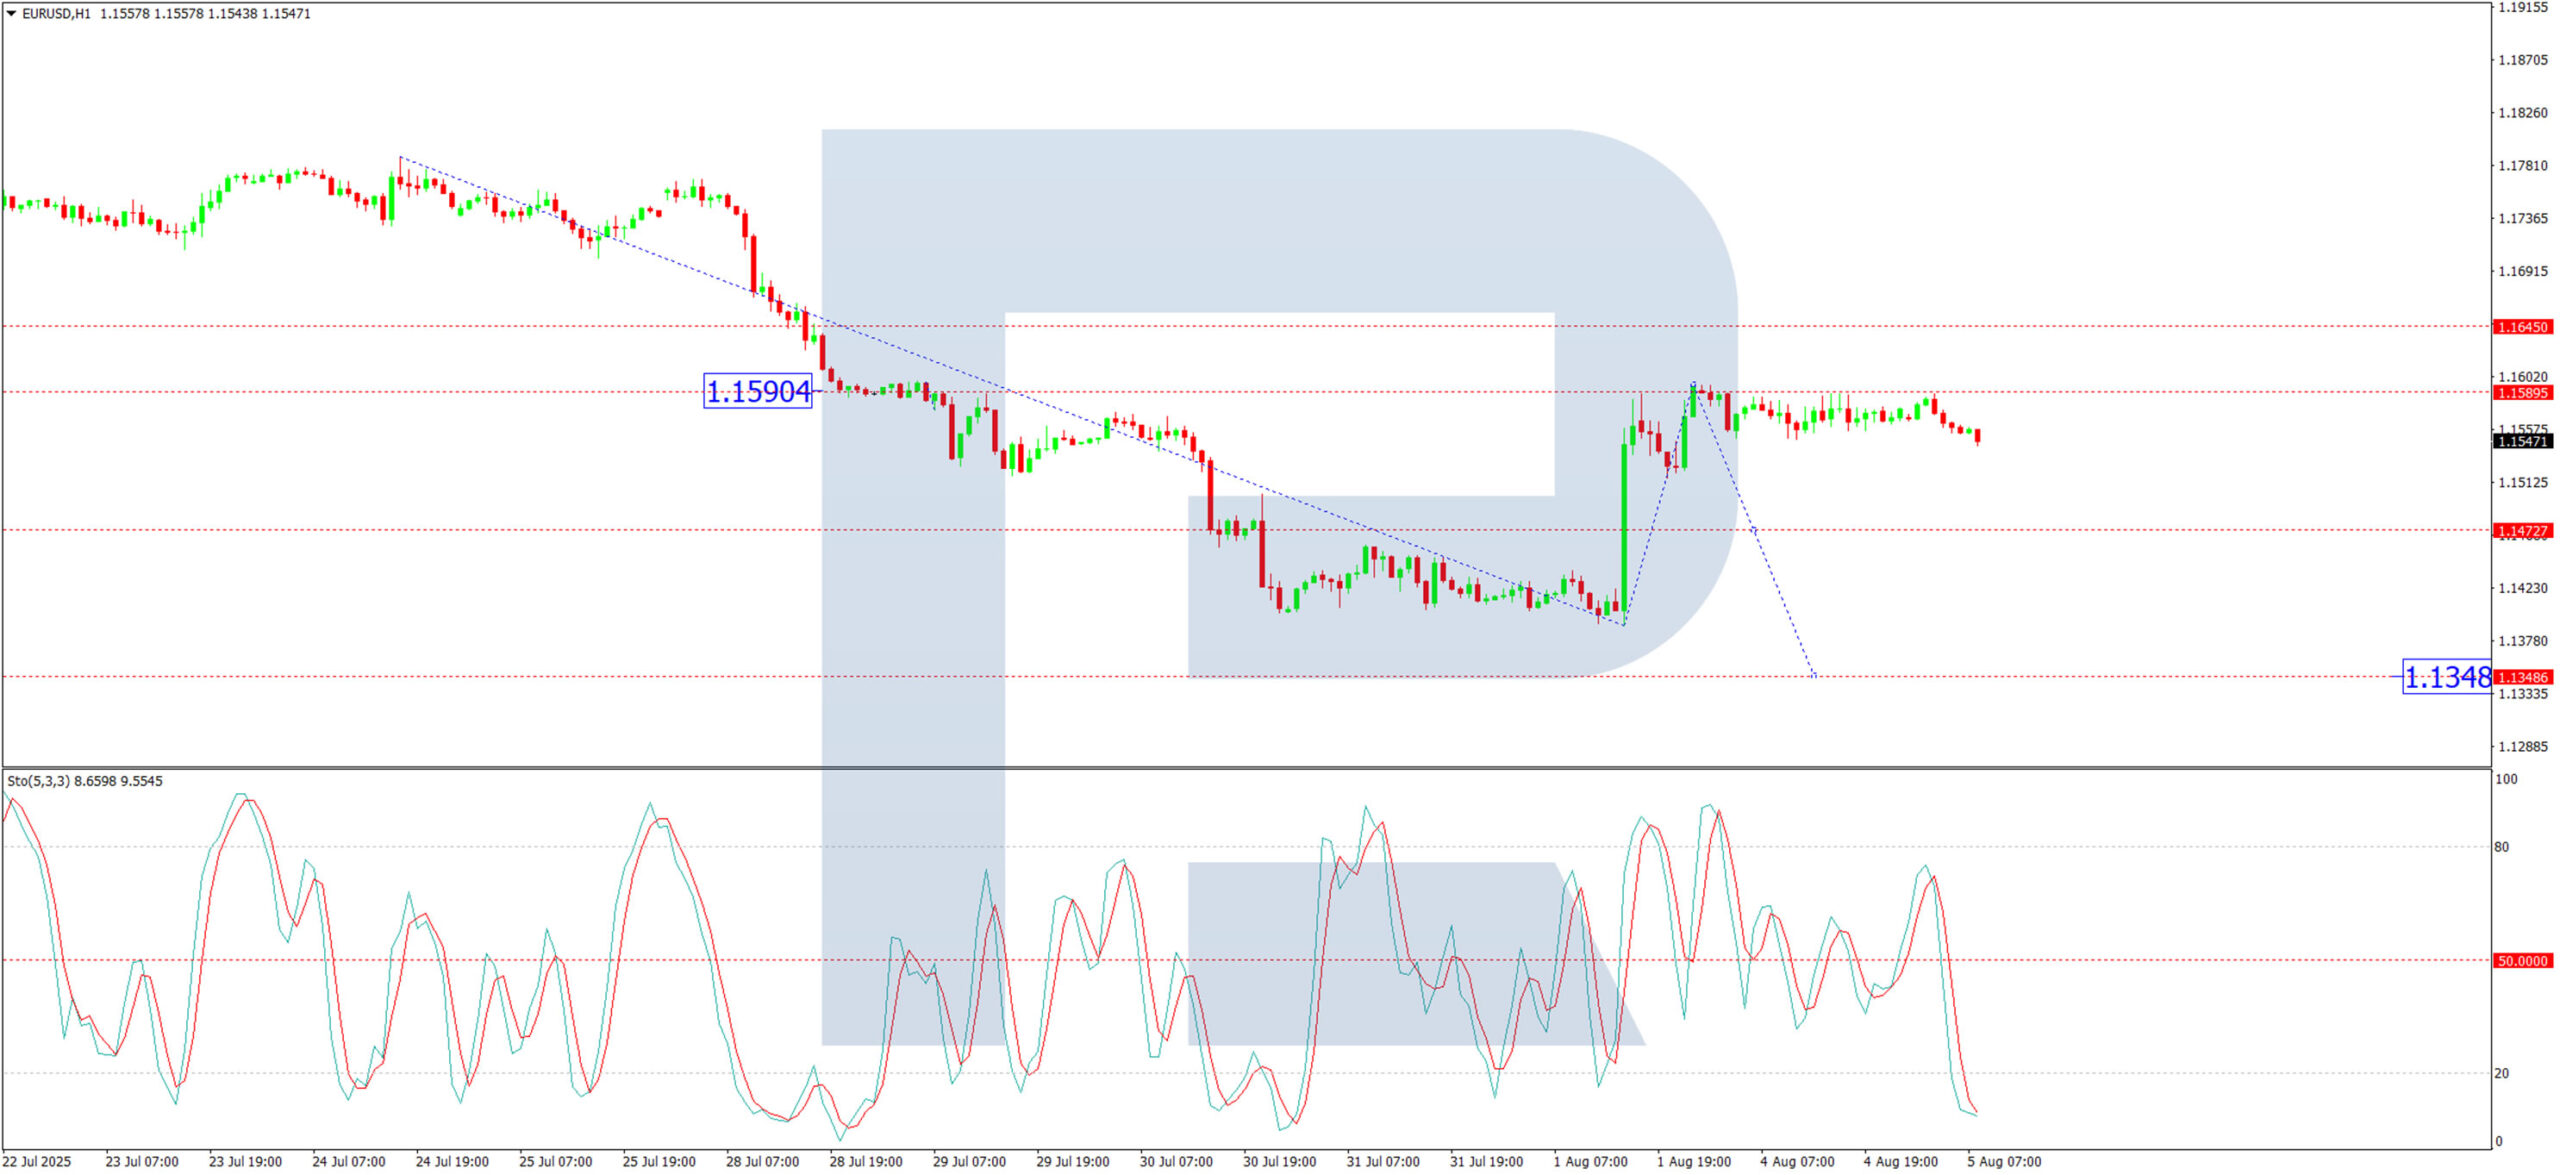
H1 Chart:
The pair has formed a consolidation range around 1.1555, with the minimum correction target already met. A downside breakout is anticipated, initiating the fifth wave of decline towards 1.1348. The Stochastic oscillator reinforces this outlook, with its signal line below 50 and trending sharply downward towards 20.
Conclusion
The EUR/USD remains vulnerable to further losses, driven by a combination of weakening technical structure and external macroeconomic pressures. Traders should monitor US economic data for signals on near-term direction, as the broader downtrend remains intact.
European data wrap: Eurozone PMI leaves room for one more ECB cut
In the Eurozone, PPI rose 0.8% mom and 0.6% yoy in June, slightly missing monthly expectations but beating on the annual rate. Energy prices surged 3.2% on the month, offsetting modest gains elsewhere. Intermediate goods prices slipped -0.2%, reflecting some ongoing input cost disinflation in the manufacturing sector.

More encouragingly, Eurozone PMI Services was finalized at 51.0 in July, up from June’s 50.5. Composite PMI rose to 50.9 from 50.6. Germany and Italy showed gains, while Spain led the bloc at a five-month high of 54.7. France, however, slipped to a three-month low of 48.6. HCOB noted that services inflation is easing, with input costs growing at the slowest pace in nine months. That, alongside decelerating wage growth, strengthens the case for one more ECB rate cut in the second half of the year.

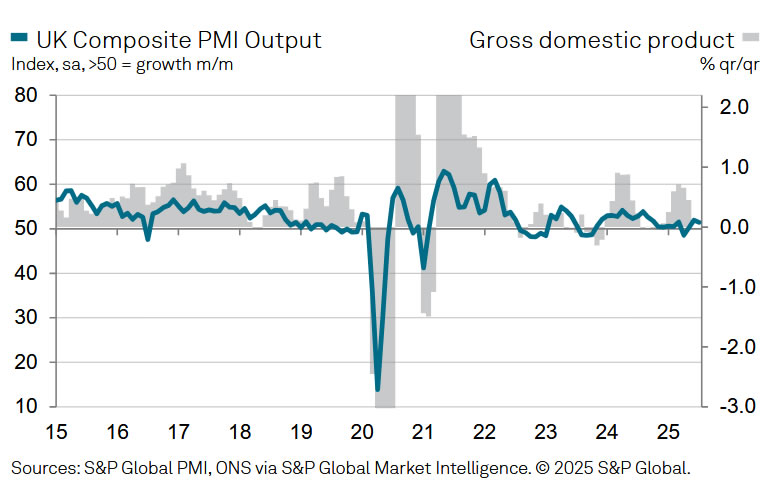
In the UK, the tone was more cautious. July’s PMI Services was finalized at 51.8, down from June’s 52.8, while Composite PMI eased to 51.5 from 52.0. Despite softer prints, S&P Global noted that business confidence improved, supported by receding US tariff concerns and hopes for domestic rate cuts later this year.
Nasdaq 100 Analysis: Index Rebounds After Friday’s Decline
The release of disappointing US labour market data on Friday unsettled both stock market participants and the President of the United States:
→ Donald Trump promptly dismissed Erica McEntarfer, Commissioner of the Bureau of Labor Statistics, accusing her of falsifying employment data.
→ Stock indices accelerated their decline, with the Nasdaq 100 Index (US Tech 100 mini on FXOpen) falling below its 16 June low.
However, US stock indices staged a strong recovery on Monday. According to Reuters, yesterday marked the largest daily percentage gain since 27 May.
Why Did Stock Indices Rise?
Possible reasons include:
→ Buyers were attracted by the falling share prices of companies that, for the most part, had delivered strong quarterly earnings;
→ Market participants are betting on a potential rate cut by the Federal Reserve in September (a move strongly advocated by Trump), which could support both the economy and the stock market.
Technical Analysis of the Nasdaq 100 Chart (US Tech 100 mini on FXOpen)
In our earlier analysis of the Nasdaq 100 Index (US Tech 100 mini on FXOpen), we:
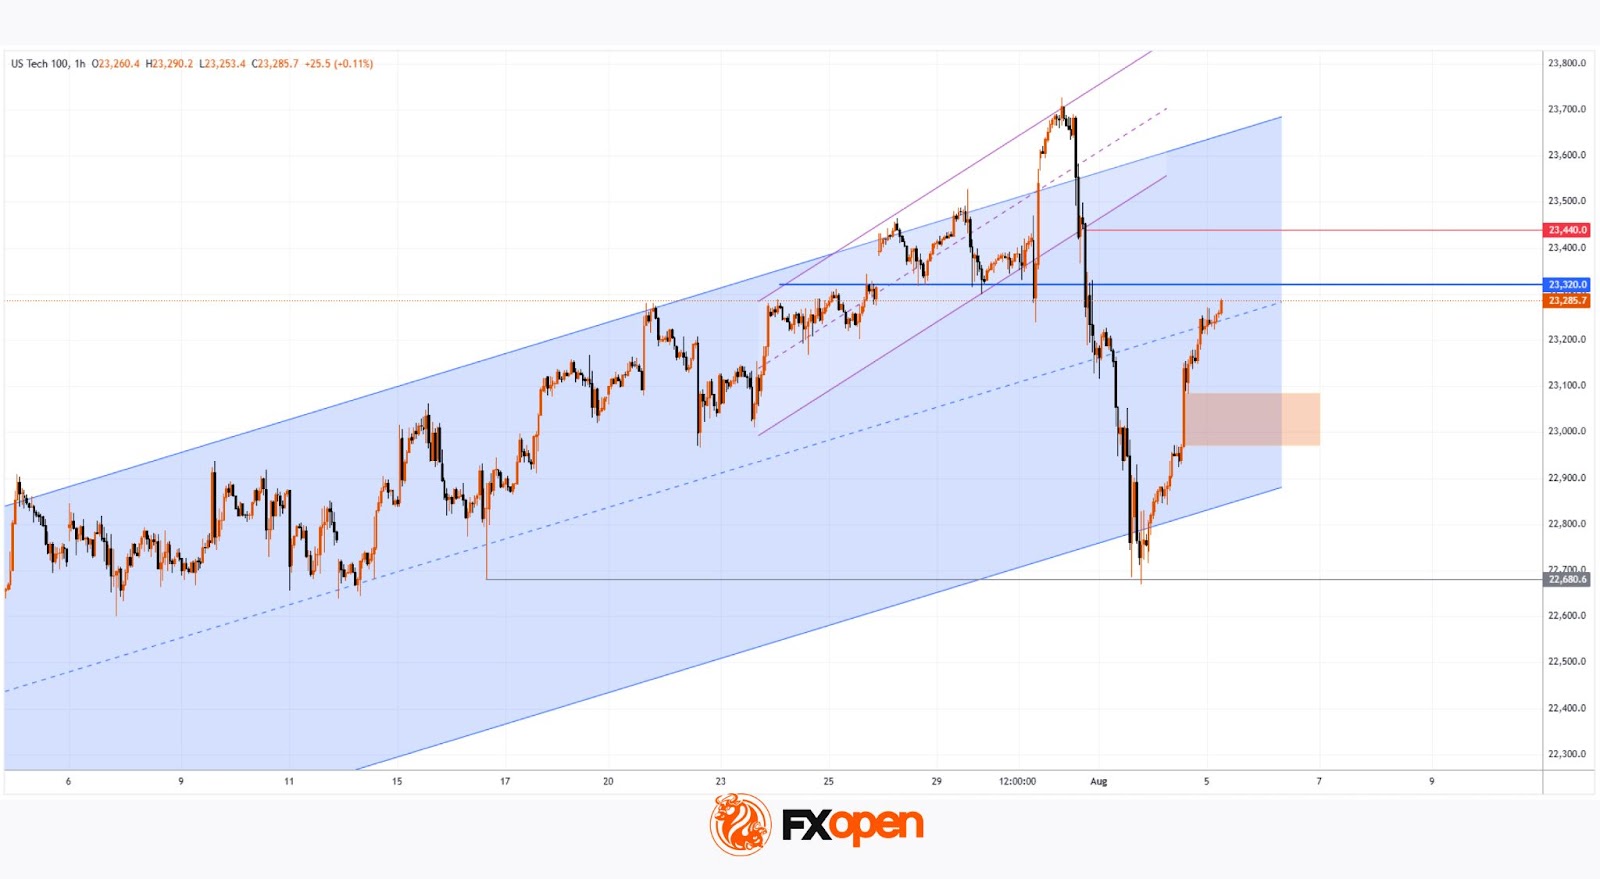
→ Identified a primary ascending channel (marked in blue);
→ Highlighted that the price had risen above the upper boundary of the channel (a sign of excessive optimism);
→ Anticipated a potential correction towards the 23,020 level.
However, the correction turned out to be more substantial than initially expected.
As a result of the price movements on Friday and Monday:
→ The blue channel was widened twofold;
→ The price found support at its new lower boundary and reversed upwards;
→ As of today, the Nasdaq 100 index is trading near the median line.
This can be interpreted as the market aggressively digesting recent corporate earnings reports and the prospects of a rate cut in light of a deteriorating labour market. Demand and supply may reach a new equilibrium, potentially leading to a consolidation phase around the median of the widened channel.
It is also possible that the area marked in orange—where the price previously rallied strongly, indicating a buyer-driven imbalance—may now act as support. Resistance levels might include:
→ Former support at 23,320;
→ 23,440 – the level at which bears broke through the purple channel.
Trade global index CFDs with zero commission and tight spreads. Open your FXOpen account now or learn more about trading index CFDs with FXOpen.
This article represents the opinion of the Companies operating under the FXOpen brand only. It is not to be construed as an offer, solicitation, or recommendation with respect to products and services provided by the Companies operating under the FXOpen brand, nor is it to be considered financial advice.
Buy First, Think Later
The week kicked off on a positive note as investors rushed to buy the dips from last week’s correction. While the European indices remain under the pressure of tariffs, there are now two distinct camps regarding whether the major US indices should return to fresh all-time highs or whether a further correction is in order.
The bullish camp argues that earnings have been stronger than expected, and that rising rate cut prospects from the Federal Reserve (Fed) are sufficient to send major US indices to fresh records, with optimism potentially echoing across global financial markets.
The bearish camp hears these arguments but highlights that strong US earnings were partly due to a softer dollar; that while technology companies eked out a 26% increase in profits, the rest of the market posted just 4% growth; and that rate cuts are not necessarily justified – even with a deteriorating economic outlook – while inflation remains hot and at risk of further rising, especially as some companies have announced they will be passing part of the tariff costs onto clients.
What’s clear, however, is that retail investors seem to be running the bull show, as CFTC data continues to show strong net negative positioning among institutional traders. And that’s understandable – traditional investors don’t like uncertainty, and there’s nothing more certain than political uncertainty, monetary uncertainty, geopolitical uncertainty, and trade uncertainty on the horizon.
But hey, the Fed has proven capable of fighting any market weakness with its juicy policies, and Donald Trump will likely form a committee that reflects his vision of the perfect central bank: one that cuts rates.
Speaking of that, the Fed is expected to cut rates twice before the end of the year, with the first cut now broadly priced in for September. Fed funds futures now imply a more than 90% chance for a September cut, versus less than 40% last week, before the dramatic US jobs data landed and resulted in the firing of the BLS chief.
Investors will be watching the ISM and PMI data today. Softer-than-expected figures could further fuel dovish Fed expectations and support equity valuations, despite rising price pressures, while stronger-than-expected data will likely do little to reverse expectations for a September cut. On the contrary, any bright spot would support the idea that the US economy is holding up well despite tariffs.
In summary, we’re in a blind spot where investors are capable of seeing the glass half full, whatever the data suggests. And even though the equity rally barely matches the global headlines, the rally is on. The S&P 500 printed its best day since May. Futures are in the green this morning, with Nasdaq futures leading gains after Palantir announced better-than-expected Q2 results after the close yesterday, sending the share price some 4.5% higher in after-hours trading.
AMD is due to report after today’s close and is also expected to announce strong quarterly numbers on robust AI demand. Note that despite robust results, some leading chipmakers – including Arm Holdings and Qualcomm – failed to bring investors on board. For AMD, which has been the best-performing chip stock of 2025 - beating expectations alone may not be enough; investors will also require a strong outlook.
In the bond markets, calm reigns ahead of US 3-, 10- and 20-year bond auctions. Here too, investors seem to have digested the explosive US debt news of a few weeks ago. The US 10-year yield is down to 4.20%. Beyond the US, the Japanese 10-year yield has eased below 1.50%, and a gauge of European 10-year debt yields has fallen to a two-week low. Even though the long-term outlook remains positive for DM yields on the back of rising debt worries, investors don’t seem disturbed by the rising trend.
In FX, the US dollar consolidates losses following a sharp post-NFP selloff. The outlook, which had turned slightly positive since early June due to crowded short positions, is now turning neutral, as trade tensions, weak economic data, and rising dovish Fed expectations support the bears.
As such, the EURUSD is testing the 50-DMA to the upside. Strong PMI data could help clear resistance. Cable rebounded from a critical Fibonacci support last week and remains in a bullish consolidation zone, as the 25bp cut from the Bank of England (BoE) later this week is already priced in. Hence, the dovish shift in Fed pricing is currently weighing more heavily on sentiment than the BoE’s stance.
Plus, Brits are facing rising inflation in the coming months, which could result in a cautious cut from the BoE this Thursday. If that’s the case, Cable could remain in the medium-term bullish consolidation zone above the 1.3140 mark – the major 38.2% Fibonacci retracement of this year’s rally.
In energy, crude oil extends losses following OPEC’s decision to increase production by 547,000 barrels per day from next month, fueling expectations of a surplus in H2.
Critical support is seen near the $65.20–$65.30 per barrel area, which shelters the 100-DMA and the major 38.2% Fibonacci retracement of the year-to-date decline. A sufficiently soft US dollar could help keep oil prices in the bullish consolidation zone.
Elsewhere in commodities, a weaker dollar and lower yields are turning supportive of gold prices amid ongoing trade and geopolitical uncertainties. While strong resistance is seen into the $3,400 per ounce level, the outlook for the precious metal remains positive, and a further rise toward $3,500 per ounce looks increasingly plausible.
US ISM Services PMI in Focus
In focus today
Today, the US ISM services PMI is due, with consensus expecting an increase to 51.5 in July from 50.8 in June. The preliminary services PMI for July surprised to the upside, rising to 55.2 from 52.9, supported by strong domestic service demand holding up well. However, recent growth has been overly reliant on the services economy as manufacturing business conditions deteriorated for the first time this year.
Economic and market news
What happened overnight
In China, S&P services PMI rose to 52.6 in July, up from 50.6 in June, marking the fastest expansion in 14 months. The rebound reflects stronger domestic demand and increased activity in export-related services, helping to offset ongoing weakness in manufacturing and underpinning the broader economic recovery.
What happened over yesterday
In the euro area, the August Sentix indicator dropped sharply to -3.7, well below expectations of 8.0. As the first indicator reflecting investors' initial assessment of the EU-US tariff deal, it offered a view of the sentiment in the euro area. The data revealed worsening perceptions of both the current economic situation and future expectations for the euro area.
Equities: Equities delivered a surprisingly strong comeback yesterday, reversing most of Friday's losses. While this reaction aligns broadly with what we discussed in Monday's Morning Espresso, it still surprises us slightly that the market so decisively ignored the underlying signal from Friday's notably weak non-farm payrolls report. In other words, equity markets are showing little concern at this point about the potential softening in the US labour market.
Digging deeper into equities, the rally was led by cyclicals and small caps, underlining a clear "risk-on" tone in yesterday's session. One might be tempted to label this a classic Goldilocks move, though we lean more toward the view that we are seeing a degree of exuberance in equities at present.
In the US yesterday, Dow +1.3%, S&P 500 +1.5%, Nasdaq +1.9%, Russell 2000 +2.1%.
Asian equities are broadly higher this morning, and futures in both Europe and the US point to a stronger open.
FI and FX: There was a significant decline in European government bond yields yesterday and the spread between the core-EU and periphery tightened, where the 10Y Italian-German yield spread is once again touching 80bp. The US bond market could not follow the trend from Friday and yields just dipped a few bp ahead of the sale of 3Y, 10Y and 30Y government bonds during the week. There were modest movements in US Treasuries in Asian trading hours this morning.
EUR/USD Daily Outlook
Daily Pivots: (S1) 1.1549; (P) 1.1573; (R1) 1.1596; More...
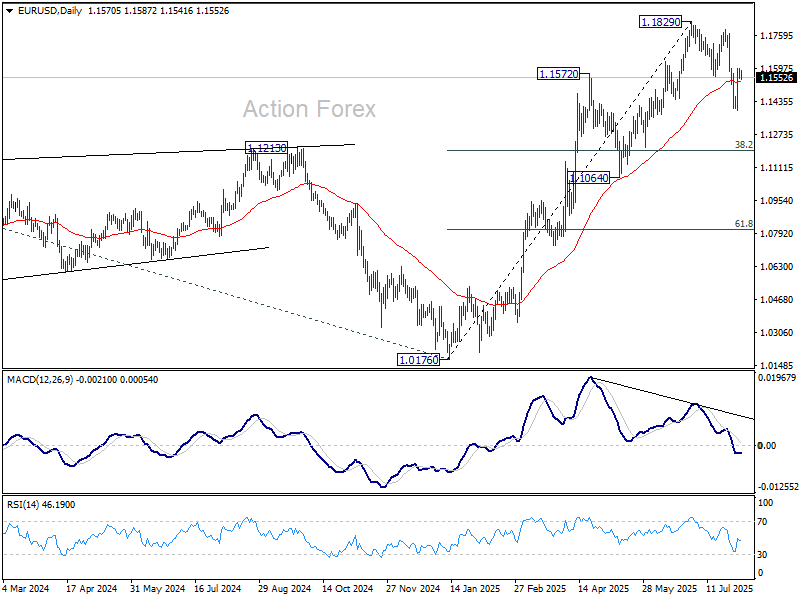
EUR/USD retreated after hitting 55 4H EMA (now at 1.1573), and intraday bias is turned neutral first. On the upside, above 1.1596 will affirm the case that correction from 1.1829 has completed with three waves at 1.1390. Further rally should then be seen to retest 1.1788/1820 resistance zone. On the downside, break of 1.1390 will resume the correction to 38.2% retracement of 1.0176 to 1.1829 at 1.1198 instead.
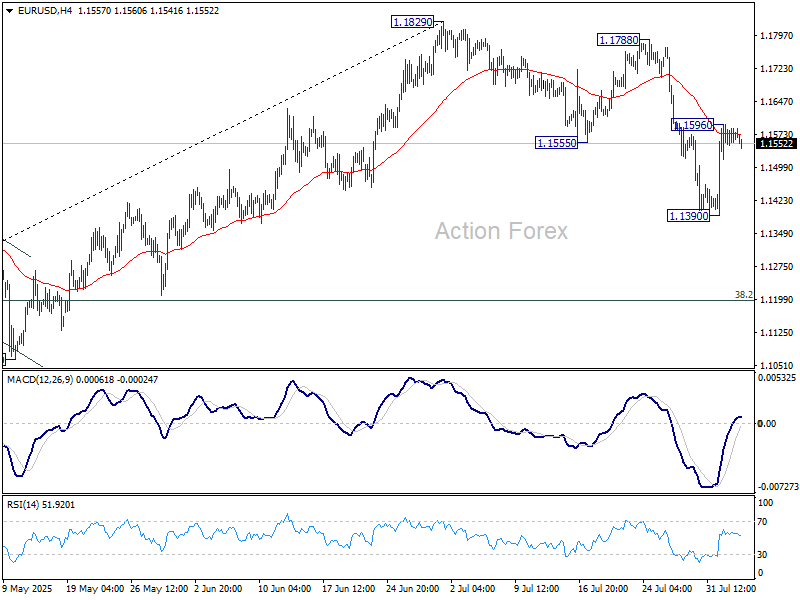
In the bigger picture, rise from 0.9534 long term bottom could be correcting the multi-decade downtrend or the start of a long term up trend. In either case, further rise should be seen to 100% projection of 0.9534 to 1.1274 from 1.0176 at 1.1916. This will remain the favored case as long as 1.1604 support holds.
USD/JPY Daily Outlook
Daily Pivots: (S1) 146.60; (P) 147.35; (R1) 147.82; More...
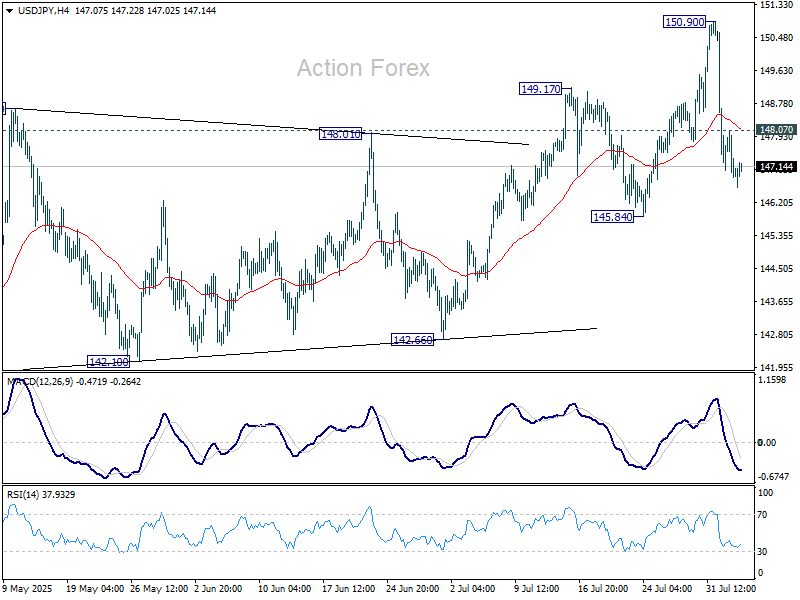
Intraday bias in USD/JPY remains neutral for the moment. On the upside, above 148.07 will bring stronger rebound back to retest 150.90. Break there will resume the rebound from 139.87. However, on the downside, firm break of 145.84 support will argue that whole rise from 139.87 might have already completed. Deeper fall should then be seen to 142.66 support for confirmation.
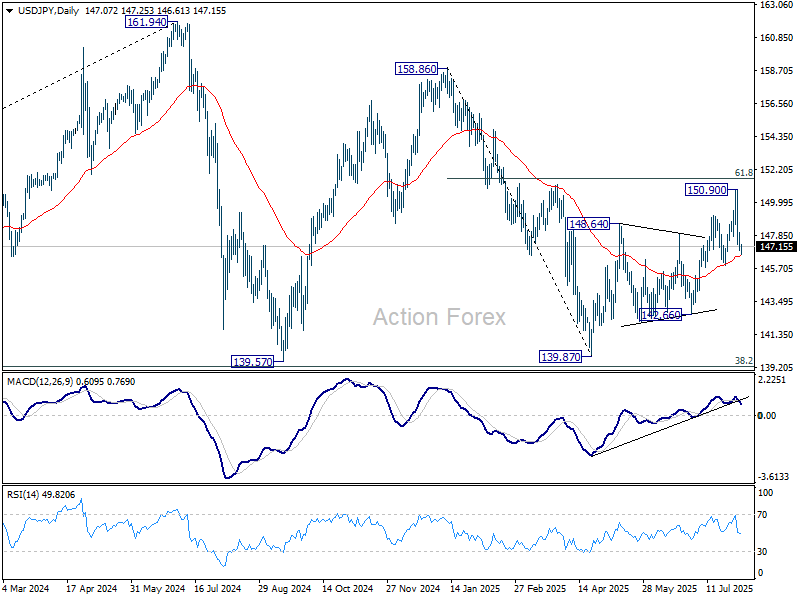
In the bigger picture, price actions from 161.94 (2024 high) are seen as a corrective pattern to rise from 102.58 (2021 low). Decisive break of 61.8% retracement of 158.86 to 139.87 at 151.22 will argue that it has already completed with three waves at 139.87. Larger up trend might then be ready to resume through 161.94 high. In case the corrective pattern extends with another fall, strong support is expected from 38.2% retracement of 102.58 to 161.94 at 139.26 to bring rebound.
GBP/USD Daily Outlook
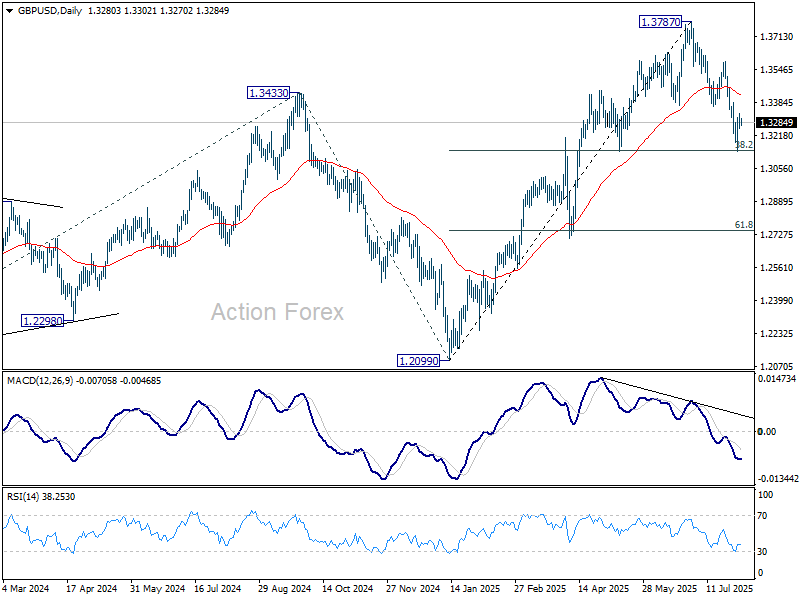
Daily Pivots: (S1) 1.3249; (P) 1.3290; (R1) 1.3326; More...
Intraday bias in GBP/USD remains neutral for the moment. On the upside, sustained break of 1.3363 support turned resistance will indicate that the fall has completed as a three-wave correction. Further rally should then be seen back to 1.3587 resistance next. Nevertheless, sustained trading below 38.2% retracement of 1.2099 to 1.3787 at 1.3142 will target 61.8% retracement at 1.2744.
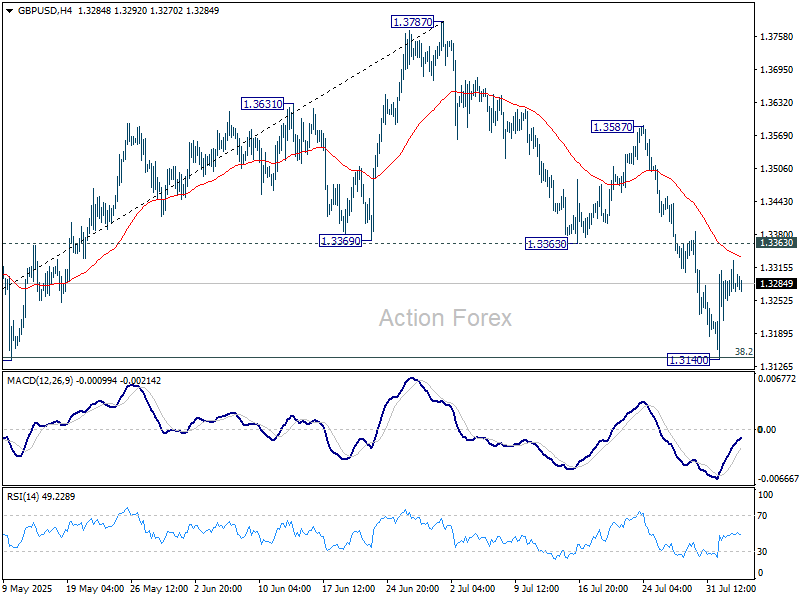
In the bigger picture, up trend from 1.3051 (2022 low) is in progress. Next medium term target is 61.8% projection of 1.0351 to 1.3433 from 1.2099 at 1.4004. Outlook will now stay bullish as long as 55 W EMA (now at 1.3049) holds, even in case of deep pullback.
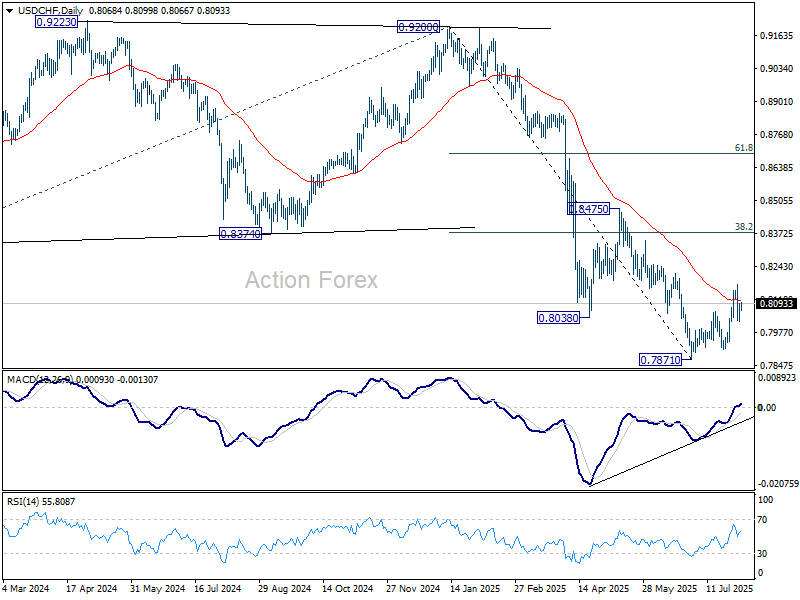
USD/CHF Daily Outlook
Daily Pivots: (S1) 0.8043; (P) 0.8070; (R1) 0.8111; More….
USD/CHF recovered after drawing support from 55 4H EMA (now at 0.8053) and intraday bias is turned neutral first. On the downside, below 0.8020 will affirm that case that corrective bounce from 0.7871 has completed at 0.8170. Bias will be back on the downside for 07871/7910 support zone. On the upside, though, break of 0.8170 will resume the rise from 0.7871 to 38.2% retracement of 0.9200 to 0.7871 at 0.8379 instead.
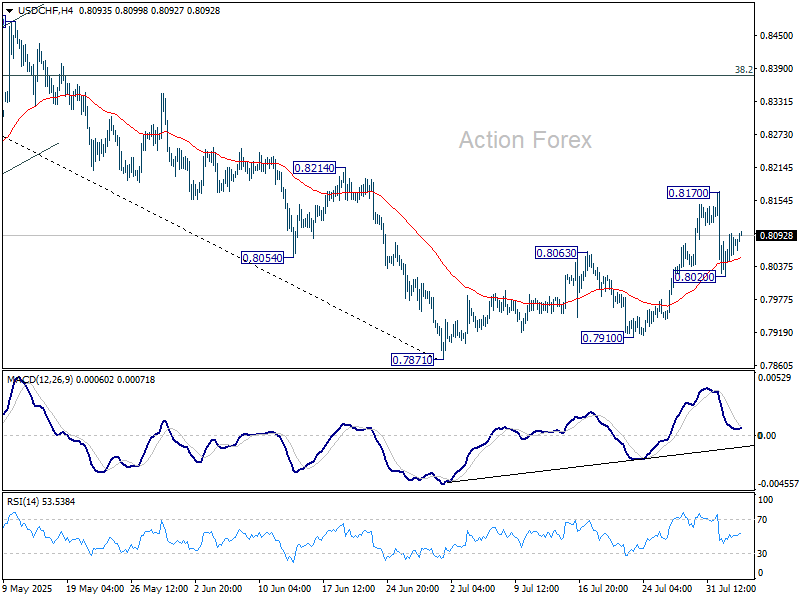
In the bigger picture, long term down trend from 1.0342 (2017 high) is still in progress. Next target is 100% projection of 1.0146 (2022 high) to 0.8332 from 0.9200 at 0.7382. In any case, outlook will stay bearish as long as 0.8475 resistance holds.