
Sample Category Title
Elliott Wave Analysis: Silver (XAGUSD) Targets $40.3 in Wave 5 Rally
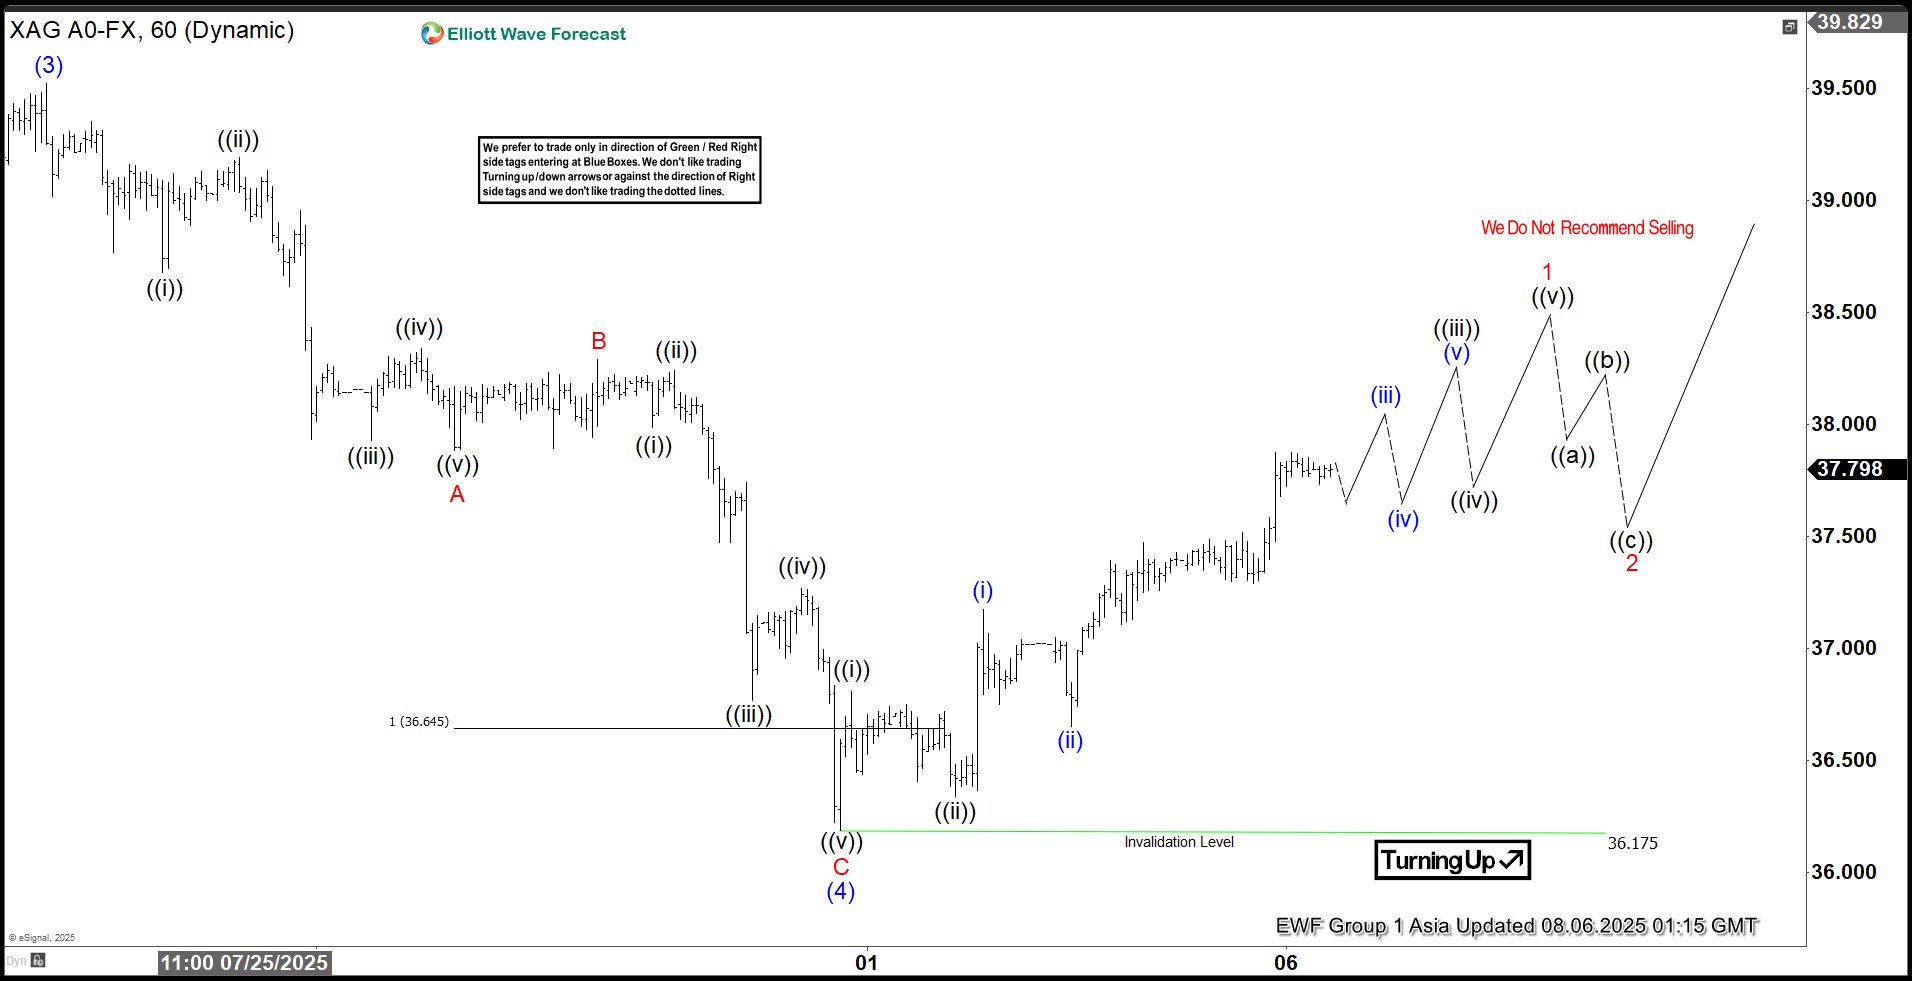
The ongoing cycle in Silver (XAGUSD), initiated from the April 7 low, continues to unfold as an impulsive Elliott Wave structure. Wave (3) of this impulse concluded at 39.52, as illustrated on the 1-hour chart. The subsequent pullback in wave (4) terminated at 36.17, exhibiting a zigzag internal structure. From the peak of wave (3), wave ((i)) declined to 38.67, followed by a rally in wave ((ii)) to 39.19. Wave ((iii)) then dropped to 37.93, with wave ((iv)) rebounding to 38.33. The final leg, wave ((v)), completed at 37.88, finalizing wave A in a higher degree. Wave B then rallied to 38.28.
Wave C descended in a five-wave impulse pattern. From wave B, wave ((i)) fell to 37.98, and wave ((ii)) climbed to 38.24. Wave ((iii)) dropped to 36.76, followed by wave ((iv)) rising to 37.268. The final wave ((v)) concluded at 36.17, completing wave C of (4). Silver has since begun advancing in wave (5). However, it must surpass the wave (3) high of 39.52 to eliminate the possibility of a double correction. As long as the 36.17 pivot holds, expect upward momentum. The potential target for wave (5) lies at the 123.6% inverse retracement of wave (4), projecting to 40.3. This analysis supports a bullish near-term outlook, provided the key support level remains intact.
Silver (XAGUSD) – 60 Minute Elliott Wave Technical Chart:
XAGUSD – Elliott Wave Technical Video:
https://www.youtube.com/watch?v=YJS8qra0qNs
Crude at Critical Support, Eyes on Ukraine, US/India Talks
Data from both sides of the Atlantic painted a mixed picture yesterday. In Europe, July PMIs indicated slower expansion—or faster contraction in some regions—while in the US, the services sector slowed to near 50-mark, the threshold between expansion and contraction. New orders fell, employment softened, and, more worryingly, price pressures accelerated. That’s the last thing investors want to see, as higher inflation may prevent the Federal Reserve (Fed) from cutting rates. Reacting to this, markets pared back rate cut expectations for September. The US 2-year yield bounced above 3.70%, though still below the 4% level seen before last Friday’s jobs report revived hopes of a 25bp cut. Fed funds futures still price in nearly a 90% chance of that cut, partly on the view that a slowing economy will tame inflation over time.
The bigger unknown is whether a spending slowdown could offset the inflationary shock of Trump’s tariff plans—and whether markets could absorb a forced rate cut from Trump without seeing a jump in borrowing costs. So far, markets appear willing to roll with the punches. After a brief period of digestion, they resume pricing in risk and growth as usual—whether it’s exploding US debt, dramatic tariffs, or political unpredictability.
That said, demand for US debt remains a question: the Treasury's $58bn 3-year note sale met weak demand yesterday, and all eyes are on the 10-year auction today. Any softness could revive debt sustainability concerns—or not. The US dollar, meanwhile, is stalling near its 38.2% Fibonacci retracement on its summer rebound and looks poised to resume its bearish trend, weighed down by trade chaos, fiscal concerns, and dovish Fed expectations.
US equities pulled back yesterday, but futures are slightly higher today on hopes that rate cuts will ultimately support valuations. Palantir surged nearly 8% to a record high on strong results. In contrast, Super Micro Computer and AMD disappointed investors. AMD, the best-performing chip stock in the Philadelphia Semiconductor Index, dropped more than 6% after hours, while Super Micro fell 16%. Zooming out, the semiconductor sector broadly declined on reports that Trump may impose tariffs on chip and pharmaceutical imports. Trump even floated a 150–250% tariff range on pharmaceutical products—hardly encouraging news for Swiss negotiators who landed in the US yesterday hoping to roll back the 39% tariffs imposed last week. The SMI index is holding its breath, with hopes that US trade officials recognize that Switzerland’s low-value-added gold exports distort its trade deficit, while its $50bn in US service imports—like Microsoft licenses—should carry more weight.
But Trump has little incentive to entertain those arguments. After all, what’s the alternative—boycott Microsoft Office and send handwritten letters by carrier pigeon? In today’s digital world, that’s what negotiation power (or the lack of it) looks like. And Europe seems to have little of it.
In Europe, French industrial production posted a nearly 4% gain in June—its strongest in five years—driven by transportation materials and easing supply chain constraints. Still, the broader eurozone outlook remains tepid. Growth is hampered by regulatory rigidity and a stubbornly inflexible labour market. The Stoxx 600 eked out a modest 0.15% gain yesterday, but in the new geopolitical environment, defense and tech are emerging as the sectors to own, while luxury appears to be falling out of favour. Unsurprisingly, European tech and defense names delivered solid Q2 results, while luxury struggled. Banks also performed well.
European energy companies reported earnings declines—but not as steep as feared. Both Shell and BP beat estimates, maintained share buybacks, and emphasized capital discipline over aggressive green spending. Shell is trimming underperforming divisions like Chemicals, while BP is scaling back its renewables strategy under activist pressure. BP rose 2.8% on the results, while Shell is lower since its earnings announcement. In Saudi Arabia, Aramco reported its tenth straight revenue decline and is now borrowing to fund shareholder payouts as lower oil prices bite into revenue. Aramco is attempting to offset this by increasing output, hoping that higher volume will compensate for lower prices. The soft US dollar and a slowing global energy transition may help.
Crude oil is now testing a critical support near $65.30 per barrel. That level is under pressure due to speculation that Russia may announce an air truce in Ukraine. But in contrast, Donald Trump’s threat of tariffs on countries buying Russian oil could be bullish, if countries comply. India must now weigh the cost of cheaper Russian oil against the risk of damaging relations with an increasingly protectionist US. Price-wise, if WTI breaks below $65pb, it would likely mark the end of this summer’s price rebound and usher in a renewed downtrend, in line with higher supply and an uncertain demand outlook for the second half.
US Services PMI Slipped in July
In focus today
In the euro area, June retail sales will be released. In May, seasonally adjusted retail trade volume declined by 0.7%. Recent 2025 retail sales figures suggest growing consumer caution, with sales remaining flat.
Economic and market news
What happened yesterday
In the US, the ISM services PMI declined to 50.1 for July from 50.8 in June, remaining just above the neutral 50 level. This contrasts with the earlier PMI release, which exceeded expectations. The report highlighted a services employment index of 46.4, signalling contraction for the second consecutive month. While all other sub-indices weakened, the prices index rose, raising concerns for the Fed about the risk of stagflation, as growth and demand soften while prices pressures persist.
In Sweden, the services PMI dropped sharply to 48.8 in July from 54.6 in June, entering contraction territory. The most significant drag came from orders, pointing to weaker demand. This aligns more closely with stagnant hard data, as seen in Q2 GDP growth of just +0.1% q/q following 0% in Q1. It emphasises Riksbank's current challenge of balancing low growth with high inflation.
Equities: Equity markets drifted sideways yesterday with contrasting signals across regions and sectors. US markets edged lower while both European and Asian indices closed higher. Sector-wise, there was little in the way of a clear narrative, especially in the US. Materials led the pack, while utilities lagged - hardly your textbook "risk-off" setup. Adding to the ambiguity, US small caps outperformed, suggesting underlying risk appetite despite headline index weakness.
In the US yesterday, Dow -0.1%, S&P 500 -0.5%, Nasdaq -0.7% and Russell 2000 +0.6%. Asian equities are mixed this morning, but futures in both Europe and the US point to a firmer open.
FI and FX: The US yield curve flattened from the short end as 2Y yields rose some 5bp while the 10Y US Treasury yield was unchanged. The move was driven by ISM service data showing a stagnating service sector, but rising price pressure which adds to the uncertainty regarding future rate cuts from the Federal Reserve.
AUD/USD Daily Report
Daily Pivots: (S1) 0.6455; (P) 0.6467; (R1) 0.6485; More...
AUD/USD's recovery from 0.6418 extends higher today but stays below 0.6528 resistance. Intraday bias remains neutral and further decline is in favor. Fall from 0.6624 short term top is seen as at least correcting the rally from 0.5913. Below 0.6418 will target 38.2% retracement of 0.5913 to 0.6624 at 0.6352. Nevertheless, break of 0.6528 will dampen this bearish case, and bring retest of 0.6624 high instead.
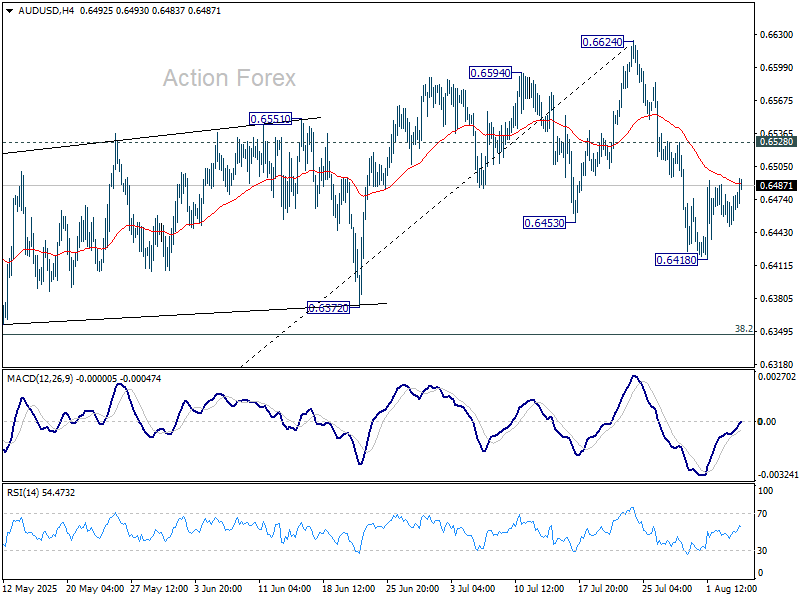
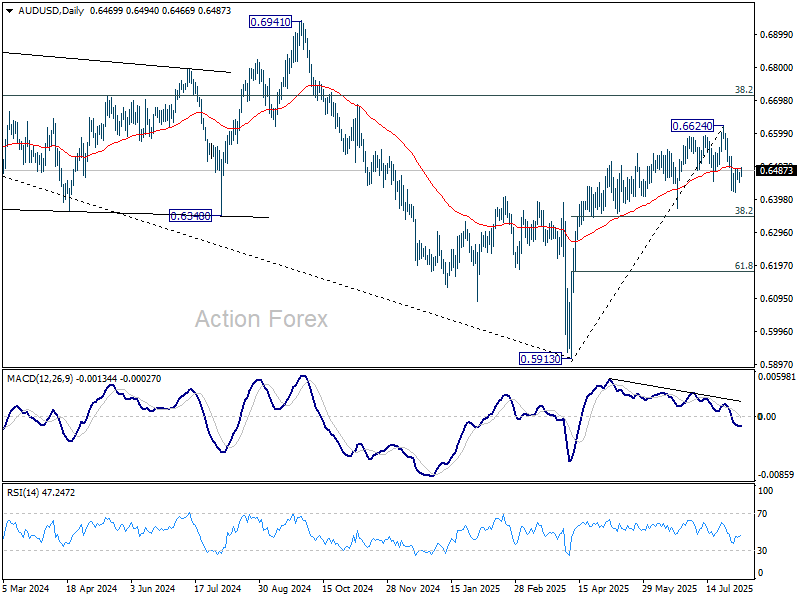
In the bigger picture, there is no clear sign that down trend from 0.8006 (2021 high) has completed. Rebound from 0.5913 is seen as a corrective move. While stronger rally cannot be ruled out, outlook will remain bearish as long as 38.2% retracement of 0.8006 to 0.5913 at 0.6713 holds. Nevertheless, considering bullish convergence condition in W MACD, even in case of another fall through 0.5913, downside should be contained above 0.5506 (2020 low).
Sectoral Tariffs in Focus, Chips Hit but Broader Markets Hold
Asian equity markets are broadly stable today, shrugging off the negative lead from Wall Street overnight. The broader resilience comes despite a sharp selloff in chip stocks across Japan, South Korea, and Taiwan after US President Donald Trump confirmed that new tariffs on semiconductors and chips will be unveiled “within the next week or so.”
The planned sector-specific tariffs mark a new phase in the trade war. While reciprocal country-level tariffs appear largely set following last week’s sweeping executive orders, the White House is now pivoting toward targeted sectoral action. Alongside semiconductors, Trump flagged the pharmaceutical industry as another category under review — with some levies potentially rising as high as 250%, the steepest threat to date.
So far, broader Asian indices are holding up, with investors cautiously awaiting further clarity. However, sentiment remains fragile as the risk of further escalation persists. With markets still digesting the implications of a prolonged tariff campaign, sector-specific vulnerabilities are starting to come into sharper focus, especially in export-driven economies.
In the currency markets, price action remains subdued. All major currency pairs and crosses are still trading within last week’s ranges, reflecting underlying indecision. Dollar is on the softer side today, but there was no following through selling after yesterday's disappointing ISM Services print. Loonie and Swiss Franc are also underperforming in today’s session.
Kiwi is showing a modest rebound after Q2 employment data showed a smaller-than-expected rise in unemployment. Still, the report does little to shift expectations for another RBNZ rate cut later this month. Aussie is also slightly firmer, helped by a record high in the ASX equity index. Meanwhile, Euro, Sterling, and Yen are all trading mixed in the middle.
In Asia, at the time of writing, Nikkei is up 0.55%. Hong Kong HSI is down -0.01%. China's Shanghai SSE is up 0.18%. Singapore Strait Times is up 0.19%. Japan 10-year JGB yield is up 0.017 at 1.493. Overnight, DOW fell -0.13%. S&P 500 fell -0.49%. NASDAQ fell -0.65%. 10-year yield fell -0.004 to 4.196.
Japan real wages remain negative despite stronger 2.5% nominal growth
Japan’s real wages continued to contract in June, falling -1.3% yoy — the sixth straight month of decline. While that marked an improvement from May’s revised -2.6% yoy drop, persistent inflation, particularly in food prices, continues to erode household purchasing power. Consumer prices used for wage calculations rose 3.8% yoy in June, far outpacing nominal wage gains.
Nominal wages climbed 2.5% yoy, up from 1.4% yoy in May and rising for the 42nd consecutive month. However, the reading missed expectations of 3.2% yoy, tempering the positive headline. Base pay rose 2.1% yoy, and special earnings — mainly bonuses — grew 3.0% yoy, supporting a modest rise in overall pay levels during the reporting month.
NZ unemployment rate rises to 5.2%, RBNZ August cut in play
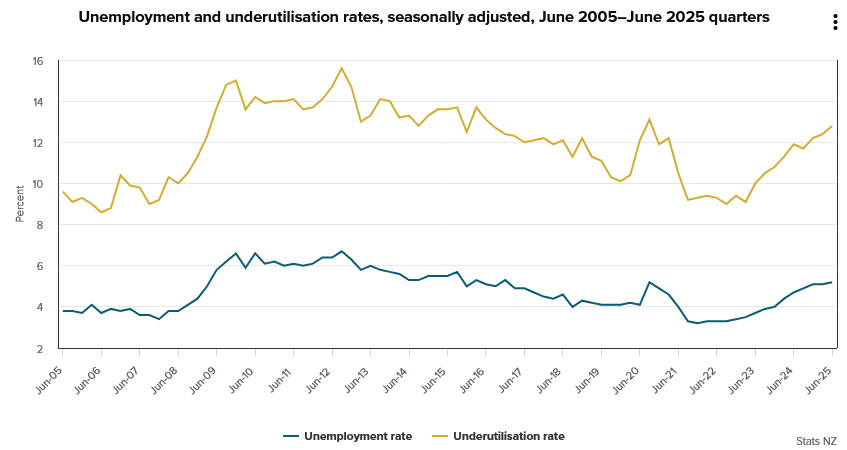
New Zealand’s Q2 labour market report confirmed continued softening, with employment falling -0.1% qoq and unemployment edging up to 5.2%. That marks the highest jobless rate since 2020, though still slightly below consensus of 5.3%. Participation rate also dropped -0.2 points to 70.5%, its lowest since early 2021, suggesting a cooling in demand.
Wage growth offered a mixed signal to the RBNZ. The private sector wage index rose 0.6% qoq, higher than expected 0.5% qoq and up from Q1’s 0.4%. But annual wage inflation slowed from 2.5% to 2.2% — the lowest in over three years — hinting that longer-term wage pressures are easing.
The overall report doesn’t deviate much from RBNZ’s May projections and is unlikely to alter its near-term stance. With inflation running at 2.7% yoy in Q2, markets still expect one more 25bps rate cut from the current 3.25% this month. But the central bank is likely to stay cautious on signaling further easing until price and wage dynamics show more decisive downside momentum.
AUD/USD Daily Report
Daily Pivots: (S1) 0.6455; (P) 0.6467; (R1) 0.6485; More...
AUD/USD's recovery from 0.6418 extends higher today but stays below 0.6528 resistance. Intraday bias remains neutral and further decline is in favor. Fall from 0.6624 short term top is seen as at least correcting the rally from 0.5913. Below 0.6418 will target 38.2% retracement of 0.5913 to 0.6624 at 0.6352. Nevertheless, break of 0.6528 will dampen this bearish case, and bring retest of 0.6624 high instead.
In the bigger picture, there is no clear sign that down trend from 0.8006 (2021 high) has completed. Rebound from 0.5913 is seen as a corrective move. While stronger rally cannot be ruled out, outlook will remain bearish as long as 38.2% retracement of 0.8006 to 0.5913 at 0.6713 holds. Nevertheless, considering bullish convergence condition in W MACD, even in case of another fall through 0.5913, downside should be contained above 0.5506 (2020 low).
Nikkei 225 Technical: Start of New Bullish Impulsive Up Move as Japan’s Wages Tick Higher
The price actions of the Japan 225 CFD Index (a proxy for the Nikkei 225 futures) have staged a recent decline of -5.5% from its intraday high of 42,084 on 24 July 2025 (around 1% away from its all-time high of 42,513, printed in July 2024) to hit a low of 39,980 on 1 August 2025.
Right now, we will examine whether the Japan 225 CFD has hit an inflection point or will the corrective decline from the 24 July high will extend further to the downside from a macro and technical analysis perspective.
Rising Japanese wages should boost consumer confidence
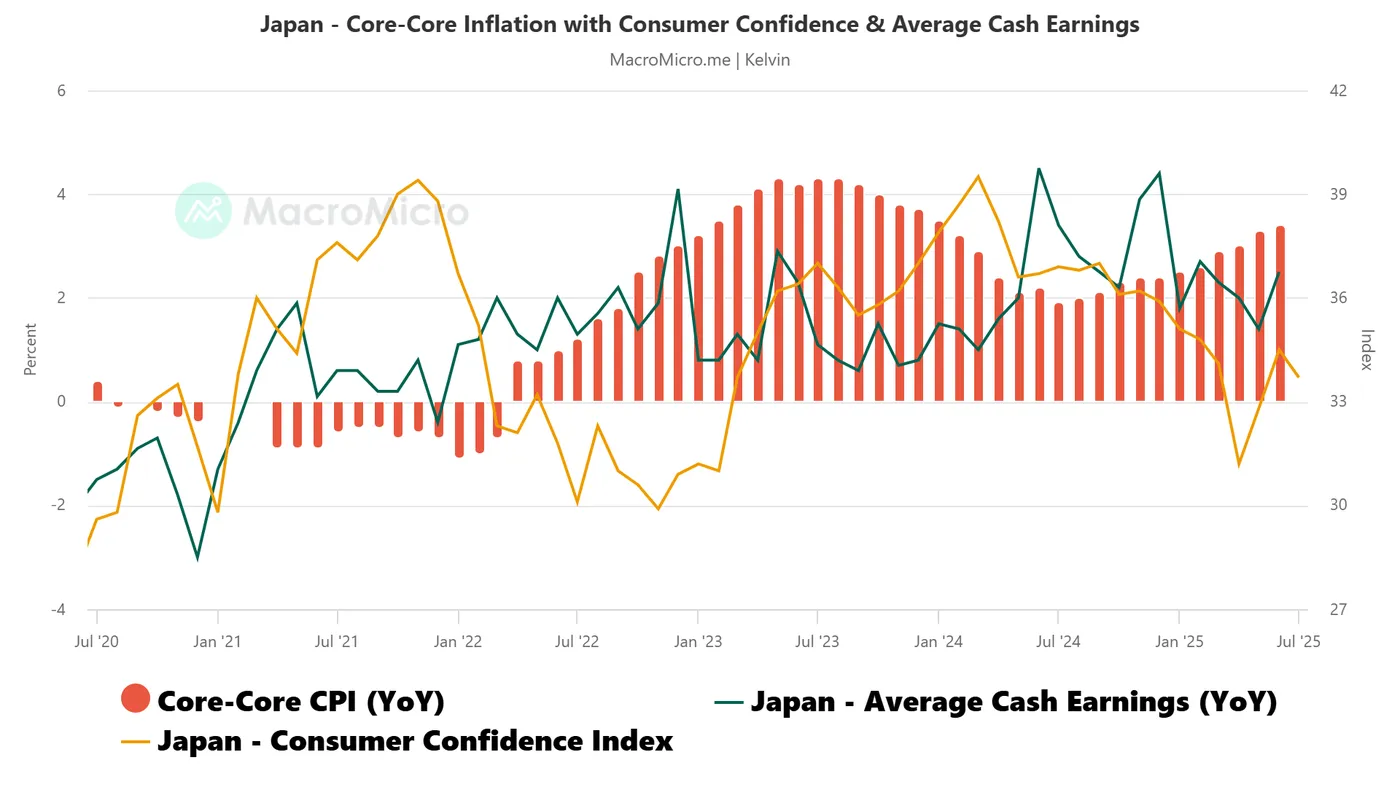
Fig. 1: Japan core-core CPI, average cash earnings (wages) & consumer confidence long-term trends (Source: MacroMicro)
Japan’s nominal wages continued to increase steadily, as they rose by 2.5% y/y in June, the fastest pace in four months (see Fig. 1).
When adjusted for inflation, real wages declined by 1.3% but the contraction is less than May’s decline of 2.6% which suggests June’s increase in nominal wages is catching up with the rise of core-core CPI inflation rate in Japan.
In addition, major Japanese firms agreed to wage hikes averaging over 5% during this year’s spring negotiations, which in turn is likely to push up the growth of real wages back into positive territory in the next wage dataset release in the July-August period.
A sustained rise in wage growth could boost consumer confidence, potentially creating a positive feedback loop that lifts Japanese equities and reinforces the medium-term bullish trend of the Nikkei 225.
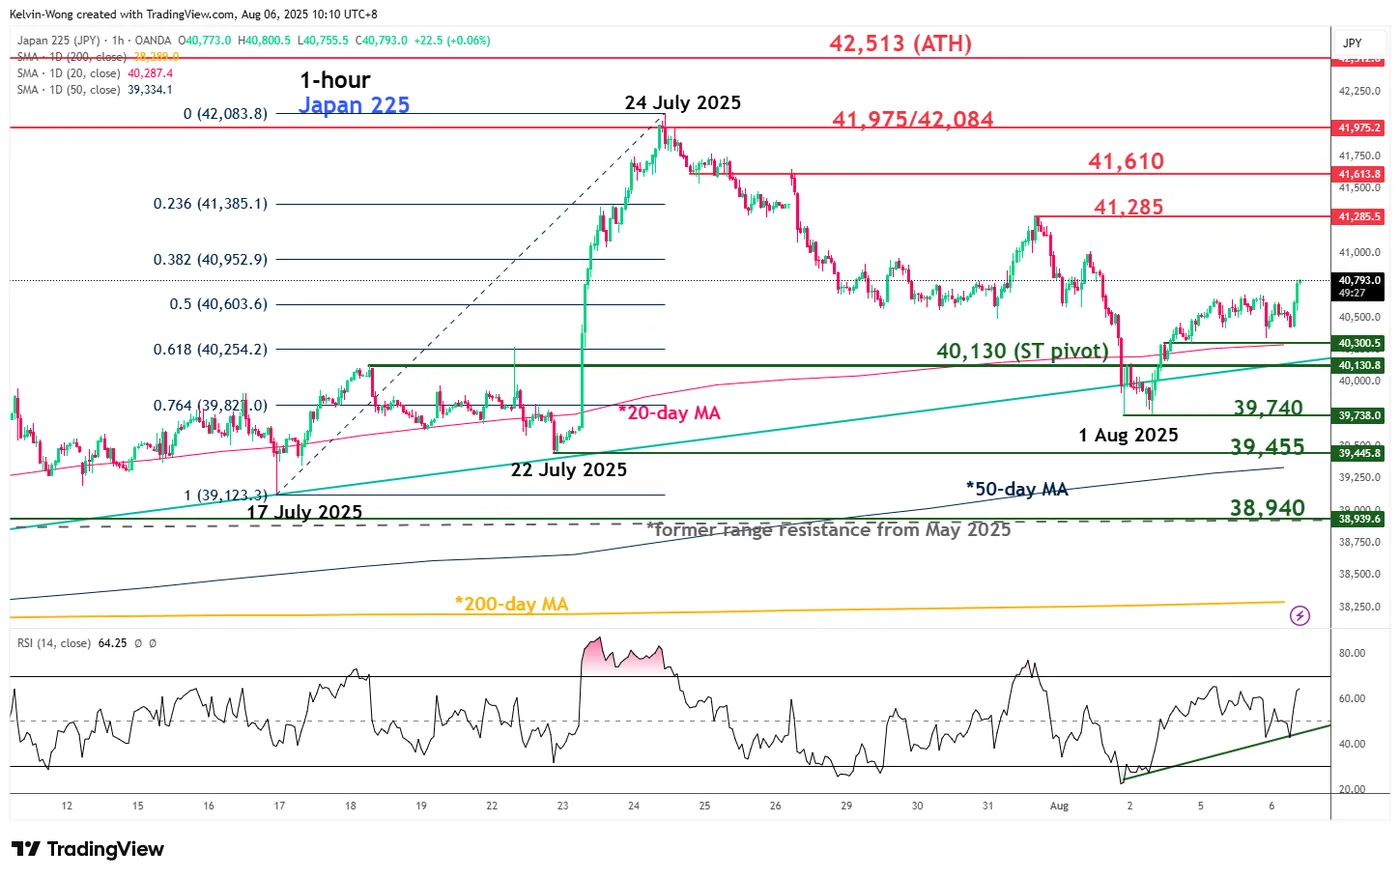
Fig. 2: Japan 225 CFD Index minor trend as of 6 Aug 2025 (Source: TradingView)
Preferred trend bias (1-3 days)
The one-week minor corrective decline of the Japan 225 CFD Index (a proxy for the Nikkei 225 futures) from 24 July 2025 high to 1 August 2025 low is likely to have reached an exhaustion/inflection point where the next move may be skewed towards the bulls.
Bullish bias above 40,130 key short-term pivotal support for potential recovery towards the next intermediate resistances at 41,285, 41,610, and 41,975/42,084 (see Fig. 2).
Key elements
- The -5.5% minor corrective decline of the Japan 225 CFD Index has stalled right at the medium-term ascending trendline support in place since 23 May 2025 low and the 61.8% Fibonacci retracement of prior bullish impulsive up move from 17 July 2025 low to 24 July 2025 high.
- Its price actions have traded back up above the 20-day moving average since Monday, 4 August.
- The hourly RSI momentum indicator has continued to inch higher along a parallel ascending support and has not reached its overbought region (above 70). These observations suggest a build-up in bullish momentum, at least in the short term.
Alternative trend bias (1 to 3 days)
A break below 40,130 invalidates the bullish scenario for an extension of the minor corrective decline towards the next supports at 39,740 and 39,455 (also the 50-day moving average).
NZ unemployment rate rises to 5.2%, RBNZ August cut in play
New Zealand’s Q2 labour market report confirmed continued softening, with employment falling -0.1% qoq and unemployment edging up to 5.2%. That marks the highest jobless rate since 2020, though still slightly below consensus of 5.3%. Participation rate also dropped -0.2 points to 70.5%, its lowest since early 2021, suggesting a cooling in demand.
Wage growth offered a mixed signal to the RBNZ. The private sector wage index rose 0.6% qoq, higher than expected 0.5% qoq and up from Q1’s 0.4%. But annual wage inflation slowed from 2.5% to 2.2% — the lowest in over three years — hinting that longer-term wage pressures are easing.
The overall report doesn’t deviate much from RBNZ’s May projections and is unlikely to alter its near-term stance. With inflation running at 2.7% yoy in Q2, markets still expect one more 25bps rate cut from the current 3.25% this month. But the central bank is likely to stay cautious on signaling further easing until price and wage dynamics show more decisive downside momentum.
GBP/USD Attempts Rebound – Can It Clear the Barriers Ahead?
Key Highlights
- GBP/USD found support at 1.3140 and started a recovery wave.
- It cleared a connecting bearish trend line with resistance at 1.3280 on the 4-hour chart.
- EUR/USD recovered some losses and climbed above 1.1520.
- Gold prices are moving higher above the $3,375 resistance zone.
GBP/USD Technical Analysis
The British Pound started a fresh decline below the 1.3450 level against the US Dollar. GBP/USD declined below 1.3250 before the bulls appeared.
Looking at the 4-hour chart, the pair tested the 1.3140 level. It settled below the 100 simple moving average (red, 4-hour) and the 200 simple moving average (green, 4-hour).
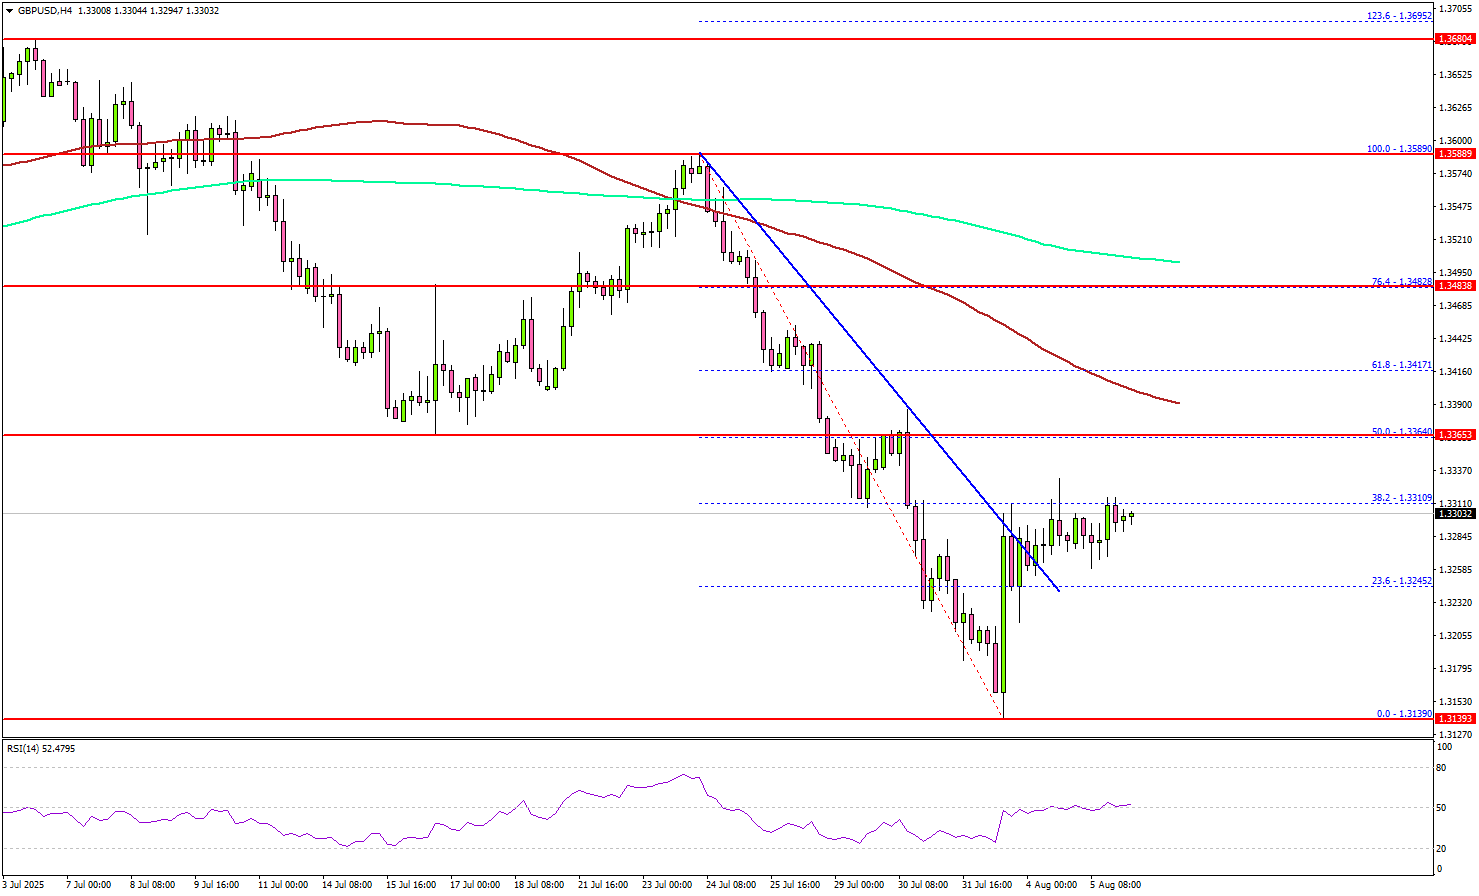
A low was formed at 1.3139 and the pair is now attempting to recover. There was a move above the 1.3250 resistance zone. The pair cleared a connecting bearish trend line with resistance at 1.3280.
Moreover, there was a move above the 23.6% Fib retracement level of the downward move from the 1.3589 swing high to the 1.3139 low. On the upside, the pair now faces resistance near the 1.3320 level. The next key resistance sits near the 1.3400 level and the 100 simple moving average (red, 4-hour).
A close above the 1.3400 level could set the pace for another increase. In the stated case, the pair could rise toward the 1.3480 resistance or the 76.4% Fib retracement level of the downward move from the 1.3589 swing high to the 1.3139 low. The next major stop for the bulls could be near the 1.3550 resistance.
On the downside, immediate support is near the 1.3250 level. The next key support sits near 1.3220. Any more losses could send the pair toward the 1.3150 support zone.
Looking at EUR/USD, the pair started a recovery wave, but the bears might remain active near the 1.1620 resistance zone.
Upcoming Economic Events:
- Fed's Collins speech.
- Fed's Cook speech.
Japan real wages remain negative despite stronger 2.5% nominal growth
Japan’s real wages continued to contract in June, falling -1.3% yoy — the sixth straight month of decline. While that marked an improvement from May’s revised -2.6% yoy drop, persistent inflation, particularly in food prices, continues to erode household purchasing power. Consumer prices used for wage calculations rose 3.8% yoy in June, far outpacing nominal wage gains.
Nominal wages climbed 2.5% yoy, up from 1.4% yoy in May and rising for the 42nd consecutive month. However, the reading missed expectations of 3.2% yoy, tempering the positive headline. Base pay rose 2.1% yoy, and special earnings — mainly bonuses — grew 3.0% yoy, supporting a modest rise in overall pay levels during the reporting month.
First Impressions: NZ labour market statistics, June quarter 2025
The unemployment rate rose to 5.2% in the June quarter. This was a smaller increase than we expected, but was in line with the RBNZ’s thinking.
- Unemployment rate: 5.2% (prev: 5.1%, Westpac f/c: 5.3%, RBNZ f/c 5.2%)
- Employment change: -0.1% (prev: 0.0%, Westpac f/c: -0.3%, RBNZ f/c +0.2%)
- Labour costs (private sector): +0.6% (prev: +0.4%, Westpac f/c: +0.5%, RBNZ f/c +0.6%)
New Zealand’s labour market remained soft in the June quarter. The unemployment rate rose slightly from 5.1% to 5.2%, and the number of people employed fell by 0.1% (with the previous quarter’s 0.1% rise revised to a flat outcome). This was, however, less of a decline than we were expecting based on the 0.3% fall in jobs in the Monthly Employment Indicator.
While the results were a little better than our forecasts, the key details were in line with what the Reserve Bank assumed in its May Monetary Policy Statement. As such, today’s surveys are unlikely to sway the Monetary Policy Committee’s existing stance heading into its August policy review. We see a 25bp OCR cut as highly likely, leaving the door open for further easing if needed, but with no strong signal about the extent or timing of any future rate cuts.
The labour force participation rate continues to play an important role in moderating the extent of the rise in unemployment. Participation fell from 70.7% to 70.5%, its lowest level since March 2021, with a particularly large fall among teenagers. This group was brought into the workforce to an unusual degree during the 2022-23 boom, when demand was running hot and migrant workers weren’t available. As conditions have softened, teens have tended to see the largest drop in employment as well, with many of them returning to focus on study rather than classifying themselves as ‘unemployed’.
Turning to wages, the Labour Cost Index (LCI) rose by 0.6% for the private sector, following a 0.4% rise in the March quarter. This was a little higher than the 0.5% that we expected, but was in line with the RBNZ’s forecast. The sectoral breakdown suggests there may have been a little more impact from the minimum wage increase than we gave it credit for (considering that it was raised by only 1.5% this year).
On an annual basis, the private sector LCI slowed from 2.5% to 2.2%, the slowest pace since June 2021. The message was similar across a range of wage growth measures: the analytical unadjusted LCI (which includes pay increases that are related to higher productivity), the proportion of roles seeing a pay increase, and the median size of wage increases, were all back to 2021 levels.
The Quarterly Employment Survey (QES) was an exception, with average hourly earnings for the private sector accelerating from 3.8%yr to 4.6%yr. However, this measure is not adjusted for changes in the composition of jobs, and is typically much more variable than the LCI.