
Sample Category Title
EUR/USD Mid-Day Outlook
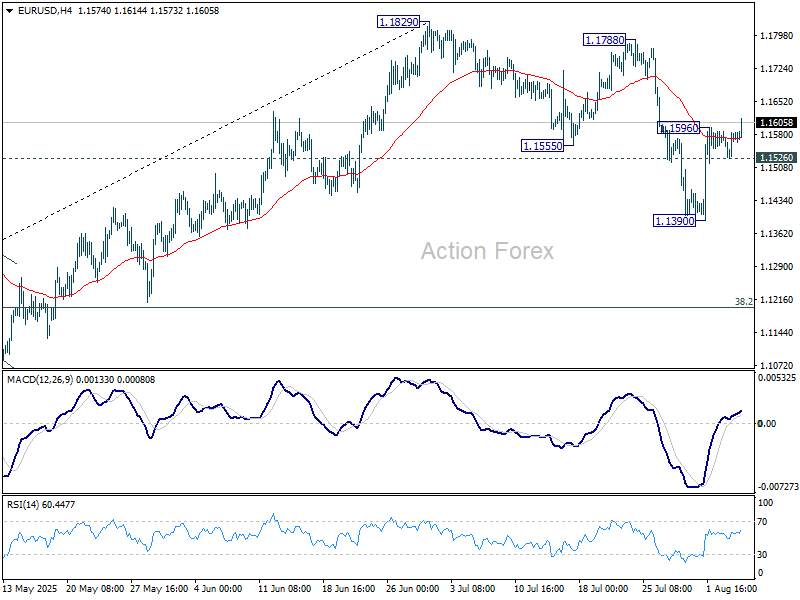
Daily Pivots: (S1) 1.1539; (P) 1.1564; (R1) 1.1599; More...
EUR/USD's rebound from 1.1390 resumed after brief consolidations and intraday bias is back on the upside. Current development affirms that case that fall from 1.1829 has completed as a three-wave correction. Further rally should be seen to retest 1.1788/1820 resistance zone. On the downside, however, break of 1.1526 minor support will dampen this view and bring retest of 1.1390 instead.
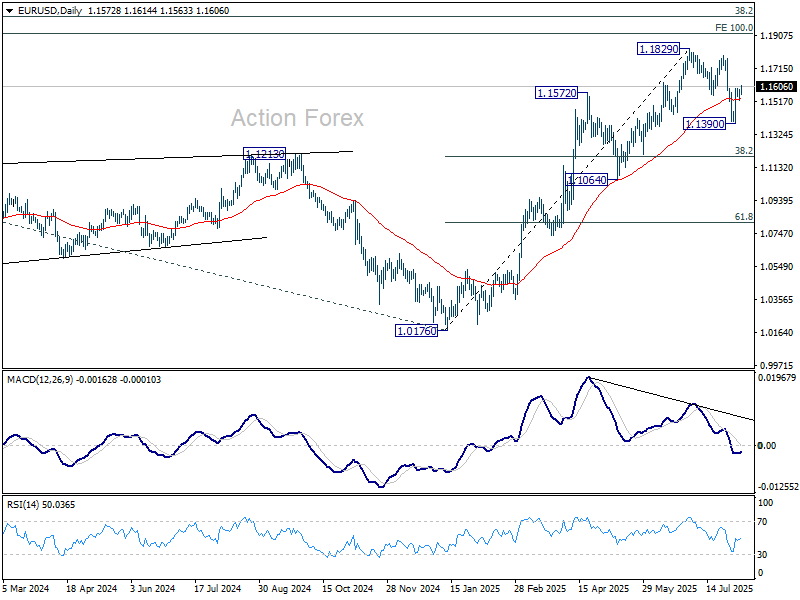
In the bigger picture, rise from 0.9534 long term bottom could be correcting the multi-decade downtrend or the start of a long term up trend. In either case, further rise should be seen to 100% projection of 0.9534 to 1.1274 from 1.0176 at 1.1916. This will remain the favored case as long as 1.1604 support holds.
Dollar Selling Returns on Light News Day, Fed Comments in Focus
Dollar is softening again across the board in a session marked by light news flow and no scheduled economic data from the US. With little fresh macro direction, traders are shifting their attention to upcoming comments from Fed officials, including Boston Fed President Susan Collins and Fed Governor Lisa Cook. Their views on the labor market will be closely parsed following last Friday’s disappointing nonfarm payrolls report.
Markets have increasingly priced in a September rate cut, with odds now near 87%. The focus will be on whether Collins and Cook signal comfort with further easing, particularly in light of slowing job growth. Any indication that the Fed is moving closer to action could reinforce the Dollar’s slide, especially in a low-volume environment.
Elsewhere in FX, Swiss Franc is among the weakest performers. Markets are increasingly resigned to the reality that Switzerland is unlikely to secure a last-minute reduction in the 39% US import tariffs set to take effect this week. Meanwhile, Meanwhile, Yen also remains weak, as traders show little appetite for safe-haven positioning without a clearer risk-off signal.
On the stronger side, Kiwi and Aussie are leading gains. The move may reflect a mild shift toward risk-on positioning, although that’s not yet clearly confirmed by global equity indices. Euro is also firming, with EUR/CHF in particular showing signs of readiness for bullish breakout from its recent consolidation range. Sterling and the Canadian Dollar are trading more mixed in the middle.
In Europe, at the time of writing, FTSE is up 0.21%. DAX is down -0.03%. CAC is up 0.17%. UK 10-year yield is down -0.012 at 4.51. Germany 10-year yield is up 0.007 at 2.641. Earlier in Asia, Nikkei rose 0.60%. Hong Kong HSI rose 0.03%. China Shanghai SSE rose 0.45%. Singapore Strait Times rose 0.45%. Japan 10-year JGB yield rose 0.025 to 1.501.
Franc hit by tariff shock, CHF/JPY drops towards 180, but 178 should hold
Swiss Franc has come under heavy pressure since early August, with trade tensions driving much of the weakness. The US stunned markets last week by imposing a 39% tariff on Swiss imports, accusing Bern of failing to make “meaningful concessions” on trade. The duties, effective Thursday, will impact a broad swath of Swiss exports — including high-value goods like pharmaceuticals and luxury watches — which are heavily reliant on access to the US market.
Swiss officials have scrambled to Washington in a final attempt to prevent the tariffs from being implemented. President Keller-Sutter and Business Minister Parmelin arrived Tuesday, and a meeting with US Secretary of State Marco Rubio is scheduled for Wednesday. With no confirmed talks yet with US trade or commerce officials, hopes for a breakthrough might be fading, further weighing on the Franc.
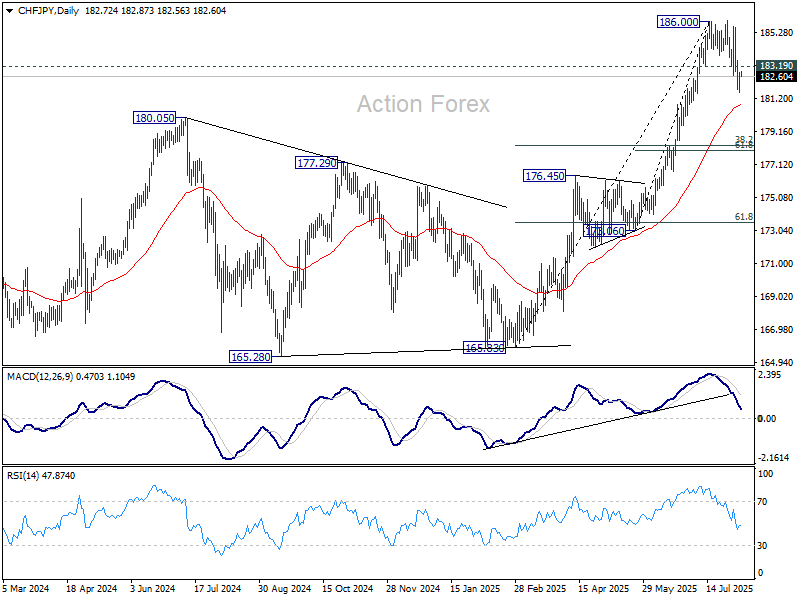
CHF/JPY is reflecting this pressure technically, with the pair confirming a short-term top at 186.60 after breaking support at 183.19. Near-term outlook favors a deeper correction to (now at 180.79) and possibly below.
But strong support should emerge around 178 support zone, (61.8% retracement of 173.06 to 186.00 at 178.00 and 38.2% retracement of 163.83 to 186.00 at 178.29) to contain downside. Large up trend is expected to resume through 186.00 at a later stage, if tensions with Washington ease in the coming weeks.
European data wrap: UK construction slumps, Eurozone data miss
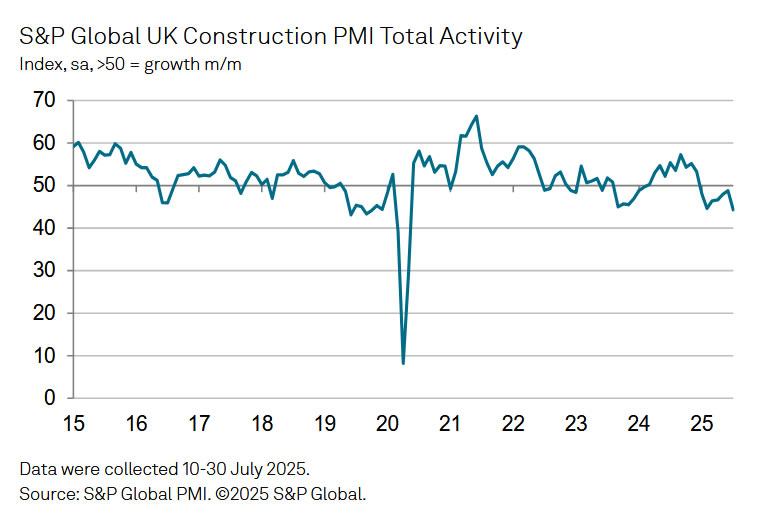
The UK construction sector saw a sharp deterioration in July, with the PMI plunging to 44.3 from 48.8 — its lowest level since May 2020 and far below the expected 49.2.
According to S&P Global, British firms cited a lack of tender opportunities and growing hesitancy from clients amid both domestic and international uncertainty. The data reinforces broader concerns about the UK’s economic momentum heading into the second half of the year.
In the Eurozone, June retail sales rose 0.3% mom, shy of the expected 0.4% mom. Modest gains were seen across food, non-food, and fuel categories. Adding to the downbeat tone, German factory orders unexpectedly declined by -1.0% mmm in June, missing forecasts for a 1.0% mom rise.
Japan real wages remain negative despite stronger 2.5% nominal growth
Japan’s real wages continued to contract in June, falling -1.3% yoy — the sixth straight month of decline. While that marked an improvement from May’s revised -2.6% yoy drop, persistent inflation, particularly in food prices, continues to erode household purchasing power. Consumer prices used for wage calculations rose 3.8% yoy in June, far outpacing nominal wage gains.
Nominal wages climbed 2.5% yoy, up from 1.4% yoy in May and rising for the 42nd consecutive month. However, the reading missed expectations of 3.2% yoy, tempering the positive headline. Base pay rose 2.1% yoy, and special earnings — mainly bonuses — grew 3.0% yoy, supporting a modest rise in overall pay levels during the reporting month.
NZ unemployment rate rises to 5.2%, RBNZ August cut in play
New Zealand’s Q2 labour market report confirmed continued softening, with employment falling -0.1% qoq and unemployment edging up to 5.2%. That marks the highest jobless rate since 2020, though still slightly below consensus of 5.3%. Participation rate also dropped -0.2 points to 70.5%, its lowest since early 2021, suggesting a cooling in demand.
Wage growth offered a mixed signal to the RBNZ. The private sector wage index rose 0.6% qoq, higher than expected 0.5% qoq and up from Q1’s 0.4%. But annual wage inflation slowed from 2.5% to 2.2% — the lowest in over three years — hinting that longer-term wage pressures are easing.
The overall report doesn’t deviate much from RBNZ’s May projections and is unlikely to alter its near-term stance. With inflation running at 2.7% yoy in Q2, markets still expect one more 25bps rate cut from the current 3.25% this month. But the central bank is likely to stay cautious on signaling further easing until price and wage dynamics show more decisive downside momentum.
EUR/USD Mid-Day Outlook
Daily Pivots: (S1) 1.1539; (P) 1.1564; (R1) 1.1599; More...
EUR/USD's rebound from 1.1390 resumed after brief consolidations and intraday bias is back on the upside. Current development affirms that case that fall from 1.1829 has completed as a three-wave correction. Further rally should be seen to retest 1.1788/1820 resistance zone. On the downside, however, break of 1.1526 minor support will dampen this view and bring retest of 1.1390 instead.
In the bigger picture, rise from 0.9534 long term bottom could be correcting the multi-decade downtrend or the start of a long term up trend. In either case, further rise should be seen to 100% projection of 0.9534 to 1.1274 from 1.0176 at 1.1916. This will remain the favored case as long as 1.1604 support holds.
European data wrap: UK construction slumps, Eurozone data miss
The UK construction sector saw a sharp deterioration in July, with the PMI plunging to 44.3 from 48.8 — its lowest level since May 2020 and far below the expected 49.2.
According to S&P Global, British firms cited a lack of tender opportunities and growing hesitancy from clients amid both domestic and international uncertainty. The data reinforces broader concerns about the UK’s economic momentum heading into the second half of the year.
In the Eurozone, June retail sales rose 0.3% mom, shy of the expected 0.4% mom. Modest gains were seen across food, non-food, and fuel categories. Adding to the downbeat tone, German factory orders unexpectedly declined by -1.0% mmm in June, missing forecasts for a 1.0% mom rise.

New Zealand’s Unemployment Rate Rises to 4½ High, Kiwi Pushes Higher
The New Zealand dollar continues to have a quiet week. In the European session, NZD/USD is trading at 0.5923, up 0.37% on the day. The kiwi has been under pressure, falling 3.4% against the US dollar in July.
New Zealand's unemployment rises, job growth declines
New Zealand's employment report for Q2 was pretty much as expected, but the news wasn't good. The unemployment rate rose to 5.2% from 5.1% in Q1, below the consensus of 5.3%. This marked the highest unemployment rate since Q3 2020. Employment Change declined by 0.1%, down from a 0.1% gain in Q1 and matching the consensus. This was the third decline in four quarters.
The weak figures point to growing slack in the labor market as the economy continues to struggle. Global trade tensions remain high and New Zealand's export-reliant economy has taken a hit from softer global demand.
The Reserve Bank of New Zealand will be paying close attention to the weak job numbers, which support a rate cut in order to provide a boost to the economy. The RBNZ maintained rates in July after lowering rates at six consecutive meetings. The conditions for a rate cut at the Aug. 20 meeting seem ripe and the markets have priced in a quarter-point reduction at around 85%.
We'll get an updated look at the inflation picture on Thursday. Inflation Expectations rose to 2.3% in the second quarter, the highest in a year. This is the final tier-1 release prior to the August rate meeting.
Fed expected to cut in September
Three FOMC members will speak later today and investors will be hoping for some insights regarding the Federal Reserve's rate plans. The Fed hasn't lowered rates since December but is widely expected to hit the rate trigger at the September meeting.
NZD/USD Technical
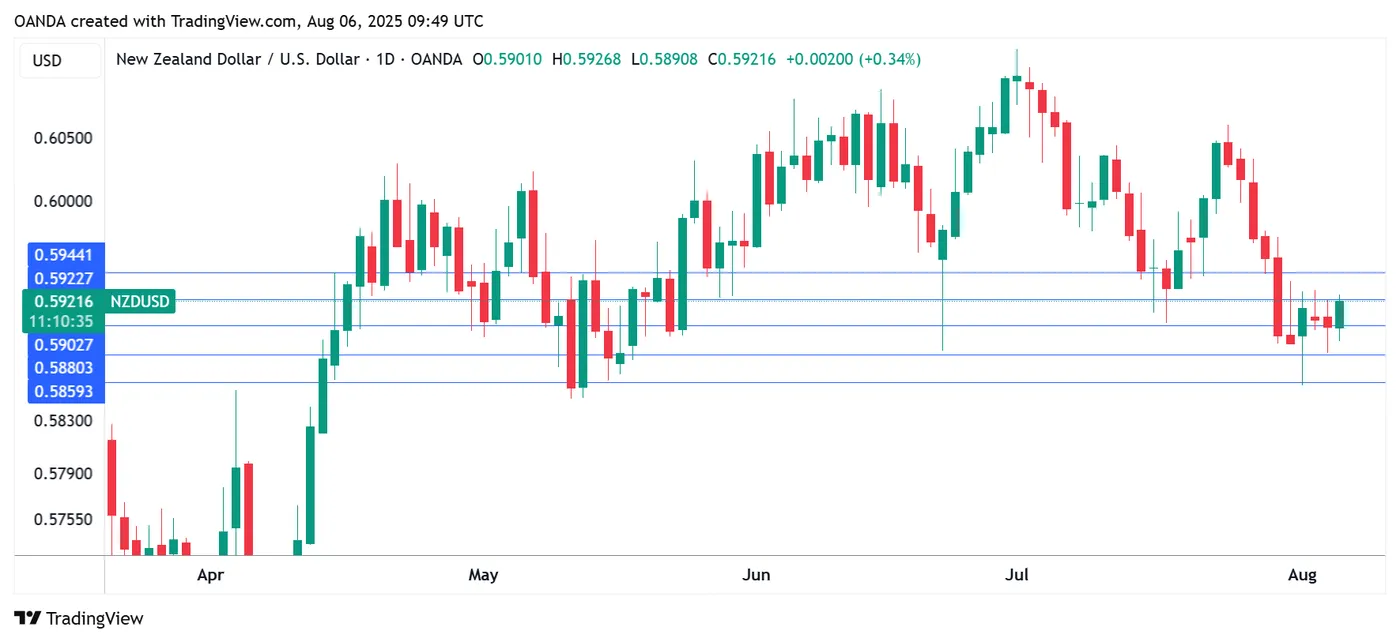
NZDUSD 1-Day Chart, Aug. 6, 2025
- NZD/USD has pushed above resistance at 0.5902 and testing 0.5922. Next, there is resistance at 0.5944
- 0.5880 and 0.5860 are providing support
GBP/USD: Recovery Shows Signs of Stall Ahead of BoE Rate Decision
Cable dipped during early European trading on Wednesday, deflated by weak UK data (July Construction PMI fell to the lowest since 2020), although the price holds within the range that extends into third consecutive day (long-legged Doji candles point to strong near-term indecision).
Overall technical picture remains negative (daily MA’s are in bearish setup with the latest formation of 10/100 and 30/55DMA bear-crosses / 14-d momentum remains in negative territory) and supports scenario of recovery stall before larger bears regain full control.
Recent range top (1.3330, reinforced by falling 10DMA) should keep the upside protected and guard barriers at 1.3348 (100DMA) and 1.3375 (broken Fibo 38.2% of 1.2708/1.3788.
Violation of temporary support at 1.3248 (cracked Fibo 50%) to expose targets at 1.3141 (Aug 1 three-month low) and 1.3120 (Fibo 61.8%).
Markets await BOE’s rate decision (due on Thursday), with the central bank expected to cut rates to 4.00% from 4.25% that would add more pressure on sterling.
Res: 1.3330; 1.3348; 1.3375; 1.3397.
Sup: 1.3248; 1.3185; 1.3141; 1.3120.
Natural Gas Prices Fall to Yearly Low
Analysing the chart on 22 July, we constructed a descending channel and assumed that natural gas prices would continue to form a bearish market structure of lower highs and lower lows. Since then, the market has declined by almost 10%.
As the XNG/USD chart shows today, natural gas prices are hovering around the psychological level of $3.000/MMBtu. Earlier this week, gas was trading around $2.940/MMBtu — the lowest level of 2025.
According to media reports, the price decline is driven by both high production levels and favourable weather forecasts for August, the hottest month of the year. What might happen next?
Technical Analysis of the XNG/USD Chart
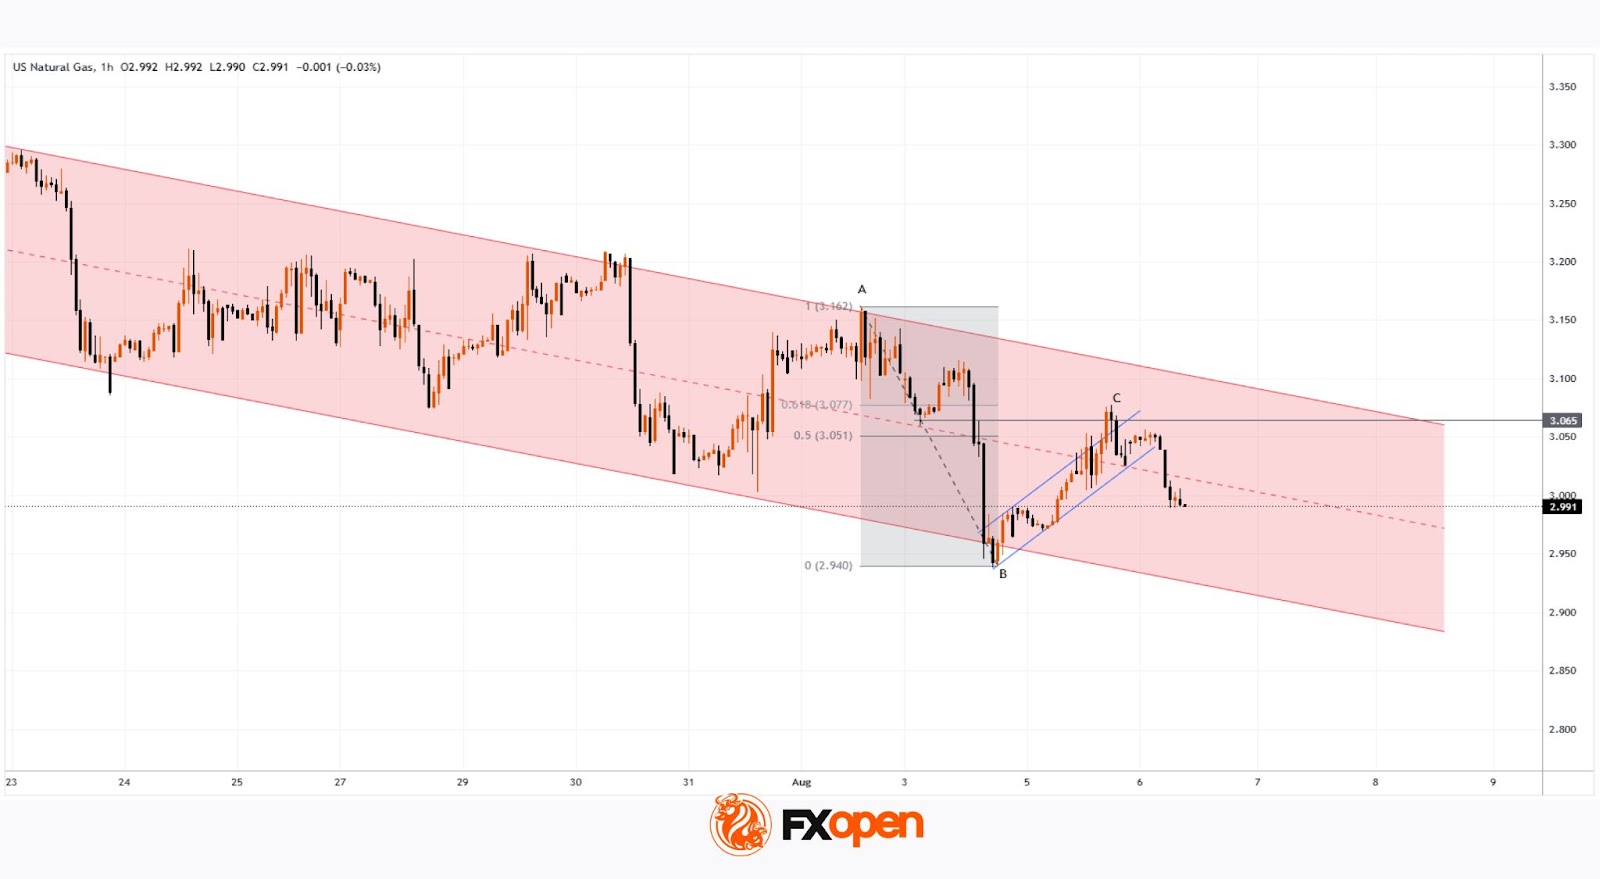
We have updated the descending channel, taking into account the recent fluctuations in natural gas prices.
The chart shows that bearish momentum remains intact — the rise from point B to C appears to be a corrective rebound within the prevailing downward trend, with the following developments:
→ point C formed in the 0.5–0.618 area, which corresponds to classic Fibonacci retracement levels following the A→B impulse;
→ the former support at 0.365 has now become resistance.
Bulls may hope that the current sentiment could shift following tomorrow’s natural gas storage report (scheduled for 17:30 GMT+3). A drop in inventories could potentially trigger a bullish impulse on the XNG/USD chart.
Start trading commodity CFDs with tight spreads. Open your trading account now or learn more about trading commodity CFDs with FXOpen.
This article represents the opinion of the Companies operating under the FXOpen brand only. It is not to be construed as an offer, solicitation, or recommendation with respect to products and services provided by the Companies operating under the FXOpen brand, nor is it to be considered financial advice.
Gold Holds Near Two-Week High
On Wednesday, the price of gold dipped to 3,375 USD per troy ounce but remained close to a two-week high, retaining most of its recent gains.
The market remains buoyed by demand for defensive assets amid expectations of a more dovish Federal Reserve policy.
The previous day saw the release of US ISM data, which showed the services sector business activity index for July falling to 50.1 points – below forecasts. The figures indicated sluggish growth, slowing employment, and mounting price pressures. Earlier data also pointed to a weakening labour market and declining consumer spending.
These developments have bolstered expectations that the Fed may cut interest rates as early as September, with markets now pricing in a 90% probability of such a move.
Further support for gold comes from new trade tariffs announced by US President Donald Trump, alongside investor concerns over the Federal Reserve's independence following the resignation of Board of Governors member Lisa Kugler. Her departure paves the way for Trump to appoint a more accommodative successor.
Technical Analysis: XAU/USD
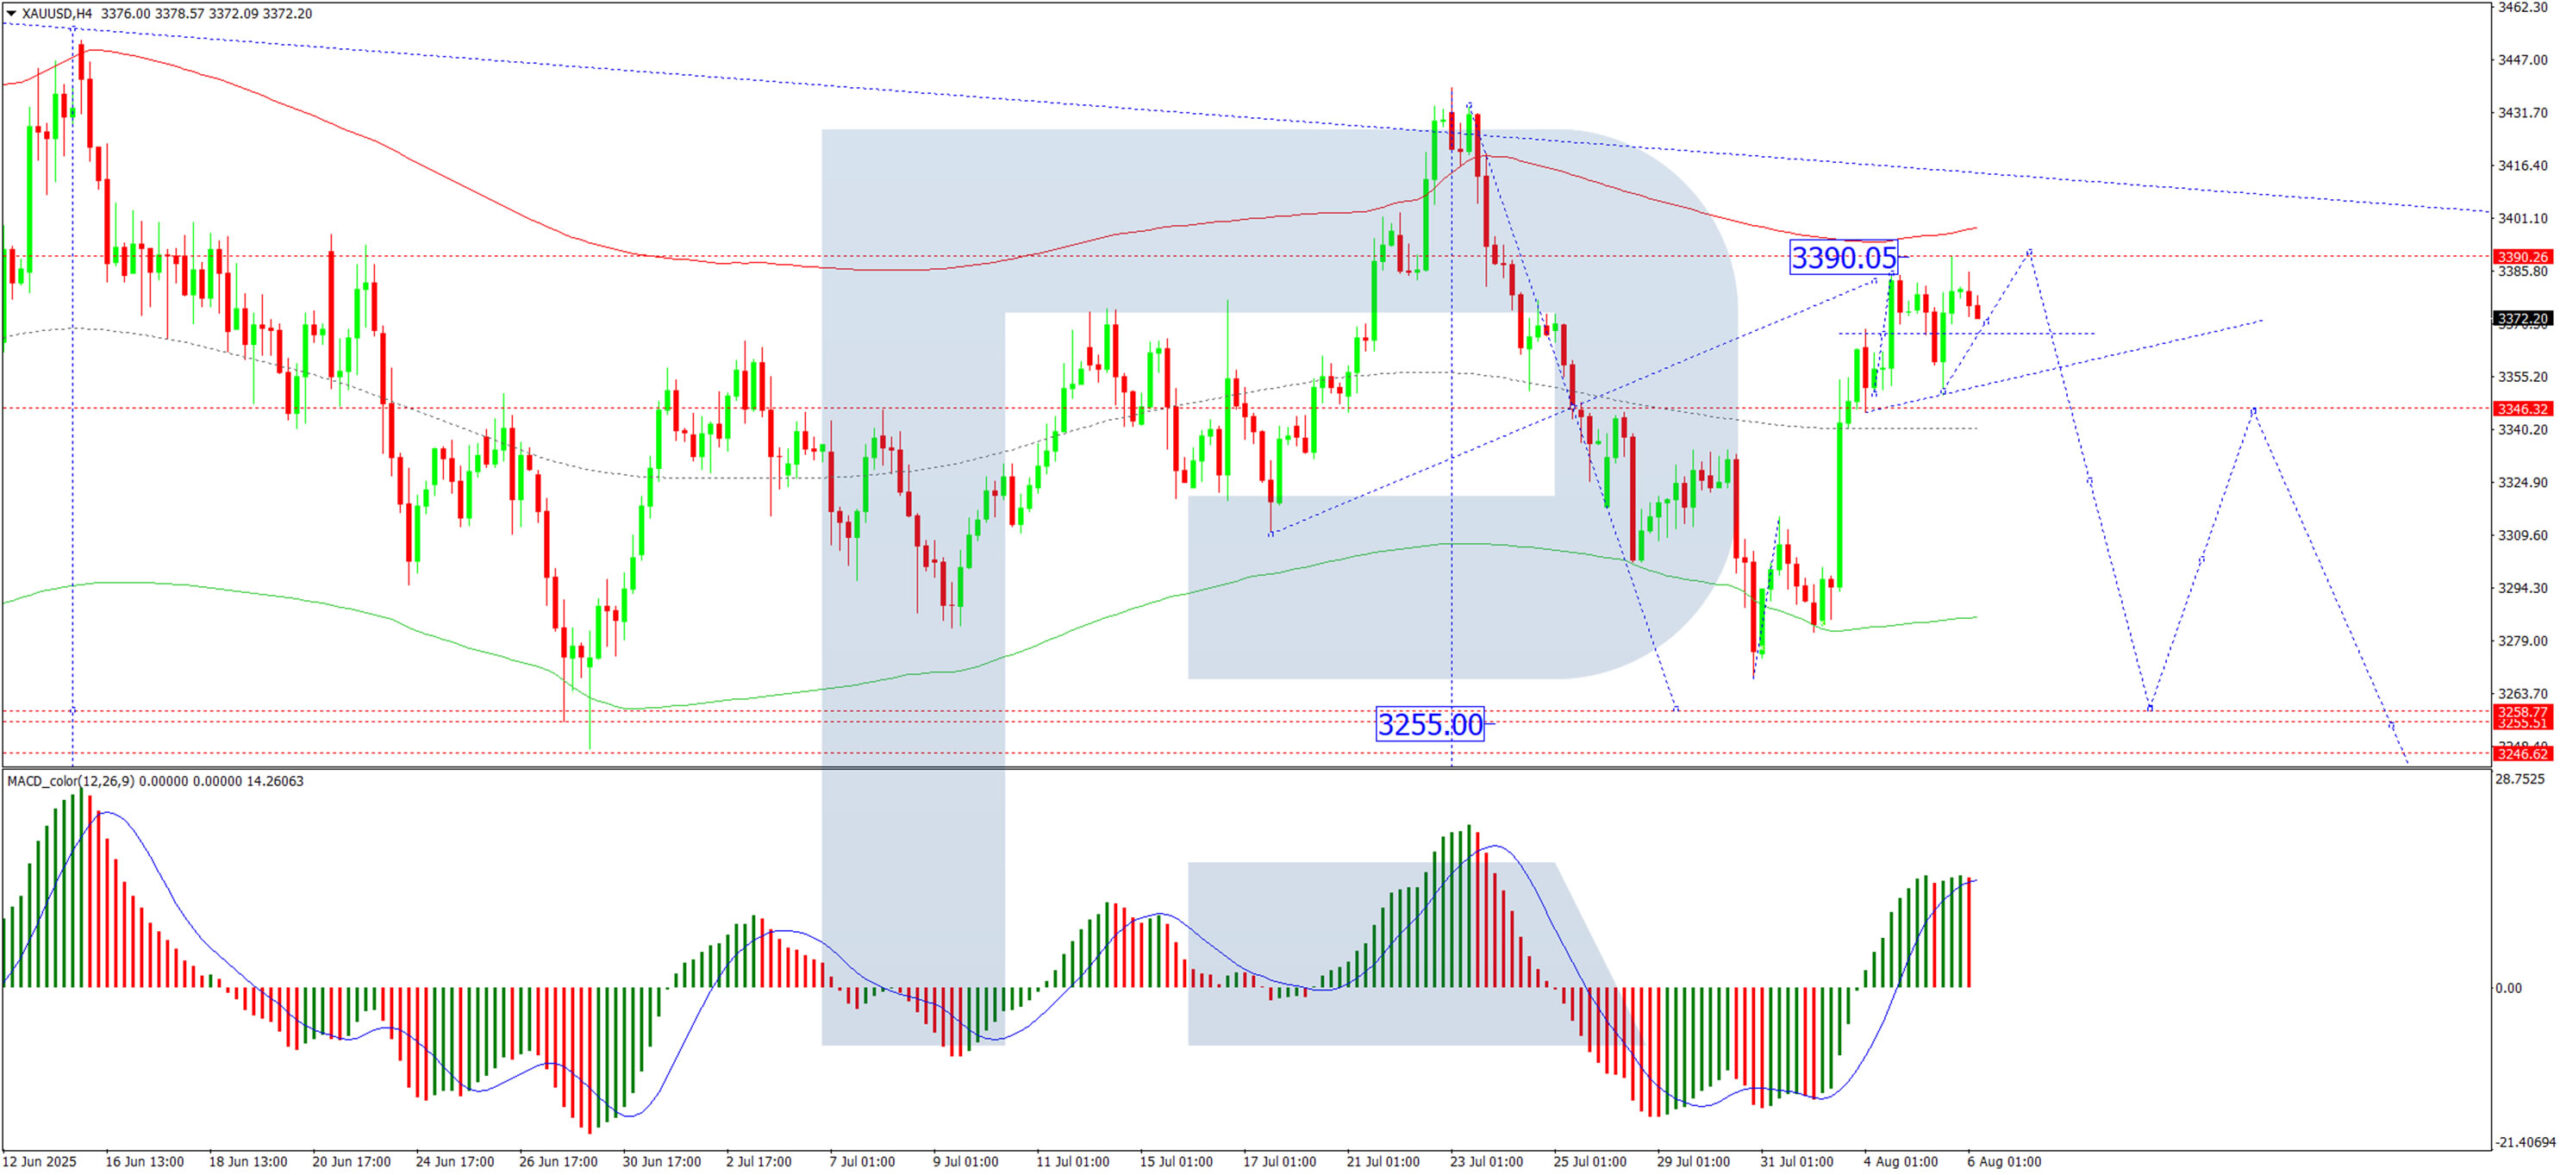
H4 Chart:
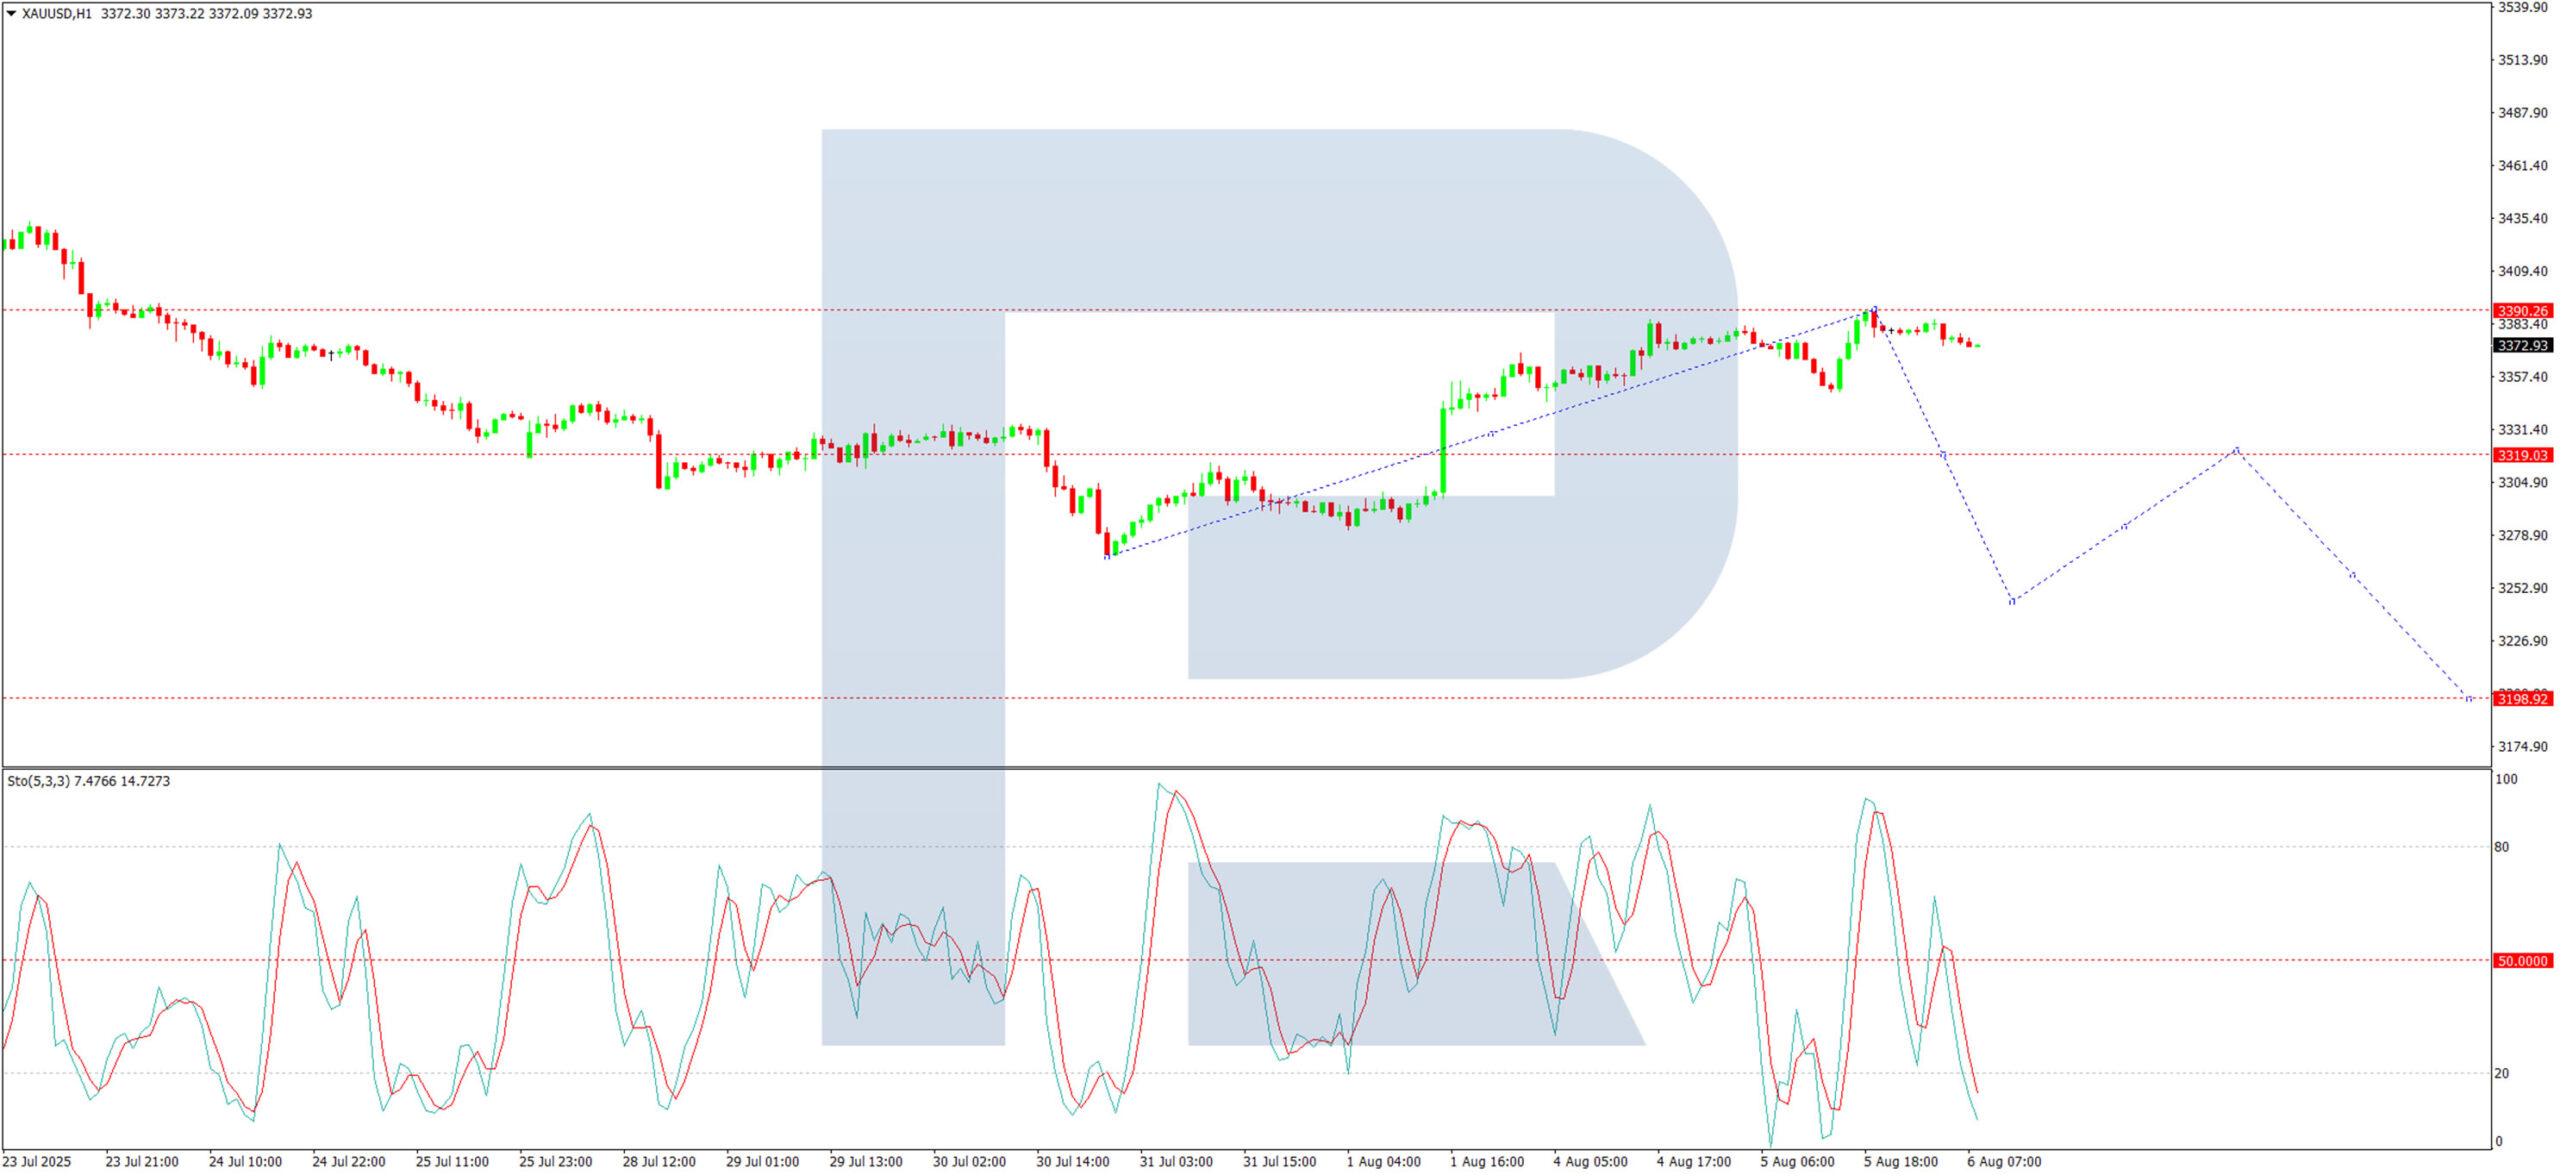
The XAU/USD pair is forming a broad consolidation range around 3,346 USD on the H4 chart. The market has corrected to 3,390 USD. Today, we assess the likelihood of a new downward wave developing towards 3,333 USD. A break below this level could extend the decline to a minimum of 3,255 USD. This scenario is technically supported by the MACD indicator, where the signal line remains above zero near recent highs but shows signs of an impending downturn.
H1 Chart:
On the H1 chart, the market has completed a corrective structure to 3,390 USD. A consolidation range is now forming below this level, with a downward breakout likely to extend the decline towards 3,320 USD. A breach of this support could signal further downside momentum, potentially targeting 3,200 USD. The Stochastic oscillator corroborates this outlook, with its signal line below 50 and trending sharply downward towards 20.
Conclusion
Gold remains resilient near recent highs, supported by macroeconomic uncertainties and shifting Federal Reserve expectations. However, technical indicators suggest potential near-term downside, with key support levels at 3,333 USD (H4) and 3,320 USD (H1) in focus.
GBP/USD Rebounds Cautiously, EUR/GBP Loses Momentum
GBP/USD is attempting a recovery wave above the 1.3215 resistance. EUR/GBP is consolidating and might aim for a fresh increase above 0.8700.
Important Takeaways for GBP/USD and EUR/GBP Analysis Today
- The British Pound is attempting a fresh increase above 1.3265.
- There is a contracting triangle forming with resistance at 1.3375 on the hourly chart of GBP/USD at FXOpen.
- EUR/GBP is trading in a positive zone above the 0.8665 pivot level.
- There is a short-term declining channel forming with resistance near 0.8705 on the hourly chart at FXOpen.
GBP/USD Technical Analysis
On the hourly chart of GBP/USD at FXOpen, the pair declined after it failed to clear the 1.3600 resistance. As mentioned in the previous analysis, the British Pound even traded below the 1.3350 support against the US Dollar.
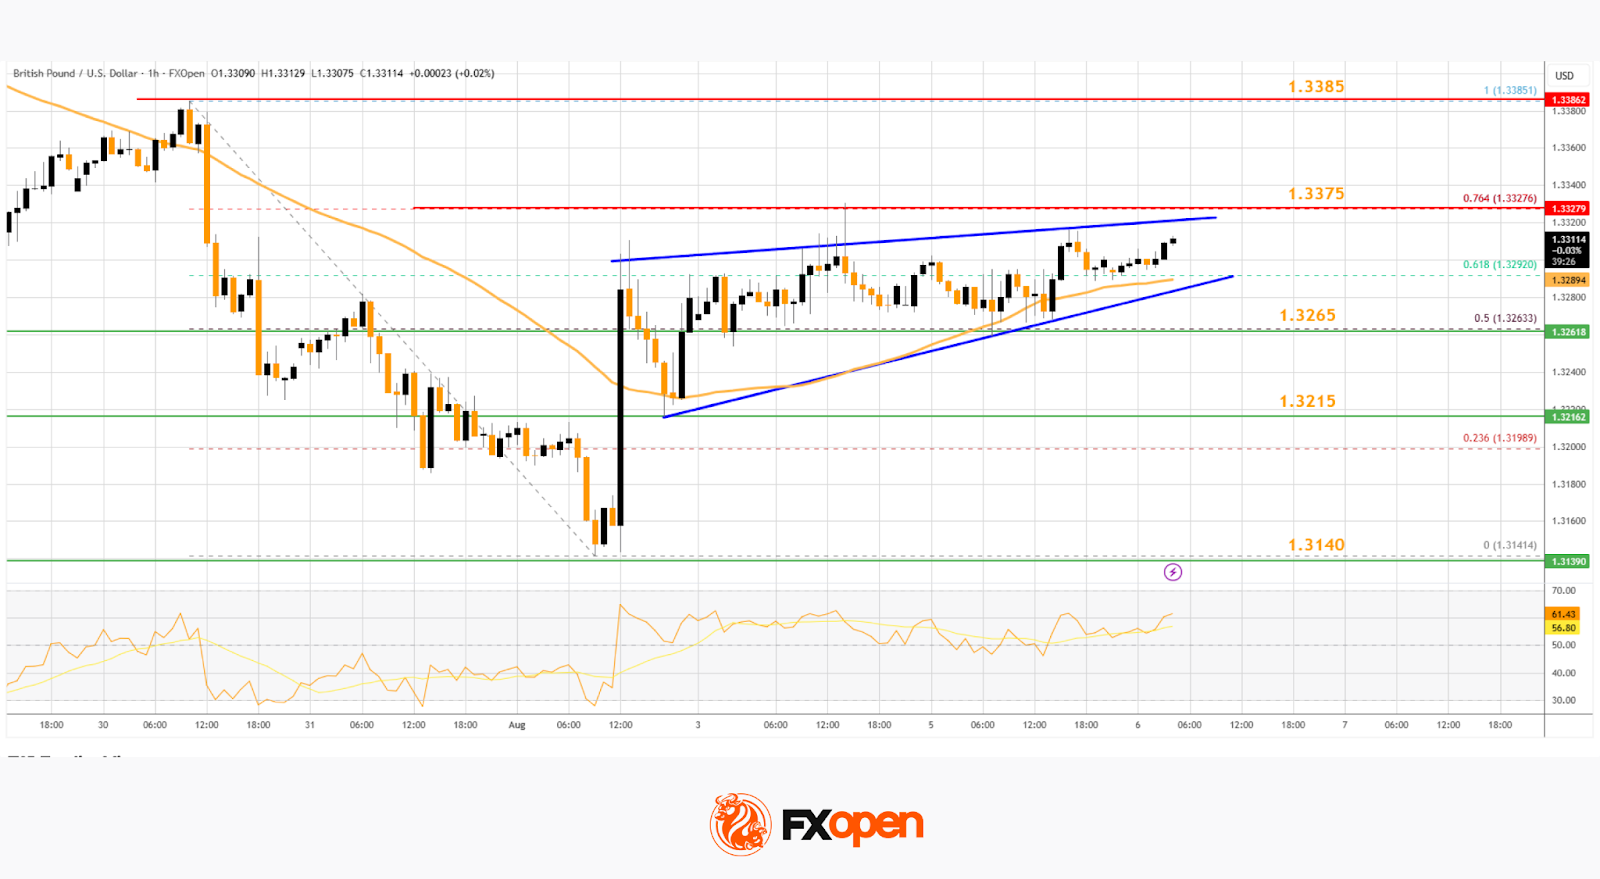
Finally, the pair tested the 1.3140 zone and is currently attempting a fresh increase. The bulls were able to push the pair above the 50-hour simple moving average and 1.3215. The pair even climbed above the 1.3265 level.
The bulls were able to push the pair above the 50% Fib retracement level of the downward move from the 1.3385 swing high to the 1.3141 low.
On the upside, the GBP/USD chart indicates that the pair is facing resistance near 1.3375. There is also a contracting triangle forming with resistance at 1.3375 and the 76.4% Fib retracement level of the downward move from the 1.3385 swing high to the 1.3141 low.
The next major resistance is near 1.3385. A close above the 1.3385 resistance zone could open the doors for a move toward 1.3450. Any more gains might send GBP/USD toward 1.3550.
On the downside, there is decent support forming at 1.3265. If there is a downside break below 1.3265, the pair could accelerate lower. The first major support is near the 1.3215 level. The next key support is seen near 1.3140, below which the pair could test 1.3050. Any more losses could lead the pair toward 1.3000.
EUR/GBP Technical Analysis
On the hourly chart of EUR/GBP at FXOpen, the pair started a consolidation phase after it failed to surpass 0.8730. The Euro traded below the 0.8710 and 0.8700 support levels against the British Pound.
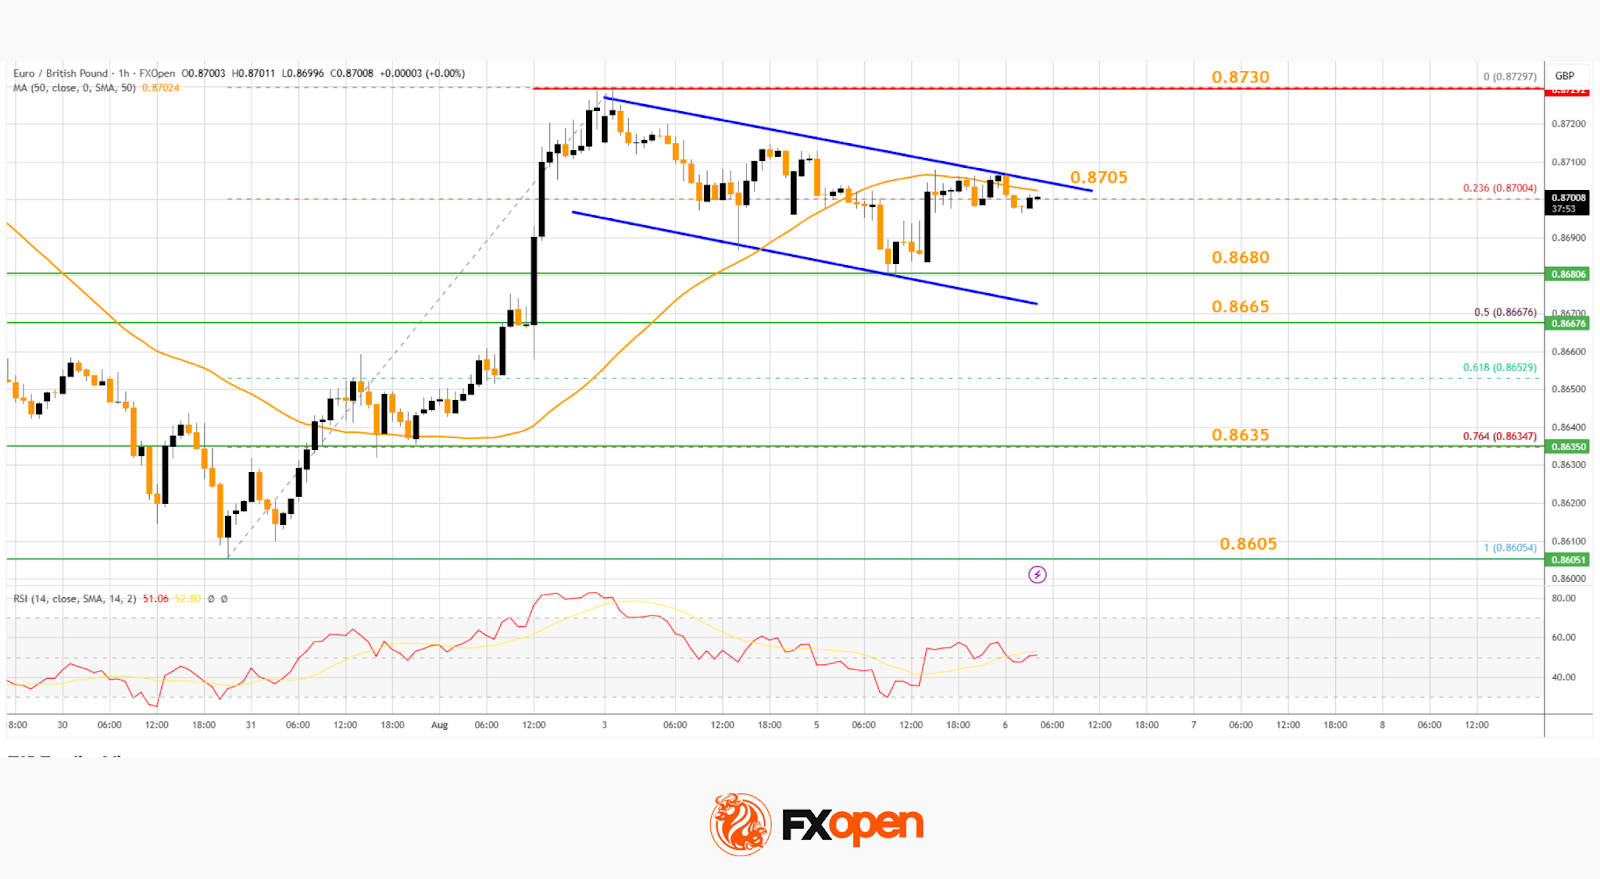
The EUR/GBP chart suggests that the pair even declined below the 23.6% Fib retracement level of the upward move from the 0.8605 swing low to the 0.8729 high. It is now consolidating losses and trading below the 50-hour simple moving average.
The pair is now facing resistance near the 0.8705 level. There is also a short-term declining channel forming with resistance near 0.8705.
The next major resistance could be 0.8730. The main resistance is near the 0.8750 zone. A close above the 0.8750 level might accelerate gains. In the stated case, the bulls may perhaps aim for a test of 0.8780. Any more gains might send the pair toward the 0.8800 level.
Immediate support sits near 0.8680. The next major support is near 0.8665 or the 50% Fib retracement level of the upward move from the 0.8605 swing low to the 0.8729 high.
A downside break below 0.8665 might call for more downsides. In the stated case, the pair could drop toward 0.8635.
Trade over 50 forex markets 24 hours a day with FXOpen. Take advantage of low commissions, deep liquidity, and spreads from 0.0 pips. Open your FXOpen account now or learn more about trading forex with FXOpen.
This article represents the opinion of the Companies operating under the FXOpen brand only. It is not to be construed as an offer, solicitation, or recommendation with respect to products and services provided by the Companies operating under the FXOpen brand, nor is it to be considered financial advice.
EUR/USD Technical: Poised for a Minor Bullish Breakout in Euro Strength
The euro has staged a remarkable bullish reversal against the US dollar last Friday, 1 August, ex-post weaker-than-expected US non-farm payrolls data release.
The EUR/USD jumped by 1.5% which put a halt to the prior week-long corrective decline from the 24 July 2025 swing high of 1.1789.
Since Monday, 4 August, the EUR/USD has drifted in a tight sideways range of 69 pips as market participants digest a slew of data and news flow in the past few sessions, rising stagflation risk due to a flat US ISM Services PMI print for July, while its Prices Paid sub-component jumped to a three-year high.
Also, US President Trump’s upcoming nomination for the replacement of the outgoing Fed Governor Kugler, who resigned last Friday that is likely to be made known by the end of this week.
Let’s decipher the short-term movements of the EUR/USD from a technical analysis perspective.
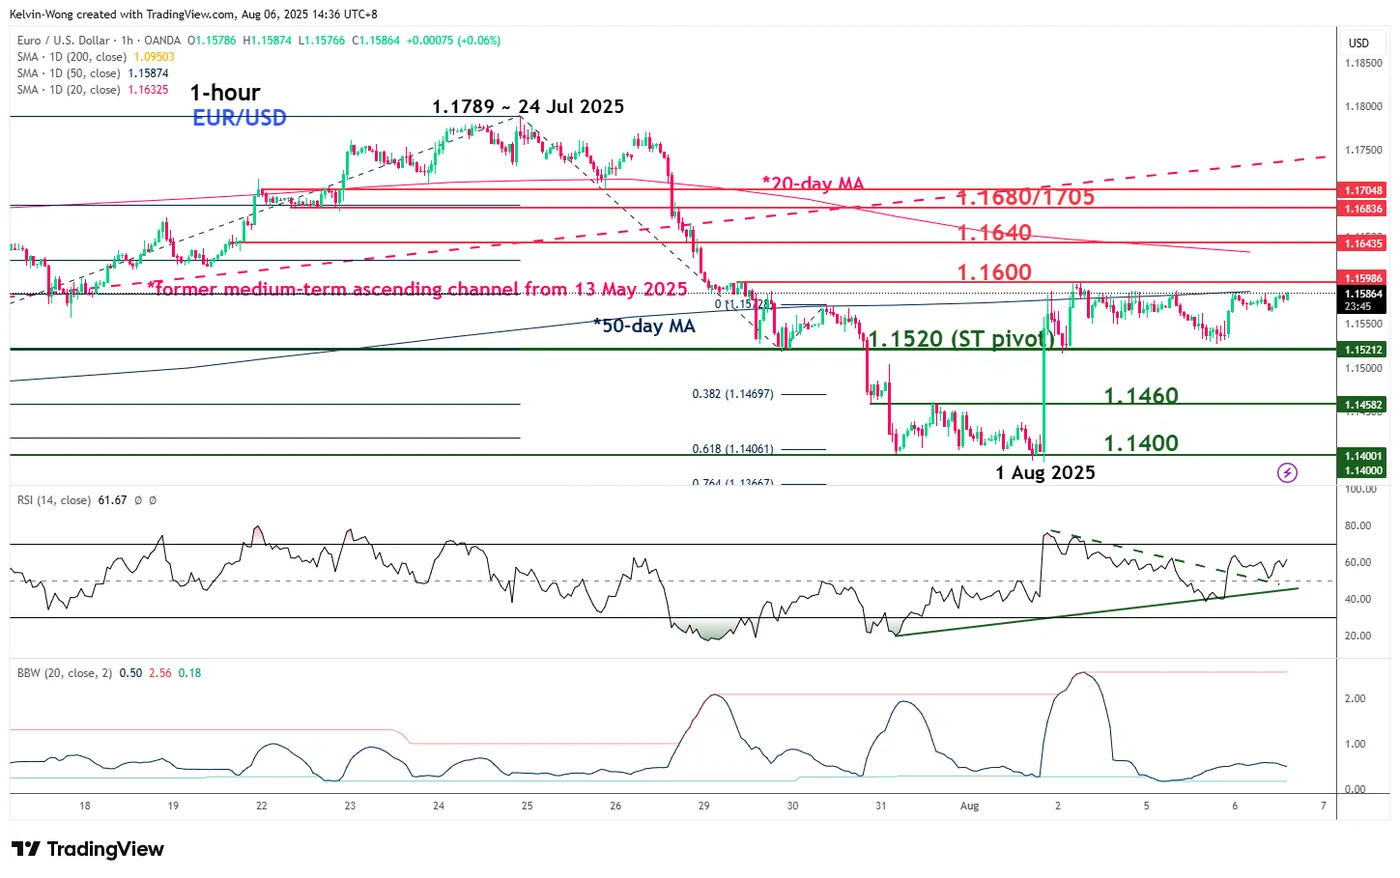
Fig. 1: EUR/USD minor trend as of 6 Aug 2025 (Source: TradingView)
Preferred trend bias (1-3 days)
A potential minor bullish breakout may occur at this juncture for the EUR/USD after three sessions of sideways consolidation.
Bullish bias with key short-term pivotal support at 1.1520 and a clearance above 1.1600 (also the 50-day moving average) sees the next intermediate resistances coming in at 1.1640, and 1.1680/1705 (see Fig. 1).
Key elements
- The hourly RSI momentum indicator has managed to stage a series of “higher lows” while remaining on support by a parallel ascending trendline in place since 31 July. These observations suggest a potential build-up of short-term bullish momentum.
- The hourly Bollinger Bandwidth has flashed out a “volatility squeeze” condition where it drifted to an extreme low contraction level of 0.2 on Tuesday, 5 August.
- A “volatility squeeze” condition precedes a potential price action breakout movement in the EUR/USD.
Alternative trend bias (1 to 3 days)
Failure to hold at 1.1520 invalidates the bullish scenario where the EUR/USD may see a minor slide to retest the next intermediate supports of 1.1460 and 1.1400 (1 August 2025 swing low).
Franc hit by tariff shock, CHF/JPY drops towards 180, but 178 should hold
Swiss Franc has come under heavy pressure since early August, with trade tensions driving much of the weakness. The US stunned markets last week by imposing a 39% tariff on Swiss imports, accusing Bern of failing to make “meaningful concessions” on trade. The duties, effective Thursday, will impact a broad swath of Swiss exports — including high-value goods like pharmaceuticals and luxury watches — which are heavily reliant on access to the US market.
Swiss officials have scrambled to Washington in a final attempt to prevent the tariffs from being implemented. President Keller-Sutter and Business Minister Parmelin arrived Tuesday, and a meeting with US Secretary of State Marco Rubio is scheduled for Wednesday. With no confirmed talks yet with US trade or commerce officials, hopes for a breakthrough might be fading, further weighing on the Franc.
CHF/JPY is reflecting this pressure technically, with the pair confirming a short-term top at 186.60 after breaking support at 183.19. Near-term outlook favors a deeper correction to (now at 180.79) and possibly below.
But strong support should emerge around 178 support zone, (61.8% retracement of 173.06 to 186.00 at 178.00 and 38.2% retracement of 163.83 to 186.00 at 178.29) to contain downside. Large up trend is expected to resume through 186.00 at a later stage, if tensions with Washington ease in the coming weeks.